1. Introduction
The very discovery of chemical or physical factors accompanying anthropogenic activity in the ecosystem does not give reason to recognize the negative role of this activity in the safety of the ecological situation.
As in the case of proof of the class of hazards of chemicals to the environment, the final assessment of the anthropogenic impact should be made according to the degree of its influence on biota [
1].
This is particularly relevant if pollutants are discharged into the medium in small concentrations or with low toxicity, not causing mass mortality. The problem of sublethal impacts has been quite acute in physiology and ecology for several decades. It is generally recognized that in a number of situations, such weak impacts may trigger destructive processes, while their biological significance may exceed the toxic action multiple times. Therefore, at one time, there was a transition in ecotoxicology from LC50 assessment to NOEC (no observed effect concentration), which has recently been replaced by LC5 or LC10 as more accurately defined.
Furthermore, unlike the principles of biotesting, which implies the use of single-test organisms grown under standardized conditions and aligned in sensitivity in natural conditions, it is necessary to cover as many target organisms as possible and draw conclusions based on their statistically significant ensembles.
There may be different levels of monitored responses: biocenotic (e.g., decrease in species diversity) with several weeks of response time; population (e.g., reduction in growth rate) with several days of response time; physiological (e.g., metabolic rate) with several hours of response time; and organizational (e.g., behavioral responses) with several minutes of response time [
2]. Each of these approaches focuses on a different time scale of events: from global climate change to seasonal and weather processes. Many studies showed that it is advisable to use autochthonous plankton as an object of observation. Autochthonous plankton is a mandatory participant in any aquatic ecosystem and the most massive link in trophic chains. It is the fastest-reacting bioindicator, which is always present in the aquatic ecosystem. The rapid response is caused by its nutrition, accompanied by the filtration of a large volume of habitat water. This is the trophic level that experiences change first, so monitoring the plankton ecosystem and diagnosing and establishing the causes of its changes can be of independent importance for the creation of early warning systems to prevent undesirable ecological situations [
3]. It is worth noting the importance of plankton autochthonicity, which involves its adaptation to the conditions of a particular reservoir or water area, moderate intensity of responses to natural changes in the physicochemical parameters of the environment, and a contrast strong response to artificial changes in these parameters.
Rhythmic processes are particularly interesting as informative indicators. The vital activity of organisms occurs in the environment, whose parameters change cyclically. Under these conditions, the internal rhythm of the organism (system) is subjected to corrective action by the external environment. There is the synchronization of internal and external rhythms ensuring the equilibrium between organisms and the environment [
4,
5]. Such interactions include circadian rhythms that modify the resistance and sensitivity of biosystems to harmful factors depending on the time of day [
6,
7,
8,
9,
10,
11,
12]. Pollution may lead to the desynchronization of rhythmic processes [
13], which creates the basis for a marker of the state disorder of the plankton community.
Behavioral responses, such as the speed and trajectory of swimming, frequency of swimming movements, etc., deserve special attention among the approaches that use the most dynamic indicators of the state of plankton communities [
14,
15]. Their disturbance connects the chemical influence with subsequent molecular, cellular, physiological, and behavioral changes that cause disease or injury to individuals [
16]. Moreover, even weak behavioral changes (e.g., changes in severity or even inversion of phototaxis) may lead to increased death due to inhibition of the risk-avoidance response of predatory fish attack in the daytime [
17]. The disturbance of the correlation between daily vertical migration and illumination conditions may change the likelihood of crustacean communities meeting predators of a higher food chain level and, thus, change the food balance in a given contaminated biotope [
18].
Many works were devoted to the study of phototaxis. It is especially evident in the diel vertical migration along the water column [
19]—the largest migration of biomass. On the one hand, the variability of diel vertical migration indicates the involvement of the nervous system in the phototropic response: there may be a change in normal migration (nocturnal ascent) to reverse migration (nocturnal descent) in environments where the influence of predators and other factors changes over time [
20]. On the other hand, under laboratory conditions, there are changes in phototactic responses when psychotropic substances are added [
21].
The correlation between daily vertical migration and light conditions in Daphnia crustaceans was found. Gehring et al. [
18] showed that daylight ultraviolet light inhibits the synthesis of cryptochrome, which is a critical protein of the molecular circadian system. Most likely, cryptochrome is involved in the response of crustaceans avoiding ultraviolet radiation in daylight during the day and returning to the surface at night [
22]. This molecular driver sets the rhythm for synchronizing physiological and behavioral processes [
23]. The circadian system of
Daphnia includes the gene/protein cryptochrome 2 (CRY2), which inhibits transcription mediated by the CLK/CYC heterodimer [
22]. The endogenous molecular driver of circadian rhythms is corrected by external stimuli, where the main one is the day–night alternation. A visual organ plays a key role in the regulation of circadian rhythm [
23]. Light is perceived by the neurons of the retina; the signal is transmitted to the suprachiasmatic nucleus of the hypothalamus, where the molecular circadian system functions.
The central nervous system perceives processes and transmits information on the external and internal environment of the organism. Therefore, the motor behavioral responses it controls are highly sensitive indicators of toxicity [
24].
The purpose of this study was to compare several approaches to detect the exogenous disturbance of the habitat according to the vital signs of autochthonous mesozooplankton.
2. Materials and Methods
2.1. Study Area
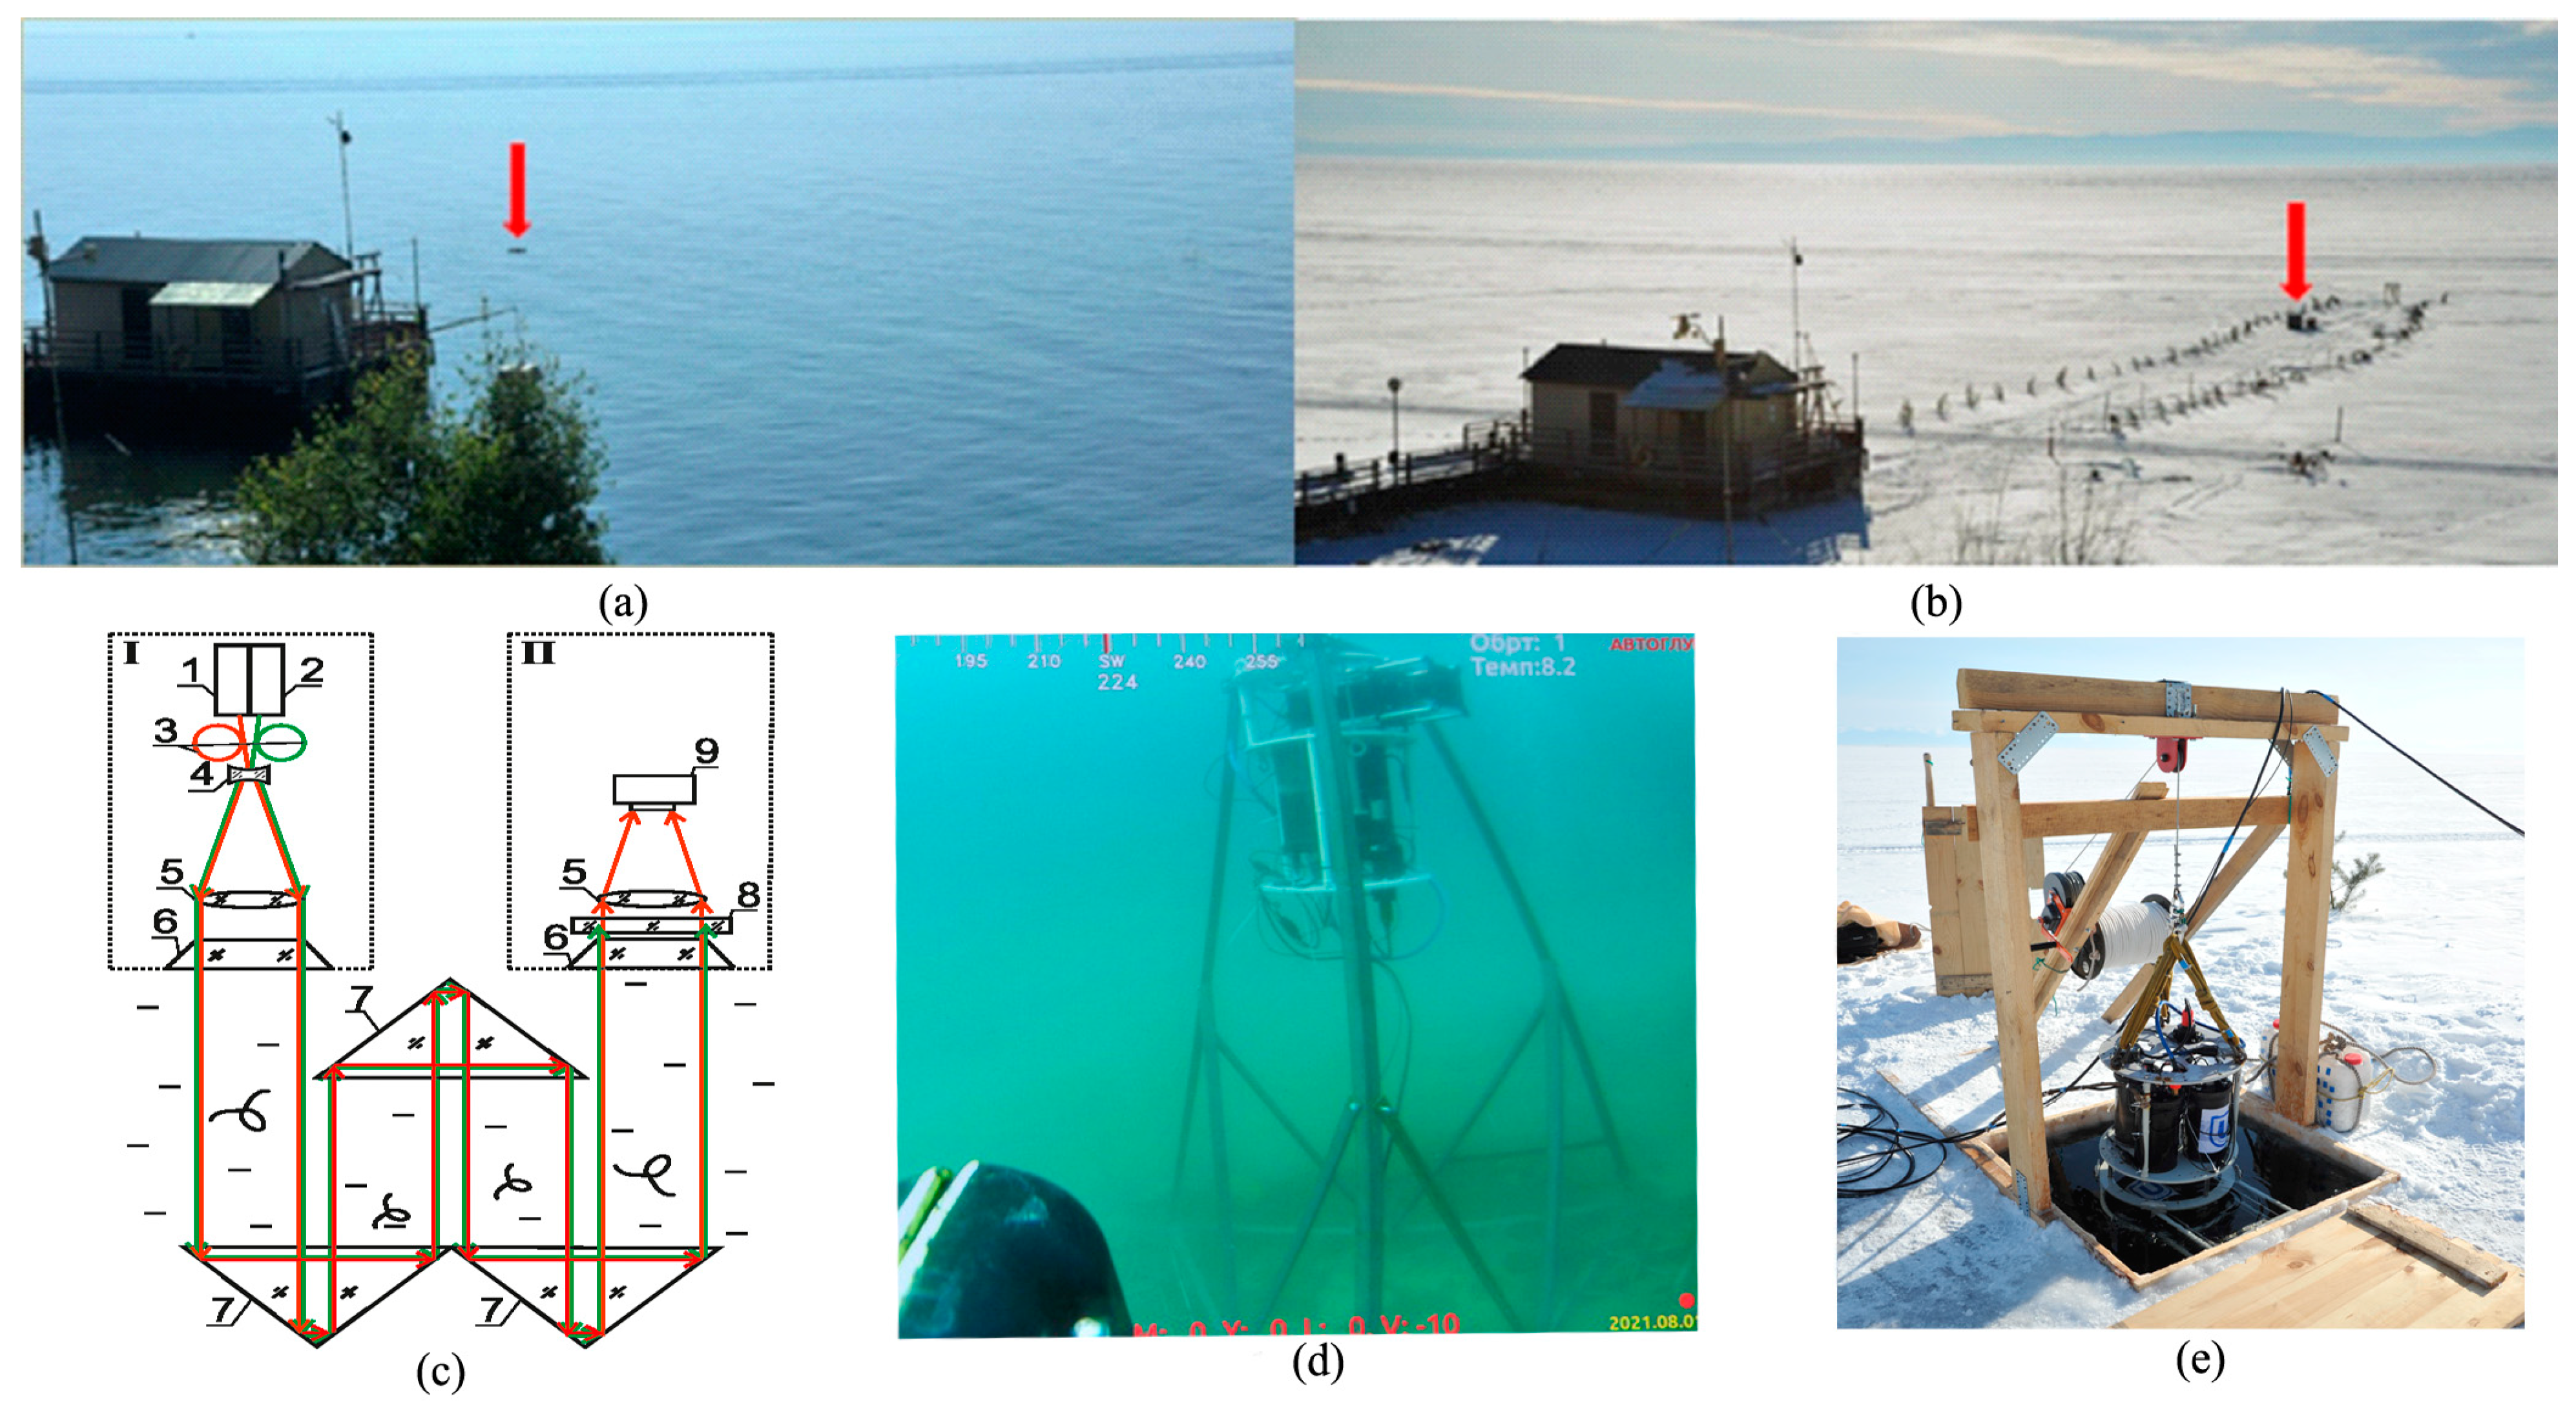
The studies of phototropic behavioral responses of mesozooplankton using a submersible digital holographic camera (DHC) were performed at Lake Baikal (Bolshie Koty settlement, Limnological Institute base) at the point with coordinates N 51°53′54.42″ E 105°03′53.46′. During the summer expedition on 3–28 August 2021 (
Figure 1a), a hydrobiological probe, which included the DHC and sensors of upper illumination, oxygen, conductivity, temperature, and pressure, was installed at the bottom station at an altitude of 2.5 m above the bottom (
Figure 1d) to reduce the impact of bottom currents. Due to changes in the water level caused by surges and tides, the average daily depth of the installation was 5 m.
During the winter expedition on 26 February 2022–24 March 2022 (
Figure 1b), we took the probe from the ice with the possibility of changing the depth of immersion (
Figure 1e). Due to the larger distance from the coast, the installation depth reached 50 m.
2.2. Digital Holographic Camera
The design of a submersible digital holographic camera (DHC) was earlier described in detail by us [
25,
26]. The DHC allows for recording a hologram of the entire working volume of the medium (volume illuminated by a laser beam,
Figure 1c) followed by numerical reconstruction of images of the medium cross-section layers at a predetermined pitch with further study of particles contained in the layers. The design of the used DHC probe implies the use of two lasers, with a wavelength of 532 nm for plankton photostimulation and 650 nm for hologram recording. The choice of the wavelength of attracting light for photostimulation is explained by the local maximum of the reflection spectrum of microalgae—the main power source of plankton. The maximum laser emission power at the output of the illuminating module window was 4 mW and was controlled by a change in the control voltage. This created a maximum illuminance of 4600 lux.
During the summer expedition, the working volume of the medium was 0.02 dm3, while during the winter expedition, it was 0.2 dm3.
2.3. Registration of Crustacean Concentration Profiles
During the winter expedition, the DHC using a winch evenly at a speed of 1 m/min, was placed at a depth of 45 m. The holograms were recorded continuously as 1 frame/s (an average of 60 frames per each meter of depth). The average number of crustaceans recorded every meter was calculated. The profile was further registered at 21:00, 23:00, 3:00, 5:00, 7:00, 9:00, 11:00, 13:00, 15:00, 19:00, and 20:00 local time.
A continuous vertical catching with a large Juday net with a mesh diameter of 88 μm was used for the integral evaluation of crustacean concentration in the test zone. The diameter of the net inlet was 35.7 cm (inlet area—0.1 m
2). During the summer expedition, the crustaceans were caught from a depth of 5 m in duplicate. During the winter expedition, the crustaceans were caught by net from a depth of 45 m the next day after registering the profiles at 19:00, 20:00, 22:00, 00:00, 02:00, 04:00, 06:00, 08:00, 10:00, 12:00, 14:00, 16:00, 18:00, and 20:00 local time. The catching data were processed according to the procedure described in Timoshkin et al. [
27].
2.4. Paired Photostimulation
The use of plankton behavioral response as an indicator of alternating influence is based on recording a change in phototaxis compared to the background. The main indicator of behavioral response was the concentration of crustaceans in the DHC working volume.
The paired photostimulation described in detail in Morgalev et al. [
28] and Dyomin et al. [
29] was used to reduce the impact of behavioral response variability in the background (inter-individual variation) and in case of insufficient photostimulation intensity that does not activate the systems that ensure the behavioral response. The first, smaller light impact activates the functional system [
30] responsible for the behavioral response, which reduces inter-individual dispersion and entropy in the system [
31]. The second, more intense impact, causes the crustaceans to move at a rate corresponding to their physiological state.
2.5. Registration Cycle Structure to Determine the Paired Phototropic Response Index (pPhR)
To determine the average number of crustaceans in the controlled volume, a set of holograms was recorded and formed as follows: a pair of holograms were recorded every 30 s over 5 min with an interval of 40 ms between them, which also made it possible to track the direction and speed of movement of certain crustaceans within the controlled volume. Ten pairs of holograms were recorded over 5 min. The maximum number of crustaceans in each pair was determined, and then, the values were averaged over 5 min.
Each cycle of determining the phototropic response index represented a sequential continuous registration of three 5 min sets: (1) without attracting light (I0); (2) at attracting light with illuminance I1 (1150 lx during longitudinal monitoring); (3) at the second photostimulation with higher illuminance I2 (3450 lx during long-term monitoring). Each cycle was followed by a 45-min pause without light to restore the natural concentration of crustaceans.
Based on the results of hologram processing of each of the three sets, the average concentration of crustaceans in the DHC working volume during the first and second stages of photostimulation (C1 and C2, respectively) was calculated, as well as the paired phototropic response index (pPhR), which we defined as the ratio of the increase in the concentration of crustaceans during the transition from the first to the second illuminance to the concentration of crustaceans during the second illuminance: pPhR = (C2 − C1)/C2 × 100%.
2.6. Modeling of Anthropogenic Impact
The unique features of Lake Baikal as a freshwater reserve do not allow for using toxicants to simulate anthropogenic impacts. Therefore, the table salt solution (NaCl) was used as an impact, temporarily disrupting the functional state of plankton. The solution was added from a perforated tank containing medium-ground table salt (grinding 2, granules up to 2.5 mm—no less than 90%, over 4 mm—no more than 5%) manufactured by BSK-sol (Belgrade, Russia). The tank was placed above the working volume of the DHC medium. Salt was dissolved directly in the tank due to the influx of water through the upper holes. Due to the increased density, the solution from the tank diffusely spread down to the working volume and the zone adjacent to it. According to the conductivity sensor, the conductivity of water in the impact zone before salt was added (50 h of recording) fluctuated in the range of ±0.45%. After the tank was installed, the conductivity changed by 6.8 ± 0.8% (p < 0.0001) during the influence (70 h of registration), and once the influence stopped, it was restored to its initial state after 2 h.
2.7. Study Design
In the first stage, the depth with the maximum concentration of the plankton was determined, and the camera was installed in this layer.
In the second stage, the optimal ratio of photostimulation intensity of the behavioral response of autochthonous crustaceans was defined to determine the pPhR index. To this end, the phototropic response index cycles with different photostimulation intensities (25, 50, 75, and 100% of the maximum possible for a given light source) were registered. In the range of illuminances used to determine the pPhR index, there should be no plateau or decrease in crustacean concentration when the illuminances increase.
In the third stage of the winter expedition, the optimal position of the camera was defined by recording the pPhR profile in depth. While the camera was placed at the depths of 5, 10, 20, 30, and 40 m, the descent was stopped to determine the phototropic response index.
The fourth stage of this study included long-term monitoring of crustacean concentration and pPhR (26 February–17 March 2022) at a constant DHC position at a depth of 20 m. The measurements were made once per hour.
In the fifth stage, the modeling of anthropogenic impact was carried out by adding a solution of table salt.
2.8. Statistical Data Analysis
Statistical processing was performed using Statistica 10 (StatSoft, Inc., Tulsa, OK, USA,
http://www.statsoft.com/, accessed on 25 May 2022). The Shapiro–Wilk W-test was utilized to evaluate the distribution of data regarding normality, and Bartlett’s test was used to verify the homogeneity of variance. In a normal distribution, the Student’s
t-test (two-sided
p level) was used to assess the differences. In case of deviation from the normal distribution, the Mann–Whitney U-Test was used.
Due to the fact that some indicators were registered at different times of the day, the calculation of the cross-correlation function using the Time Series/Forecasting from the Advanced Linear/Nonlinear Models menu was used to analyze the relationship instead of the correlation coefficient. The maximum modulo reliable value of the cross-correlation function in the interval of ±6 h was taken as a measure of the relationship of variables.
The Shannon species diversity index was calculated based on the histograms of crustacean sizes constructed from the DHC measurements. The histogram pockets included the following dimensions: <120 μm, 120–200 μm, and then, with a pitch of 80 μm. There were 21 classes in total. For each class, we calculated pi—the proportion of crustaceans falling into this dimension class. The normalized entropy (% of the maximum possible) was calculated by the following formula:
—normalized entropy; pi = Kj/K, Kj—number of individuals in the j histogram class; K—total number of registered individuals; j—number of histogram class; a total of histogram classes (in our case—21).
Without attracting light, only (H0) was calculated. For the paired photostimulation, we calculated and .
The spectral analysis was performed using Statistica 10, Statistics-Advanced Linear/Nonlinear Models/Time Series/Forecasting section, Spectral (Fourier) Analysis module.
The results were presented as Mean ± Standard error of the mean.
3. Results
3.1. Crustacean Concentration Profile
In the structure of mesozooplankton communities of Lake Baikal (according to the capture by the Juday net), up to 86.4 ± 1.0% was made up of various stages of development of the Epischura baikalensis crustaceans belonging to the Copepoda subclass. Therefore, the software filter of the DHC probe was set to register Copepoda crustaceans.
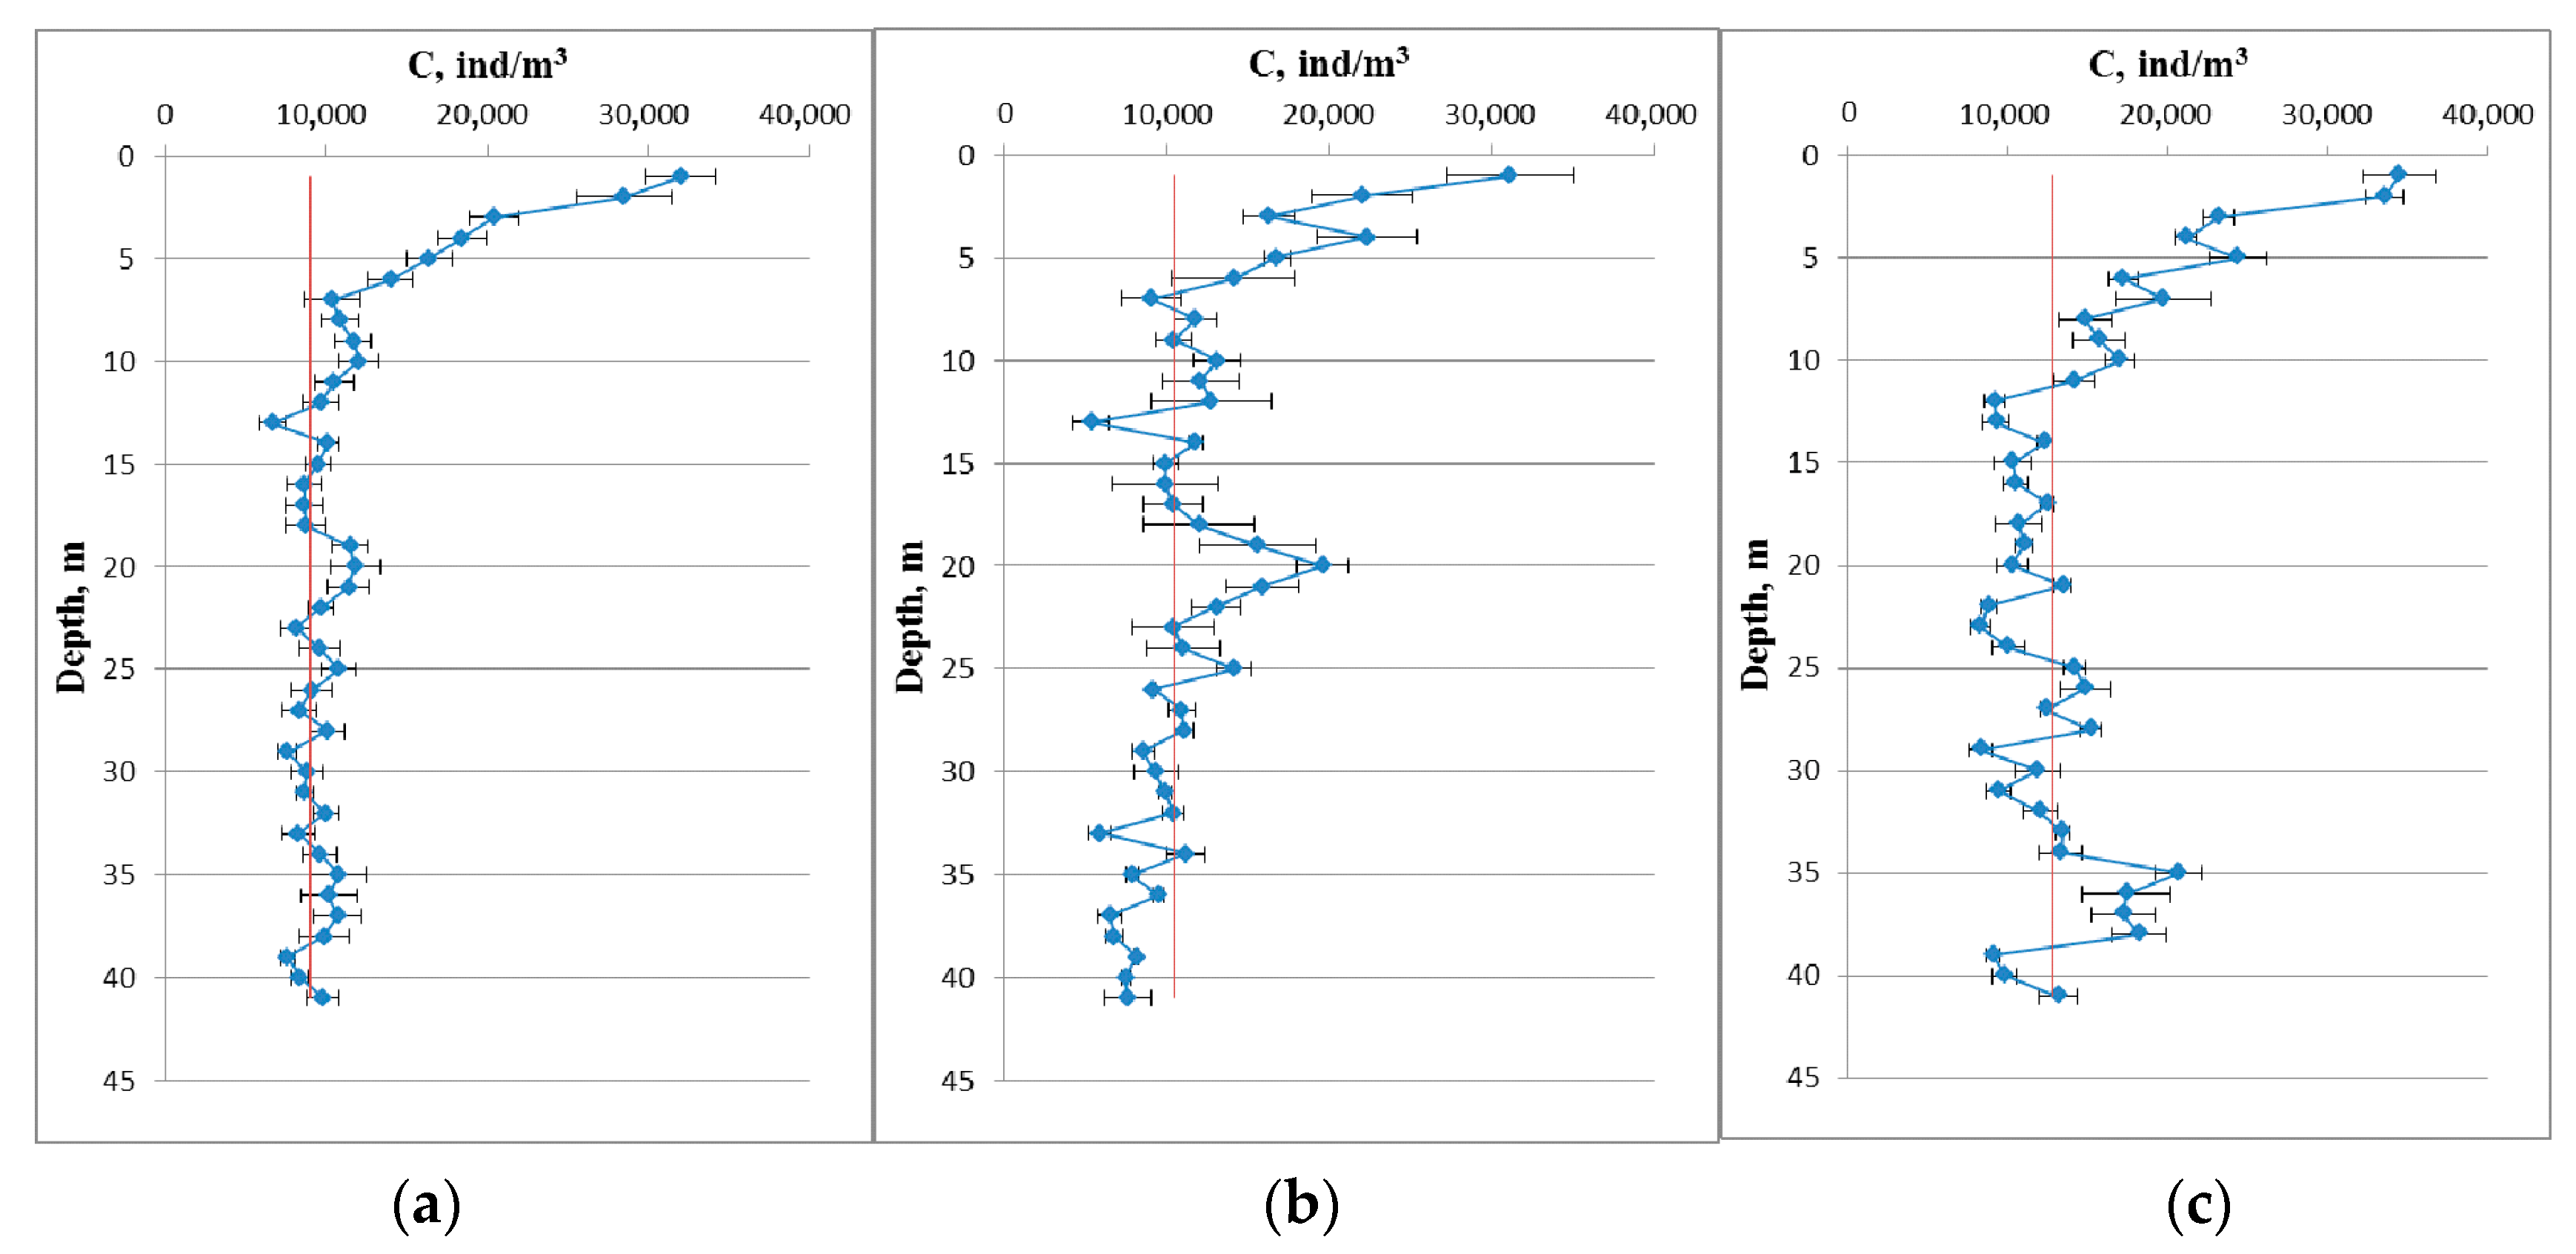
Figure 2 shows the average depth profile of crustacean concentrations recorded by the DHC probe.
The highest concentration of Copepoda was recorded near the surface at a depth of 1 ÷ 6 m. In this depth interval, the concentration decreased from 32,000 ± 2200 ind/m3 to 14,000 ± 1400 ind/m3, being reliably different from the average value (p < 0.001). With further increase in depth, the concentration of crustaceans fluctuated in the range of 9000 ± 250 ind/m3. At the same time, a weak but reliable local maximum was recorded at a depth of about 20 m and 35–37 m. More clearly, these maxima were recorded when the profiles were divided into “day” and “night” profiles.
In the average daily profile, a local maximum was more clearly seen at a depth of 20 m (19,600 ± 1500 ind/m3), which significantly differed from the average value of 10,500 ± 500 ind/m3 (p < 0.001). In the night profile, an increase in the concentration in the layer of 35–37 m was more pronounced (maximum 20,650 ± 1440 ind/m3, a reliable difference from the average value of 12,800 ± 520 ind/m3, p < 0.001).
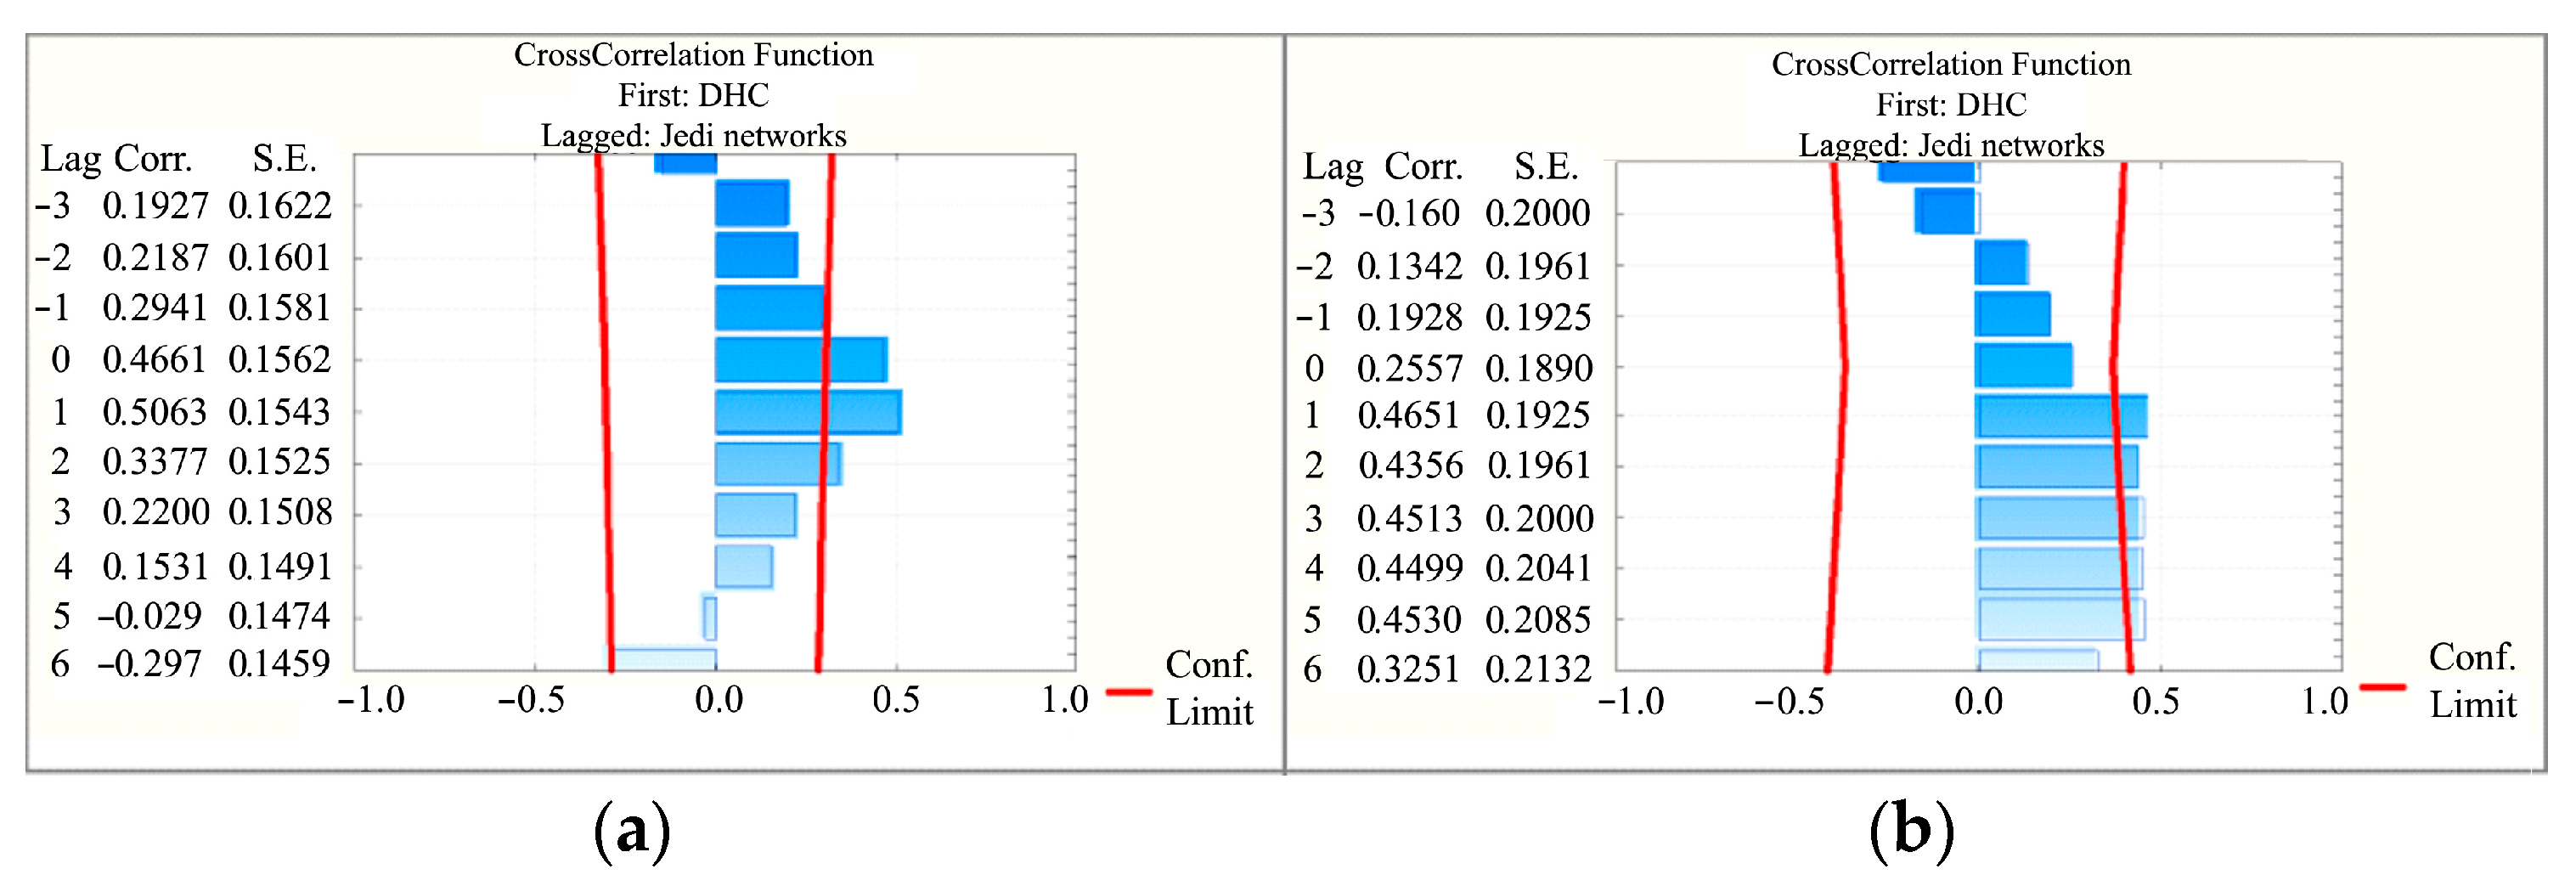
The comparison of the daily dynamics of the average concentration of crustaceans measured by the DHC probe and the Juday net was complicated due to the difference both in the registration periods and in the volume of the “sample” medium. However, the cross-correlation analysis made it possible to identify the relationship between these indicators. The maximum value of the correlation coefficient in summer was 0.47 ± 0.19,
p < 0.05 (
Figure 3a), and in winter—0.51 ± 0.15,
p < 0.05 (
Figure 3b). The shift of the function maximum by 1 h is associated with different registration periods.
According to the Chaddock scale [
32], this level of correlation is borderline between “moderate” and “noticeable” and was reliably different from zero. The consistency of the data obtained by these methods made it possible to further use a method with high time and spatial resolutions to record the concentration of crustaceans using the DHC probe.
Due to the fact that most experiments were conducted in the daytime, the DHC probe was installed at a depth of 20 m from the surface.
3.2. Choice of Paired Photostimulation Illuminance Ratio
Under laboratory conditions, we found [
28] that the greatest response rate was observed with the use of the paired photostimulation according to the scheme of “the first stage of photostimulation 5 min, 25% of maximum illuminance + second stage 5 min, 75%” (illuminance as a percentage of maximum illuminance provided by the laser, 1150 lx, and 3450 lx, respectively).
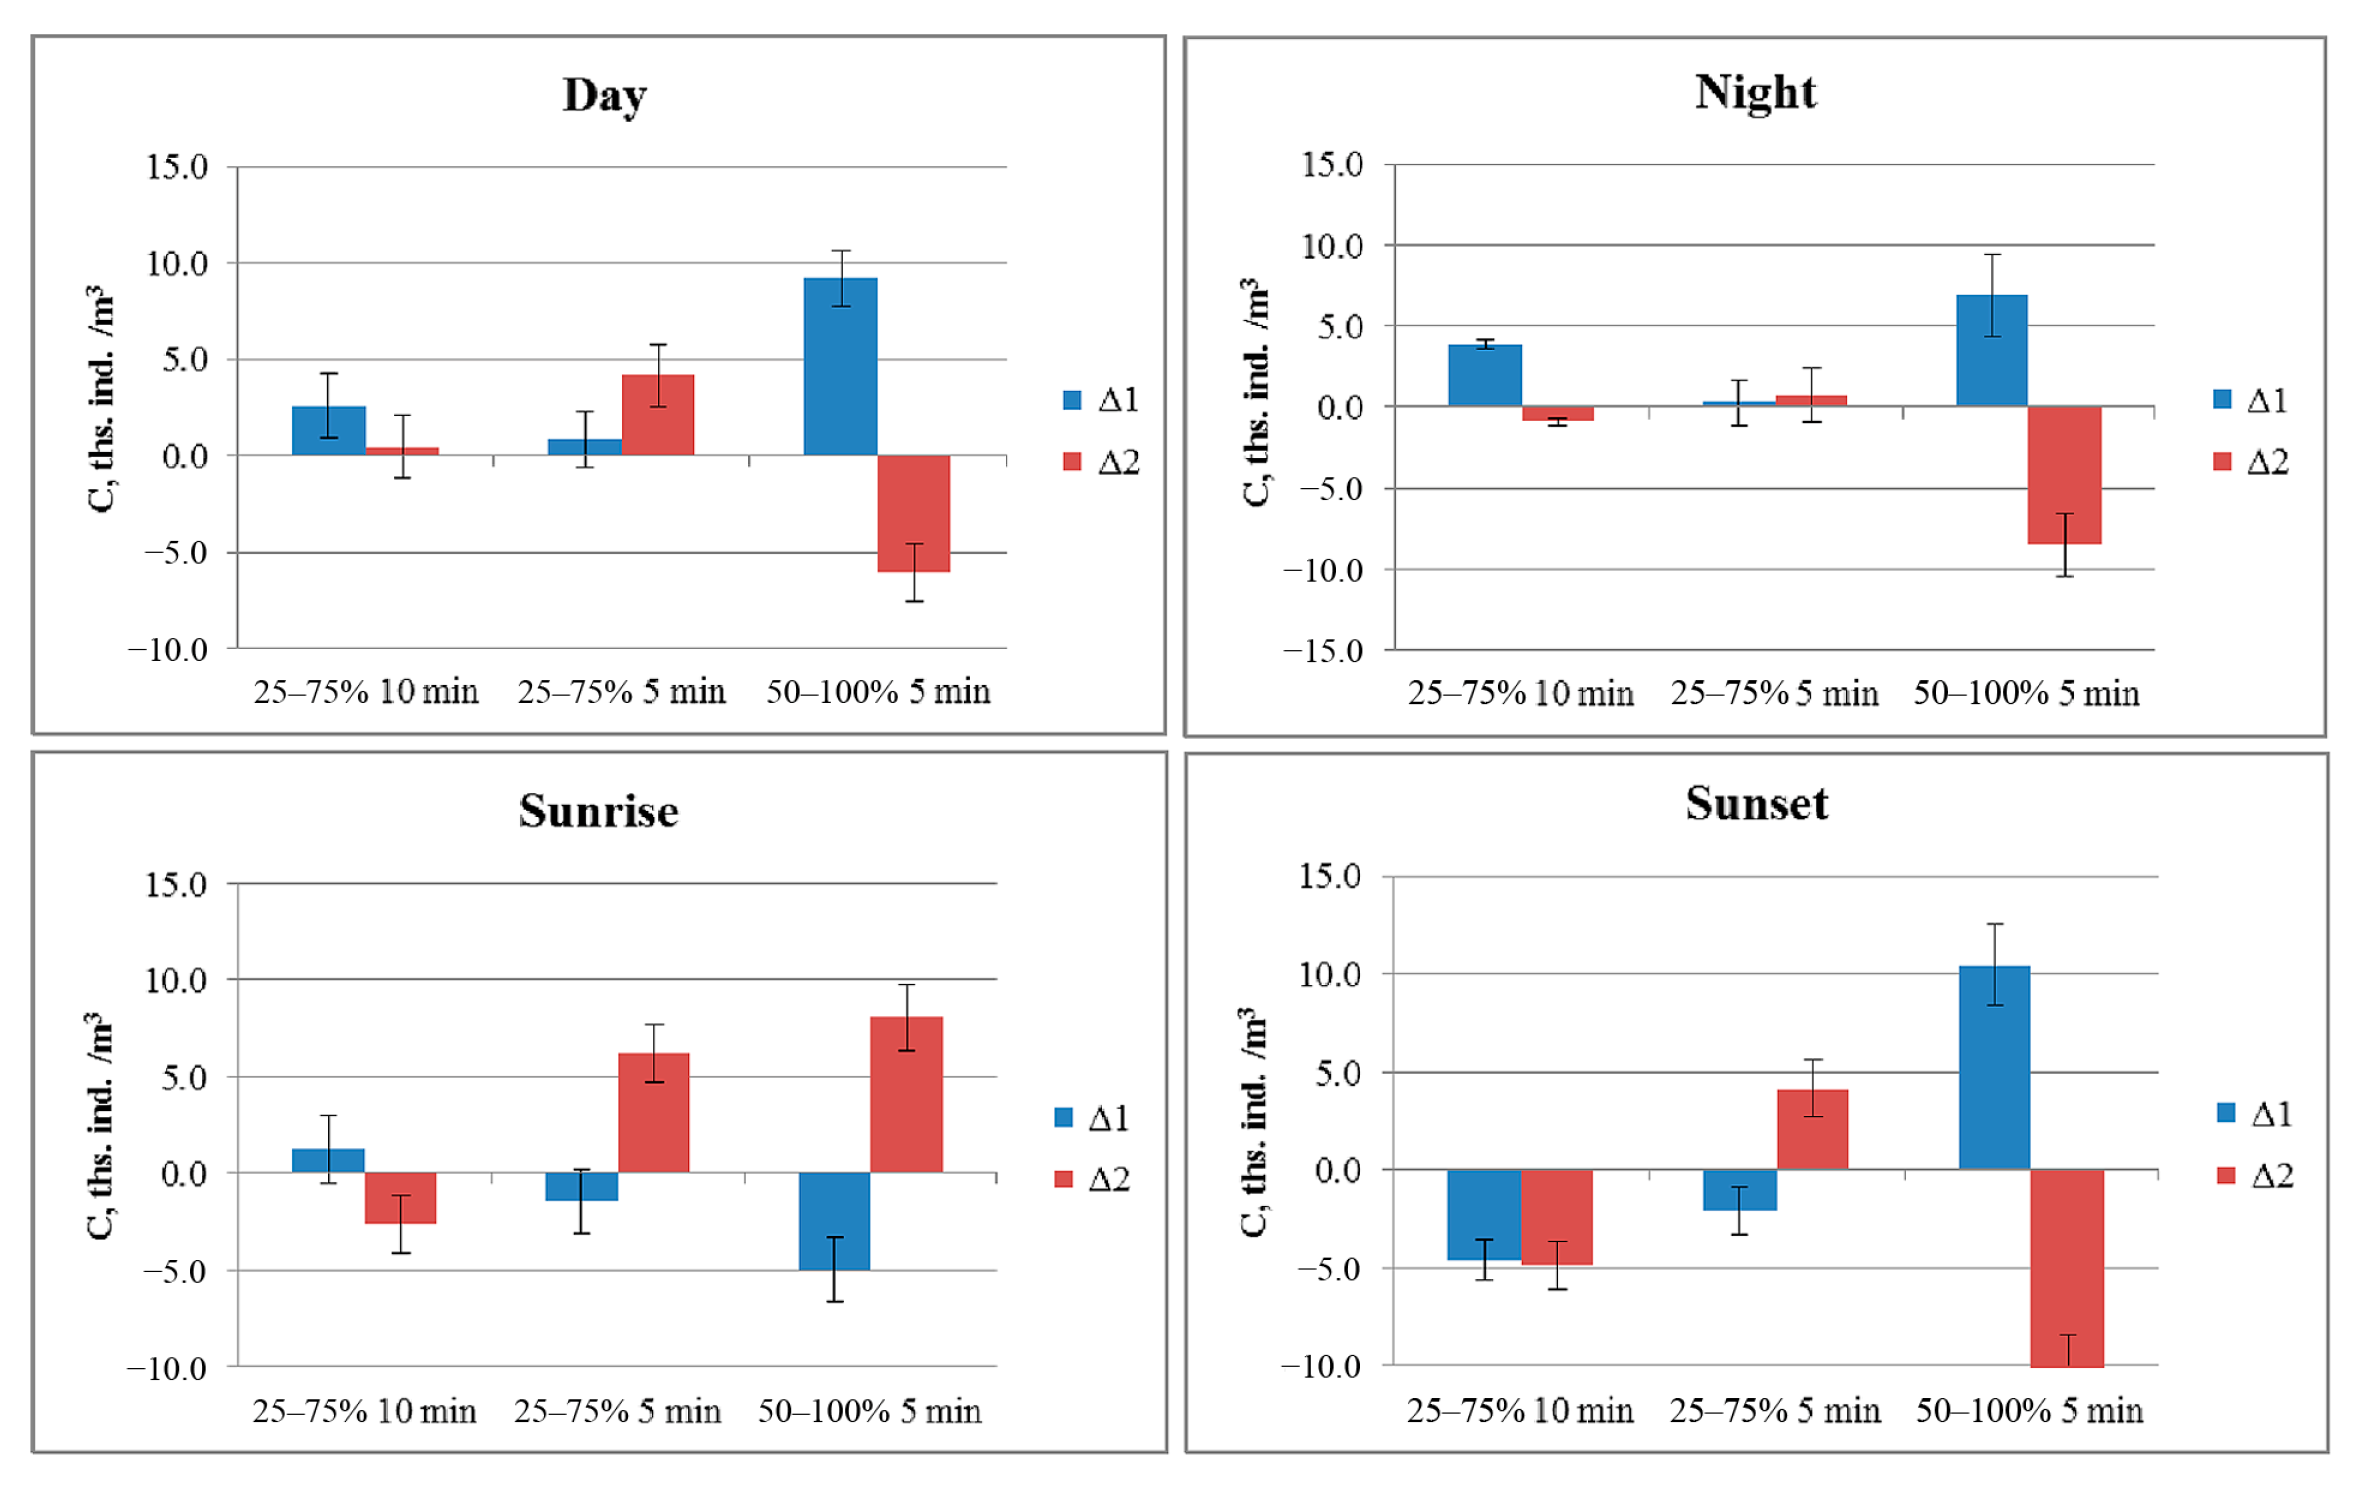
In natural conditions in Lake Baikal, due to the increased illumination of the medium on sunny days, two more schemes were used to increase the number of crustaceans in the controlled volume, “5 min.50% + 5 min.100%” and “10 min.25% + 10 min.75%”.
The use of the “10 min.25% + 10 min.75%” scheme resulted in an increased concentration of crustaceans during the photostimulation period but balanced the difference in the concentration of crustaceans at stages 1 and 2. A slight increase in the concentration of crustaceans in response to the second stage of attractor radiation Δ2 = 0.5 ± 1.7 ind/dm
3 (
p = 0.78) was observed only during the day. During the rest of the day, the concentration decreased by 0.9 ± 0.2 ind/dm
3 (
p < 0.001) at night, by 2.6 ± 1.5 ind/dm
3 (
p = 0.11) at sunrise, and by 4.9 ± 1.2 ind/dm
3 (
p = 0.005) at sunset (
Figure 4).
The use of the scheme “5 min.50% + 5 min.100%” led to a decrease in the concentration of crustaceans at the second stage of attractor radiation both during the day (by 6.1 ± 1.5 ind/dm3, p < 0.001) and at night (by 8.5 ± 1.9 ind/dm3, p < 0.001) and in the evening (by 10.2 ± 1.7 ind/dm3, p < 0.001). An increase in the concentration of crustaceans by 8.1 ± 1.7 ind/dm3, p = 0.002 was observed only in the morning.
With the exception of the morning time, there was a significant increase in the concentration of crustaceans in response to the first stage of attractor radiation during the day—by 9.2 ± 1.5 ind/dm
3 (
p < 0.001), in the evening—by 10.5 ± 8.4 ind/dm
3 (
p = 0.005), and at night—by 6.9 ± 2.5 ind/dm
3 (
p < 0.001), which significantly exceeded the corresponding increase under “10 min.25% + 10 min.75%”. Against the background of increased response at the first stage, a negative response to the second stage of the paired photostimulation is clear—the intensity of lighting becomes “frightening” for crustaceans [
17].
The paired photostimulation scheme “5 min.25% + 5 min.75%” caused an increase in the concentration during the transition to the second stage of photostimulation during all periods of the day, and at night, this increase was shown as a tendency (by 0.8 ± 1.6 ind/dm3, p = 0.65), and during the day (by 4.2 ± 1.6 ind/dm3, p = 0.014), morning (by 6.2 ± 1.5 ind/dm3, p = 0.003) and in the evening (by 4.1 ± 1.4 ind/dm3, p = 0.021) this increase was statistically reliable.
At the same time, the average pPhR during registration in this mode ranged from 1.6 ± 3.4% at night to 13.6 ± 3.3% in the morning.
Due to changes in the size of the working volume of the DHC probe and the low concentration of crustaceans, enhanced lighting modes were used during the paired photostimulation during the winter expedition. Such schemes as 75% (5 min) − 100% (7 min) and 75% (5 min) − 100% (10 min) were tested along with 25% (5 min) − 75% (5 min). The corresponding light exposures were equal to the product of illuminance and the stimulation duration (lx∙min). With the light exposure at the second stage equal to 17,250 lx∙min, the pPhR index was 28.0 ± 3.8%; with the light exposure equal to 32,200 lx∙min it increased to 46.2 ± 0.9%, and with the light exposure equal to 46,000 lx∙min it amounted to 65.3 ± 1.7%. The resulting ratio is linear with the approximation validity factor R2 = 0.999. That is, no “frightening” lighting level was observed in this range, which made it possible to further use the 75% (5 min) − 100% (10 min) mode.
3.3. Plankton Community Response Profile
A phototropic response severity profile was registered to further support the choice of the DHC probe installation depth. The phototropic response index cycles were registered after the descent to the depths from 5 to 40 m.
The crustacean concentration profile (C
0) in the DHC controlled volume prior to photostimulation recorded during 21:00–23:00 was close to the profile recorded previously during the evening-night period. Local maxima near the depth of 10 m (65.4 ind/dm
3) and 30 m (52.3 ind/dm
3) were observed compared to 47.1 ind/dm
3 at a depth of 20 m (
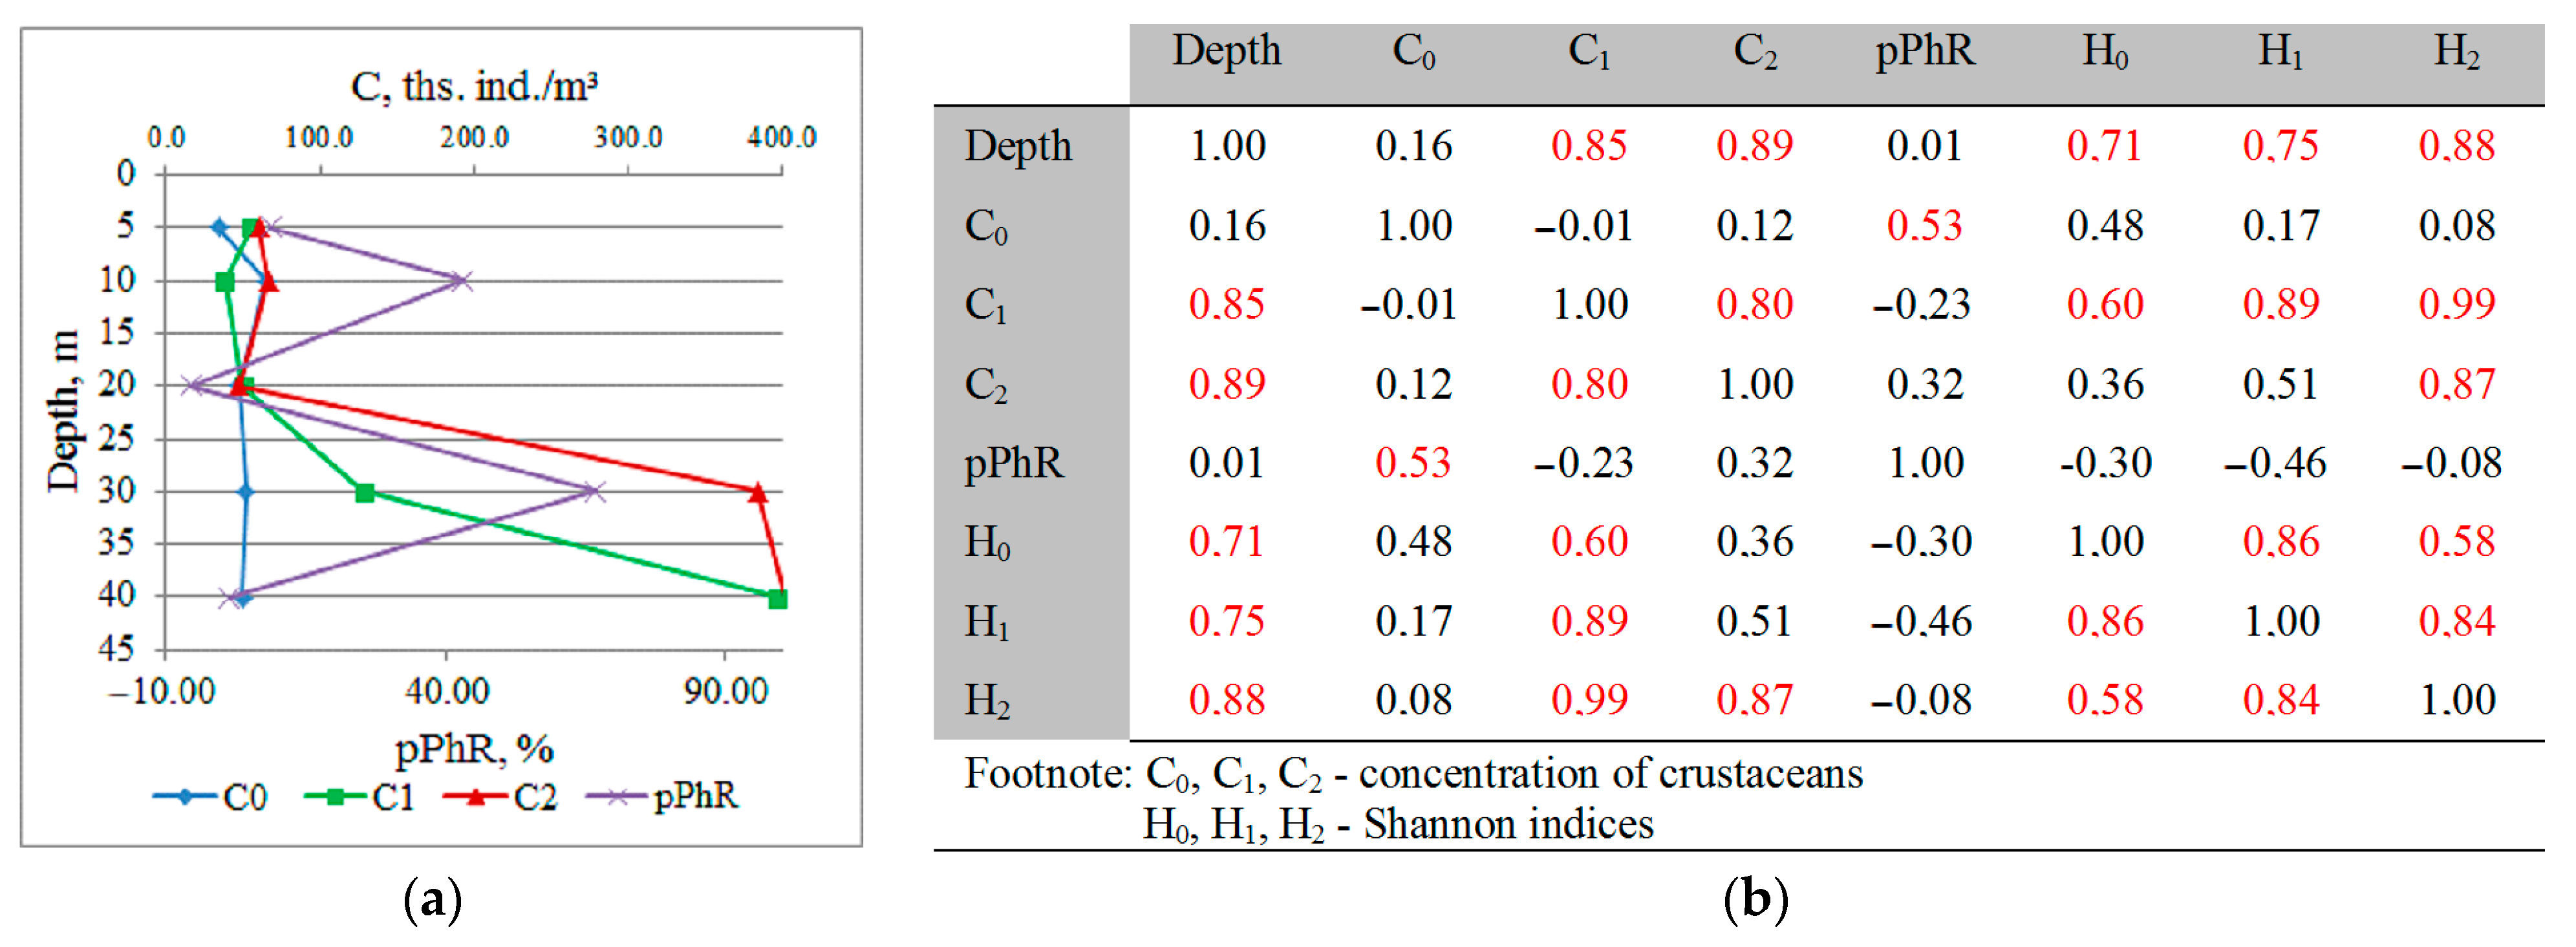
Figure 5). Slightly higher concentrations of crustaceans were caused by the fact that the registration was made at the stationary position of the probe, which prevents the “frightening” of crustaceans when it moves. At the same time, there was a similar pPhR profile that correlated with the C
0 profile (r = 0.53,
p = 0.044).
There was a clear dependence of the response to photostimulation on depth: the crustacean concentration profiles at the first stage of photostimulation (C1) and at the second stage of photostimulation (C2) correlated at depth (r = 0.85, p < 0.001 and r = 0.89, p < 0.001, respectively). Starting from a depth of 30 m, the response of crustaceans gathering to the attracting light zone sharply increased. Thus, at a depth of 5 m during the second stage of photostimulation, the concentration increased 1.8 times from 34.0 ± 2.4 ind/dm3 to 60.1 ± 6.6 ind/dm3. At a depth of 40 m under similar conditions, the concentration increased 8.1 times from 49.7 ± 3.5 ind/dm3 to 402.6 ± 44.3 ind/dm3. The pPhR index was also maximum at a depth of 30 m.
The concentration profiles at stimulation levels C1 and C2 were similar to r = 0.80, p < 0.001, but almost did not correlate with C0 (r did not exceed 0.12, p = 0.67).
The entropy of community features may be one of the measures of biodiversity. Since in the waters of Lake Baikal, up to 90% of mesozooplankton are E. baikalensis, it is possible to use such a parameter as the size of a body to determine biodiversity. The software we used made it possible to determine the length and width of crustaceans based on their images reconstructed from holograms.
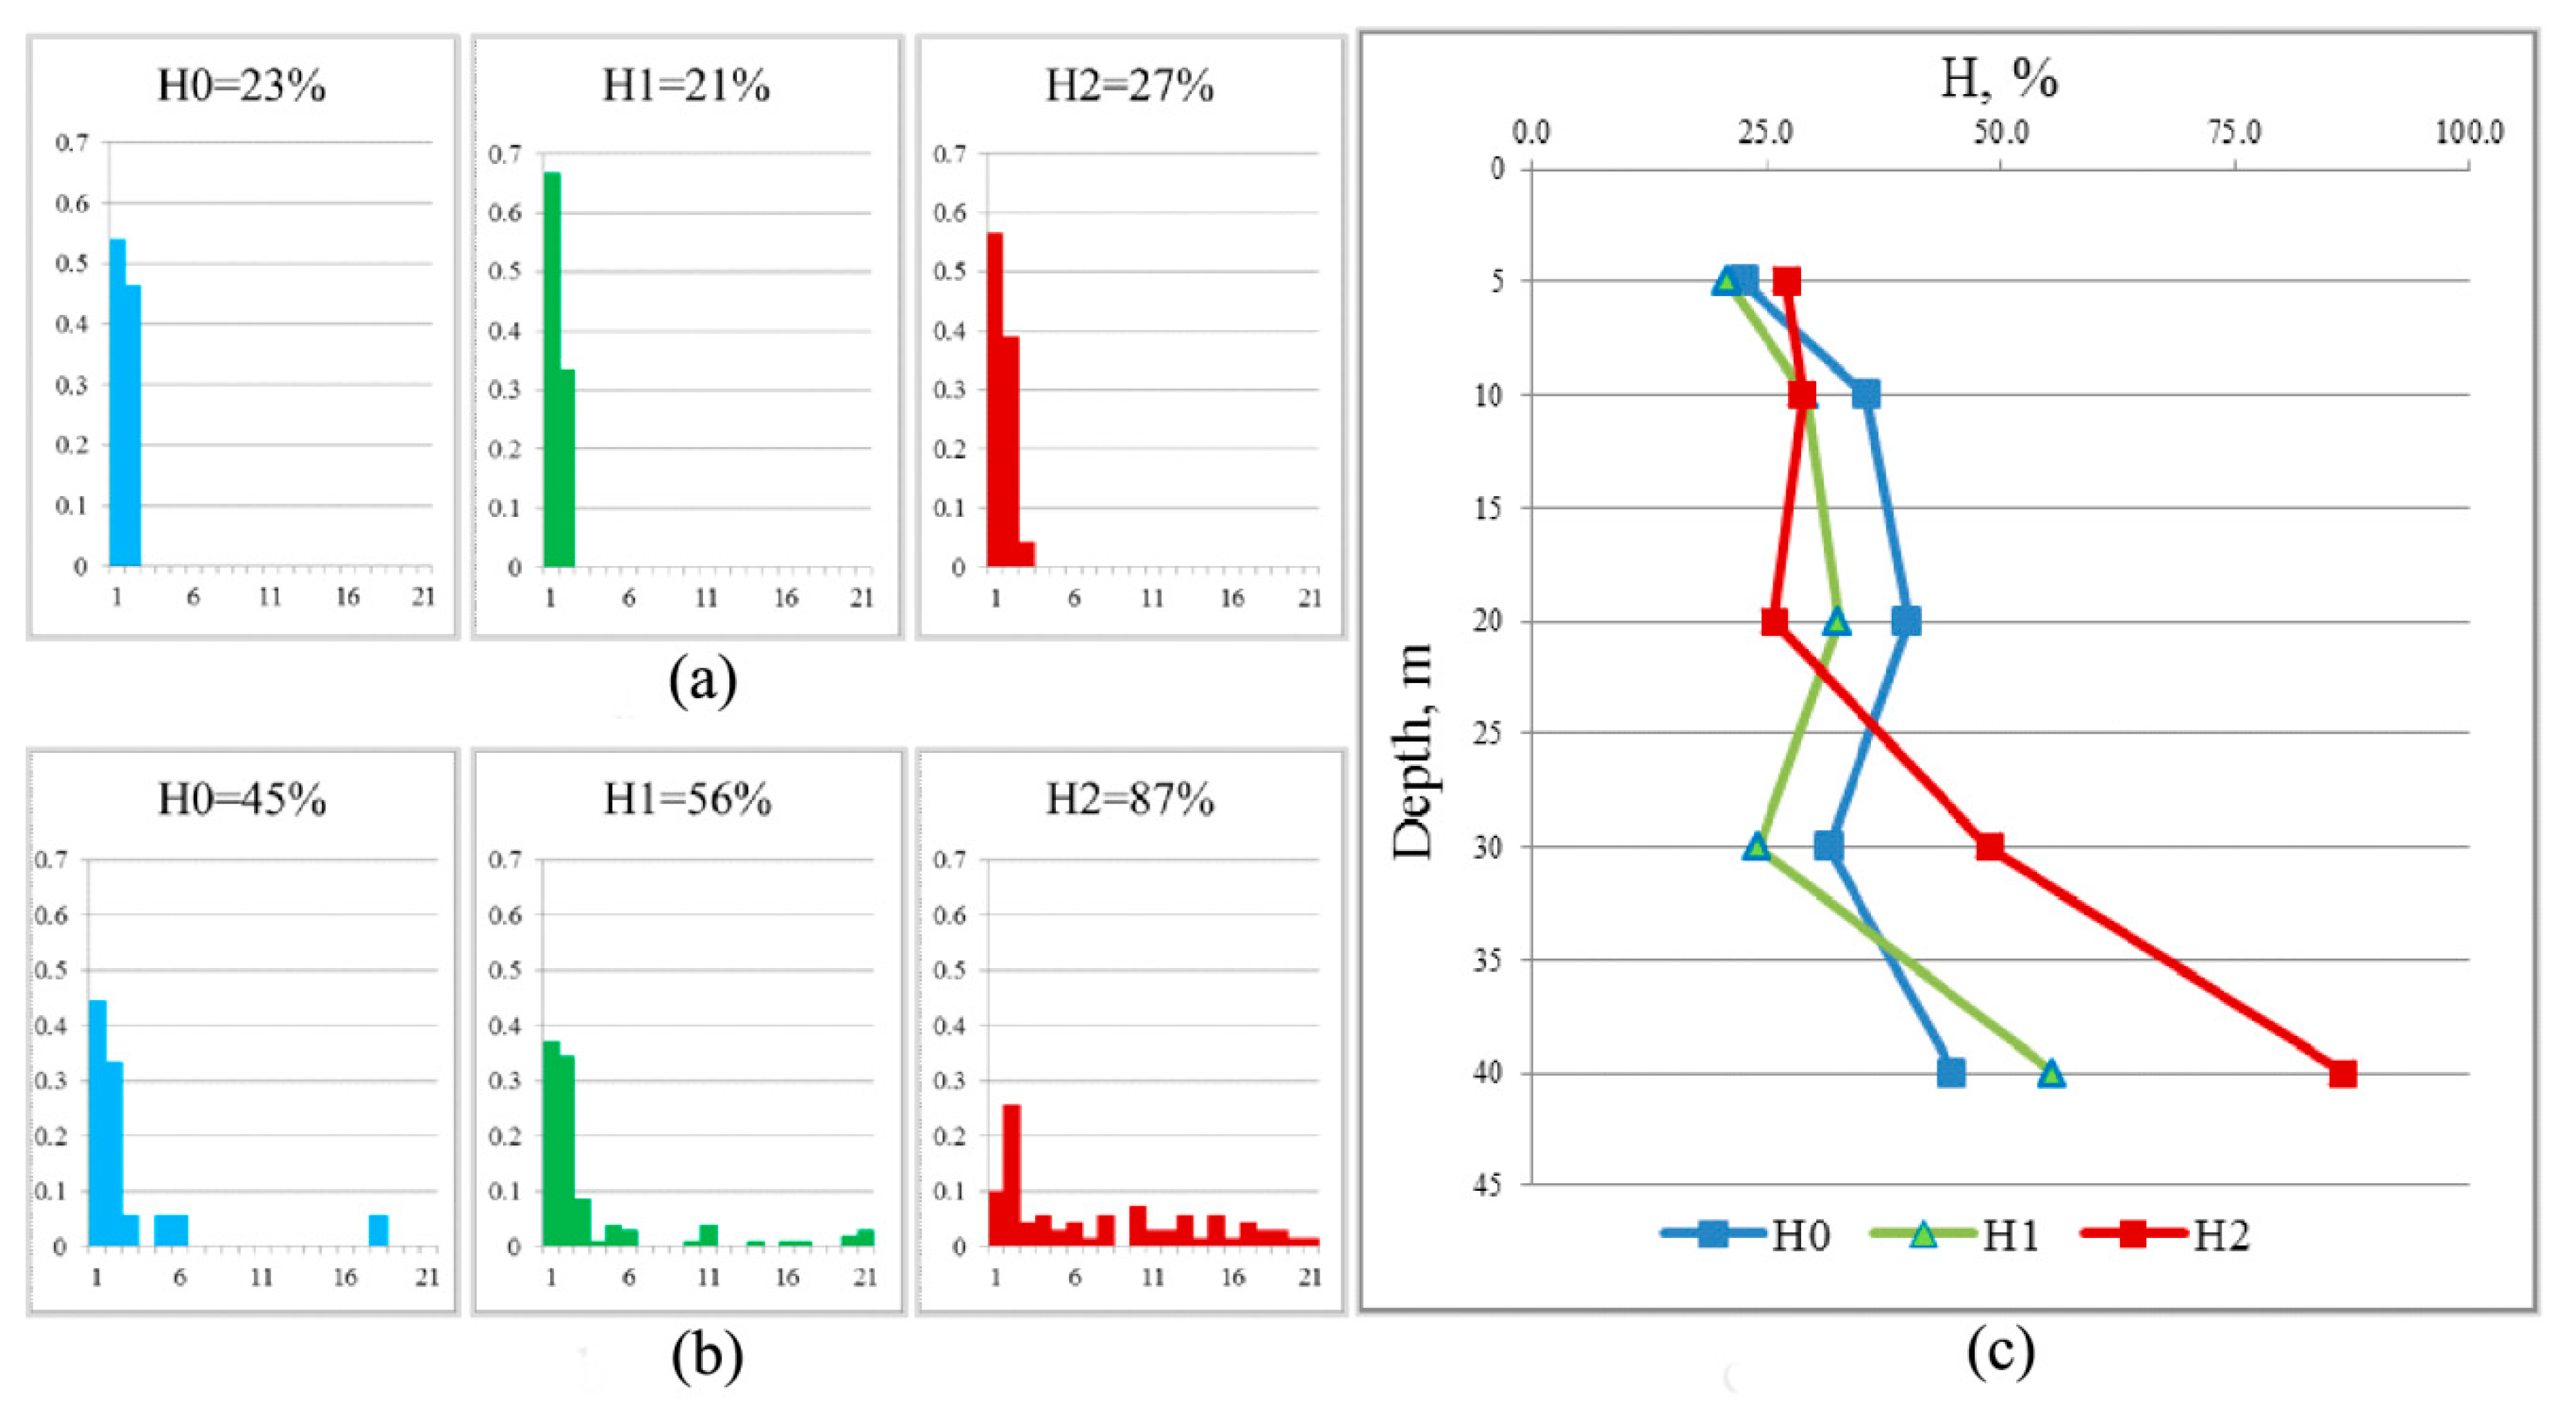
Crustaceans falling into size class 1, up to 120 µm, and class 2, from 120 to 200 µm, prevailed in the surface layers of the lake (
Figure 6a). The attracting light slightly changed their ratio. The normalized Shannon index made 20–30% of the maximum possible entropy. An increase in entropy was observed in the deeper layers (
Figure 6c), especially expressed at increased attracting light intensity (
Figure 6b).
The normalized Shannon index at the second intensity of photostimulation increased to 87% due to the presence of classes of bigger size, which indicates the attraction of nauplii of older age groups and copepodites to the attracting light zone.
3.4. Long-Term Monitoring and Modeling of Anthropogenic Impact
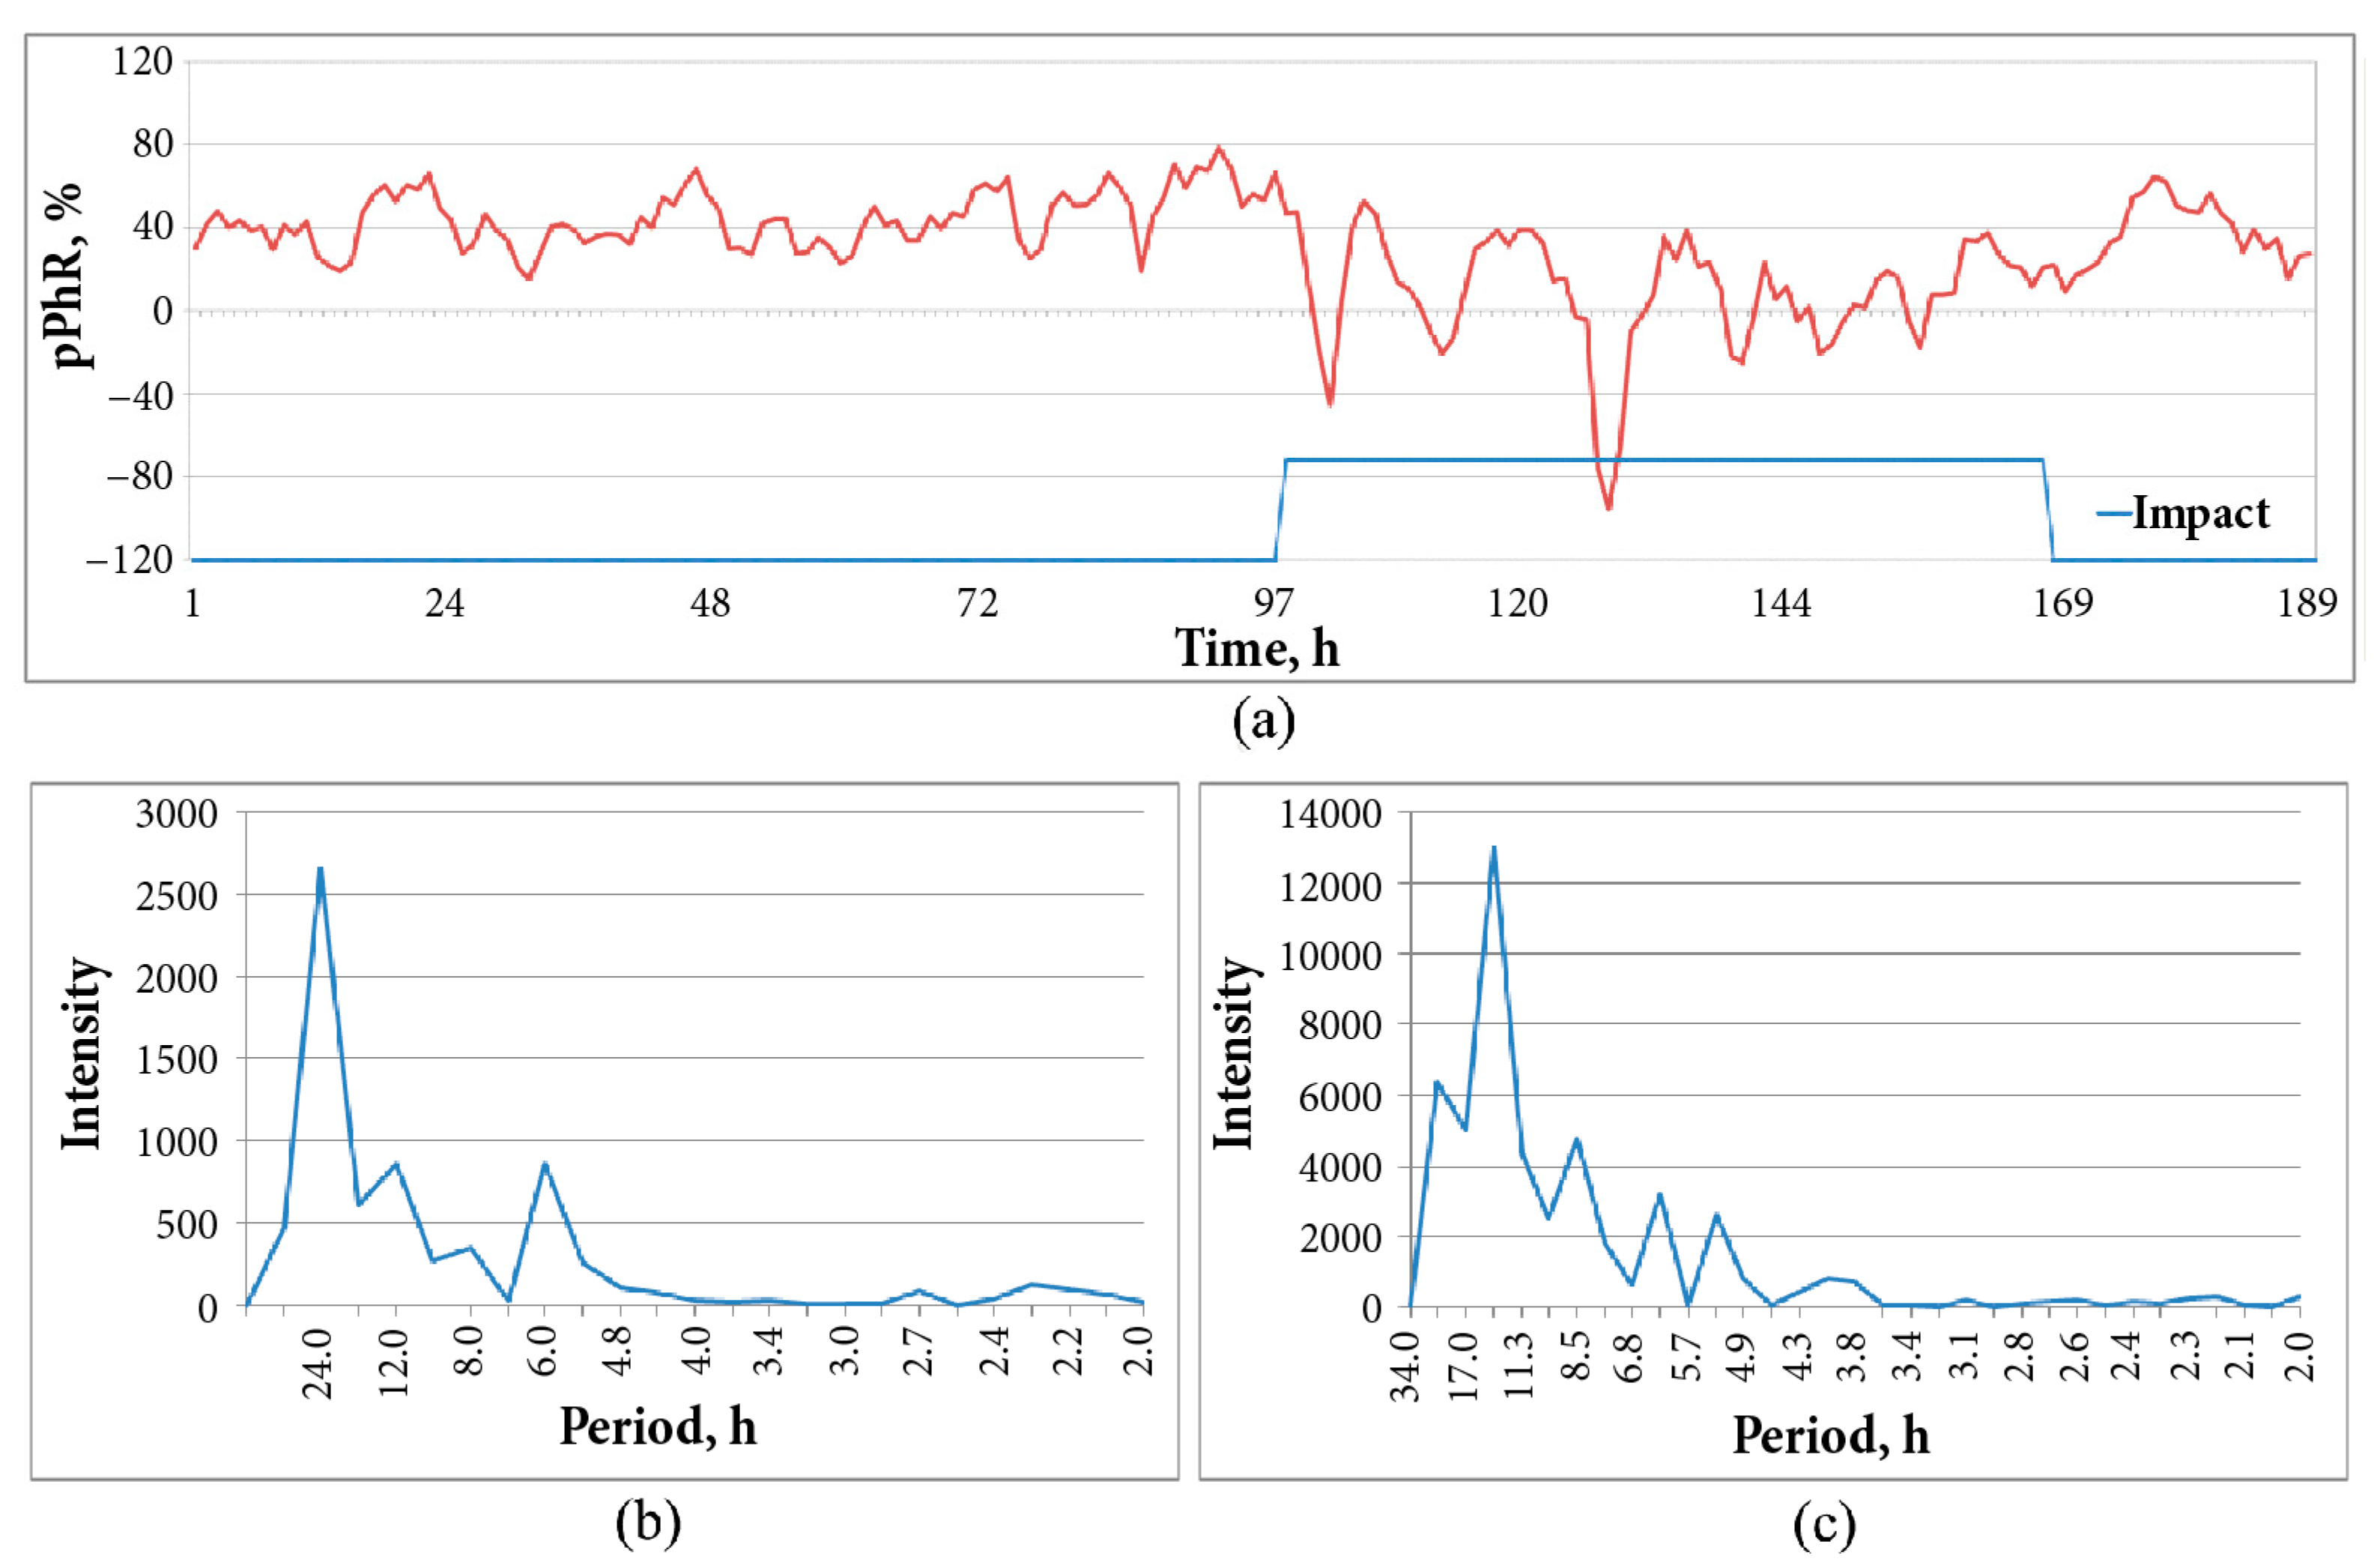
Long-term registration of pPhR (
Figure 7a) showed a cyclic variability of this index (
Figure 7b,c).
Under natural conditions, before anthropogenic impact (background), the most pronounced period of pPhR changes was 24 h. There were also changes in pPhR during a period of 12 h associated with a periodic change in insolation (the registration period was close to the vernal equinox) and a 6-h rhythm (
Figure 7b).
The modeling of the anthropogenic impact (introduction of table salt solution) showed a significant change in the spectrogram: the maximum amplitude was caused by changes in pPhR with a period of 13.6 h; the severity of the daily rhythm was reduced, and the changes in pPhR shifted to 22.7 h. Other local peaks of the spectrogram were also redistributed. The pPhR change rhythm was asynchronous with the external circadian rhythm (
Figure 7c).
No significant difference in intraspecific entropy was found: in natural conditions, H0, H1, and H2 amounted to 31.7 ± 0.9%, 30.7 ± 0.9%, and 30.3 ± 0.7%, respectively, and under impact—to 30.3 ± 0.9%, 29.8 ± 0.7%, and 30.4 ± 0.7%. In other words, there were no significant changes in the exogenous impact on the community.
Moreover, during the period of model influence, a significant decrease in the severity of pPhR was observed from 41.3 ± 1.83 p.p. in the background to 8.1 ± 3.0 p.p. under the influence (p < 0.001). After the end of the influence, the pPhR was restored to 37.2 ± 3.0 p.p., which did not differ much from the background (p = 0.12). Despite the difference in pPhR values in the daytime and at night, their dynamics during model influence were not significantly different. During the day, the changes ranged from 48.1 ± 2.4 p.p. in the background to 17.4 ± 4.3 p.p. (p < 0.001) during the influence period with subsequent recovery to 40.9.2 ± 2.5 p.p. (p = 0.04). At night, these changes ranged from 32.9 ± 2.0 p.p. in the background to −1.3 ± 5.1 p.p. (p < 0.001) during the influence period with further recovery to 33.2 ± 3.7 p.p. (p = 0.044). At night, photostimulation (light stimulus) had an inhibitory impact leading even to an inversion of the response sign.
4. Discussion
Among the variety of approaches to diagnosing the state of aquatic ecosystems, there are two major fields: the use of test impacts on the system and the registration of its response or the observation of the dynamics of indicator values formed by natural internal or external predictors.
It was previously noted that there are different levels of monitored responses: biocenotic, with several weeks of response time; population, with several days of response time; physiological, with several hours of response time; and organizational, with several minutes of response time [
2]. It should be noted that the change in the structure of biocenosis is perhaps the most conservative process, which in terms of sensitivity is beyond the scale of response to alternating factors, “behavioral responses—physiological changes—death”, and in terms of its response time—in last place in a number of characteristic changes. At the same time, behavioral responses as the basis of dynamic monitoring are affected by a large number of environmental factors that create high state variability.
In this regard, it is correct to follow two basic principles. First, autochthonous organisms adapted to the variability of local factors and not exhibiting significant responses under natural changes in the environment should be used as test organisms to assess the state of the biotope. Second, the behavioral response should be quantified during a standardized, quantitatively dosed test impact that excludes the spread of indications due to the variation in the intensity of the impact itself [
33].
Previously, in laboratory conditions, we showed that the inhibition of phototaxis to the paired photostimulation is a fairly sensitive and stable indicator of such pollutants as micro- and nanoplastics, oil, and standard potassium dichromate toxicant [
28,
29]. This study additionally registered the characteristics of plankton communities, such as the age variability according to the Shannon index and the presence of cyclic variability in behavioral phototropic response based on the spectral analysis of the pPhR time series.
The comparison of the advantages and disadvantages of different approaches to determine the biological significance of anthropogenic impacts requires considering the features of the localization of plankton communities in-depth and the severity of phototaxis depending on the intensity of attracting light and insolation. The well-known vertical migration of plankton [
19] resulting in the redistribution of plankters into different layers in depth raises the question of the optimal layer of the probe installation for long-term monitoring. In our studies, we focused on the results of recording the concentrations of crustaceans measured using the DHC probe. Preliminary studies showed a correlation between data obtained during the day using the DHC probe and the Juday net. The comparison of the daily dynamics of the average concentration of crustaceans measured by the DHC probe and the Juday net was complicated by the difference in discreteness in the depth of the medium “samples” (decimeters for the DHC probe and several meters for the net) and their volumes, i.e., the detail of profiles determined by the spatial resolution of the method (
Figure 2 and
Figure 3). Nevertheless, the consistency of the data obtained by these methods made it possible to further use the method of registering the concentration of crustaceans using the DHC probe as having greater spatial and time differentiation and choosing the optimal depth of installation of the probe. In particular, it was established that a migration of plankters to deeper layers was observed after sunset.
As mentioned above, the phototropic response to the paired photostimulation depends on the ratio of the intensity of the attracting light at different stages of photostimulation. Moreover, the optimal ratio may vary depending on the time of day (
Figure 4). The comparison of different modes of the paired photostimulation (
Section 3.2) showed that the paired photostimulation mode chosen earlier in the laboratory is valid for field works in natural conditions. It was found that the increase in the light illuminance to overcome the turbidity of the medium and increase in the number of “attracted” crustaceans at the second stage to 4600 lx does not cause a “frightening” effect that may lead to the inversion of the phototaxis sign [
17]. In other words, it is possible to use the paired photostimulation mode: 3450 lx—first illumination and 4600 lx—second illumination in unfavorable conditions.
A moderately correlated change in pPhR severity was observed, along with the depth change in the concentration of crustaceans (
Figure 5). The increase in the concentration of crustaceans at the second stage of photostimulation was especially pronounced with depth: from 1.8 times at a depth from 5 m to 8.1 times at a depth of 40 m. The pPhR index was also maximum at a depth of 30 m. Its subsequent decrease was caused by the fact that most crustaceans gather in the photostimulation zone already at the first level of its intensity, and the increase at the second level is insignificant.
One of the reasons for this difference may be a decrease in illumination from the surface. It is known that “light pollution” causes significant changes in the structure and state of ecosystems and may even lead to the disturbance of reproduction of aquatic communities [
34,
35]. In our case, it may act as (1) an external attractor and (2) an additional anthropogenic pressure on the plankton community.
Data on changes in intraspecific diversity confirm the possibility of using a second mechanism of impact. Due to the fact that over 90% of the mesozooplankton in Lake Baikal is
E. baikalensis (87 ± 5%—our data on catching using the Juday net at the moorage site), it does not seem appropriate to track the Shannon–Weiner biodiversity index [
36] (Shannon and Weaver, 1963) according to species diversity. At the same time, it is acceptable to use the body size to monitor the dynamics of intraspecific diversity [
37]. The calculation of the Pielou index [
38], which is a normalization of the Shannon index for maximum entropy, allows for assessing fractions or percentages of the variety of sizes of crustaceans in the scope of monitoring.
It should be noted that similar to the results obtained by the Juday net, the basic amount of crustaceans falls on the 80–200 μm size range characteristic of nauplii of stages 1 and 2. The variety of crustacean sizes increases deeper in the volume from H = 23% to H = 47%. It is well known that a decrease in exogenous pressure on the system leads to an increase in entropy [
31]. The observed increase in the entropy of crustacean sizes as depth increases may then indicate the reduced load on the plankton community associated with the distance from the factors affecting the surface. The increase in entropy during the photostimulation also indicates the fact that the photostimulation intensities we use are not stressful.
Rhythmic processes are particularly interesting as informative indicators. Oscillation processes are characteristic of all living and non-living beings.
From the standpoint of chronobiology, biorhythms are routinely repeated changes in the nature and intensity of the biological processes of the organism. Biorhythms are typical for all living matter and play a key role in wildlife [
39]. At the same time, the vital activity of organisms occurs in an environment whose parameters change cyclically. Under these conditions, the internal rhythm of the organism (system) is subjected to corrective action by the external environment. There is the synchronization of internal and external rhythms ensuring the equilibrium between organisms and the environment [
4,
5]. Such interactions include circadian rhythms that modify the resistance and sensitivity of biosystems to harmful factors depending on light conditions [
1,
7,
8]. Congenital circadian (daily, diurnal) rhythms are endogenous but synchronize with external factors and may be destroyed over time if external environmental conditions change [
40,
41]. Pollution may be considered one of the environmental parameters affecting the rhythmic processes of the biotic community [
13] and may, thus, lead to the desynchronization of rhythmic processes, which can be used for diagnostic purposes.
Long-term monitoring of the pPhR showed that the change in the phototropic response under natural conditions is not large—the variation coefficient is 4.4%. There is a polyharmonic change in response synchronized with the circadian rhythm (
Figure 7). Desynchronization of circadian rhythms and their harmonics is observed during the modeling of the anthropogenic impact, which could indicate the dysfunction of the plankton community. However, the reliable detection of a 6-h rhythm shift requires the registration of a 60-h time series. Hence, accordingly, 10 days are needed for a 24-h rhythm [
42]. Furthermore, this method is very sensitive to the regularity of intervals between measurements and gaps in data.
At the same time, during the period of model impact, a significant decrease in the severity of the pPhR was observed from 41.3 p.p. in the background to 8.1 p.p. under the impact (
p < 0.001). In other words, there was an 8-fold inhibition of the phototropic response (
Figure 7a). This effect was recorded both during the day (inhibition from 48.1 p.p. to 17.4 p.p.) and at night (from 32.9 p.p. to complete inhibition of the response and even a small change in its sign: pPhR = −1.3 p.p.). This indicates a significant change in the activity of the nervous system of crustaceans, which is responsible for the phototropic response.
Thus, the inhibition of the phototropic response, as a result of the behavioral activity controlled by the nervous system, is the most adequate marker of the exogenous impact and the appearance of an alternating factor among the considered indicators of the state of the plankton community, namely, intraspecific diversity, synchronism of circadian rhythms, and response to the paired photostimulation.
5. Conclusions
The DHC probe developed by us allows for dynamic and high spatial resolution recording profiles of the distribution of crustacean concentration by the depth of the reservoir and diel migration of plankton.
The intraspecific diversity index of E. baikalensis increases with depth, suggesting a decrease in the exogenous pressure as it moves away from the surface. However, no reliable changes in this indicator were found during the period of artificial impact on the plankton community.
A change in the spectrograms of the time series of the phototropic response index assessed by the paired photostimulation was found during the artificial impact. The circadian rhythms of the pPhR desynchronize with the rhythm of exogenous insolation. However, reliable determination of the desynchronized value requires long-term registration—up to 10 days.
During the modeling of the anthropogenic impact, the phototropic response to the paired photostimulation was suppressed. The pPhR moving average integrated over 3 consecutive hours decreased significantly both during the day and at night.
The rearrangement of the phototropic response determined by the paired photostimulation can be the most adequate marker of exogenous impact and the appearance of an alternating factor.
