Article

Projections of Global Drought and Their Climate Drivers Using CMIP6 Global Climate Models

1
Fujian Provincial Key Laboratory of Remote Sensing of Soil Erosion and Disaster Protection, College of Environmental & Safety Engineering, Fuzhou University, Fuzhou 350116, China
2
Instituto Dom Luiz, Faculty of Sciences, University of Lisbon, 1749-016 Lisbon, Portugal
3
China Institute of Water Resources & Hydropower Research, Research Center on Flood & Drought Disaster Reduction, Beijing 100038, China
4
Key Laboratory of Spatial Data Mining & Information Sharing, Ministry of Education of China, Fuzhou 350116, China
*
Author to whom correspondence should be addressed.
Water 2023, 15(12), 2272; https://doi.org/10.3390/w15122272
Submission received: 10 May 2023 / Revised: 7 June 2023 / Accepted: 15 June 2023 / Published: 17 June 2023

Abstract

:

Highlights

What are the main findings?
  • The future drought conditions predicted by AWI-CM-1-1-MR and MPI-ESM1-2-HR are relatively reasonable. However, EC-Earth3 tends to underestimate future drought conditions.
  • Drought conditions across much of the globe are expected to become increasingly serious, and the trend is significant.
  • The drought events in much of the world are mainly driven by precipitation.
What is the implication of the main finding?
  • We found that the primary reason for the substantial differences in drought predictions among the three models is the overestimation of future precipitation by EC-Earth3.
  • The future drought conditions in most regions around the world are expected to worsen.

Abstract

Due to the complex coupling between drought and climatic factors, the future drought conditions that might occur under climate change is still unclear. In this research, we used the daily SPEI algorithm to project global drought conditions during 2016–2100 based on the data from phase 6 of the Coupled Model Intercomparison Project (CMIP6). We also employed partial correlation analysis to explore the influence of climate factors on drought. Our analyses show the following: (1) Drought conditions projected by CMIP6 under different models are similar; however, they can vary widely across regions. (2) According to the MK trend test, drought conditions in most regions around the world are expected to become increasingly severe in the future, and this trend is significant. (3) Based on the results of the partial correlation analysis results, it is understood that drought events in most regions worldwide are primarily driven by precipitation. This study contributes to the discussion of projecting future drought conditions and expands the application by utilizing the state−of−the−art CMIP6 climate models and scenarios.Highlight

1. Introduction

Drought consequences are among the costliest natural disasters on earth. Agriculture, the economy, and society worldwide are threatened by droughts due to their frequency, the large areas affected, and the long duration of these events [1,2,3,4,5]. Drought is estimated to have killed 11.73 million people between 1900 and 2021, with economic losses ranging from USD 6 billion to USD 8 billion per year, which is far worse than any other disaster [6,7,8,9,10]. Due to climate change, extreme hydrological events, such as drought, are expected to become more frequent [11,12,13,14,15]. Therefore, it is paramount to understand how drought is expected to change in different climate change scenarios to prepare timely warning and mitigation strategies.
Drought indices are commonly used to characterize and study these events. Several drought indices have their applications, strengths, and effectiveness [16,17,18,19]. Palmer’s drought severity index (PDSI) and the standardized precipitation index (SPI) have been widely applied to drought research [20,21]. However, they also present shortcomings [22,23]: (1) PDSI has some problems related to time−scale fixation, data−dependent calibration, and poor spatial comparability [22,24,25]; and (2) evapotranspiration is not taken into account in the formulation of SPI, as it is solely based on precipitation factors [26]. For drought monitoring and assessment, Vicente−Serrano et al. developed the standardized precipitation evapotranspiration index (SPEI), which combines the strengths of PDSI and SPI [27]. In addition to considering the influence of evapotranspiration on drought, SPEI also compares and spatially characterizes different types of drought on multi−time scales [24,26]. Therefore, SPEI is designed as a better tool to study future global drought conditions under climate change, as it takes into consideration the influence of evapotranspiration [28].
SPEI has been extensively used for drought monitoring and forecasting. However, the monthly SPEI has some limitations that make it impossible to monitor short−term droughts [24]. During critical vegetation growth periods, droughts of a few days can lead to severe detrimental effects [24]. To describe a sudden drought of short duration (for example, a few days), a new approach focused on daily SPEI was recently developed [29]. This new daily SPEI has been applied in previous studies to evaluate drought and its effects [29,30]. The daily SPEI is calculated and applied similarly to the monthly SPEI. Different time scales of SPEI are associated with meteorological drought (30 days), agricultural drought (90−180 days), hydrological drought (360 days) and socioeconomic drought (720 days) [20,28]. It can monitor and assess drought at all−time scales, from daily, weekly, and monthly to any longer scale, and the daily SPEI can monitor the specific date of drought onset and the number of days of duration.
The Coupled Model Intercomparison Project (CMIP) is one of the most powerful international data sources at present [31,32]. Studies have shown that CMIP6 reproduces the spatial pattern change of large-scale average surface temperatures and precipitation more accurately than CMIP3 and CMIP5 [7,33,34]. The global climate models (GCMs) available in CMIP6 have been widely used in previous studies [35,36,37]. Based on CMIP6, a number of drought forecasts have been made at the global and regional scales, and strong drought trends have been observed in many areas [7,21]. Previous results revealed that CMIP6 has a strong ability to capture drought characteristics [7,27]. The majority of previous forecasting studies have focused on mean/extreme temperatures or precipitation [7,38,39,40]. These studies have ignored long−term changes in drought characteristics. Therefore, it is necessary to use the latest CMIP6 data to predict changes in the duration, frequency, and severity of future drought events.
Considering the improvement in CMIP6 and the fact that daily SPEI is better able to project the characteristics of future drought events, we selected three models from CMIP6 (EC-Earth3, AWI CM-1-1-MR, and MPI-ESM1-2-HR) to assess future drought characteristics based on SSP scenarios (SSP585). Finally, we projected the spatial patterns and the change trends of global drought event severity, estimated the duration and frequency during 2016–2100 and used partial correlation analysis to explore the impact of climate factors on drought. This paper aims to study drought conditions under future climate change conditions based on different climate models, thereby providing new information for global drought research.

2. Data Sources and Methods

2.1. Data Sources

Three models (EC-Earth3, AWI-CM-1-1-MR, and MPI-ESM1-2-HR) have been widely used in climate change studies [37,41,42,43] and one SSP scenario (SSP585) from ScenarioMIP were selected from the CMIP6 database (https://esgf−node.llnl.gov/search/cmip6/, accessed on 1 February 2023). In the SSPs, an array of future GHG emissions and land use variations scenarios are evaluated from composite evaluation models based on different assumptions about economic growth, climate mitigation, and global governance [35,44]. We want to study future drought conditions under the highest forcing scenario. Therefore, the SSP5−8.5 (+8.5 W m−2; high−end forcing pathway) drawn from Tier 1 of ScenarioMIP was used in this study. The details of climate factors data are shown in Table 1.

2.2. Drought Index

Vicente−Serrano et al. (2010) first developed SPEI to evaluate and monitor drought conditions, providing added value compared to SPI by incorporating the temperature effect through the inclusion of evapotranspiration. In this research, we utilized the newly developed daily SPEI to assess drought. The computation of daily SPEI was conducted following the methodology outlined in Wang’s study [24]. Daily SPEI values were calculated for 30-day accumulation periods, considering the water balance as the difference between precipitation and PET (D = P − PET). We used the generalized extreme value (GEV) distribution to standardize the D series into the SPEI data series, since the GEV distribution is the most suitable for SPEI calculation [28,45]. For a detailed calculation process and specific parameters, please refer to [24,46]. The D accumulation for each grid, from 2016 to 2100, for day i per year (30 days of D accumulation up to day i) resulted in 85 cumulative values. These 85 values were then used to fit the GEV probability function. The various wet and dry categories are presented in Table 2.

2.3. Identification of Drought Events

The characteristics of drought events (severity, duration, and frequency) were defined using the run theory proposed by Yevjevich (1967). Firstly, we defined a drought event by determining the beginning and ending dates of the drought, and subsequently determined its characteristics. The drought duration refers to the persistent period of drought from start to finish. The drought severity is measured as the area under the curve of the absolute value of the SPEI (value < −0.5) and the horizontal axis (SPEI = 0) during the drought period. The drought frequency represents the total number of drought event occurrences within a specific period. The drought events and their corresponding characteristics are illustrated in Figure 1.
To assess the overall characteristics of drought events, we calculated the annual total drought severity (ATDS), the annual total drought duration (ATDD), and the annual total drought frequency (ATDF) on a 1-month scale [24]. These three variables accumulate the severity, duration, and frequency of all the drought events per year, respectively. They enable us to compare and analyze the global characteristics of drought events.

2.4. Statistical Analysis

The Mann−Kendall (MK) test was used to determine the variation trends of drought events’ characteristics and assess their significance [47]. As a non−parametric test, the Mann−Kendall method does not require the data to conform to a normal distribution [47,48,49]. Due to the lack of distribution−specific requirements, the calculation is relatively straightforward. The MK test is widely employed to analyze the changing trends in drought, precipitation, and temperature time series [50,51]. The trends of drought event characteristics span the entire period from 2016 to 2100. A p−value < 0.05 represents a statistically significant trend [24].
Correlation is a mathematical method extensively used in climate analysis, serving as a statistical index that measures the relation between two or more variables, expressed as the correlation coefficient [52]. Partial correlation analysis is a linear correlation method used to isolate the effect of a third variable on the correlation between any two variates [53,54]. Partial correlation analysis was employed to determine the independent relationship between drought and each climate factor, thereby eliminating the interaction among the climate factors.

3. Results

3.1. Interannual Variation of Climatic Factors

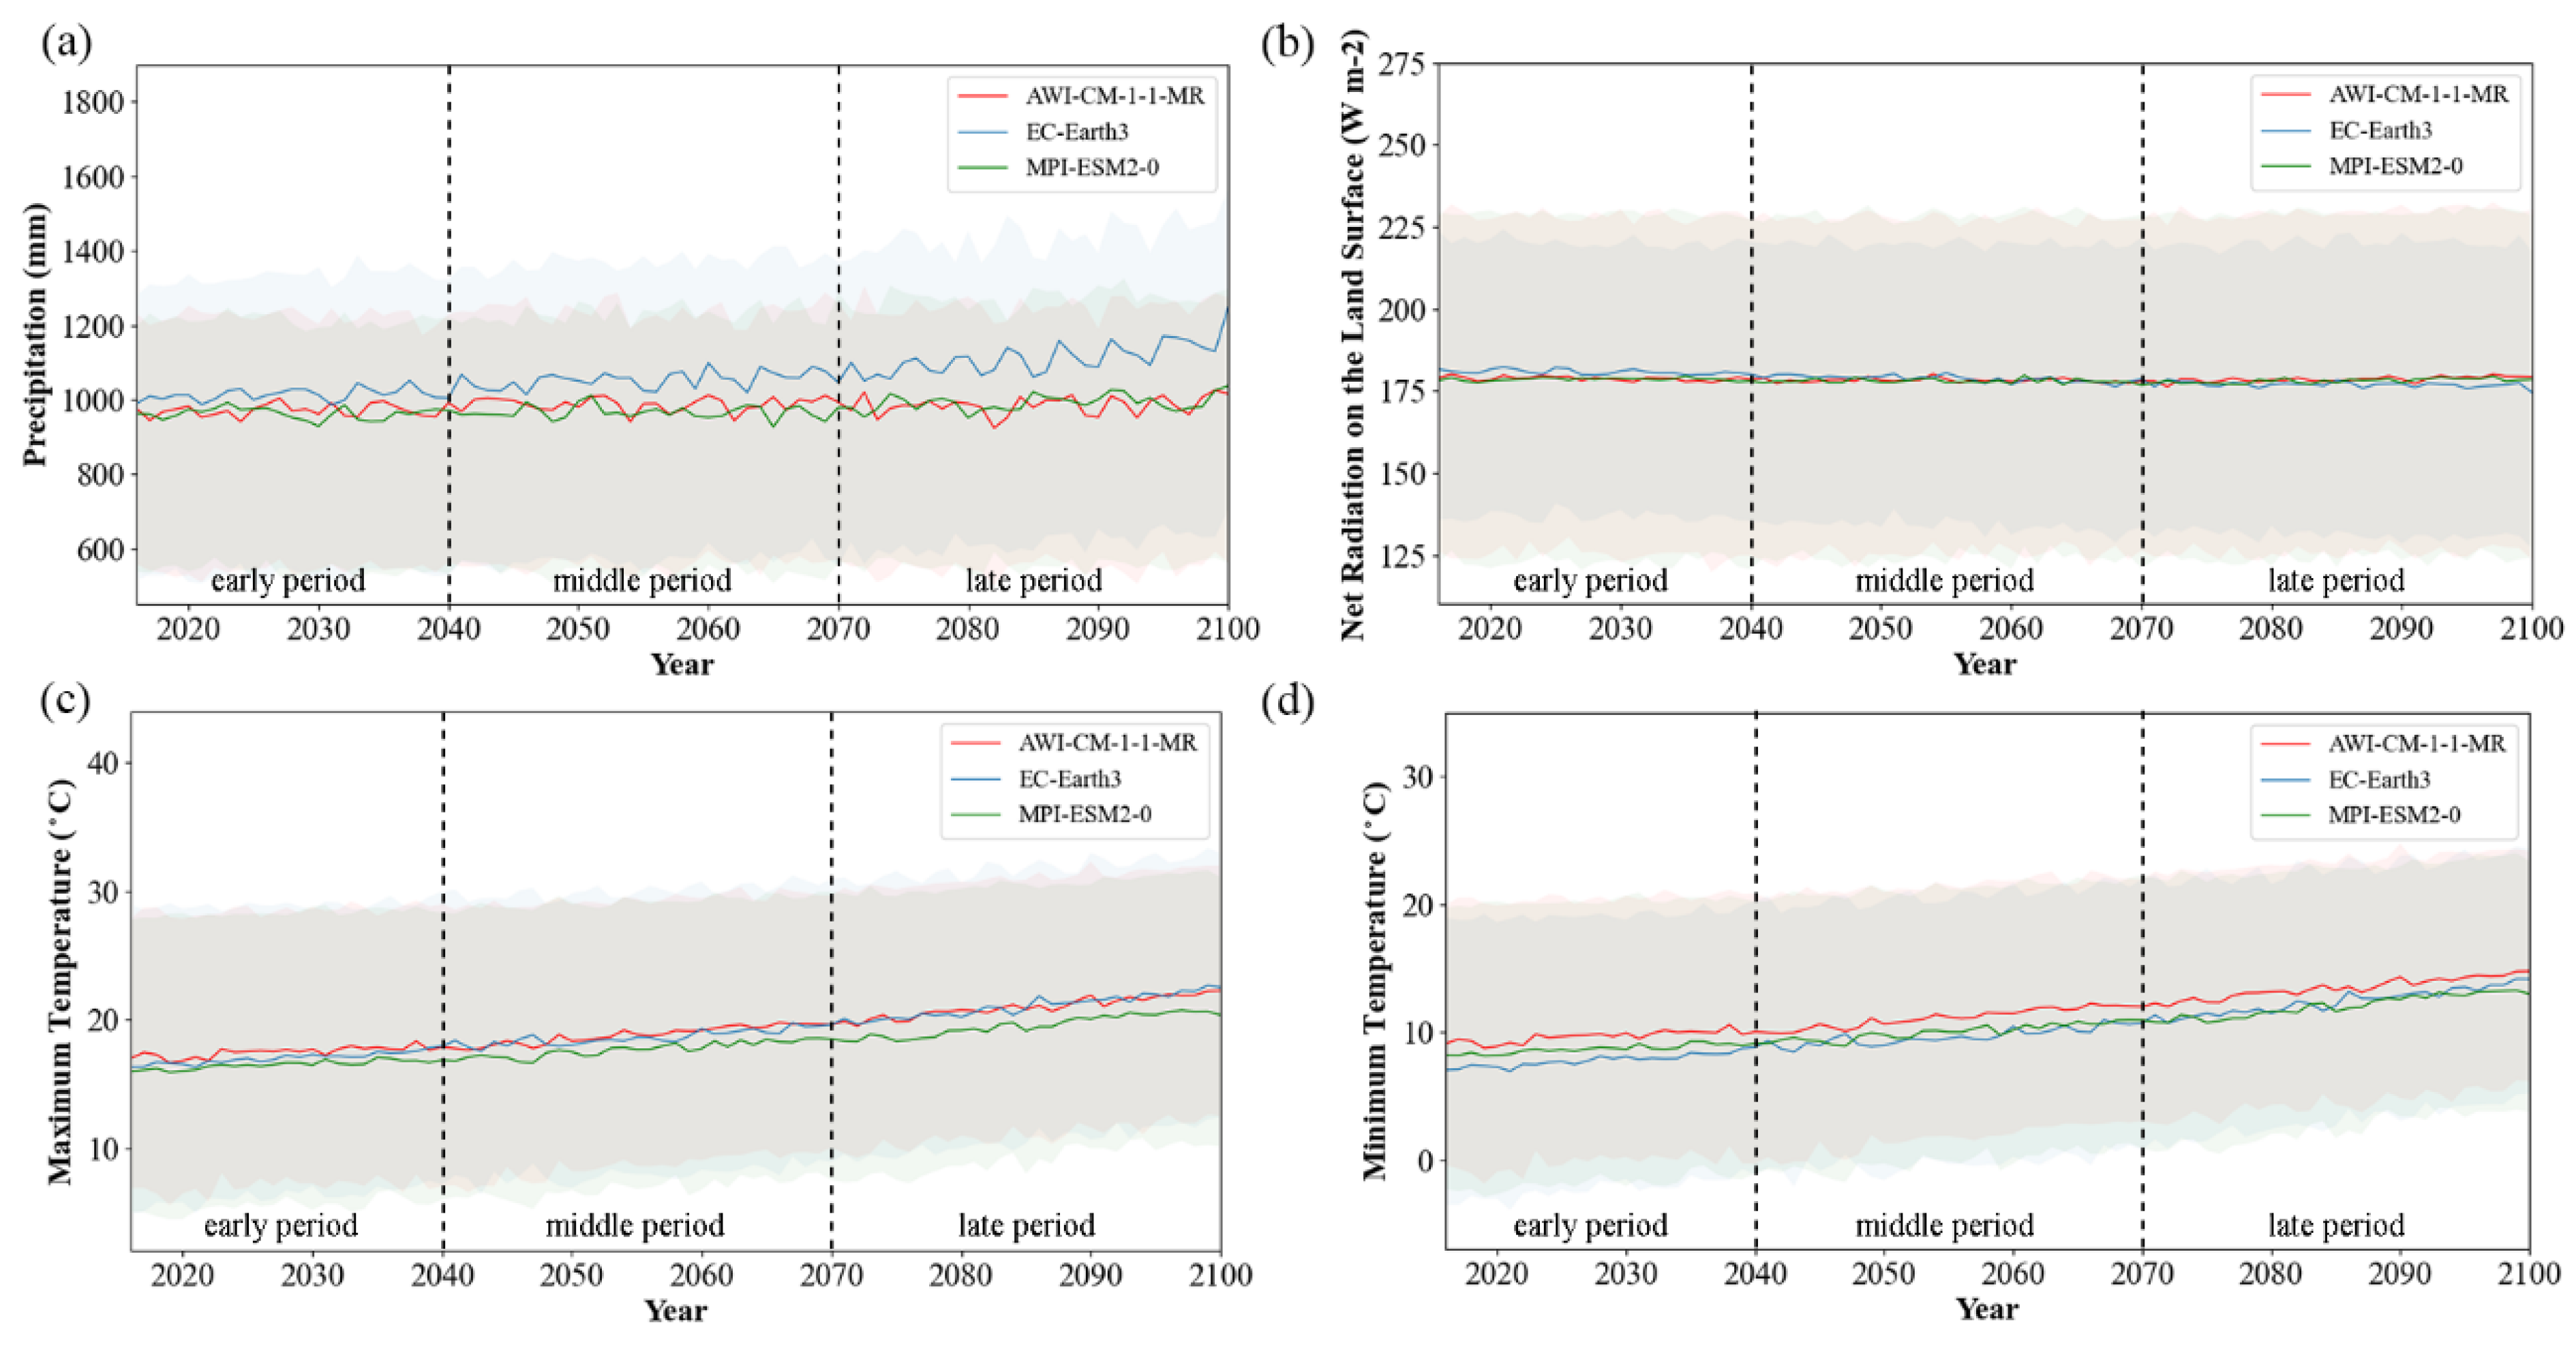
We analyze the interannual variation in three periods: the early period (2016–2040), the middle period (2041–2070), and the late period (2071–2100). Following steps were undertaken to calculate the time series: for precipitation, we first accumulated 365 days for each grid point of each model, and then took the mean, 25th percentile and 75th percentile, of all the grids for each year; and for net surface radiation, maximum temperature and minimum temperature, we first averaged 365 days for each grid point of each model, and then took the mean, 25th percentile and 75th percentile, of all the grids for each year. As seen in the interannual variation of climate factors from 2016 to 2100, the EC-Earth3 simulation yields much larger precipitation than the other two models, and it is more pronounced in the later period (Figure 2). The maximum temperature from MPI-ESM1-2-HR shows overall lower values than the other two models in most years, and the minimum temperature from AWI-CM-1-1-MR shows higher values than the other two models in most years. The interannual variation of precipitation, maximum temperature, and minimum temperature in the three models indicate an increasing trend from 2016 to 2100. However, the interannual variation of net surface radiation in the three models shows an overall declining trend.

3.2. Interannual Variation of Drought Events’ Characteristics

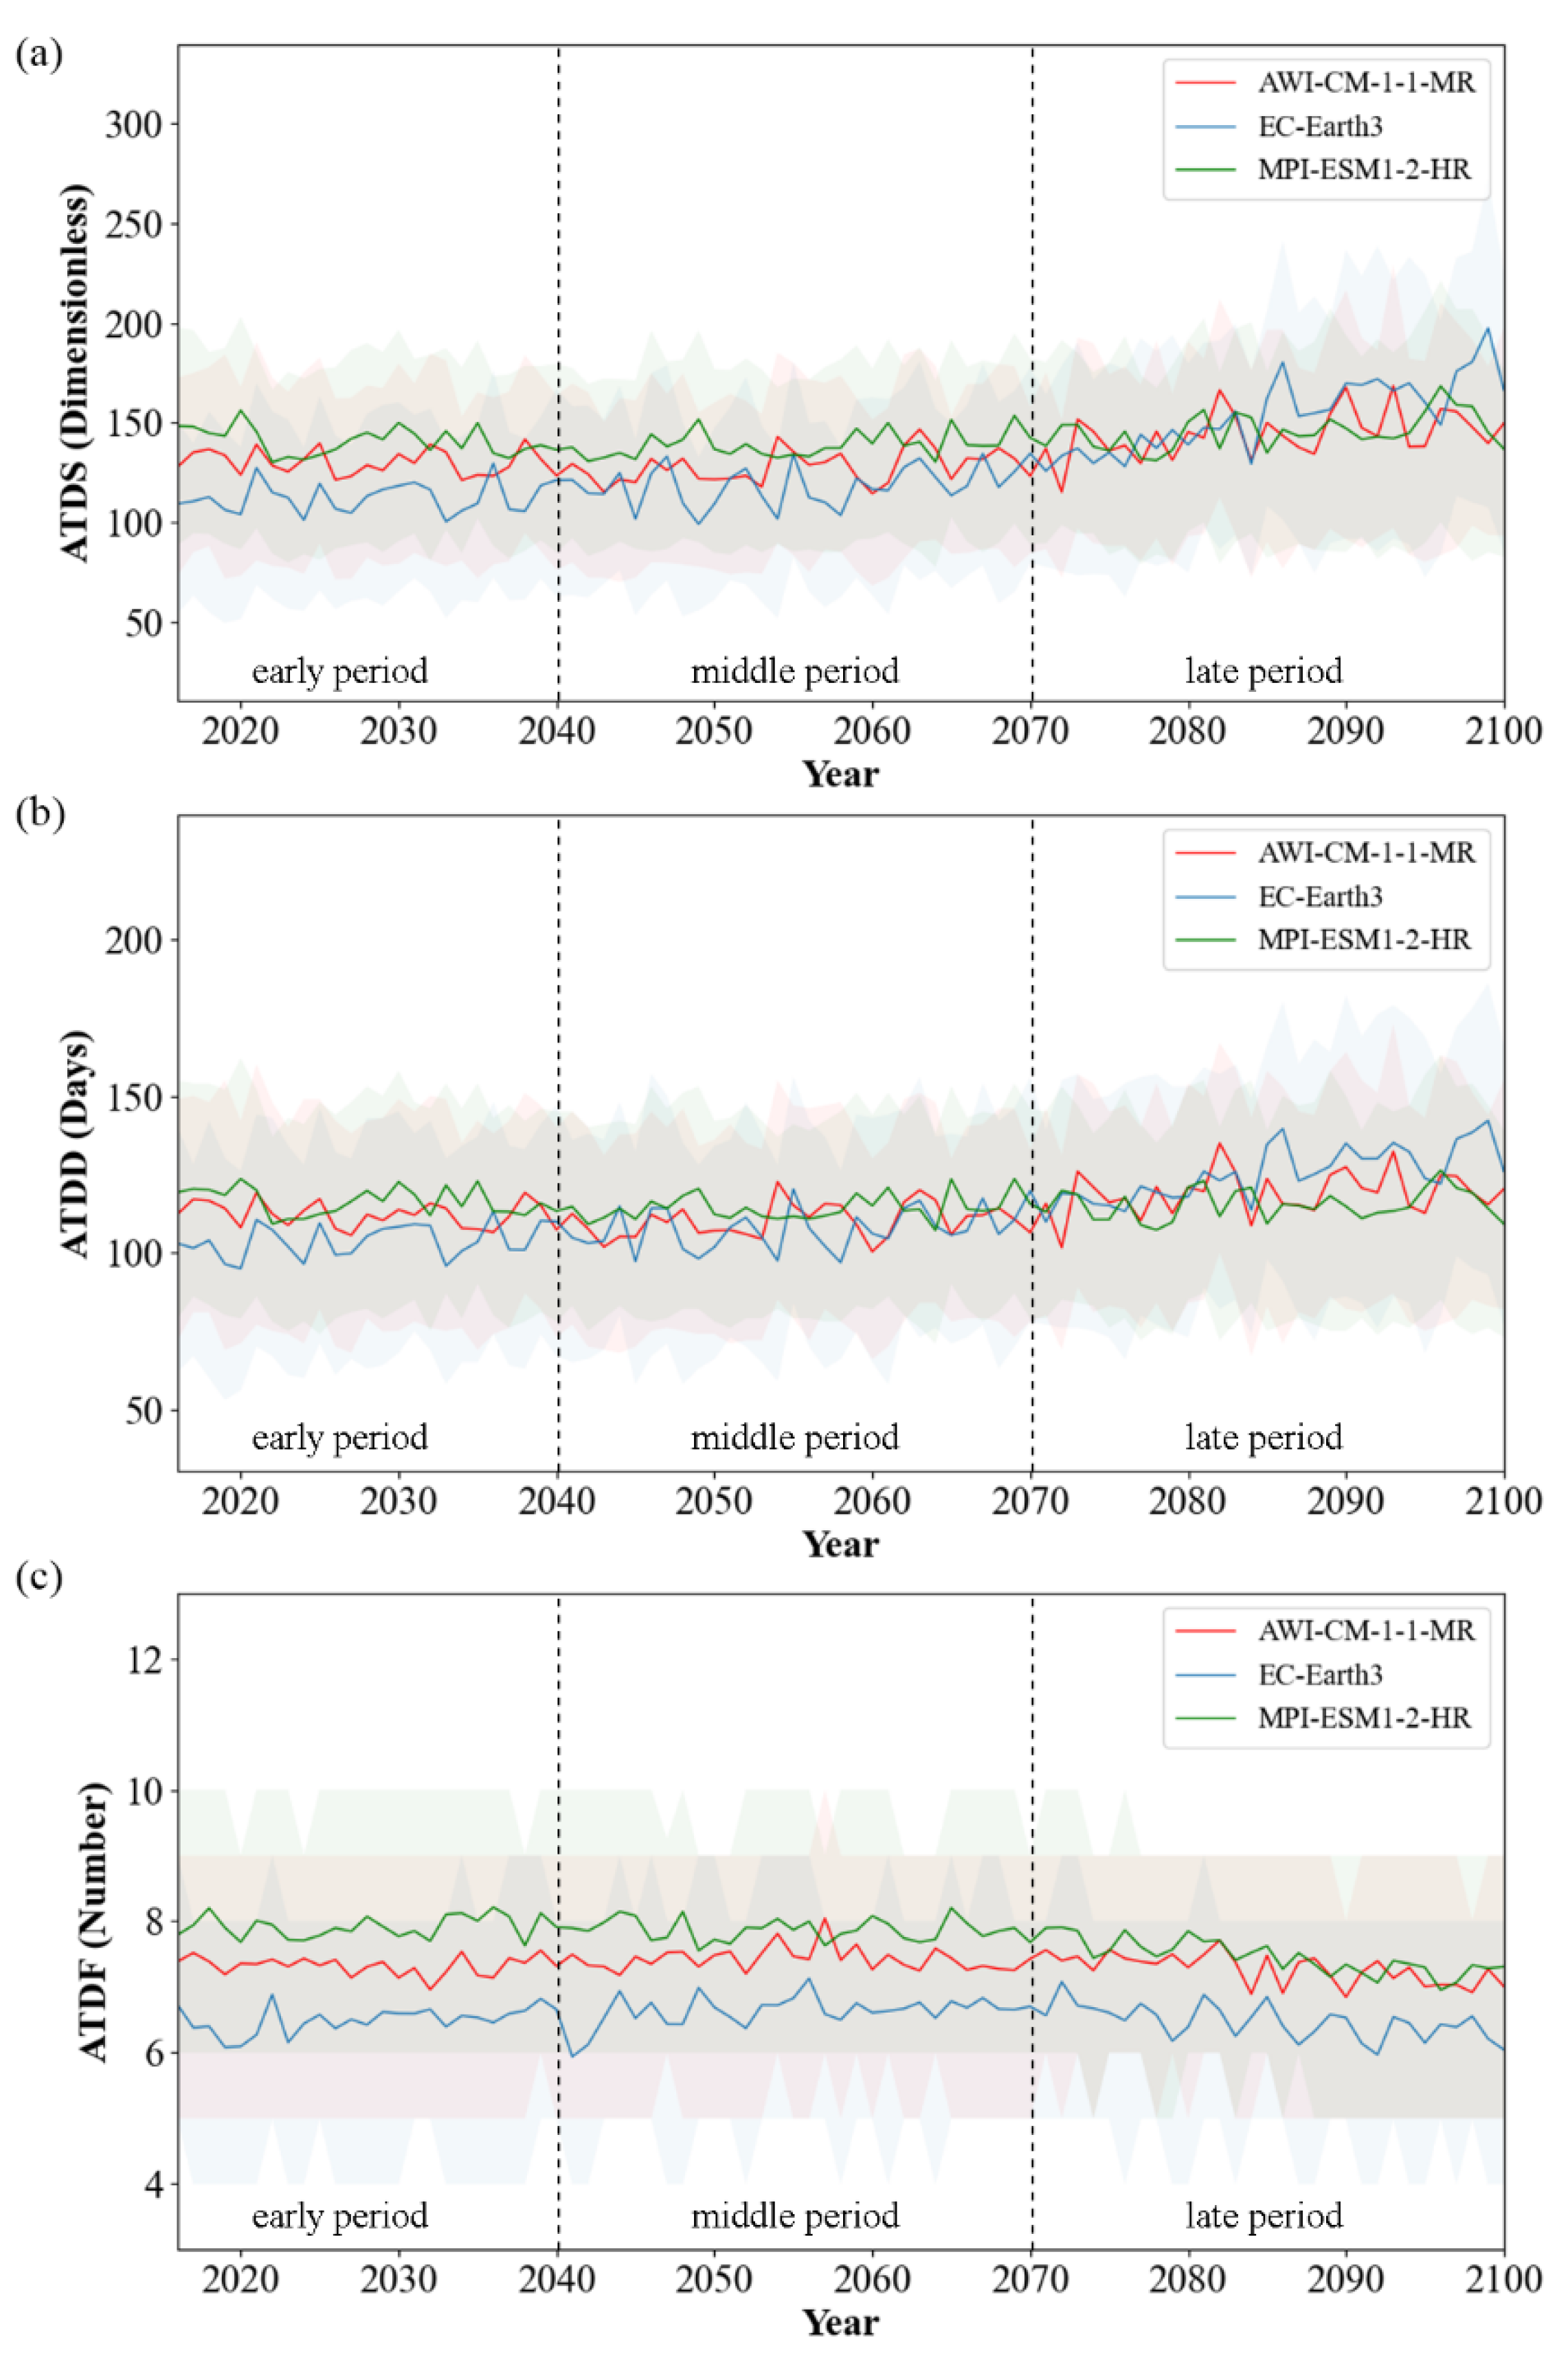
Time series were obtained by taking the mean, 25th percentile and 75th percentile, of all grids for each year of drought events’ characteristics (ATDS, ATDD, and ATDF). Figure 3 shows that there is an overall increasing trend in the severity and duration of global droughts and an overall decreasing trend in the frequency of occurrence. The increasing trend in severity and duration is greater in the later period than in the early and middle period; the decreasing trend in frequency is similarly greater in the later period than in the early and middle period. It can be seen that the rise in drought severity and drought duration obtained from the EC-Earth3 prediction is the most obvious, with both the severity and duration being lower than the other two models in the early and middle periods, and then suddenly rising over the other two models in the later period. The magnitude of change in the three drought characteristics in the early and middle periods was not very different. Combining Figure 2 and Figure 3, we can find that in the early and middle period, the interannual variation of ATDS, ATDD and ATDF is closely related to the interannual variation of precipitation; the higher the precipitation, the lower the ATDS, the shorter the ATDD, and the lower the ATDF. In the late period, the interannual variation of drought event characteristics is less closely related to the interannual variation of precipitation, and is more related to the combined effect of the four climatic factors, especially the combined effect of precipitation and minimum temperature.

3.3. Spatial Pattern of Drought Events’ Characteristics

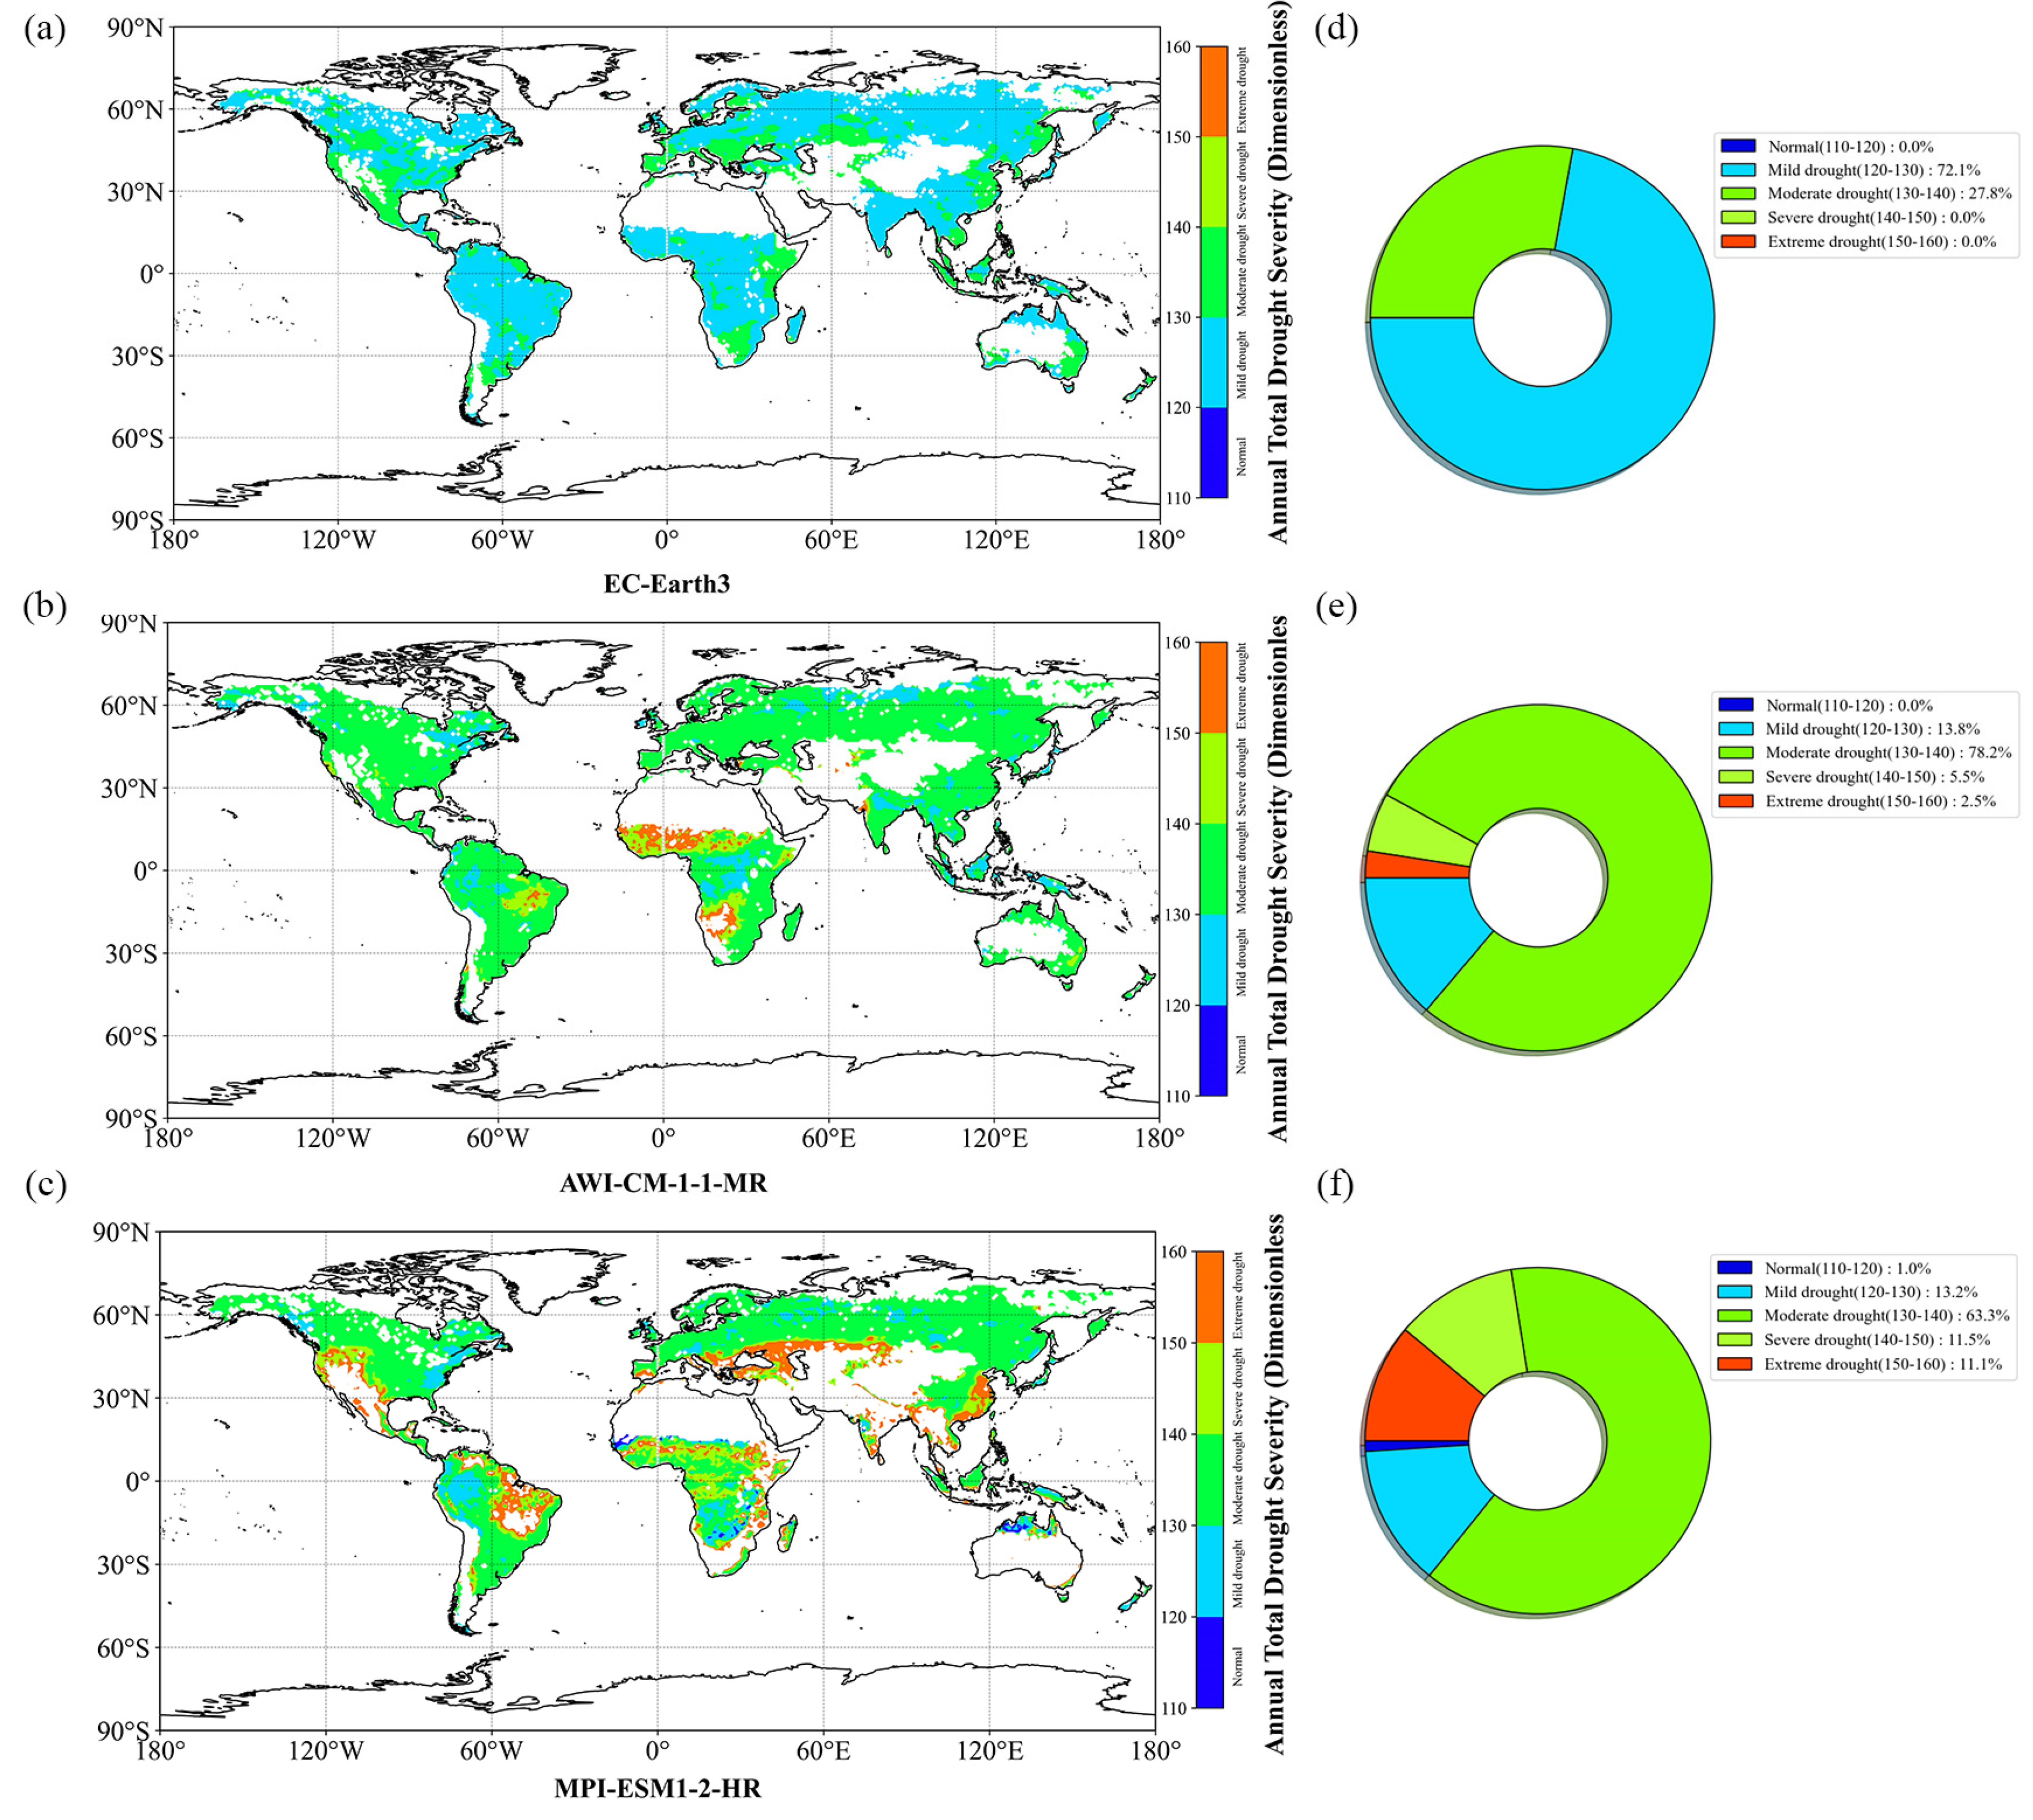
ATDS can determine the hot spot regions where drought conditions are more severe. The calculated ATDS values of the three models (EC-Earth3, AWI-CM-1-1-MR, and MPI-ESM1-2-HR) globally are shown in Figure 4. The spatial pattern of ATDS values reveals that compared with the other two models, the EC-Earth3−forecast ATDS values are lower and concentrated in the mild drought category. The spatial pattern of ATDS predicted by AWI-CM-1-1-MR and MPI-ESM1-2-HR is similar, concentrated in moderate drought, but the ATDS predicted by MPI-ESM1-2-HR is greater in some regions. Combining the ATDS results predicted by the three models, it can be inferred that two−thirds of the world will face moderate drought in the future, with severe or even extreme drought in Central Africa and eastern South America.
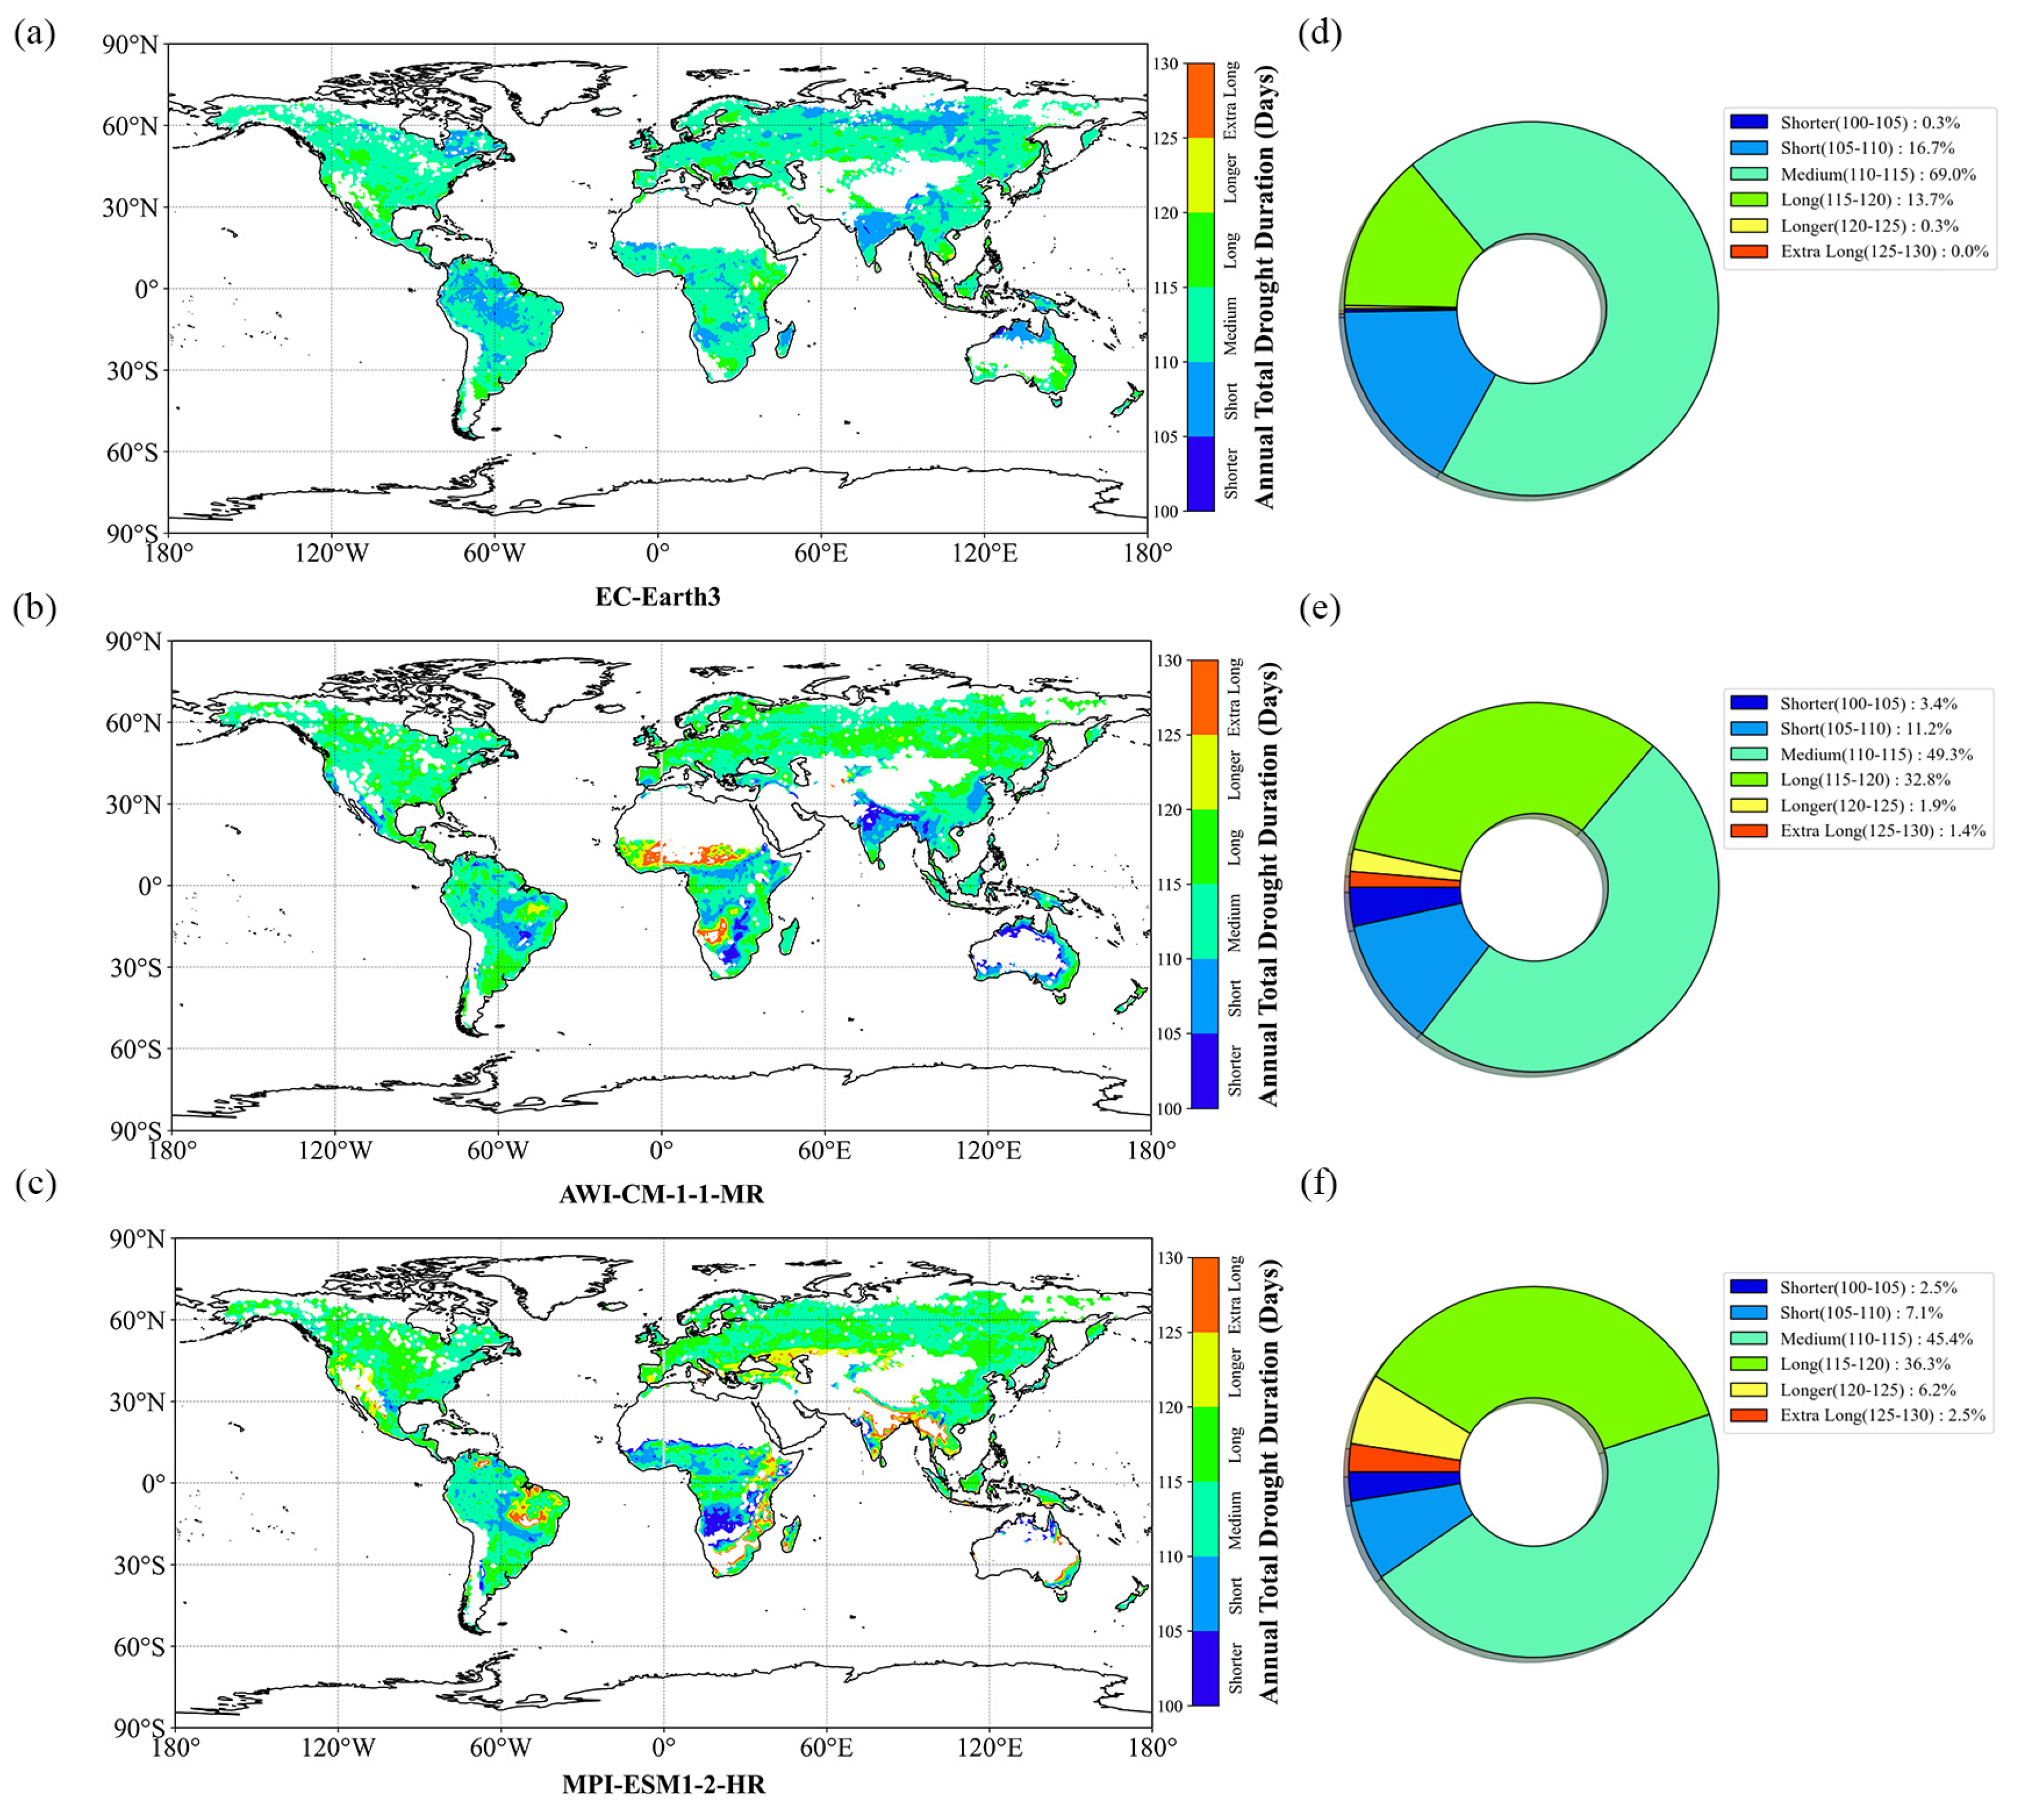
The calculated ATDD values of the three models (EC-Earth3, AWI-CM-1-1-MR, and MPI-ESM1-2-HR) worldwide are shown in Figure 5. The spatial pattern of the ATDD values shows that, compared with the other two models, the ATDD value from EC-Earth3 is lower and concentrated in the medium duration. The predicted ATDD values of AWI-CM-1-1-MR and MPI-ESM1-2-HR are generally consistent, concentrated in medium and long duration, but the predicted ATDD values of MPI-ESM1-2-HR are higher in some regions. Combining the ATDD results predicted by the three models, one can state that two−thirds of the world is projected to endure droughts typically longer than 115 days in the future. Furthermore, these regions are projected to experience droughts nearly one−third of the time.
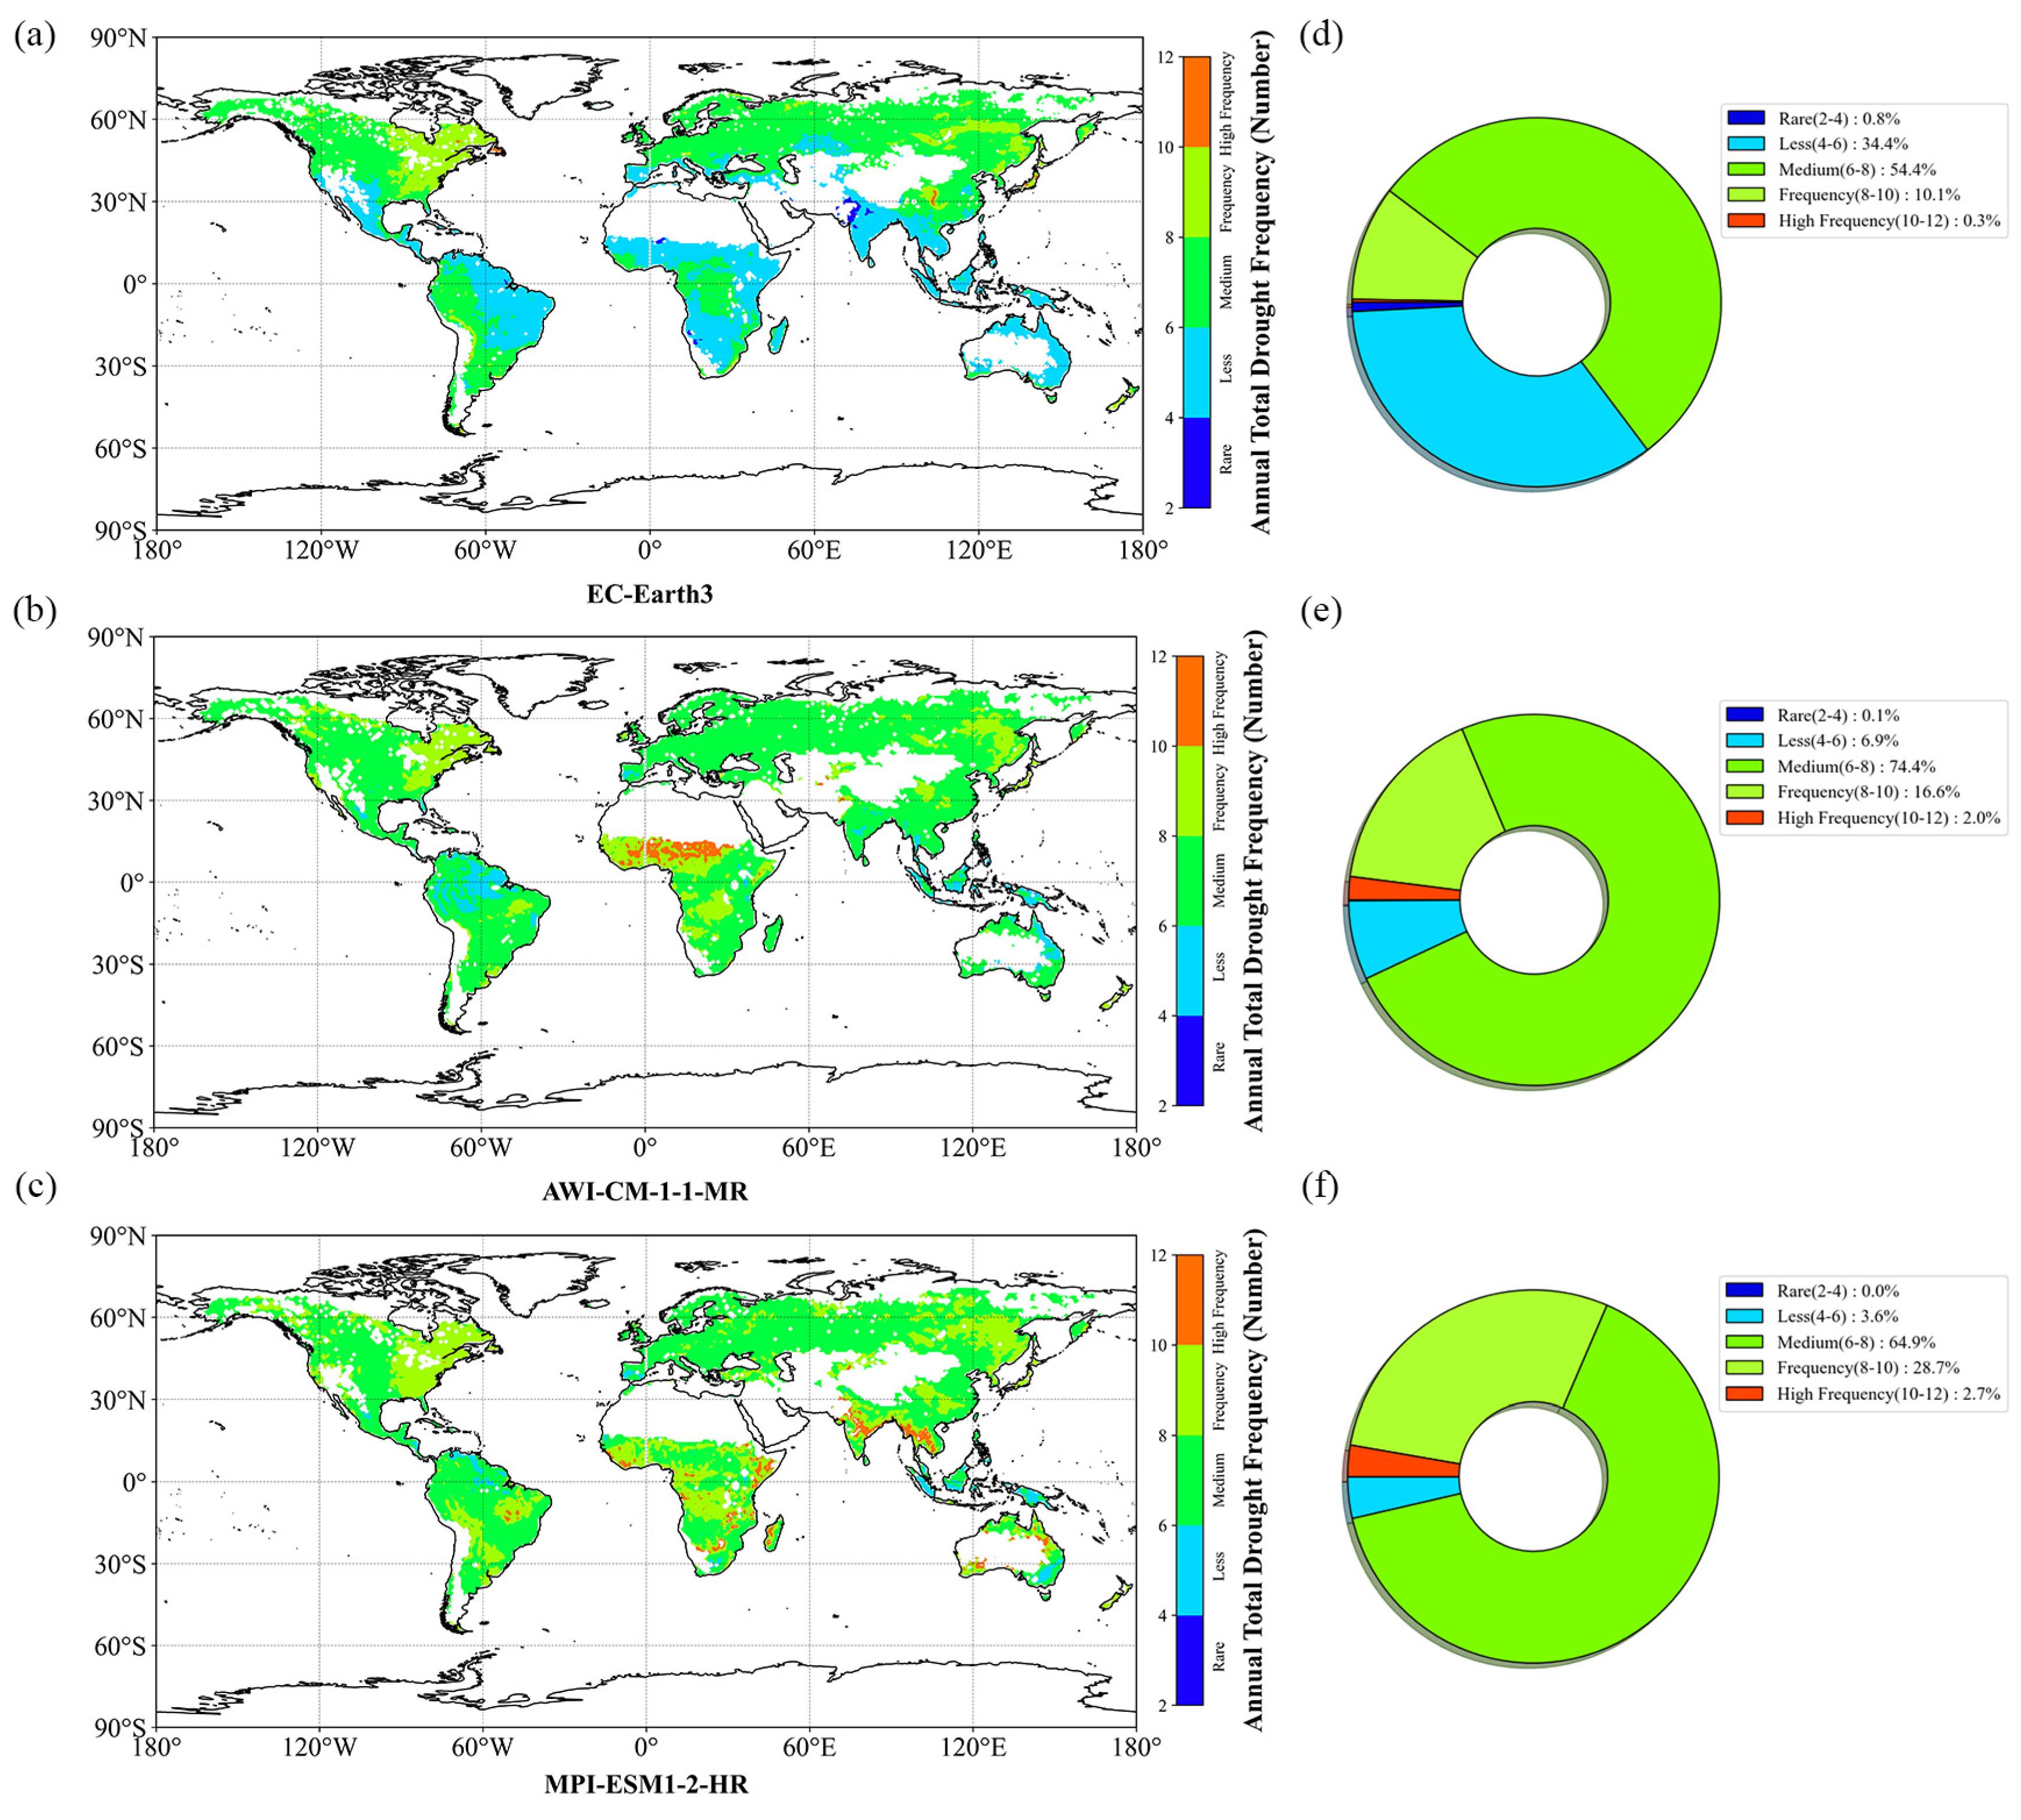
The calculated ATDF values of the three models (EC-Earth3, AWI-CM-1-1-MR, and MPI-ESM1-2-HR) worldwide are shown in Figure 6. The spatial pattern of ATDF values shows that, compared with the other two models, the ATDF values projected by EC-Earth3 are lower and concentrated in rare and moderate frequency. The projected ATDF values of AWI-CM-1-1-MR and MPI-ESM1-2-HR are generally consistent, with moderate and frequent occurrence. Combining the ATDF results projected by the three models, we can opine that most regions around the world are expected to experience six to eight drought events per year in the future. In addition, from the spatial pattern of ATDF values, it can be inferred that drought may occur in both dry and wet areas.

3.4. Trends of Drought Events’ Characteristics

Depending on the ATDS variation trends, drought severity can be identified as weakening or intensifying over time. The spatial pattern of variation trends for ATDS from 2016 to 2100 worldwide is shown in Figure 7. The spatial pattern of ATDS change trend projected by the three models is generally consistent, with only the upward trend being significant (p < 0.05). Compared with the other two models, the ATDS projected by MPI-ESM1-2-HR presents an increasing trend in fewer areas and a declining trend in more extensive areas. Based on the ATDS trend results projected by the three models, drought severity in southwest North America, northern South America, southern Europe, western Asia, and Southwest Africa presents a significant increasing trend (p < 0.05). In contrast, other regions present a declining trend during 2016–2100.
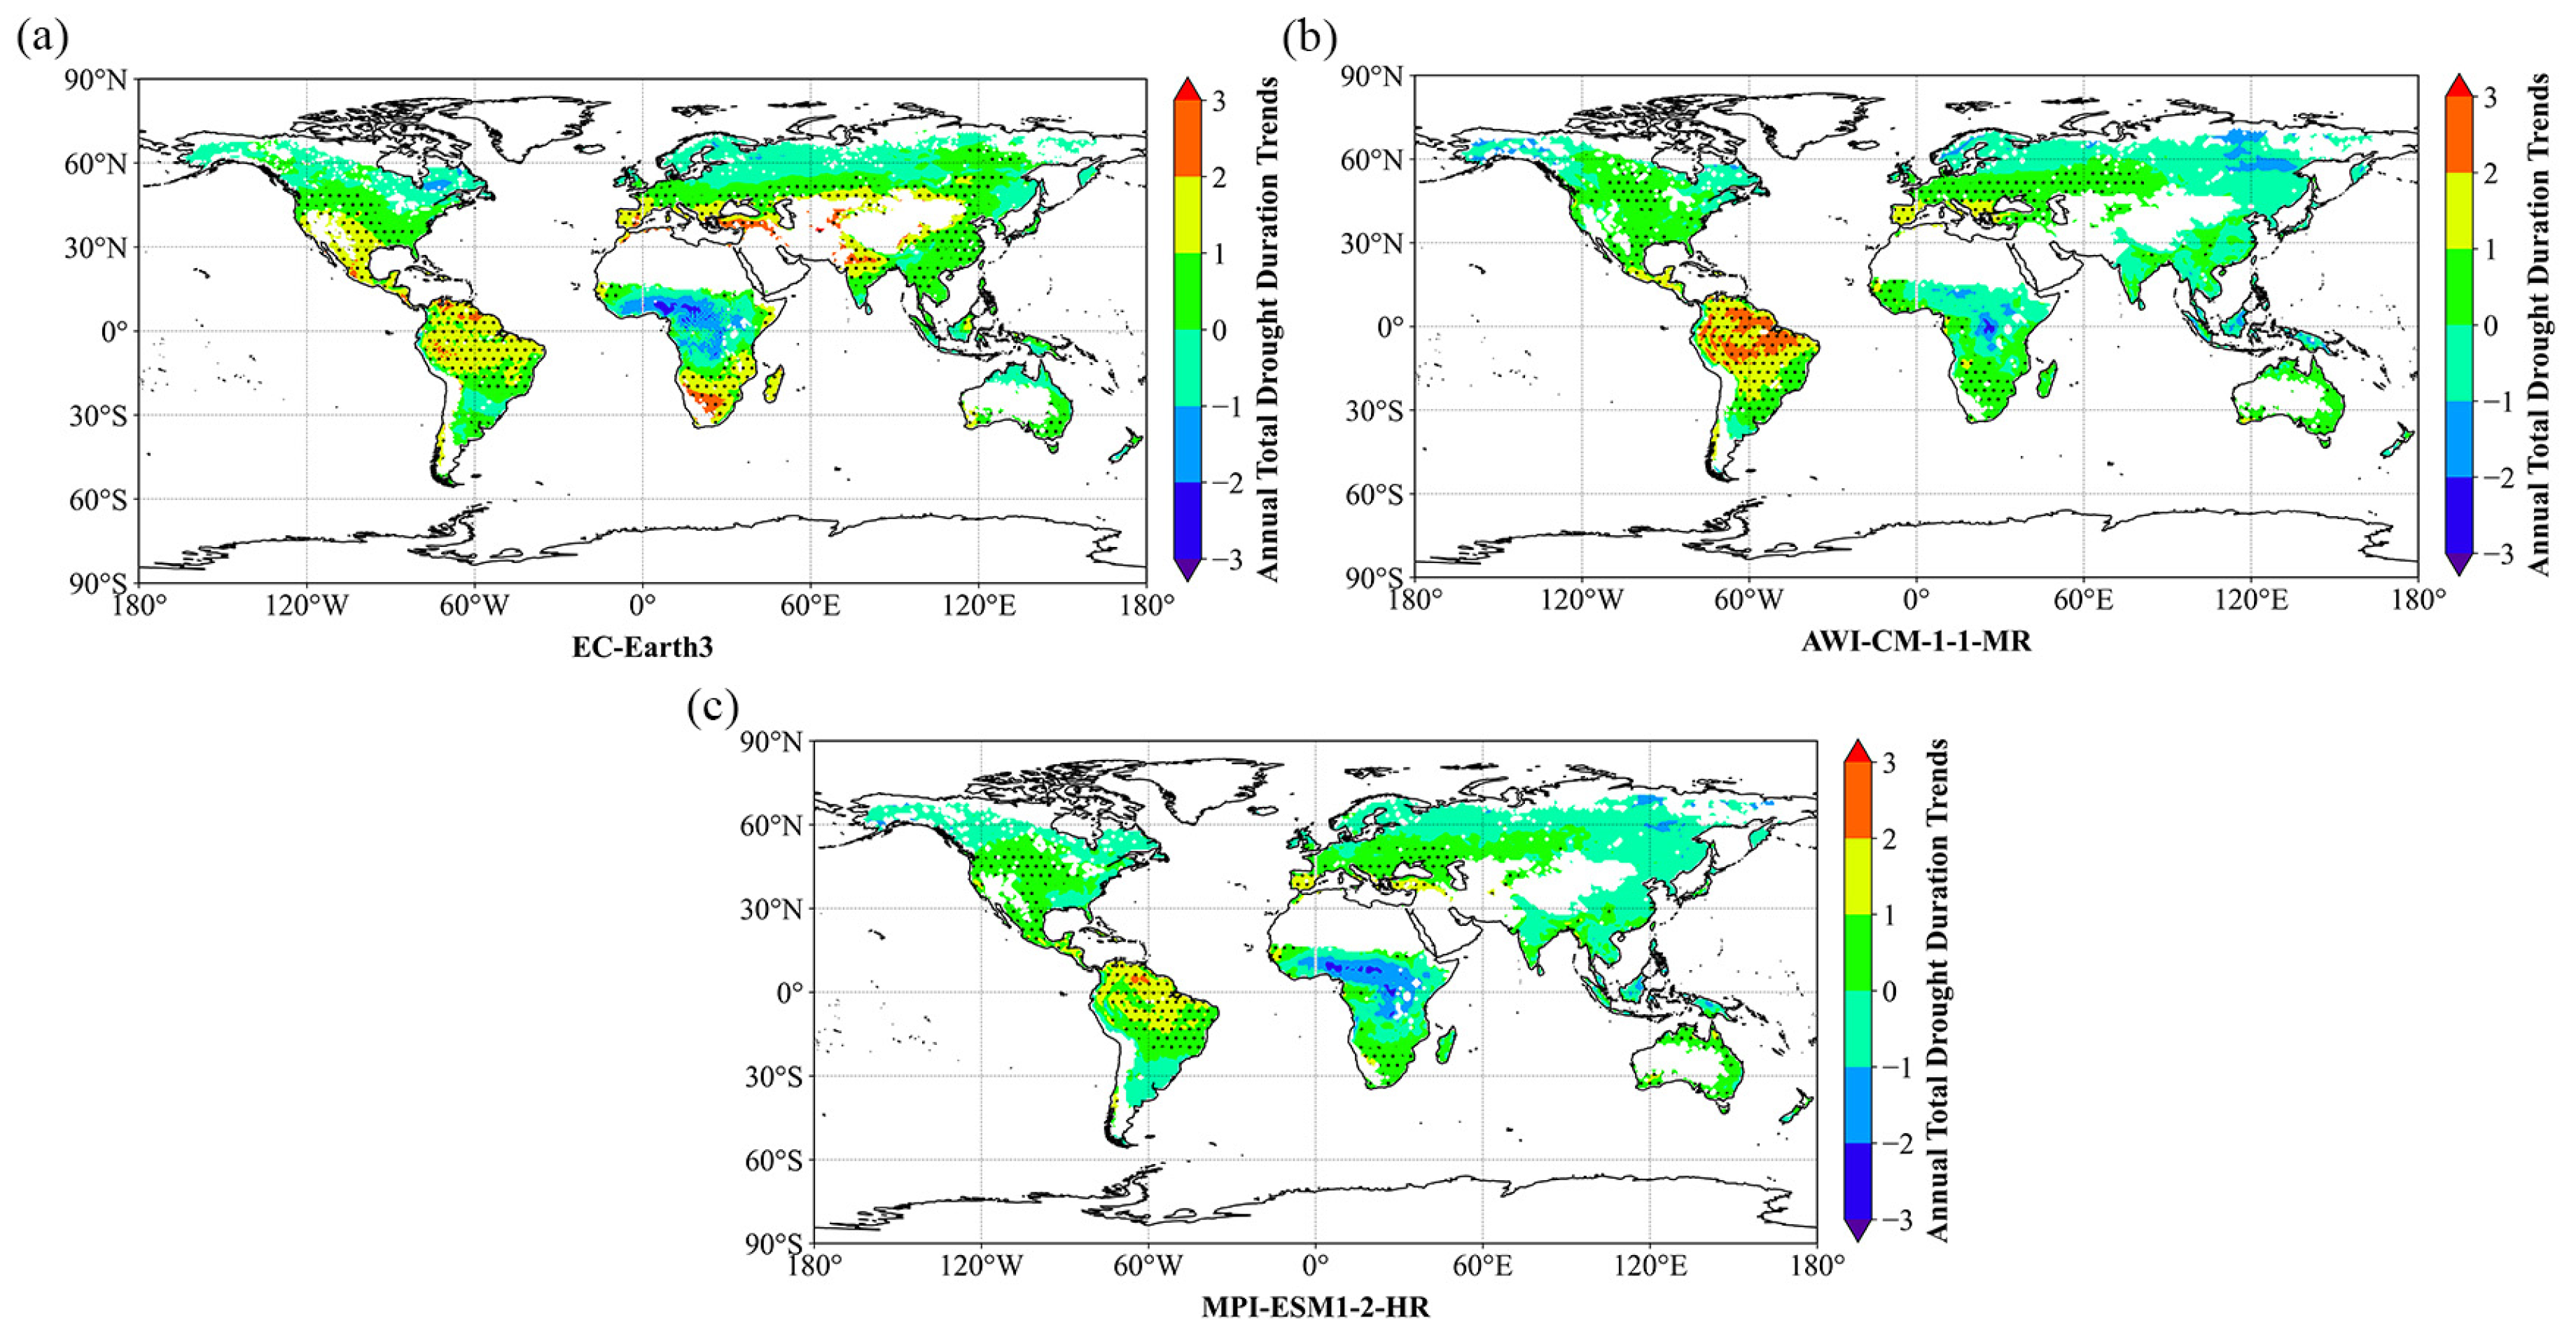
Depending on the ATDD variation trends, drought duration can be identified as shorter or longer over time. The worldwide spatial pattern of variation trends for the ATDD is shown in Figure 8. The spatial pattern of the ATDD change trend predicted by the three models is generally consistent, and only the increasing trend is significant (p < 0.05). Compared with the other two models, the ATDD projected by MPI-ESM1-2-HR presents an increasing trend in fewer areas and a declining trend in more extensive areas. Based on the ATDD trend results projected by the three models, the duration of drought in southwest North America, northern South America, southern Europe, western Asia, and Southwest Africa presents a significant increasing trend (p < 0.05). In contrast, other regions present a declining trend during 2016–2100.
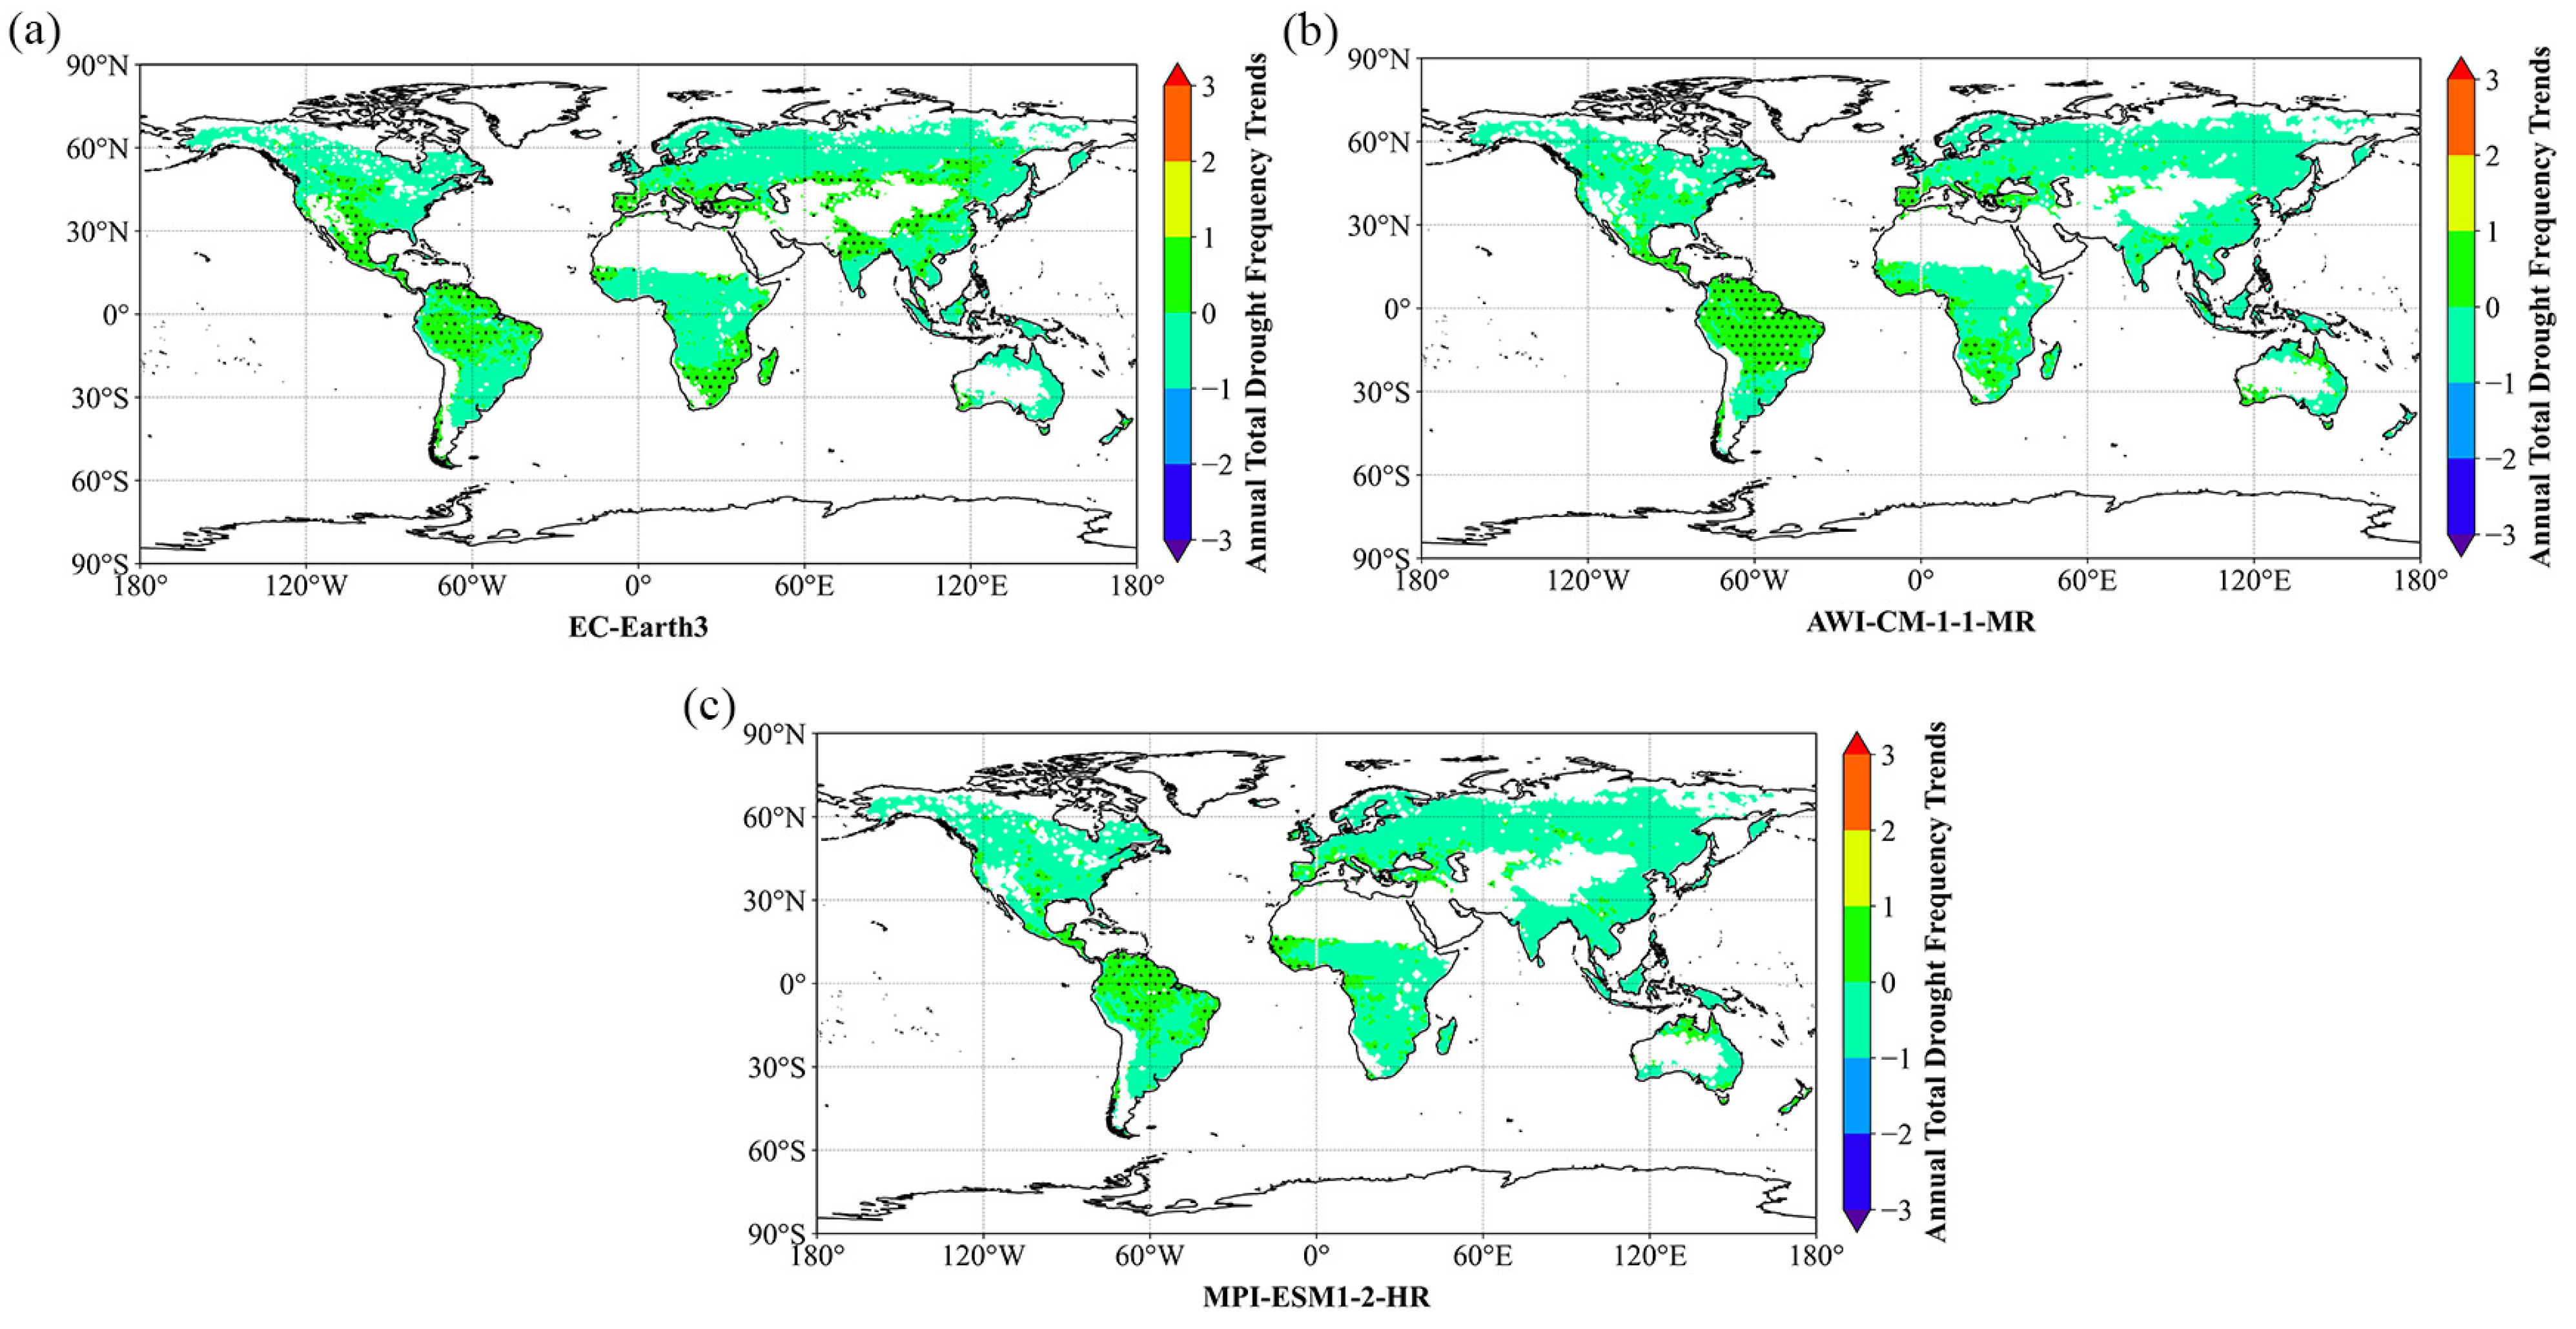
Depending on the ATDF variation trends, the frequency of drought events can be identified as increasing or reducing over time. The spatial pattern of variation trends of ATDF globally is shown in Figure 9. The spatial pattern of the ATDF change trend projected by the three models is consistent. Most of the global ATDF change trend is decreasing, but is not significant, and only some regions with the increasing trends are significant (p < 0.05). Based on the ATDF trends projected by the three models, only northern South America, southwest Europe, and Southwest Africa show an increasing trend of drought frequency during 2016–2100. The increasing trend is significant (p < 0.05), while other regions present a declining trend.

3.5. Partial Correlation between Drought Events and Climatic Factors

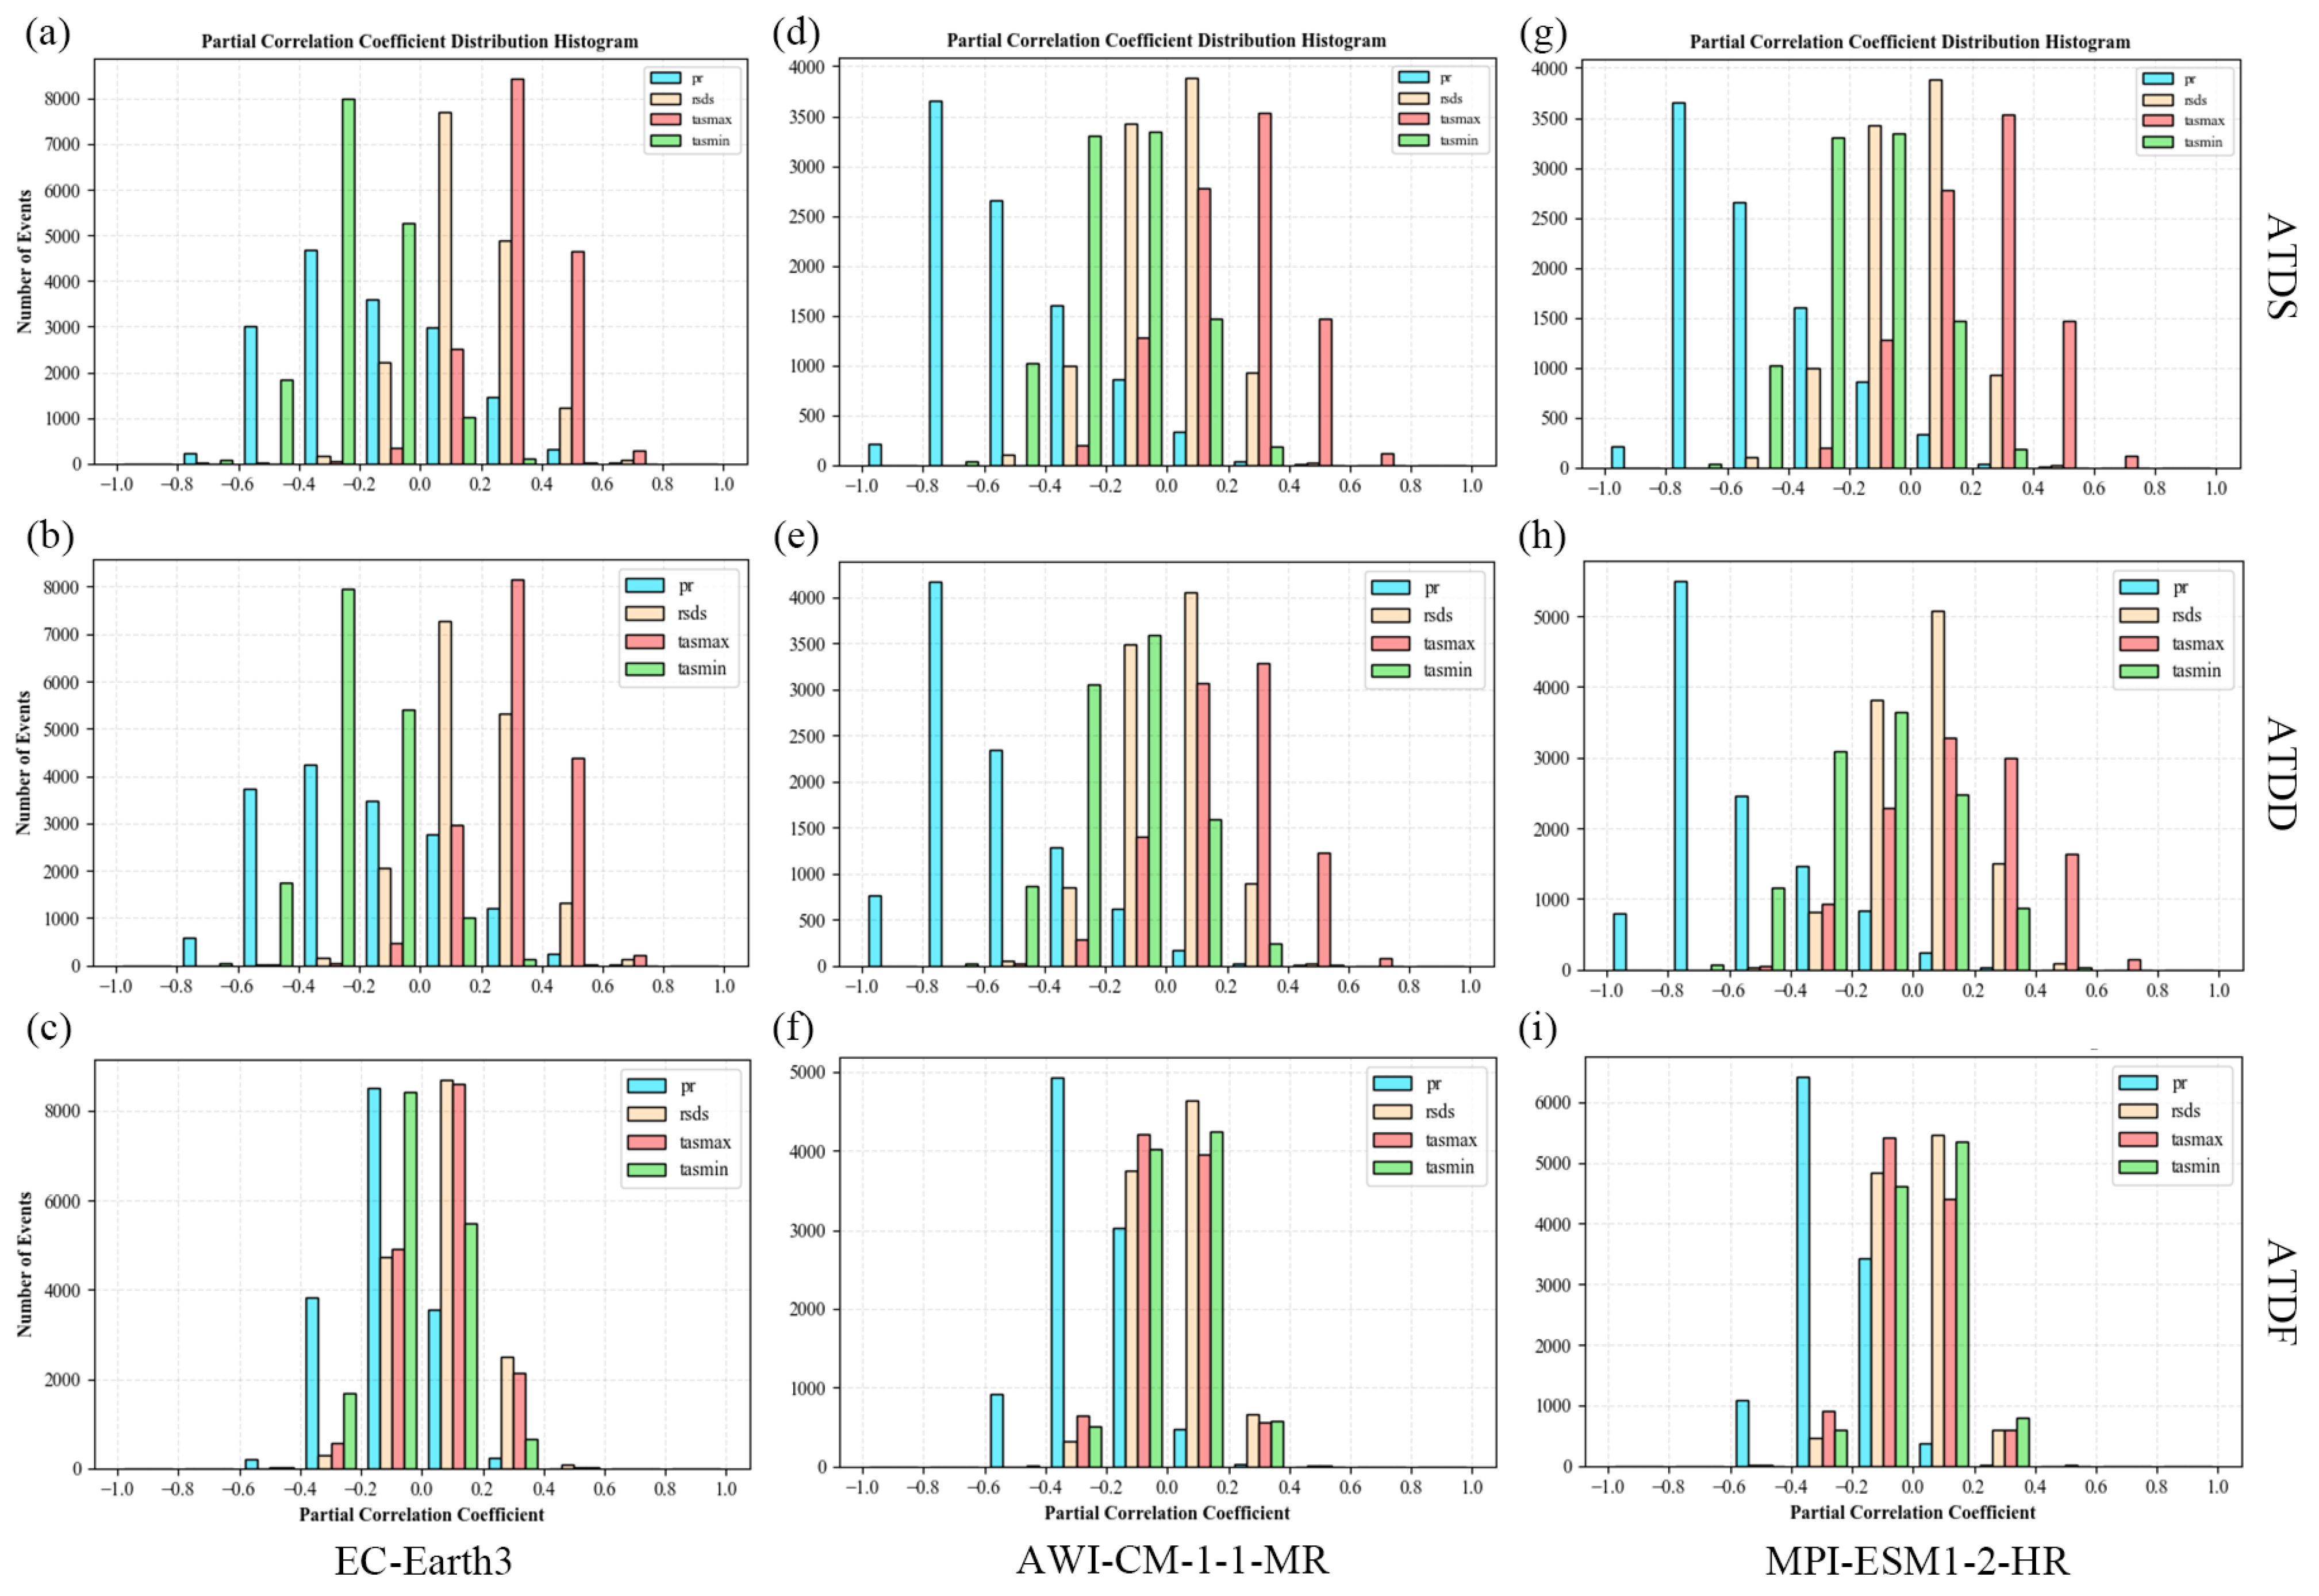
Results from the partial correlation analysis between the drought events’ characteristics projected by the three models and climatic factors (Figure 10) show that there is a negative correlation between precipitation and the three drought characteristics, a positive correlation between the maximum temperature and the three drought characteristics, and a positive or negative correlation between the minimum temperature, the net surface radiation and the three drought characteristics. Precipitation is the variable with the highest correlation to drought characteristics. Among them, the correlation degree of ATDS and ATDD with climatic factors is precipitation > maximum temperature > minimum temperature > net surface radiation.
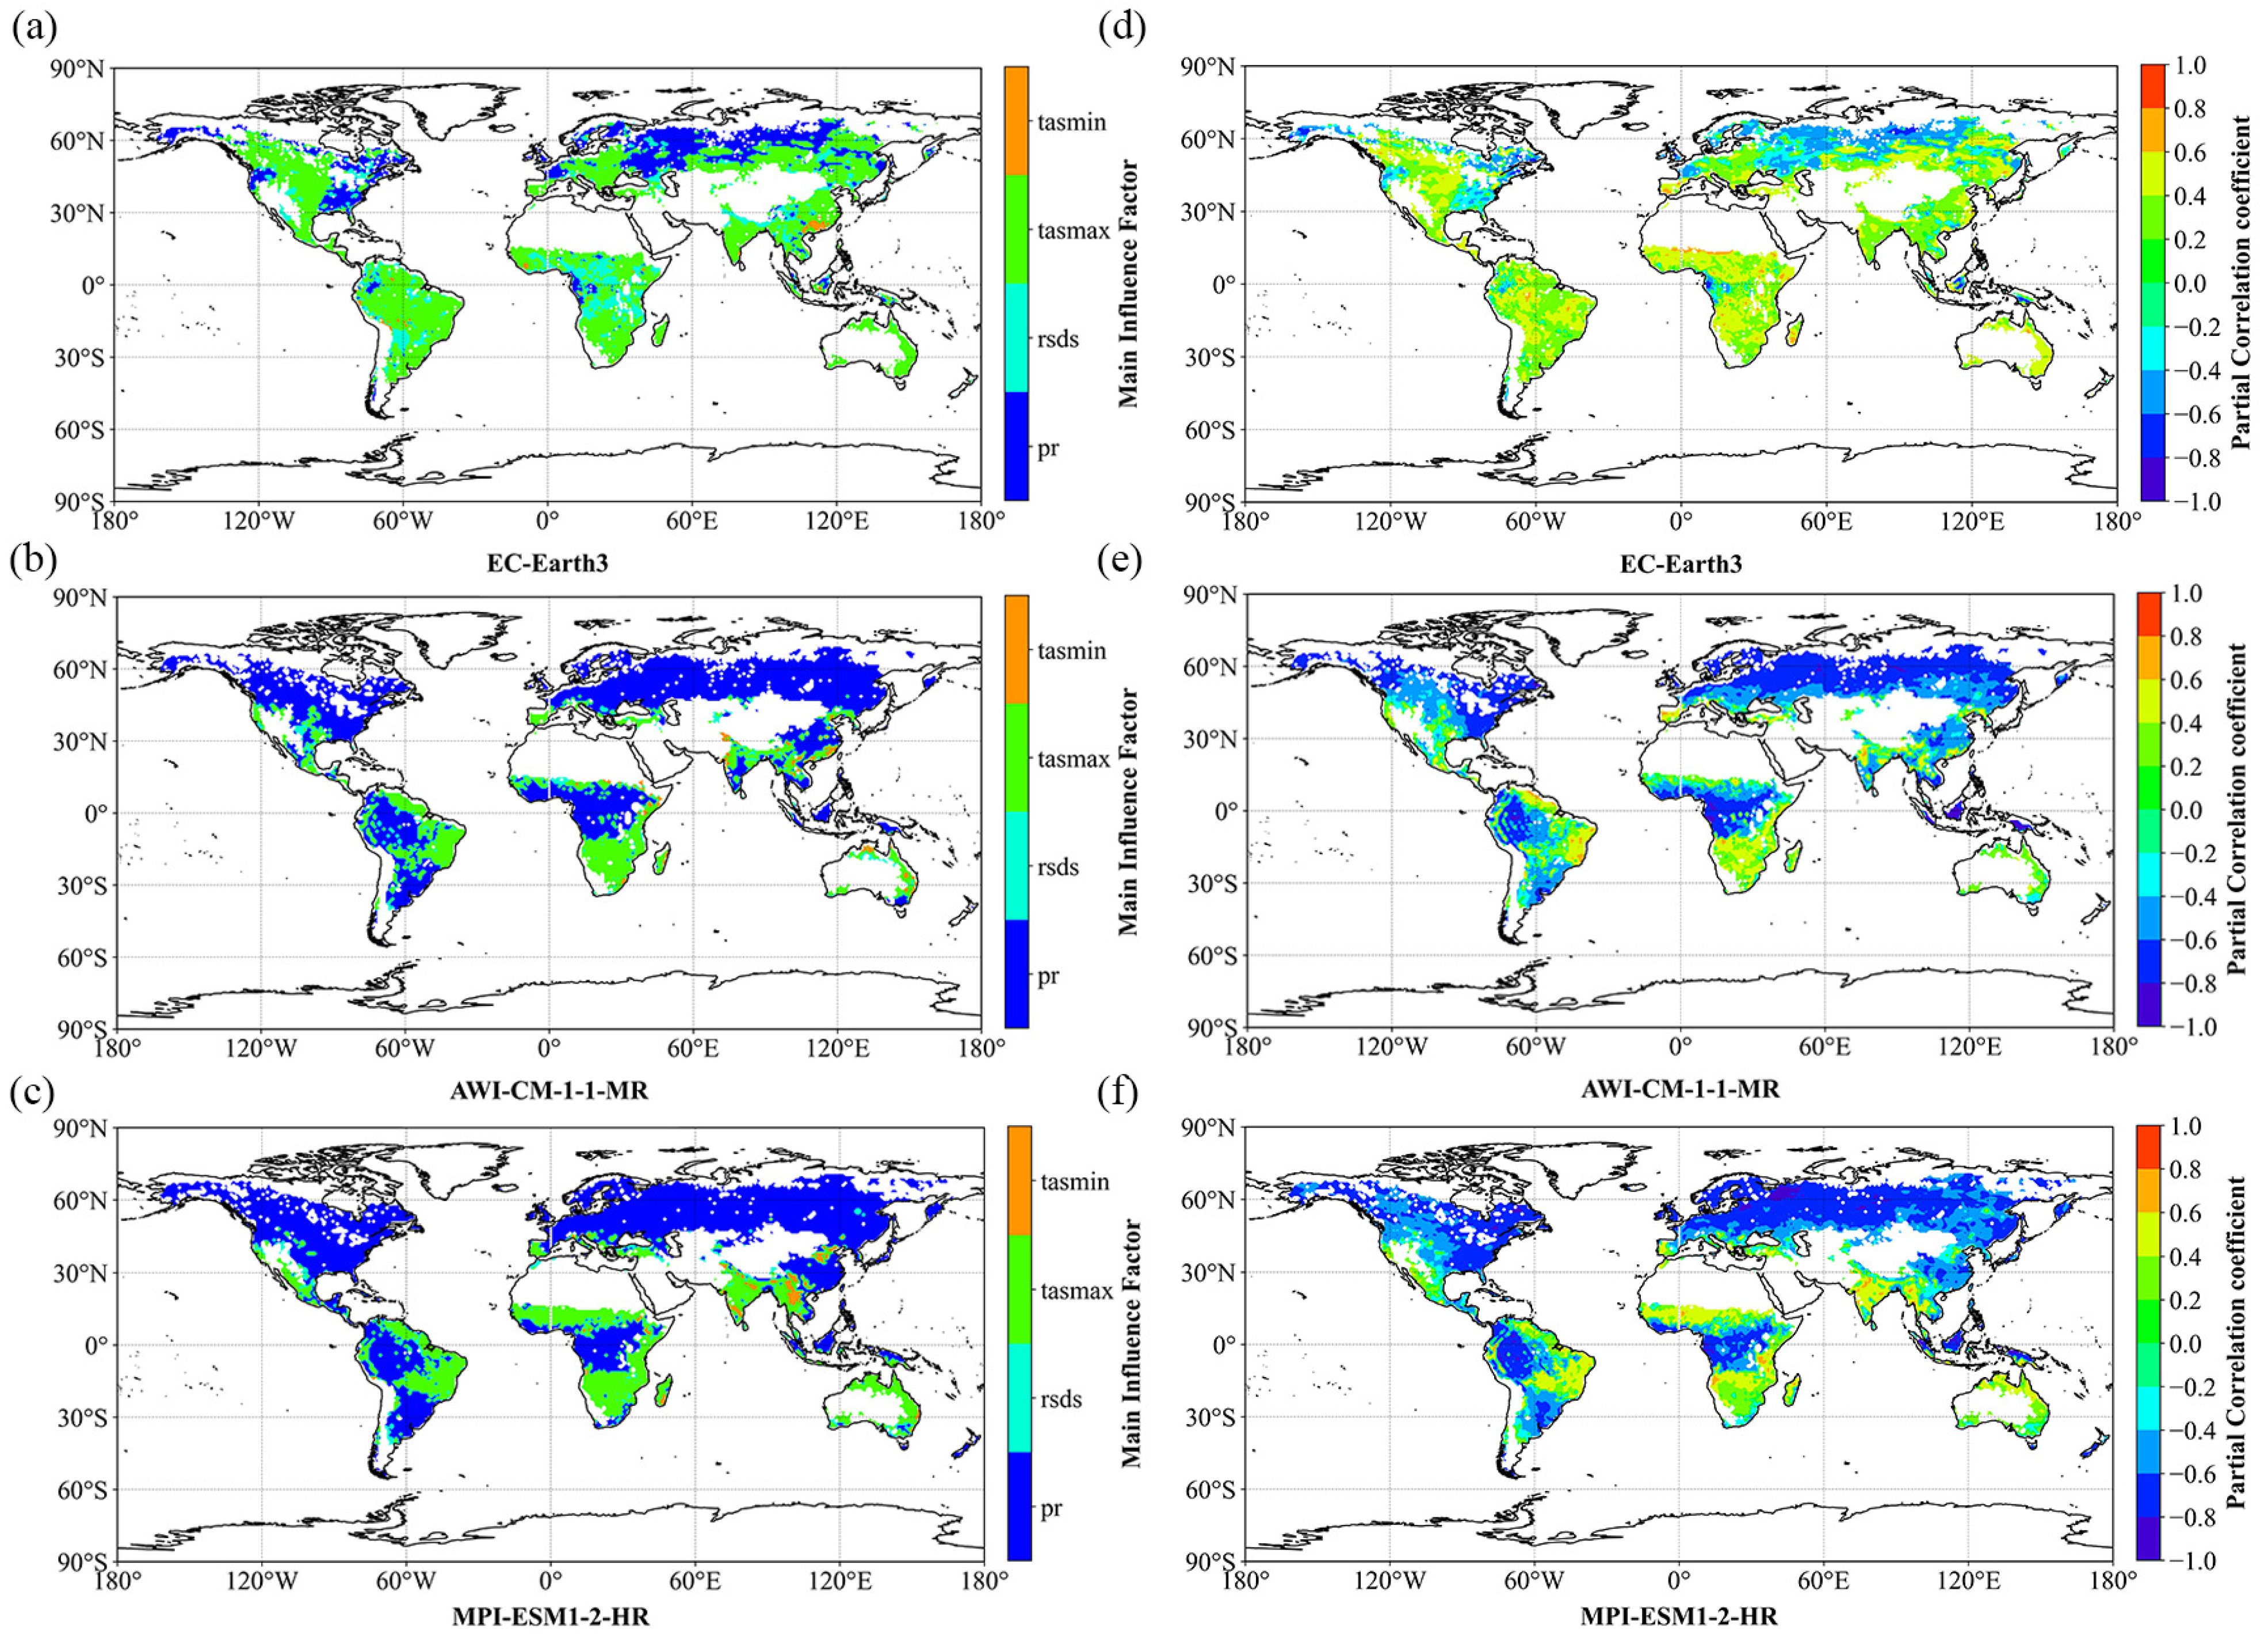
Figure 11 shows that according to drought projections from EC-Earth3, drought severity in most regions including South America, Africa and southern Asia is mostly driven by the maximum temperature and net surface radiation. In North Asia, northern Europe and eastern North America, it is mainly driven by precipitation. According to the drought prediction of AWI-CM-1-1-MR and MPI-ESM1-2-HR, drought severity in most regions including Asia, Europe, North America, western South America and central Africa is mainly driven by precipitation, and the corresponding partial correlation coefficient is also larger. At the same time, it is driven by the maximum temperature and net surface radiation in fewer regions.
Figure 12 shows that according to drought projections from EC-Earth3, drought duration in most areas including South America, Africa and southern Asia is mainly driven by the maximum temperature and net surface radiation. In North Asia, northern Europe and eastern North America, it is mainly driven by precipitation. According to the drought predictions from AWI-CM-1-1-MR and MPI-ESM1-2-HR, drought duration in most areas including Asia, Europe, North America, western South America and central Africa is mainly driven by precipitation, and the corresponding partial correlation coefficient is also larger. However, in a few regions, this is driven by the maximum temperature and net surface radiation.
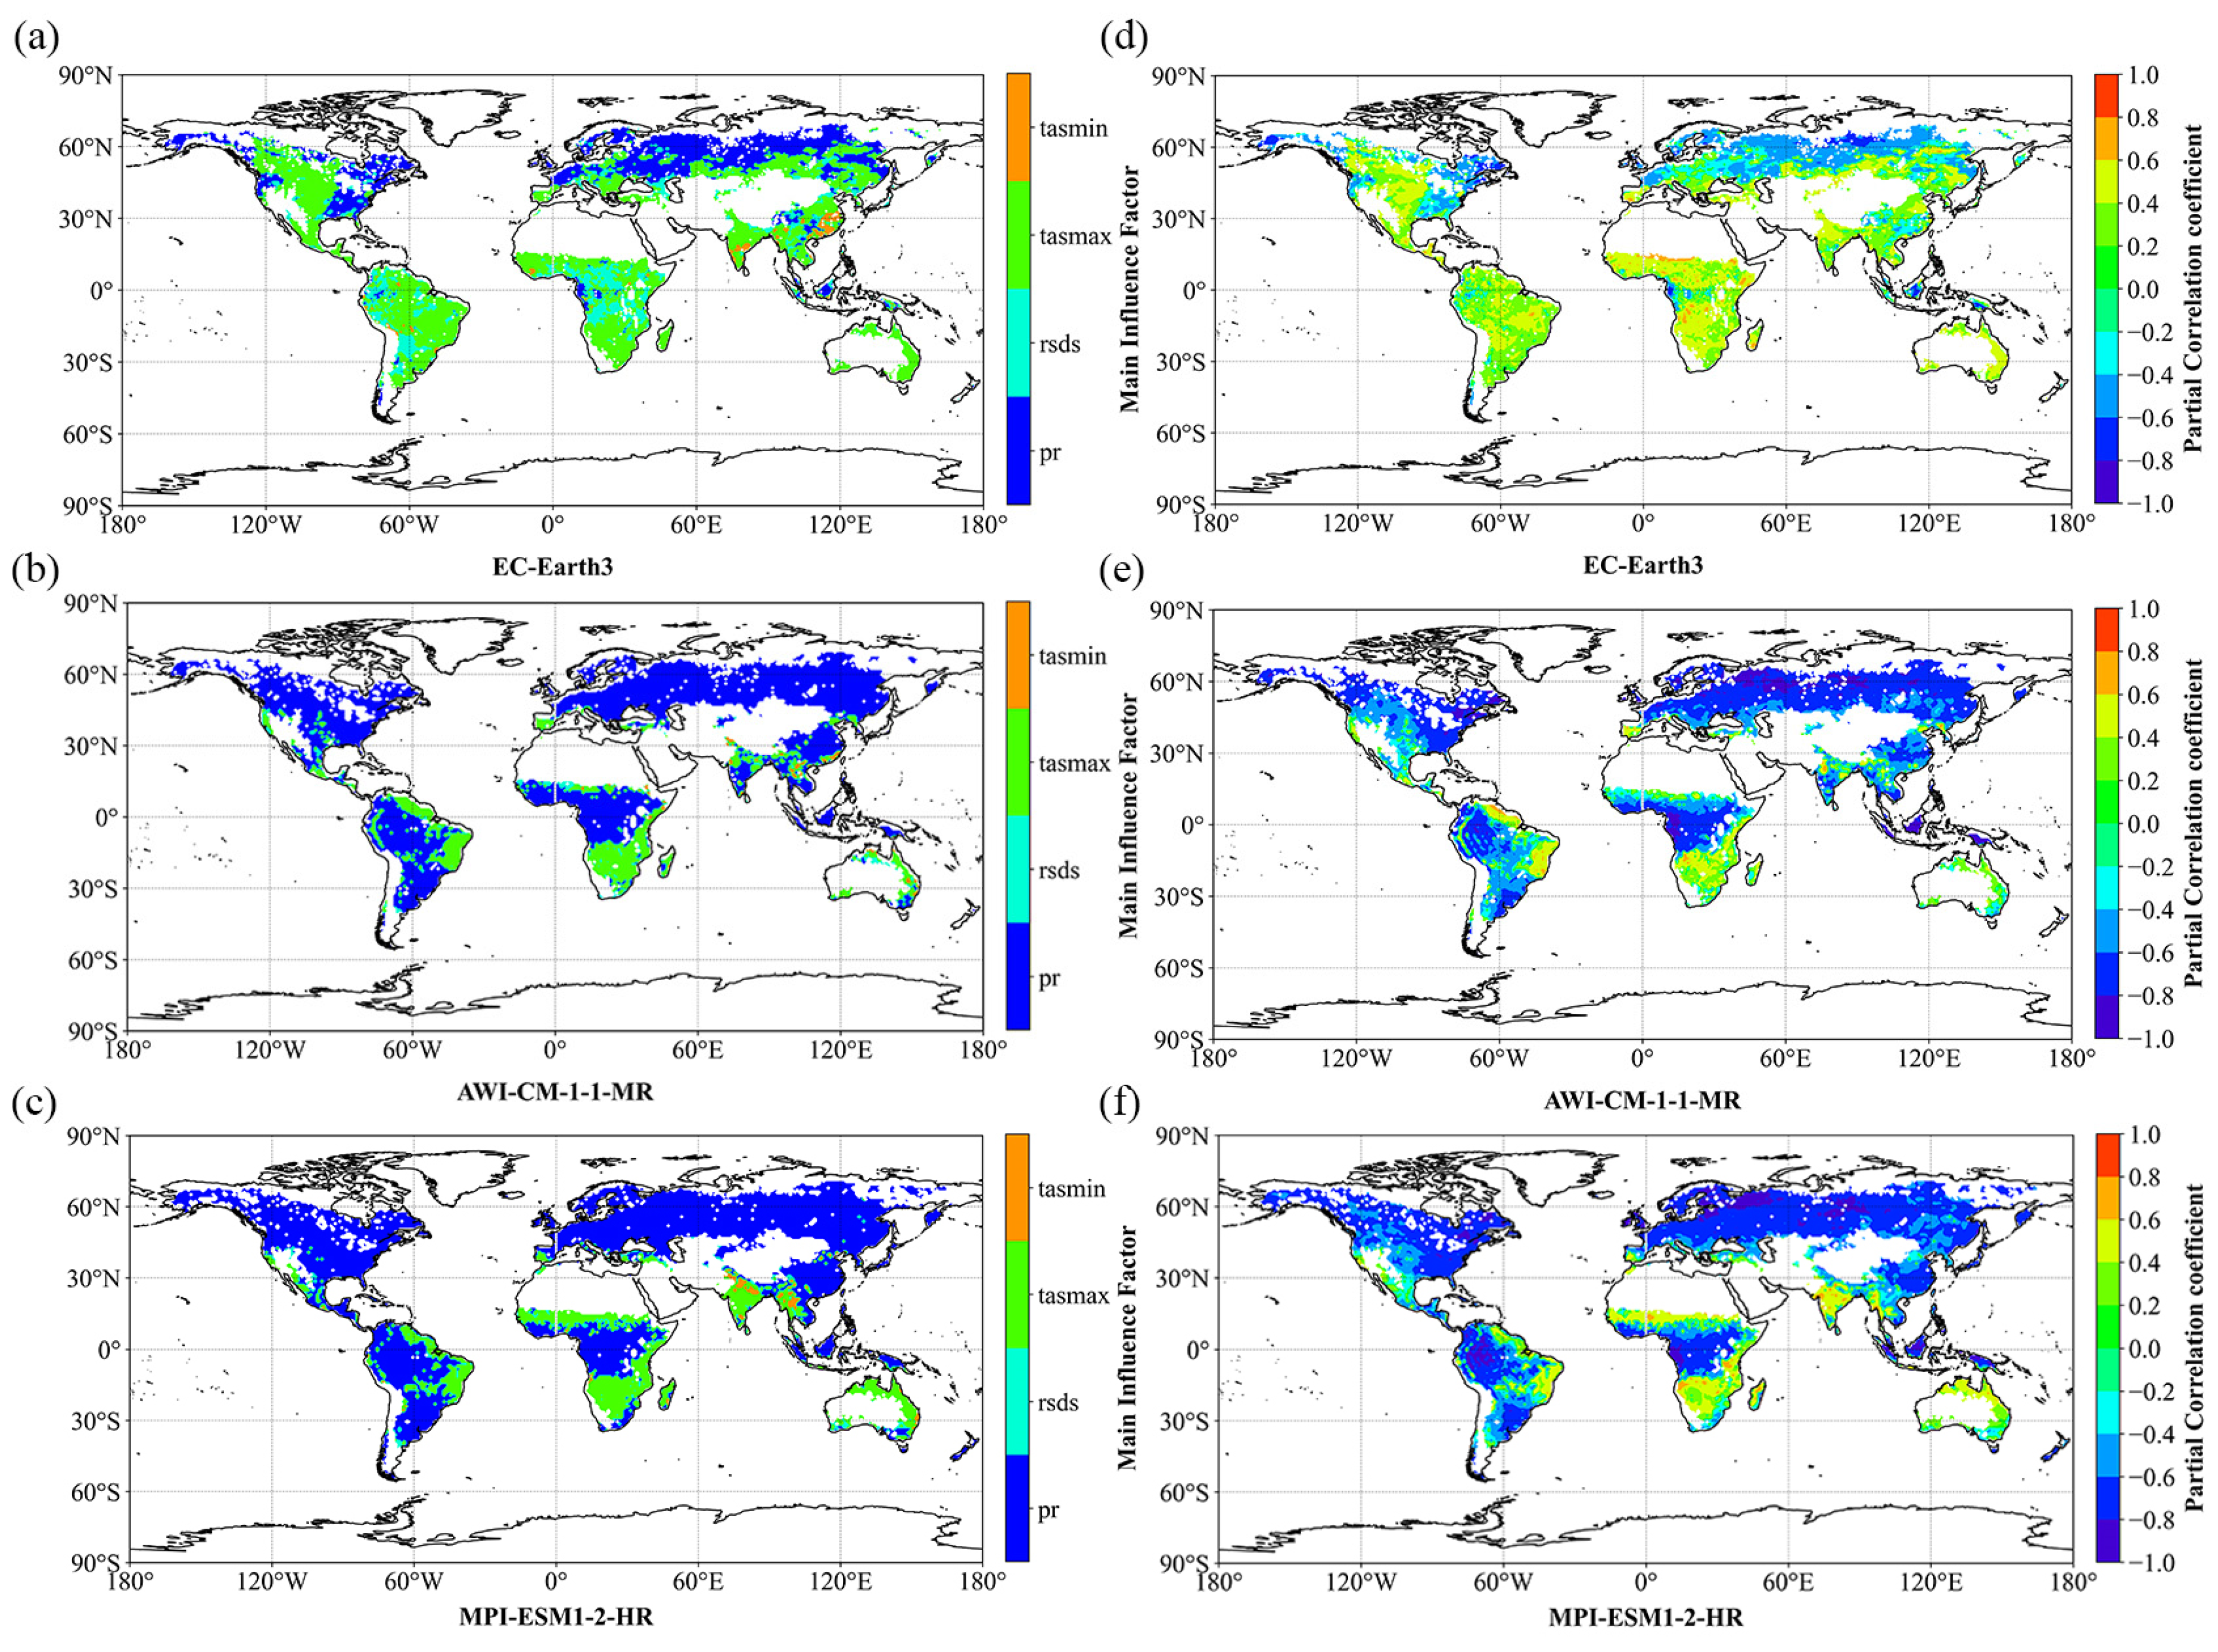
Figure 13 shows that, according to drought projections from EC-Earth3, drought frequency in most regions including North America, Africa, Europe and northern Asia is mainly driven by the maximum temperature, net surface radiation and precipitation, while in South America and southern Asia, it is mainly driven by minimum temperature. According to drought predictions from AWI-CM-1-1-MR and MPI-ESM1-2-HR, drought frequency in most regions including Asia, Europe, North America, southwest South America and central Africa is mainly driven by precipitation. While in fewer regions, it is mostly driven by maximum temperature and net surface radiation, but their corresponding correlation coefficient is small.

4. Discussion

Based on three GCMs from CMIP6 forced with SSP585, we used the daily SPEI [55] to project drought conditions for the period 2016–2100. This methodology has been previously applied to drought evaluation and monitoring, and its results have been extensively validated [29,30,56]. While the monthly SPEI is suitable for assessing meteorological, agricultural, hydrological, and socio−economic droughts, it falls short in effectively identifying abrupt droughts with durations of less than one month [24]. Monthly SPEI can only determine the first and last months of a drought and fails to detect the exact beginning and ending dates of drought events [24,57]. The new model addresses the deficiencies of the monthly SPEI for drought evaluation and monitoring. However, it is worth noting that the estimation of PET in the daily SPEI is based on the Hargraves−Samani formula [58], which may lead to an overestimation of evapotranspiration in windy areas. This uncertainty in PET eventually affects the accuracy of the daily SPEI, potentially resulting in exaggerated future droughts in windy regions [59].
This study excluded marine, desert, and cold regions. Desert areas have prolonged periods of no precipitation, minimal soil evaporation, and the absence of human and vegetation activities, making them scientifically less relevant to this study [60,61]. Therefore, these areas were not included in our analysis. Among the three GCMs used in this study, MPI-ESM1-2-HR projected the most severe drought characteristics for the future, followed by AWI-CM-1-1-MR, while EC-Earth3 projected the least severe drought characteristics. The future drought conditions predicted by AWI-CM-1-1-MR and MPI-ESM1-2-HR are relatively reasonable. However, EC-Earth3 tends to underestimate future drought conditions [7]. By considering the interannual variability of climate factors and drought events’ characteristics (Figure 2 and Figure 3), we found that the primary reason for the substantial differences in drought predictions among the three models is the overestimation of future precipitation by EC-Earth3 [59]. This issue should be noted and emphasized in subsequent studies. It is observed that although CMIP6 projects similar drought conditions under different models globally, there can be substantial local variations. Based on the MK trend test, future drought conditions in most regions around the world are expected to worsen [7,62,63,64,65]. The partial correlation analysis results between drought events’ characteristics and climate factors indicate that precipitation predominantly influences drought events’ characteristics in most areas [57,63].
In contrast to previous studies, this research did not utilize a multi−model ensemble approach, as our intention was to compare the performance and differences between different models in projecting drought. However, this approach can lead to computationally intensive calculations. Therefore, in this study, we focused on calculating drought projection results only for three global climate models under one forcing scenario. In future work, it is recommended to consider additional forcing scenarios and different models to reduce uncertainties. The climate factor data in this paper, derived from CMIP6, have a spatial resolution of 100 km, which limits the spatial detail. To overcome this limitation, future analyses can incorporate other datasets with finer resolutions for comparative analysis. Since the projected drought conditions are for the future, the accuracy of the results needs further analysis and verification. Uncertainties may arise from climate models, drought identification, and bias correction methods [66]. Therefore, it is advisable to include more climate models to minimize uncertainties in the analysis process and subsequently perform analyses based on a multi−model ensemble.
This study offers a reference for researching global drought changes under climate change and gives a basis for the application of CMIP6. The findings of this research can help us to give early warning and develop measures to prevent possible future droughts.

5. Conclusions

Due to the complex coupling between drought and climatic factors, the future status of drought under climate change remains unclear. We projected one scenario of global drought using CMIP6 GCMs and investigated the driving mechanisms behind it. The objectives of this study are to validate the newly released CMIP6 and explore the characteristics of global drought events. Our findings are as follows:
(1)
Among the three models, MPI-ESM1-2-HR projected the most severe drought, followed by AWI-CM-1-1-MR, while EC-Earth3 projected the least severe drought. The future drought conditions predicted by AWI-CM-1-1-MR and MPI-ESM1-2-HR are relatively reasonable. However, EC-Earth3 tends to underestimate future drought conditions.
(2)
From 2016 to 2100, ATDS and ATDD exhibit an increasing trend in most regions worldwide, and this trend is statistically significant (p < 0.05). ATDF, on the other hand, shows a decreasing trend, although it is not statistically significant. Only certain areas demonstrate a significant increasing trend (p < 0.05).
(3)
Precipitation exhibits the highest correlation with drought event characteristics. Among them, the correlation strength between ATDS and ATDD with climatic factors follows a certain order: precipitation > maximum temperature > minimum temperature > net surface radiation.
(4)
The severity and duration of drought in most regions are primarily driven by precipitation. The corresponding partial correlation coefficient is also substantial. While drought frequency is also influenced by precipitation, the corresponding correlation coefficient is relatively small.

Author Contributions

Conceptualization, F.X. and Q.W.; Methodology, F.X. and Q.W.; Validation, V.A.B., Y.Q. and Q.W.; Formal analysis, F.X. and Q.W.; Writing—original draft, F.X.; Writing—review & editing, F.X., V.A.B., Y.Q. and Q.W.; Visualization, F.X. All authors have read and agreed to the published version of the manuscript.

Funding

This research received financial support from the National Key Research and Development Program funded project (2021YFC3000203), the National Natural Science Foundation of China (42001039), and the Ministry of Water Resources’ flood and drought disaster prevention strategy research talent innovation team project (WH0145B042021).

Data Availability Statement

The data that support the findings of this study are available from the corresponding author upon reasonable request.

Acknowledgments

We thank the National Key Research and Development Program funded project (2021YFC3000203) the National Natural Science Foundation of China (42001039), and the Ministry of Water Resources’ flood and drought disaster prevention strategy research talent innovation team project (WH0145B042021).

Conflicts of Interest

The authors declare no conflict of interest.

References

  1. Chen, N.; Li, R.; Zhang, X.; Yang, C.; Wang, X.; Zeng, L.; Tang, S.; Wang, W.; Li, D.; Niyogi, D. Drought propagation in Northern China Plain: A comparative analysis of GLDAS and MERRA−2 datasets. J. Hydrol. 2020, 588, 125026. [Google Scholar] [CrossRef]
  2. Shen, Z.; Zhang, Q.; Singh, V.P.; Pokhrel, Y.; Li, J.; Xu, C.Y.; Wu, W. Drying in the low−latitude Atlantic Ocean contributed to terrestrial water storage depletion across Eurasia. Nat. Commun. 2022, 13, 1849. [Google Scholar] [CrossRef] [PubMed]
  3. Wang, Q.; Qi, J.; Wu, H.; Zeng, Y.; Shui, W.; Zeng, J.; Zhang, X. Freeze−Thaw cycle representation alters response of watershed hydrology to future climate change. Catena 2020, 195, 104767. [Google Scholar] [CrossRef]
  4. Leng, S.; Huete, A.; Cleverly, J.; Gao, S.; Yu, Q.; Meng, X.; Qi, J.; Zhang, R.; Wang, Q. Assessing the Impact of Extreme Droughts on Dryland Vegetation by Multi−Satellite Solar−Induced Chlorophyll Fluorescence. Remote Sens. 2022, 14, 1581. [Google Scholar] [CrossRef]
  5. Qu, Y.; Zhang, X.; Zeng, J.; Li, Z.; Lv, J. Historical Drought Events in the Early Years of Qing Dynasty in Shanxi Based on Hydrological Reconstructions. Water 2023, 15, 995. [Google Scholar] [CrossRef]
  6. Kiem, A.S.; Johnson, F.; Westra, S.; van Dijk, A.; Evans, J.P.; O’Donnell, A.; Rouillard, A.; Barr, C.; Tyler, J.; Thyer, M.; et al. Natural hazards in Australia: Droughts. Clim. Chang. 2016, 139, 37–54. [Google Scholar] [CrossRef]
  7. Li, H.; Li, Z.; Chen, Y.; Xiang, Y.; Liu, Y.; Kayumba, P.M.; Li, X. Drylands face potential threat of robust drought in the CMIP6 SSPs scenarios. Environ. Res. Lett. 2021, 16, 114004. [Google Scholar] [CrossRef]
  8. Askarimarnani, S.S.; Kiem, A.S.; Twomey, C.R. Comparing the performance of drought indicators in Australia from 1900 to 2018. Int. J. Climatol. 2021, 41, E912–E934. [Google Scholar] [CrossRef]
  9. Li, Y.L.; Wang, B.Y.; Gong, Y.J. Drought Assessment Based on Data Fusion and Deep Learning. Comput. Intell. Neurosci. 2022, 2022, 4429286. [Google Scholar] [CrossRef]
  10. Sun, P.; Ma, Z.; Zhang, Q.; Singh, V.P.; Xu, C. −Y. Modified drought severity index: Model improvement and its application in drought monitoring in China. J. Hydrol. 2022, 612, 128097. [Google Scholar] [CrossRef]
  11. Haile, G.G.; Tang, Q.; Li, W.; Liu, X.; Zhang, X. Drought: Progress in broadening its understanding. WIREs Water 2019, 7, e1407. [Google Scholar] [CrossRef]
  12. Li, Q.; He, P.; He, Y.; Han, X.; Zeng, T.; Lu, G.; Wang, H. Investigation to the relation between meteorological drought and hydrological drought in the upper Shaying River Basin using wavelet analysis. Atmos. Res. 2020, 234, 104743. [Google Scholar] [CrossRef]
  13. Chen, S.; Yuan, X. CMIP6 projects less frequent seasonal soil moisture droughts over China in response to different warming levels. Environ. Res. Lett. 2021, 16, 044053. [Google Scholar] [CrossRef]
  14. Masih, I.; Maskey, S.; Mussá, F.E.F.; Trambauer, P. A review of droughts on the African continent: A geospatial and long−term perspective. Hydrol. Earth Syst. Sci. 2014, 18, 3635–3649. [Google Scholar] [CrossRef] [Green Version]
  15. Zeng, J.; Zhou, T.; Qu, Y.; Bento, V.A.; Qi, J.; Xu, Y.; Li, Y.; Wang, Q. An improved global vegetation health index dataset in detecting vegetation drought. Sci. Data 2023, 10, 338. [Google Scholar] [CrossRef] [PubMed]
  16. Wu, B.F.; Ma, Z.H.; Yan, N.N. Agricultural drought mitigating indices derived from the changes in drought characteristics. Remote Sens. Environ. 2020, 244, 111813. [Google Scholar] [CrossRef]
  17. Trenberth, K.E.; Dai, A.; van der Schrier, G.; Jones, P.D.; Barichivich, J.; Briffa, K.R.; Sheffield, J. Global warming and changes in drought. Nat. Clim. Chang. 2013, 4, 17–22. [Google Scholar] [CrossRef]
  18. Yao, N.; Li, L.; Feng, P.; Feng, H.; Li Liu, D.; Liu, Y.; Jiang, K.; Hu, X.; Li, Y. Projections of drought characteristics in China based on a standardized precipitation and evapotranspiration index and multiple GCMs. Sci Total Environ. 2020, 704, 135245. [Google Scholar] [CrossRef]
  19. Zhang, R.R.; Bento, V.A.; Qi, J.Y.; Xu, F.; Wu, J.J.; Qiu, J.X.; Li, J.W.; Shui, W.; Wang, Q.F. The first high spatial resolution multi−scale daily SPI and SPEI raster dataset for drought monitoring and evaluating over China from 1979 to 2018. Big Earth Data 2023. [Google Scholar] [CrossRef]
  20. McKee, T.B.; Doesken, N.J.; Kleist, J.R. The Relationship of Drought Frequency and Duration to Time Scales. In Proceedings of the 8th Conference on Applied Climatology, Anaheim, CA, USA, 17−22 January 1993. [Google Scholar]
  21. Song, Z.; Xia, J.; She, D.; Li, L.; Hu, C.; Hong, S. Assessment of meteorological drought change in the 21st century based on CMIP6 multi−model ensemble projections over mainland China. J. Hydrol. 2021, 601, 126643. [Google Scholar] [CrossRef]
  22. Zhai, J.; Mondal, S.K.; Fischer, T.; Wang, Y.; Su, B.; Huang, J.; Tao, H.; Wang, G.; Ullah, W.; Uddin, M.J. Future drought characteristics through a multi−model ensemble from CMIP6 over South Asia. Atmos. Res. 2020, 246, 105111. [Google Scholar] [CrossRef]
  23. Yu, H.; Zhang, Q.; Xu, C.Y.; Du, J.; Sun, P.; Hu, P. Modified Palmer Drought Severity Index: Model improvement and application. Environ. Int. 2019, 130, 104951. [Google Scholar] [CrossRef] [PubMed]
  24. Wang, Q.F.; Zeng, J.Y.; Qi, J.Y.; Zhang, X.S.; Zeng, Y.; Shui, W.; Xu, Z.H.; Zhang, R.R.; Wu, X.P.; Cong, J. A multi−scale daily SPEI dataset for drought characterization at observation stations over mainland China from 1961 to 2018. Earth Syst. Sci. Data 2021, 13, 331–341. [Google Scholar] [CrossRef]
  25. Yu, M.X.; Li, Q.F.; Hayes, M.J.; Svoboda, M.D.; Heim, R.R. Are droughts becoming more frequent or severe in China based on the Standardized Precipitation Evapotranspiration Index: 1951−2010? Int. J. Climatol. 2014, 34, 545–558. [Google Scholar] [CrossRef] [Green Version]
  26. Zhang, Q.; Li, Q.; Singh, V.P.; Shi, P.; Huang, Q.; Sun, P. Nonparametric Integrated Agrometeorological Drought Monitoring: Model Development and Application. J. Geophys. Res. Atmos. 2018, 123, 73–88. [Google Scholar] [CrossRef]
  27. Su, B.; Huang, J.; Mondal, S.K.; Zhai, J.; Wang, Y.; Wen, S.; Gao, M.; Lv, Y.; Jiang, S.; Jiang, T.; et al. Insight from CMIP6 SSP−RCP scenarios for future drought characteristics in China. Atmos. Res. 2021, 250, 105375. [Google Scholar] [CrossRef]
  28. Vicente−Serrano, S.M.; Beguería, S.; López−Moreno, J.I. A Multiscalar Drought Index Sensitive to Global Warming: The Standardized Precipitation Evapotranspiration Index. J. Clim. 2010, 23, 1696–1718. [Google Scholar] [CrossRef] [Green Version]
  29. Wang, Q.F.; Shi, P.J.; Lei, T.J.; Geng, G.P.; Liu, J.H.; Mo, X.Y.; Li, X.H.; Zhou, H.K.; Wu, J.J. The alleviating trend of drought in the Huang−Huai−Hai Plain of China based on the daily SPEI. Int. J. Climatol. 2015, 35, 3760–3769. [Google Scholar] [CrossRef]
  30. Wang, Q.; Zhang, R.; Qi, J.; Zeng, J.; Wu, J.; Shui, W.; Wu, X.; Li, J. An improved daily standardized precipitation index dataset for mainland China from 1961 to 2018. Sci. Data 2022, 9, 124. [Google Scholar] [CrossRef]
  31. Meehl, G.A.; Boer, G.J.; Covey, C.; Latif, M.; Stouffer, R.J. Intercomparison makes for a better climate model. Eos Trans. Am. Geophys. Union 1997, 78, 445–447. [Google Scholar] [CrossRef]
  32. Meehl, G.A.; Boer, G.J.; Covey, C.; Latif, M.; Stouffer, R.J. The coupled model intercomparison project (cmip). Bull. Am. Meteorol. Soc. 2000, 81, 313–318. [Google Scholar] [CrossRef]
  33. Li, X.; Fang, G.; Wen, X.; Xu, M.; Zhang, Y. Characteristics analysis of drought at multiple spatiotemporal scale and assessment of CMIP6 performance over the Huaihe River Basin. J. Hydrol. Reg. Stud. 2022, 41, 101103. [Google Scholar] [CrossRef]
  34. Xin, X.G.; Wu, T.W.; Zhang, J.; Yao, J.C.; Fang, Y.J. Comparison of CMIP6 and CMIP5 simulations of precipitation in China and the East Asian summer monsoon. Int. J. Climatol. 2020, 40, 6423–6440. [Google Scholar] [CrossRef] [Green Version]
  35. Cook, B.I.; Mankin, J.S.; Marvel, K.; Williams, A.P.; Smerdon, J.E.; Anchukaitis, K.J. Twenty-First Century Drought Projections in the CMIP6 Forcing Scenarios. Earth’s Future 2020, 8, e2019EF001461. [Google Scholar] [CrossRef] [Green Version]
  36. Bouramdane, A. −A. Assessment of CMIP6 Multi−Model Projections Worldwide: Which Regions Are Getting Warmer and Are Going through a Drought in Africa and Morocco? What Changes from CMIP5 to CMIP6? Sustainability 2022, 15, 690. [Google Scholar] [CrossRef]
  37. Zhao, T.B.; Dai, A.G. CMIP6 Model−Projected Hydroclimatic and Drought Changes and Their Causes in the Twenty−First Century. J. Clim. 2022, 35, 897–921. [Google Scholar] [CrossRef]
  38. Bagcaci, S.C.; Yucel, I.; Duzenli, E.; Yilmaz, M.T. Intercomparison of the expected change in the temperature and the precipitation retrieved from CMIP6 and CMIP5 climate projections: A Mediterranean hot spot case, Turkey. Atmos. Res. 2021, 256, 105576. [Google Scholar] [CrossRef]
  39. Lun, Y.R.; Liu, L.; Cheng, L.; Li, X.P.; Li, H.; Xu, Z.X. Assessment of GCMs simulation performance for precipitation and temperature from CMIP5 to CMIP6 over the Tibetan Plateau. Int. J. Climatol. 2021, 41, 3994–4018. [Google Scholar] [CrossRef]
  40. Zamani, Y.; Monfared, S.A.H.; Moghaddam, M.A.; Hamidianpour, M. A comparison of CMIP6 and CMIP5 projections for precipitation to observational data: The case of Northeastern Iran. Theor. Appl. Climatol. 2020, 142, 1613–1623. [Google Scholar] [CrossRef]
  41. Ma, Z.; Sun, P.; Zhang, Q.; Zou, Y.; Lv, Y.; Li, H.; Chen, D. The Characteristics and Evaluation of Future Droughts across China through the CMIP6 Multi−Model Ensemble. Remote Sens. 2022, 14, 1097. [Google Scholar] [CrossRef]
  42. Mondal, S.K.; Huang, J.; Wang, Y.; Su, B.; Zhai, J.; Tao, H.; Wang, G.; Fischer, T.; Wen, S.; Jiang, T. Doubling of the population exposed to drought over South Asia: CMIP6 multi−model−based analysis. Sci. Total Environ. 2021, 771, 145186. [Google Scholar] [CrossRef]
  43. Sharma, S.; Hamal, K.; Khadka, N.; Ali, M.; Subedi, M.; Hussain, G.; Ehsan, M.A.; Saeed, S.; Dawadi, B. Projected Drought Conditions over Southern Slope of the Central Himalaya Using CMIP6 Models. Earth Syst. Environ. 2021, 5, 849–859. [Google Scholar] [CrossRef]
  44. Song, Y.H.; Shahi, A.; Chung, E.S. Differences in multi−model ensembles of CMIP5 and CMIP6 projections for future droughts in South Korea. Int. J. Climatol. 2022, 42, 2688–2716. [Google Scholar] [CrossRef]
  45. Stagge, J.H.; Tallaksen, L.M.; Gudmundsson, L.; Van Loon, A.F.; Stahl, K. Candidate Distributions for Climatological Drought Indices (SPI and SPEI). Int. J. Climatol. 2015, 35, 4027–4040. [Google Scholar] [CrossRef]
  46. Monish, N.T.; Rehana, S. Suitability of distributions for standard precipitation and evapotranspiration index over meteorologically homogeneous zones of India. J. Earth Syst. Sci. 2019, 129, 25. [Google Scholar] [CrossRef]
  47. Mann, H.B. Non−parametric tests against trend. Econometrica 1945, 12, 245–259. [Google Scholar] [CrossRef]
  48. Wu, X.; Zhang, R.; Bento, V.A.; Leng, S.; Qi, J.; Zeng, J.; Wang, Q. The Effect of Drought on Vegetation Gross Primary Productivity under Different Vegetation Types across China from 2001 to 2020. Remote Sens. 2022, 14, 4658. [Google Scholar] [CrossRef]
  49. Zhang, R.; Wu, X.; Zhou, X.; Ren, B.; Zeng, J.; Wang, Q. Investigating the effect of improved drought events extraction method on spatiotemporal characteristics of drought. Theor. Appl. Climatol. 2021, 147, 395–408. [Google Scholar] [CrossRef]
  50. Ghosh, K.G. Analysis of Rainfall Trends and its Spatial Patterns During the Last Century over the Gangetic West Bengal, Eastern India. J. Geovis. Spat. Anal. 2018, 2, 15. [Google Scholar] [CrossRef]
  51. Wang, Q.F.; Tang, J.; Zeng, J.Y.; Qu, Y.P.; Zhang, Q.; Shui, W.; Wang, W.L.; Yi, L.; Leng, S. Spatial−temporal evolution of vegetation evapotranspiration in Hebei Province, China. J. Integr. Agric. 2018, 17, 2107–2117. [Google Scholar] [CrossRef] [Green Version]
  52. Helali, J.; Salimi, S.; Lotfi, M.; Hosseini, S.A.; Bayat, A.; Ahmadi, M.; Naderizarneh, S. Investigation of the effect of large−scale atmospheric signals at different time lags on the autumn precipitation of Iran’s watersheds. Arab. J. Geosci. 2020, 13, 932. [Google Scholar] [CrossRef]
  53. Wu, J.F.; Tan, X.Z.; Chen, X.H.; Lin, K.R. Dynamic changes of the dryness/wetness characteristics in the largest river basin of South China and their possible climate driving factors. Atmos. Res. 2020, 232, 104685. [Google Scholar] [CrossRef]
  54. Yang, R.; Xing, B. Teleconnections of Large−Scale Climate Patterns to Regional Drought in Mid−Latitudes: A Case Study in Xinjiang, China. Atmosphere 2022, 13, 230. [Google Scholar] [CrossRef]
  55. Wang, H.; Chen, Y.; Pan, Y.; Li, W. Spatial and temporal variability of drought in the arid region of China and its relationships to teleconnection indices. J. Hydrol. 2015, 523, 283–296. [Google Scholar] [CrossRef]
  56. Wang, Q.; Wu, J.; Li, X.; Zhou, H.; Yang, J.; Geng, G.; An, X.; Liu, L.; Tang, Z. A comprehensively quantitative method of evaluating the impact of drought on crop yield using daily multi−scale SPEI and crop growth process model. Int. J. Biometeorol. 2017, 61, 685–699. [Google Scholar] [CrossRef]
  57. Ukkola, A.M.; De Kauwe, M.G.; Roderick, M.L.; Abramowitz, G.; Pitman, A.J. Robust Future Changes in Meteorological Drought inCMIP6Projections Despite Uncertainty in Precipitation. Geophys. Res. Lett. 2020, 47, e2020GL087820. [Google Scholar] [CrossRef]
  58. George, H.H.; Zohrab, A.S. Reference Crop Evapotranspiration from Temperature. Appl. Eng. Agric. 1985, 1, 96–99. [Google Scholar] [CrossRef]
  59. Spinoni, J.; Barbosa, P.; Bucchignani, E.; Cassano, J.; Cavazos, T.; Cescatti, A.; Christensen, J.H.; Christensen, O.B.; Coppola, E.; Evans, J.; et al. Global exposure of population and land−use to meteorological droughts under different Warming Levels and Shared Socioeconomic Pathways: A Coordinated Regional Climate Downscaling Experiment−based study. Int. J. Climatol. 2021, 41, 6825–6853. [Google Scholar] [CrossRef]
  60. Liu, Y.; Liu, Y.; Wang, W. Inter−comparison of satellite−retrieved and Global Land Data Assimilation System−simulated soil moisture datasets for global drought analysis. Remote Sens. Environ. 2019, 220, 1–18. [Google Scholar] [CrossRef]
  61. Raji, S.A.; Odunuga, S.; Fasona, M. Spatially Explicit Scenario Analysis of Habitat Quality in a Tropical Semi−arid Zone: Case Study of the Sokoto−Rima Basin. J. Geovis. Spat. Anal. 2022, 6, 11. [Google Scholar] [CrossRef]
  62. Wang, T.; Tu, X.; Singh, V.P.; Chen, X.; Lin, K. Global data assessment and analysis of drought characteristics based on CMIP6. J. Hydrol. 2021, 596, 126091. [Google Scholar] [CrossRef]
  63. Zhao, P.; Lü, H.; Yang, H.; Wang, W.; Fu, G. Impacts of climate change on hydrological droughts at basin scale: A case study of the Weihe River Basin, China. Quat. Int. 2019, 513, 37–46. [Google Scholar] [CrossRef]
  64. Zeng, J.; Zhang, R.; Qu, Y.; Bento, V.A.; Zhou, T.; Lin, Y.; Wu, X.; Qi, J.; Shui, W.; Wang, Q. Improving the drought monitoring capability of VHI at the global scale via ensemble indices for various vegetation types from 2001 to 2018. Weather Clim. Extrem. 2022, 35, 100412. [Google Scholar] [CrossRef]
  65. Ghasemloo, N.; Matkan, A.A.; Alimohammadi, A.; Aghighi, H.; Mirbagheri, B. Estimating the Agricultural Farm Soil Moisture Using Spectral Indices of Landsat 8, and Sentinel−1, and Artificial Neural Networks. J. Geovis. Spat. Anal. 2022, 6, 19. [Google Scholar] [CrossRef]
  66. Vetter, T.; Reinhardt, J.; Flörke, M.; van Griensven, A.; Hattermann, F.; Huang, S.; Koch, H.; Pechlivanidis, I.G.; Plötner, S.; Seidou, O.; et al. Evaluation of sources of uncertainty in projected hydrological changes under climate change in 12 large−scale river basins. Clim. Chang. 2016, 141, 419–433. [Google Scholar] [CrossRef]
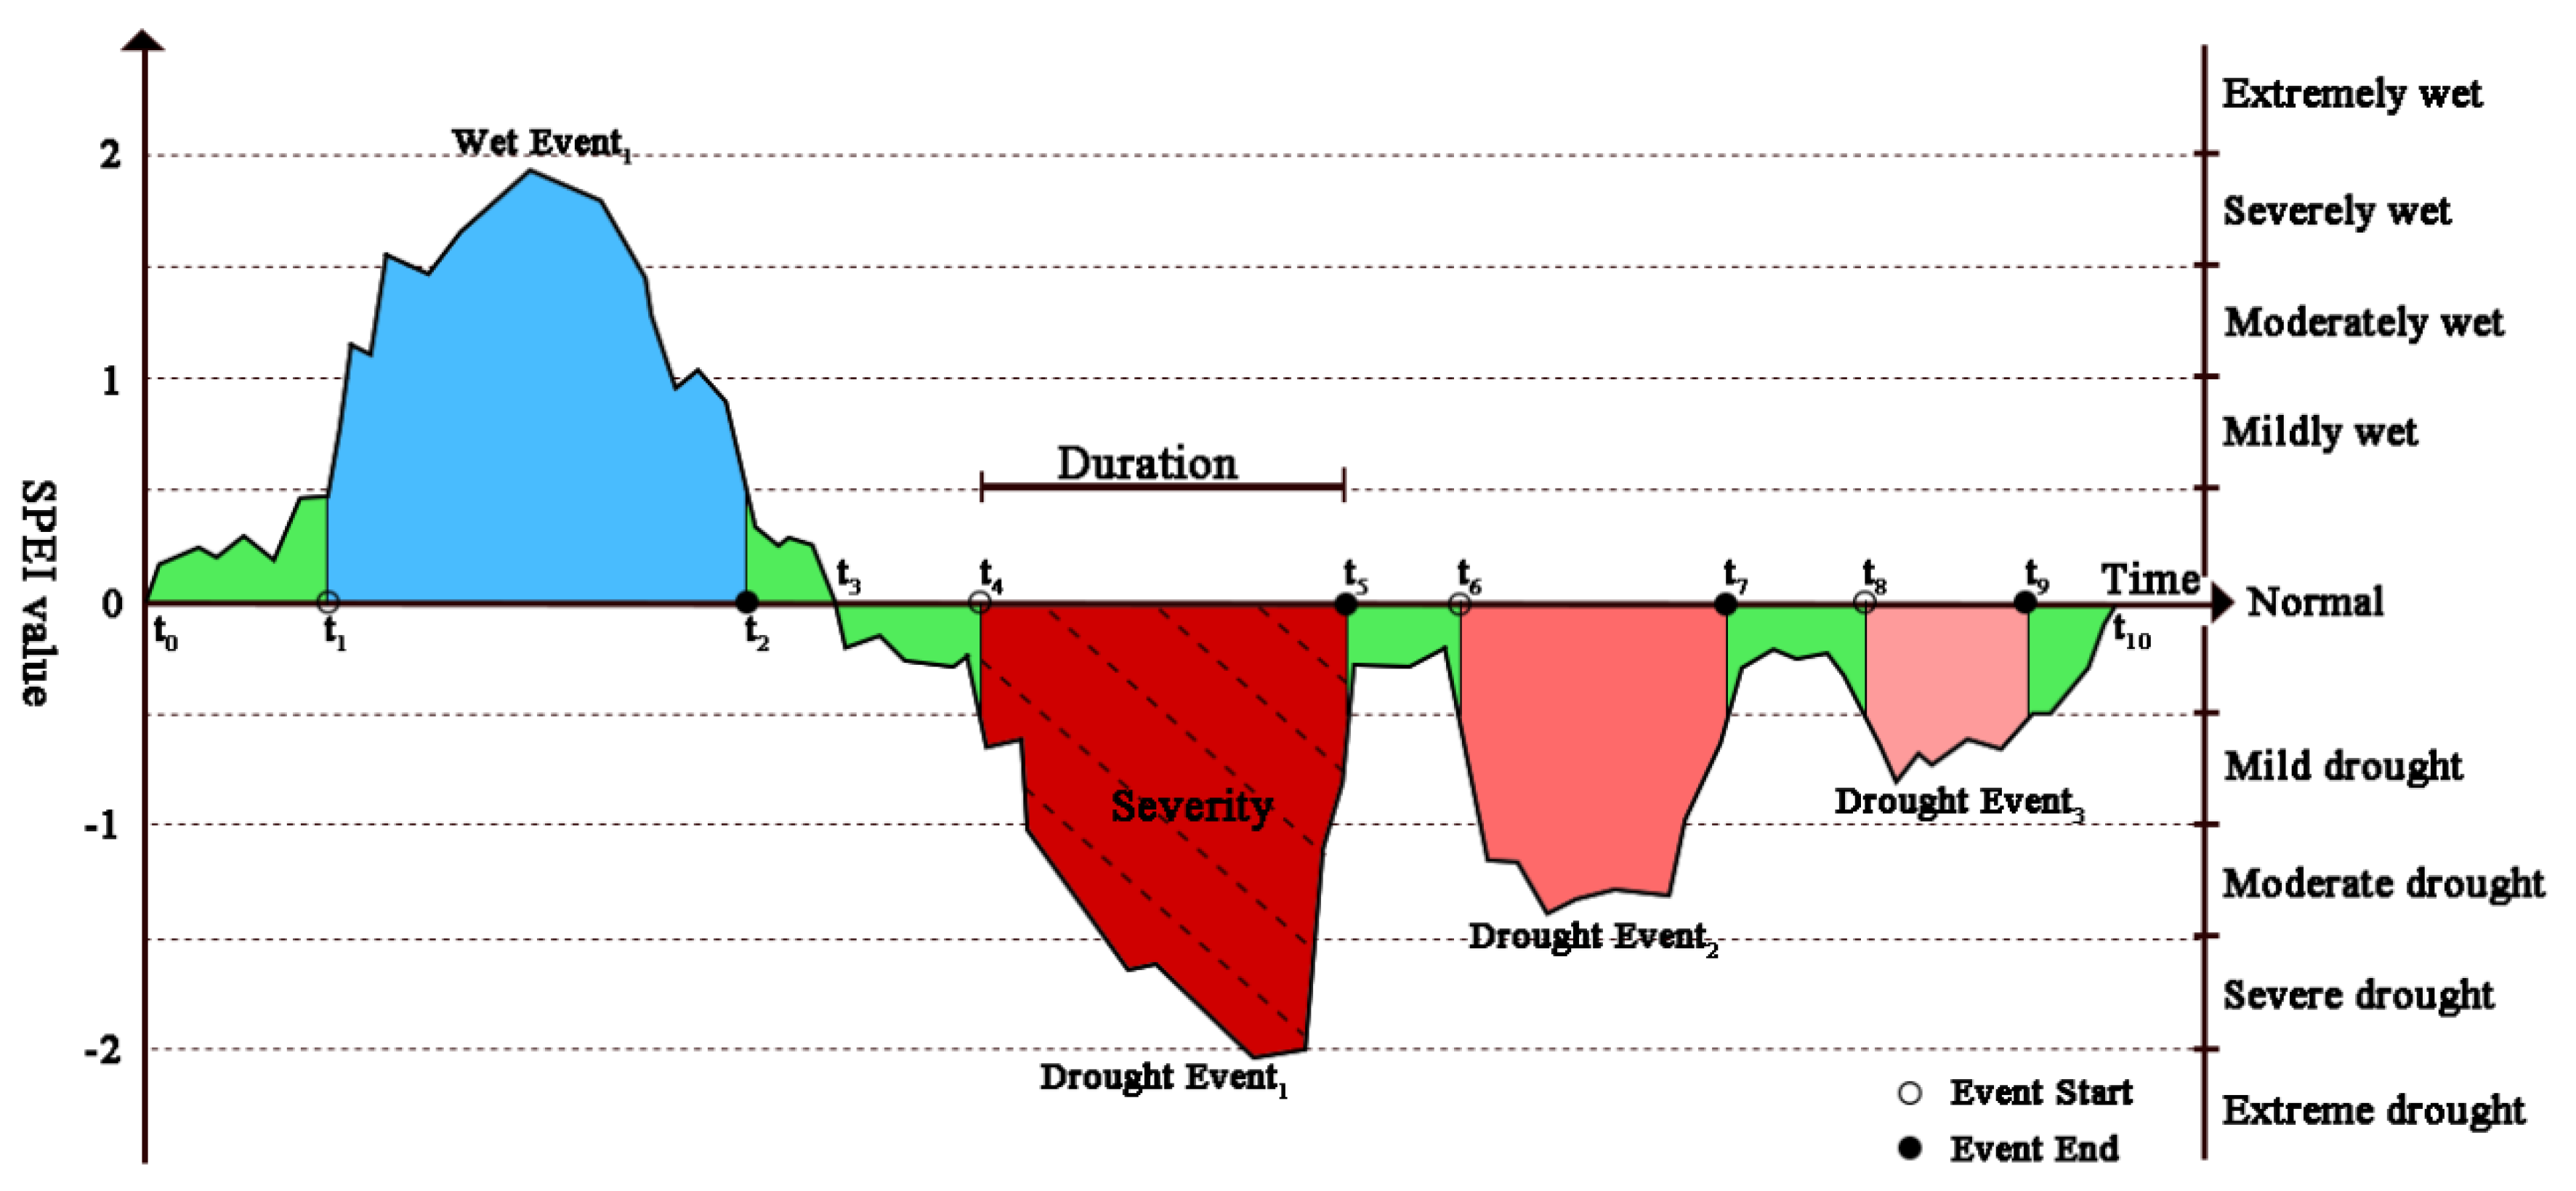
Figure 1. Schematic plot of dry and wet events (the drought events are red; the wet events are blue; and the normal periods are green).
Water 15 02272 g001
Figure 2. Interannual variation of precipitation (a), net surface radiation (b), maximum temperature (c) and minimum temperature (d) from 2016 to 2100 (The solid lines signify the average value of all grids worldwide per year, and shaded colors signify the 25th percentile and 75th percentile as the lower and upper limits, respectively).
Water 15 02272 g002
Figure 3. The interannual variation of the annual total drought severity (ATDS) (a), the annual total drought duration (ATDD) (b), and the annual total drought frequency (ATDF) (c) (The solid lines signify the average value of all grids worldwide per year, and shaded colors signify the 25th percentile and 75th percentile as the lower and upper limits, respectively).
Water 15 02272 g003
Figure 4. The spatial pattern of global ATDS simulated by EC-Earth3 (a,d), AWI-CM-1-1-MR (b,e), and MPI-ESM1-2-HR (c,f).
Water 15 02272 g004
Figure 5. The spatial pattern of global ATDD simulated by EC-Earth3 (a,d), AWI-CM-1-1-MR (b,e), and MPI-ESM1-2-HR (c,f).
Water 15 02272 g005
Figure 6. The spatial pattern of global ATDF simulated by EC-Earth3 (a,d), AWI-CM-1-1-MR (b,e), and MPI-ESM1-2-HR (c,f).
Water 15 02272 g006
Figure 7. The spatial pattern of ATDS variation trends simulated by EC-Earth3 (a), AWI-CM-1-1-MR (b), and MPI-ESM1-2-HR (c) (the dotted areas are p−values < 0.05).
Water 15 02272 g007
Figure 8. The spatial pattern of ATDD variation trends simulated by EC-Earth3 (a), AWI-CM-1-1-MR (b), and MPI-ESM1-2-HR (c) (the dotted areas are p−values < 0.05).
Water 15 02272 g008
Figure 9. The spatial pattern of ATDF variation trends simulated by EC-Earth3 (a), AWI-CM-1-1-MR (b), and MPI-ESM1-2-HR (c) (the dotted areas are p−values < 0.05).
Water 15 02272 g009
Figure 10. The partial correlation coefficient distribution histogram between drought events’ characteristics simulated by EC-Earth3 (ac), AWI-CM-1-1-MR (df), and MPI-ESM1-2-HR (gi) and climatic factors.
Water 15 02272 g010
Figure 11. The main driving factors on ATDS simulated by EC-Earth3 (a,d), AWI-CM-1-1-MR (b,e), and MPI-ESM1-2-HR (c,f) and their corresponding partial correlation coefficients.
Water 15 02272 g011
Figure 12. The main driving factors on ATDD simulated by EC-Earth3 (a,d), AWI-CM-1-1-MR (b,e), and MPI-ESM1-2-HR (c,f) and their corresponding partial correlation coefficients.
Water 15 02272 g012
Figure 13. The main driving factors on ATDF simulated by EC-Earth3 (a,d), AWI-CM-1-1-MR (b,e), and MPI-ESM1-2-HR (c,f) and their corresponding partial correlation coefficients.
Water 15 02272 g013
Table 1. The details of climate factors data from CMIP6.
DataDescriptionUnitSpatial ResolutionPeriod
prPrecipitation (include both liquid and solid phases)kg m−2 s−1100 km2016–2100
rsdsSurface Downwelling Shortwave Radiation (surface solar irradiance for UV calculations)W m−1100 km2016–2100
tasmax
tasmin
Daily Maximum Near−Surface Air Temperature
K
K
100 km
100 km
2016–2100
2016–2100
Table 2. Different wet and dry grade classifications of SPEI.
CategorizationSPEI Values
Extremely WetSPEI ≥ 2
Severely Wet1.5 ≤ SPEI < 2
Moderately Wet1 ≤ SPEI < 1.5
Mildly Wet0.5 < SPEI < 1
Normal−0.5 ≤ SPEI ≤ 0.5
Mild Drought−1 < SPEI < −0.5
Moderate Drought−1.5 < SPEI ≤ −1
Severe Drought−2 < SPEI ≤ −1.5
Extreme DroughtSPEI ≤ −2
Disclaimer/Publisher’s Note: The statements, opinions and data contained in all publications are solely those of the individual author(s) and contributor(s) and not of MDPI and/or the editor(s). MDPI and/or the editor(s) disclaim responsibility for any injury to people or property resulting from any ideas, methods, instructions or products referred to in the content.