
Fuzzy-Based Intelligent Model for Rapid Rock Slope Stability Analysis Using Qslope

 ,
, 
 , and
, and 
Abstract
:1. Introduction
- Rock mass rating by Laubscher [20].
- Rock mass strength (RMS) by Stille et al. [21]
- Modified basic rock mass rating (MRMR) by Kendorski et al. [22]
- Simplified rock mass rating (SRMR) by Brook and Dharmaratne [23].
- Slope rock mass rating (SRMR) by Robertson [24].
- Natural slope methodology (NSM) by Shuk [25].
- Rock condition rating (RCR) by Goel et al. [26].
- Chinese slope mass rating (CSMR) by Chen [27].
- Rock mass number (RMN) by Goel et al. [28].
- Modified-rock mass rating (M-RMR) by Unal [29].
- QTBM by Barton [30].
- Slope mass rating (SMR) by Romana et al. [31].
- Slope stability probability classification (SSPC) by Hack et al. [32].
- Continuous slope mass rating (CSMR) by Tomás et al. [33].
- Alternative rock mass classification system (ARMCS) by Pantelidis [34].
- Fuzzy slope mass rating (FSMR) by Daftaribesheli et al. [35].
- Graphical slope mass rating (GSMR) by Tomás et al. [36].
- Slope stability rating (SSR) by Taheri [37].
- Global slope performance index (GSPI) by Sullivan [38].
- Qslope by Bar and Barton [39].
- SMR-Qslope [40].
2. Materials and Methods
2.1. Qslope Classification System
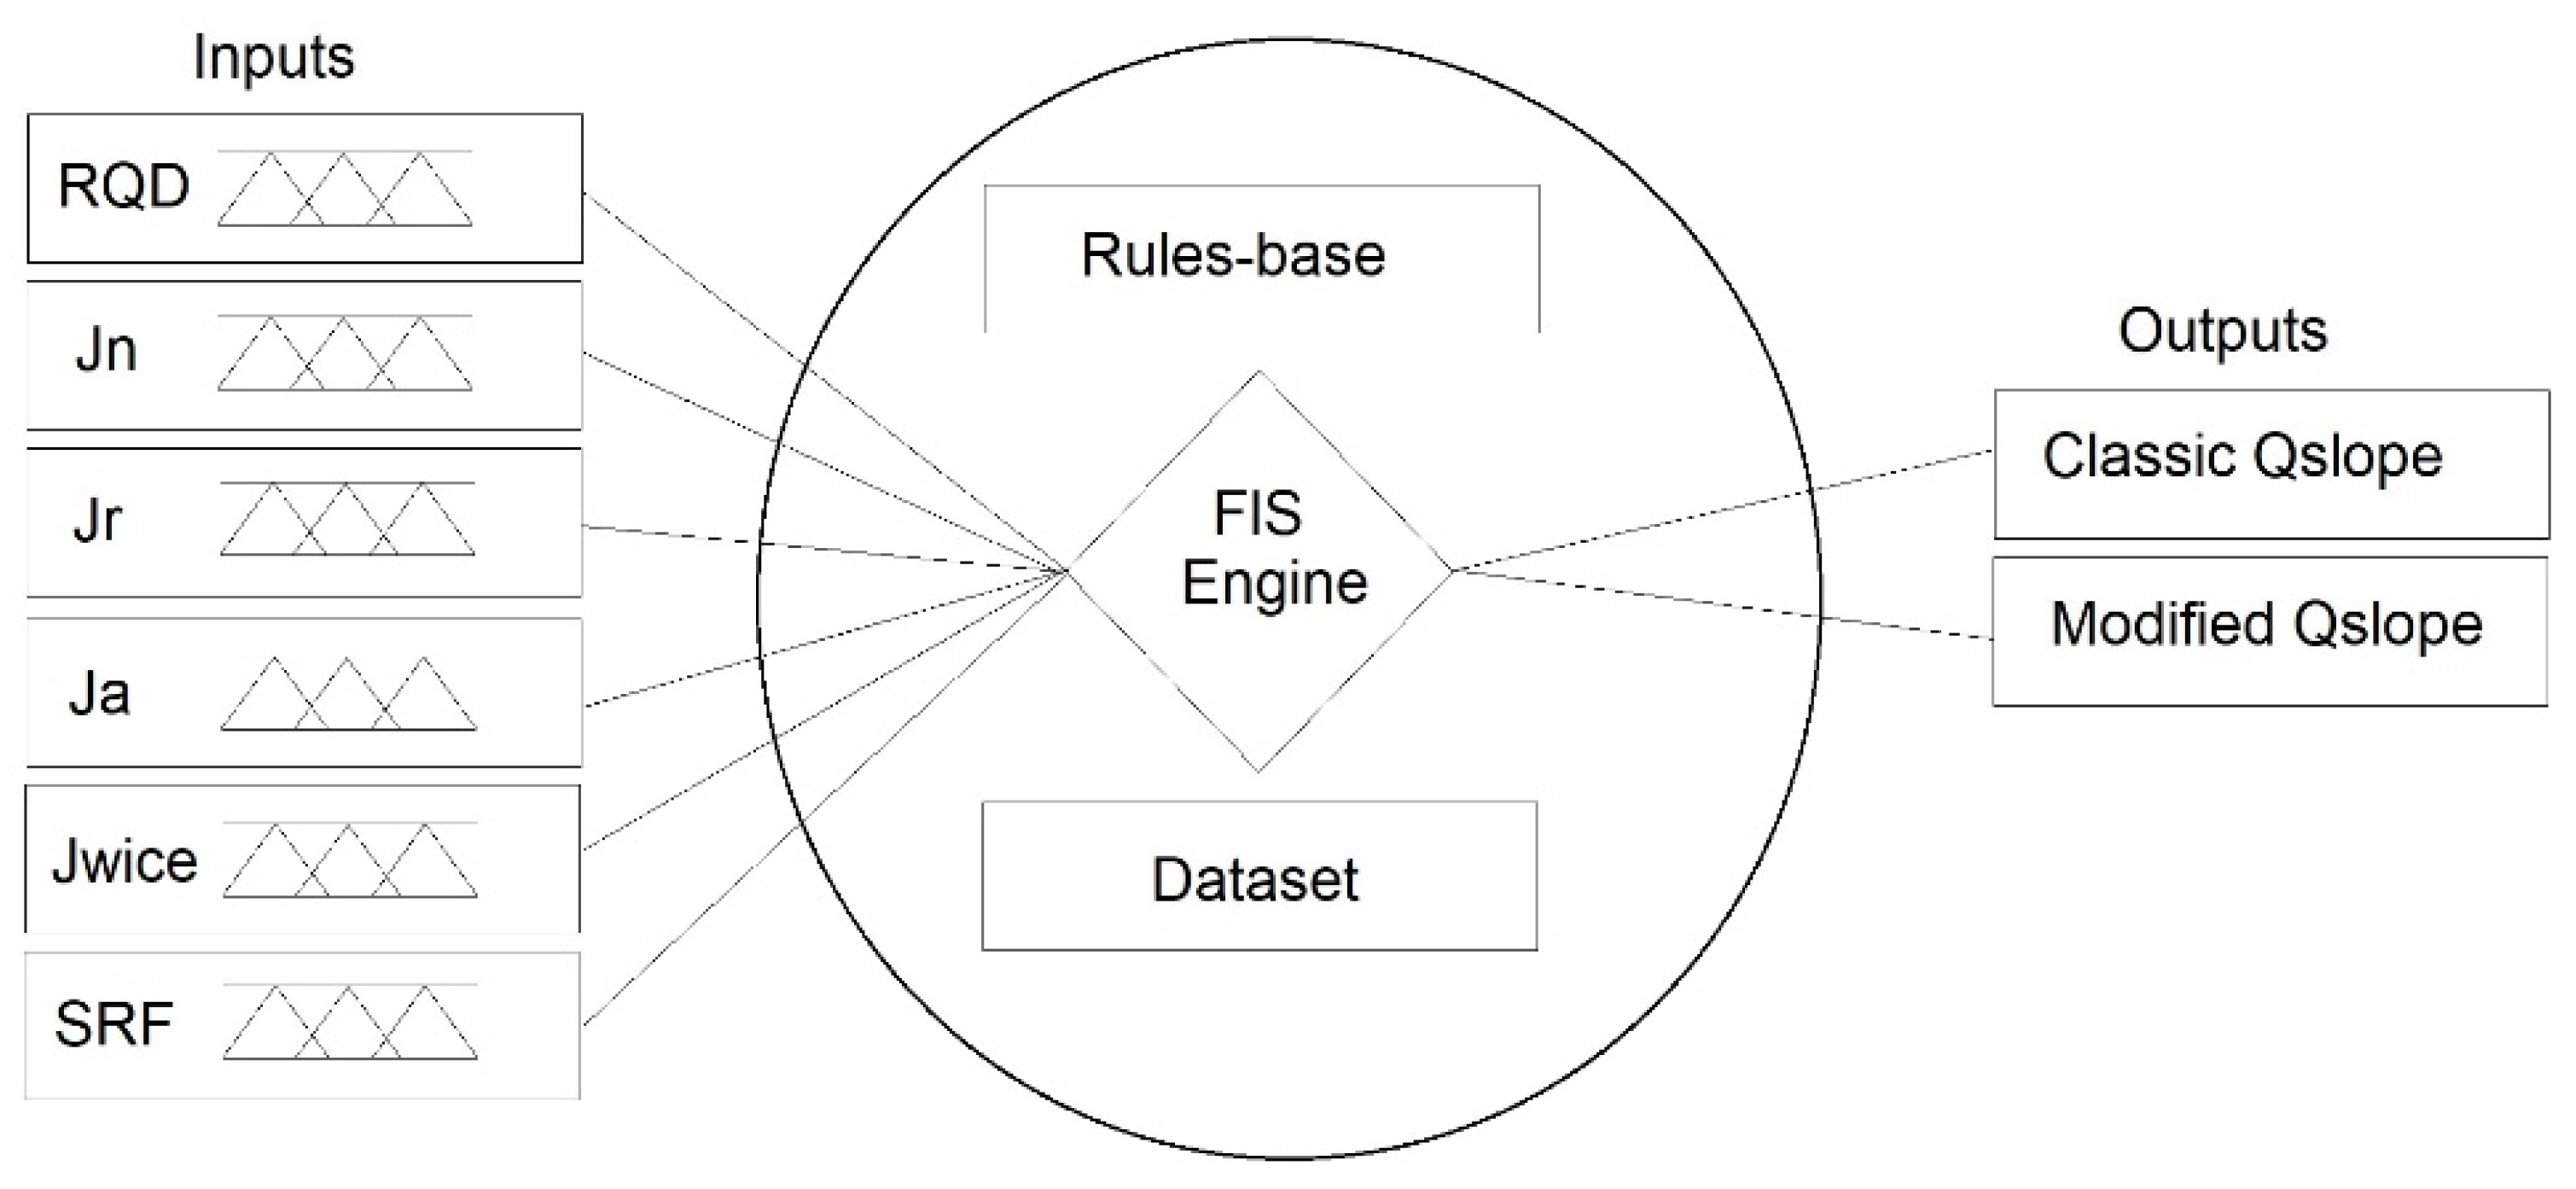
2.2. Fuzzy Logic and Model Implementation
- Data Input: This step involves providing the input data gathered from the field survey and correctly placing the imported values in the system.
- Rules-Based Database: In the second step, a rules-based database is prepared using expert opinions. These rules establish the connection between the input parameters and the stability categories, leveraging the expertise of professionals in the field of slope stability assessment.
- Output Export: The final step involves exporting the output value, which represents the stability index and ranges from 0 to 1.0. For instance, an output value of 0.7 indicates that the slope’s stability condition is mostly stable, whereas a value of 0.2 suggests primarily unstable conditions. Professionals should consider necessary precautions during the design stage for slopes with an output value of 0.2. Conversely, for slopes with an output value of 0.7, a less solid support system may be considered.
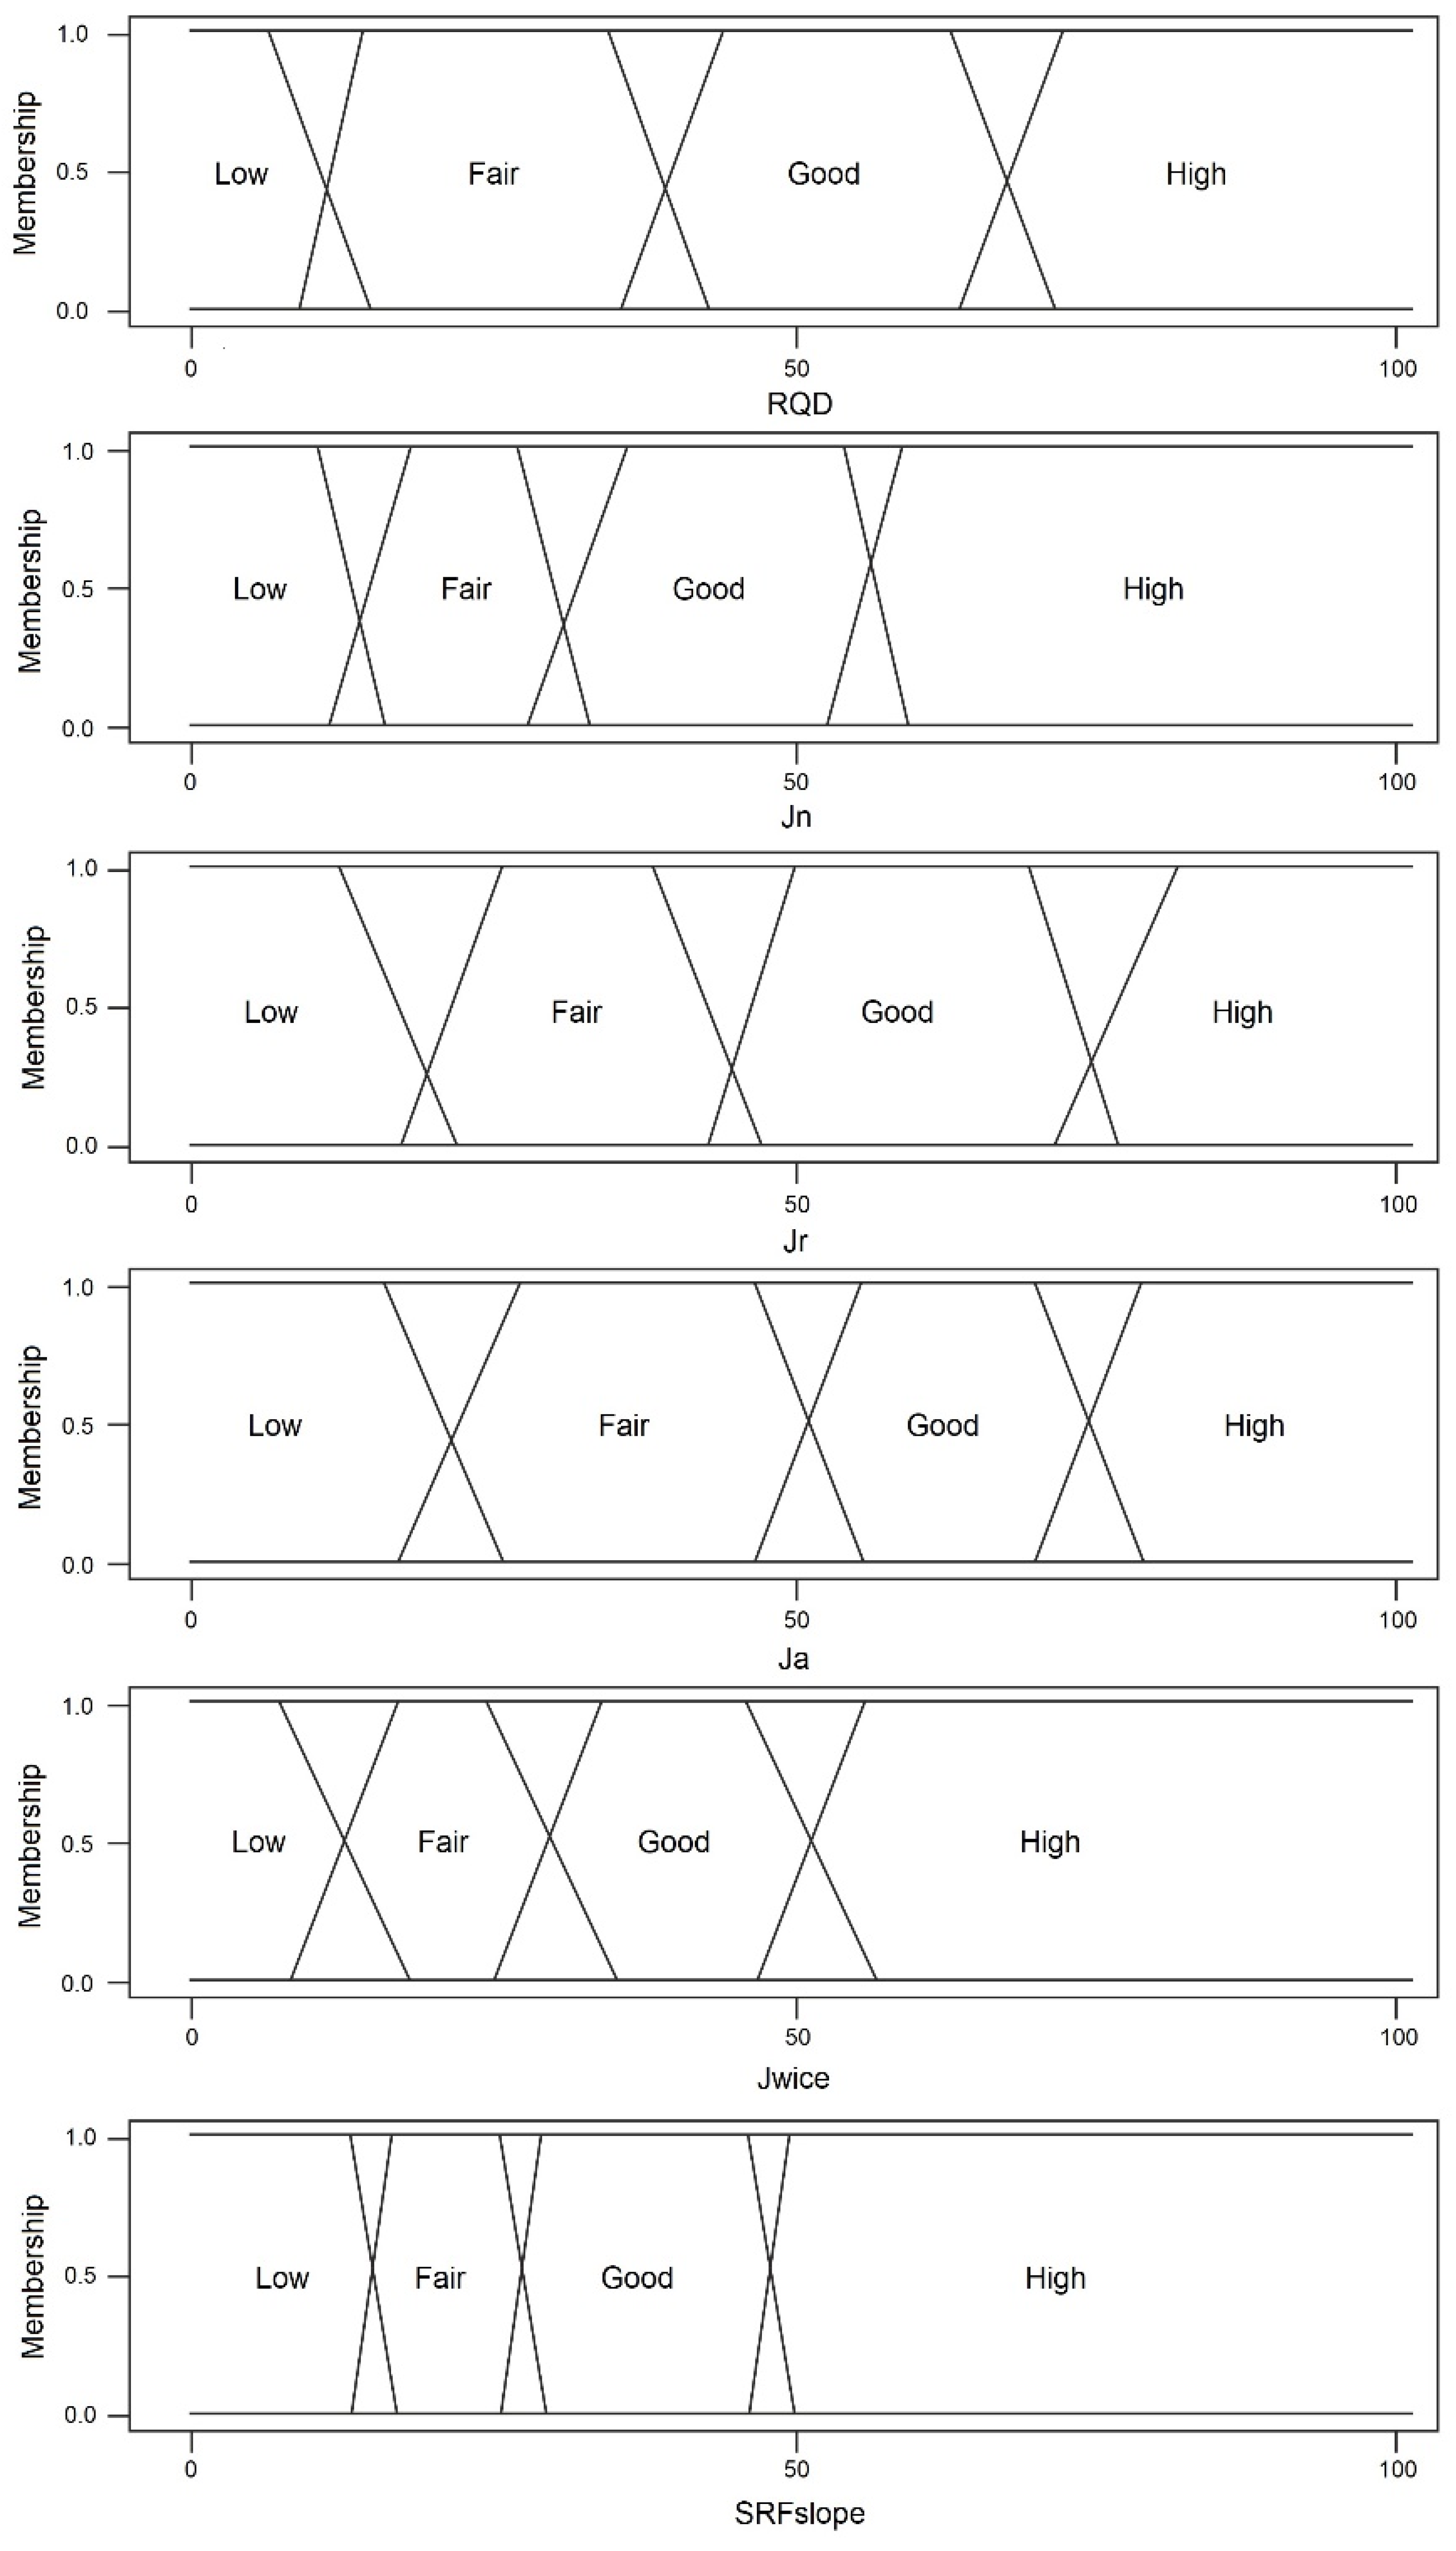
- Input Parameters: The model considers various input parameters that characterize the geological and geomechanical properties of the slope. These parameters typically include factors such as rock mass quality, joint spacing, groundwater conditions, slope geometry, and more. Each input parameter is assigned a linguistic variable or descriptor, such as “low”, “medium”, or “high”, to represent qualitative descriptions.
- Membership Functions: For each input parameter, membership functions are defined to specify the degree of membership to different fuzzy sets. These fuzzy sets represent different stability categories, such as “unstable”, “uncertain”, or “stable”. The membership functions assign a value between 0 and 1 to each linguistic variable, representing the degree of membership to a particular fuzzy set.
- Fuzzy Inference System: The fuzzy inference system combines the linguistic variables and membership functions of the input parameters using fuzzy logic operations, such as fuzzy AND and fuzzy OR. It applies a set of predefined rules that define the relationship between the input parameters and the stability categories. These rules are typically based on expert knowledge and experience in slope stability assessment.
- Fuzzy Output: The fuzzy inference system generates a fuzzy output, which represents the degree of membership of the slope to each stability category. This fuzzy output is typically a fuzzy set with membership values assigned to different stability categories, such as “unstable”, “uncertain”, or “stable”. The membership values indicate the likelihood or confidence of the slope belonging to each category.
- Defuzzification: To obtain a crisp or numerical value for the slope stability, defuzzification is performed. Various defuzzification methods can be used, such as centroid, mean of maximum, or weighted average, to convert the fuzzy output into a single numerical value or score that represents the overall stability of the slope.
- Stability Classification: Based on the defuzzified value or score, the slope is classified into a specific stability category, such as “unstable”, “uncertain”, or “stable”. The classification depends on predefined thresholds or ranges associated with each stability category.
2.3. Data Preparations
2.4. Model Validation
2.5. Practical Example for Model Implementation
- Step 2: Fuzzy Rule Base: Create a set of fuzzy rules that relate the input variables to the output (slope stability assessment). For example:
- IF Q-value is poor AND JRC is low AND GW is high, THEN Stability is Low.
- IF Q-value is moderate AND JRC is medium AND GW is medium THEN Stability is Medium.
- IF Q-value is good AND JRC is high AND GW is low THEN Stability is High.
- Step 3: Fuzzification: Given specific input values for Q-value, JRC, and GW, apply the membership functions to determine the degree of membership for each input in their respective linguistic categories.
- Step 4: Rule Evaluation: Evaluate each fuzzy rule based on the degree of membership of the inputs. Combine the fuzzy rules using fuzzy logic operators (e.g., AND, OR) to obtain the overall fuzzy output for each stability category.
- Step 5: Defuzzification: Convert the fuzzy output obtained from Step 4 into a crisp output value for slope stability. Defuzzification methods, such as the Center of Gravity or Weighted Average, can be employed for this purpose.
- Step 6: Interpretation: Interpret the crisp output value to determine the final slope stability assessment. For example, if the defuzzified value falls into the “Stable” category, the slope stability is assessed as “Stable” (See Figure 3).
- Step 7: Validation and Fine-Tuning: Validate the fuzzy logic Qslope model by comparing its stability assessments to real-world slope stability data or expert knowledge (verification stage). Fine-tune the model by adjusting the membership functions and fuzzy rules based on validation results to improve accuracy.
3. Results and Discussions
- If the output parameter is less than 0.25, it is categorized as “unstable”.
- If the output parameter falls within the range of 0.25 to 0.50, it is classified as “uncertain with a tendency towards the unstable side”.
- If the output parameter is between 0.50 and 0.75, it is considered “uncertain with a tendency towards the stable side”.
- If the output parameter is greater than 0.75, it is designated as “stable”.
- If the fuzzy output parameter is less than 0.25, it is categorized as “unstable”.
- If the fuzzy output parameter falls within the range of 0.25 to 0.50, it is classified as “uncertain with a tendency towards the unstable side”.
- If the fuzzy output parameter is between 0.50 and 0.75, it is considered “uncertain with a tendency towards the stable side”.
- If the fuzzy output parameter is greater than 0.75, it is designated as “stable”.
- In this case, the fuzzy output parameter of approximately 0.0175 would fall into the “unstable” category according to the given ranges.
- Handling Uncertainty: The fuzzy logic principles employed in the Qslope model allow for the effective handling of uncertainty and imprecise information. It accommodates the inherent vagueness and variability associated with geological and geotechnical parameters, providing a more robust framework for slope stability analysis.
- Flexibility and Interpretability: The fuzzy Qslope model uses linguistic variables and membership functions, making it a flexible and interpretable approach. It enables the incorporation of expert knowledge and allows for the integration of qualitative and quantitative data, providing a comprehensive understanding of slope stability conditions.
- Faster Analysis: The fuzzy Qslope model can expedite the analysis process compared to traditional methods. By leveraging fuzzy logic techniques, it simplifies and automates complex calculations, reducing the time required for manual assessments. This time efficiency can be particularly advantageous when dealing with large-scale slope stability evaluations.
- Risk Evaluation: The fuzzy Qslope model facilitates a more nuanced evaluation of slope stability risks. By providing fuzzy output values, it offers a range of stability categories (such as “unstable”, “uncertain”, or “stable”) with corresponding membership degrees. This enables a more detailed understanding of the potential risks and assists in prioritizing mitigation measures.
- Improved Decision Making: The fuzzy Qslope model assists in making informed decisions regarding slope stabilization techniques and risk management strategies. By providing quantifiable measures of stability and a clear classification system, it helps engineers and geologists evaluate the effectiveness of different interventions and select the most appropriate solutions for slope stability challenges.
4. Conclusions
Author Contributions
Funding
Institutional Review Board Statement
Informed Consent Statement
Data Availability Statement
Acknowledgments
Conflicts of Interest
References
- Goel, R.K.; Singh, B. Engineering Rock Mass Classification: Tunnelling, Foundations and Landslides; Elsevier: New York, NY, USA, 2011. [Google Scholar]
- Kleinbrod, U.; Burjanek, J.; Faha, D. Ambient vibration classification of unstable rock slopes: A systematic approach. Eng. Geol. 2019, 249, 198–217. [Google Scholar] [CrossRef]
- Azarafza, M.; Asghari-Kaljahi, E.; Moshrefy-Far, M.R. Numerical modeling and stability analysis of shallow foundations located near slopes (case study: Phase 8 gas flare foundations of south pars gas complex). J. Geotech. Geol. 2014, 10, 92–99. (In Persian) [Google Scholar]
- Azarafza, M.; Bonab, M.H.; Derakhshani, R. A Novel Empirical Classification Method for Weak Rock Slope Stability Analysis. Sci. Rep. 2022, 12, 14744. [Google Scholar] [CrossRef]
- Azarafza, M.; Nikoobakht, S.; Rahnamarad, J.; Asasi, F.; Derakhshani, R. An empirical method for Slope mass rating-Qslope correlation for Isfahan province, Iran. MethodsX 2020, 7, 101069. [Google Scholar] [CrossRef] [PubMed]
- Zheng, J.; Zhao, Y.; Lü, Q.; Deng, J.; Pan, X.; Li, Y. A discussion on the adjustment parameters of the Slope Mass Rating (SMR) system for rock slopes. Eng. Geol. 2016, 206, 42–49. [Google Scholar] [CrossRef]
- Ritter, W. Die Statik der Tunnelgewolbe; Springer: Berlin/Heidelberg, Germany, 1879. [Google Scholar]
- Terzaghi, K. Rock Defects and Loads on Tunnel Supports; Harvard University: Cambridge, MA, USA, 1946. [Google Scholar]
- Cecil, O.S. Correlations of Rock Bolt-Shotcrete Support and Rock Quality Parameters in Scandinavian Tunnels; Swedish Geotech Institute: Linköping, Sweden; Oslo, Norway, 1975. [Google Scholar]
- Deere, D.U.; Deere, D.W. The Rock Quality Designation (RQD) Index in Practice. In Proceedings of International Symposium Rock Class Engineering Purpose; ASTM International: West Conshohocken, PA, USA, 1988. [Google Scholar] [CrossRef]
- Deere, D.U.; Deere, D.W. Rock Quality Designation (RQD) after Twenty Years; DEERE (DON U) Consultant: Gainesville, FL, USA, 1989. [Google Scholar]
- Bieniawski, Z.T. Engineering Classification of Jointed Rock Masses; Civil Engineer in South Africa: Cape Town, South Africa, 1973; p. 15. [Google Scholar]
- Barton, N.; Grimstad, E. Forty years with the Q-system in Norway and Abroad; Fjellsprengningsteknikk NFF: Oslo, Norway, 2014; 25p. [Google Scholar]
- Bieniawski, Z.T. Engineering Rock Mass Classifications: A Complete Manual for Engineers and Geologists in Mining, Civil, and Petroleum Engineering; Wiley: Hoboken, NJ, USA, 1989. [Google Scholar]
- Barton, N.; Lien, R.; Lunde, J. Engineering classification of rock masses for the design of tunnel support. Rock Mech. 1974, 6, 189–236. [Google Scholar] [CrossRef]
- Chen, J.; Li, X.; Zhu, H.; Rubin, Y. Geostatistical method for inferring RMR ahead of tunnel face excavation using dynamically exposed geological information. Eng. Geol. 2017, 228, 214–223. [Google Scholar] [CrossRef]
- Marinos, V.; Marinos, P.; Hoek, E. The geological strength index: Applications and limitations. Bull. Eng. Geol. Environ. 2005, 64, 55–65. [Google Scholar] [CrossRef]
- Kundu, J.; Sarkar, K.; Verma, A.K.; Singh, T.N. Novel methods for quantitative analysis of kinematic stability and slope mass rating in jointed rock slopes with the aid of a new computer application. Bull. Eng. Geol. Environ. 2022, 81, 1–19. [Google Scholar] [CrossRef]
- Azarafza, M.; Kockar, M.K.; Zhu, H.H. Correlations of SMR-Qslope Data in Stability Classification of Discontinuous Rock Slope: A Modified Relationship Considering the Iranian Data. Geotech. Geol. Eng. 2022, 40, 1751–1764. [Google Scholar] [CrossRef]
- Laubscher, D.H. Geomechanics classification of jointed rock masses-mining applications. Trans. Inst. Min. Metall. 1977, 86, A1–A8. [Google Scholar]
- Stille, H.; Groth, T.; Fredriksson, A. FEM-analysis of Rock Mechanical Problems with JOBFEM. Stiftelsen Bergteknisk Forsk.-BeFo 1982, 307, 82. [Google Scholar]
- Kendorski, F.S.; Cummings, R.A.; Bieniawski, Z.T.; Skinner, E.H. Rock mass classification for block caving mine drift support. In Proceedings of the 5th ISRM Congress, Melbourne, Australia, 2–4 April 1983; International Society for Rock Mechanics and Rock Engineering: Lisbon, Portugal, 1983. [Google Scholar]
- Brook, N.; Dharmaratne, P. Simplified Rock Mass Rating System for Mine Tunnel Support. Inst. Min. Metall. Trans. 1985, 94, 148–154. [Google Scholar]
- Robertson, A. Estimating weak rock strength. In Proceedings of the SME Annual Meeting, Phoenix, AZ, USA, 25–28 January 1988. [Google Scholar]
- Shuk, T. Key elements and applications of the natural slope methodology (NSM) with some emphasis on slope stability aspects. In Proceedings of the 4th South American Congress on Rock Mechanics, Santiago, Chile, May 1994; pp. 955–960. [Google Scholar]
- Goel, R.K.; Jethwa, J.; Paithankar, A. Indian experiences with Q and RMR systems. Tunn. Undergr. Space Technol. 1995, 10, 97–109. [Google Scholar] [CrossRef]
- Chen, Z. Recent developments in slope stability analysis. In Proceedings of the 8th ISRM Congress, International Society of Rock Mechanics and Rock Engineering, Tokyo, Japan, 25–29 September 1995. [Google Scholar]
- Goel, R.K.; Jethwa, J.; Paithankar, A. Correlation between Barton’s Q and Bieniawski’s RMR-a new approach. Int. J. Rock Mech. Min. Sci. 1996, 7, 308A. [Google Scholar] [CrossRef]
- Unal, E. Modified Rock Mass Classification: M-RMR System. In Milestones in Rock Engineering; The Bieniawski Jubilee Collection, Balkema: Rotterdam, The Netherlands, 1996. [Google Scholar]
- Barton, N. TBM performance in rock using QTBM. Tunn. Tunn. Int. 1999, 31, 30–34. [Google Scholar]
- Romana, M.; Seron, J.B.; Montalar, E. SMR geomechanics classification: Application, experience and validation. In Proceedings of the 10th ISRM Congress Sandton, Sandton, South Africa, 8–12 September 2003. [Google Scholar]
- Hack, R.; Price, D.; Rengers, N. A new approach to rock slope stability–a probability classification (SSPC). Bull. Eng. Geol. Environ. 2003, 62, 167–184. [Google Scholar] [CrossRef]
- Tomas, R.; Delgado, J.B.; Seron, J. Modification of slope mass rating (SMR) by continuous functions. Int. J. Rock Mech. Min. Sci. 2007, 44, 1062–1069. [Google Scholar] [CrossRef]
- Pantelidis, L. An alternative rock mass classification system for rock slopes. Bull. Eng. Geol. Environ. 2010, 69, 29–39. [Google Scholar] [CrossRef]
- Daftaribesheli, A.; Ataei, M.; Sereshki, F. Assessment of rock slope stability using the fuzzy slope mass rating (FSMR) system. Appl. Soft Comput. 2011, 11, 4465–4473. [Google Scholar] [CrossRef]
- Tomas, R.; Cuenca, A.; Cano, M.; Garcıa-Barba, J. A graphical approach for slope mass rating (SMR). Eng. Geol. 2012, 124, 67–76. [Google Scholar] [CrossRef]
- Taheri, A. Design of rock slopes using SSR classification system. In Proceedings of the International Conference Ground Improvement Ground Control, Wollongong, Australia, 30 October–2 November 2013. [Google Scholar]
- Sullivan, T.D. Global slope performance index. Proc. Slope Stab. 2013, 55–80. [Google Scholar]
- Bar, N.; Barton, N. The Q-slope Method for Rock Slope Engineering. Rock Mech. Rock Eng. 2017, 50, 3307–3322. [Google Scholar] [CrossRef]
- Kouhdaragh, M.; Azarafza, M.; Derakhshani, R. A Qslope-based empirical method to stability assessment of mountain rock slopes in multiple faults zone: A case for North of Tabriz. MethodsX 2022, 9, 101718. [Google Scholar] [CrossRef]
- Bar, N.; Barton, N. Empirical slope design for hard and soft rocks using Q-slope. In Proceedings of the 50th US Rock Mechanics/Geomechanics Symposium, Houston, TX, USA, 26–29 June 2016; American Rock Mechanics Association: Alexandria, VA, USA, 2016. [Google Scholar]
- Azarafza, M.; Ghazifard, A.; Akgün, H.; Asghari-Kaljahi, E. Application of the Qslope classification system for slope stability assessment of the south flank of the Assalouyeh anticline, South Pars Zone. J. Geotech. Geol. 2017, 13, 82–90. [Google Scholar]
- Azarafza, M.; Nanehkaran, Y.A.; Rajabion, L.; Akgün, H.; Rahnamarad, J.; Derakhshani, R.; Raoof, A. Application of the modified Q-slope classification system for sedimentary rock slope stability assessment in Iran. Eng. Geol. 2020, 264, 105349. [Google Scholar] [CrossRef]
- Zadeh, L.A. Fuzzy sets. Inform. Control 1965, 8, 338–356. [Google Scholar] [CrossRef]
- Niemiec, M. Fuzzy Inference System: Theory and Applications; Scitus Academics LLC.: Wilmington, DE, USA, 2017. [Google Scholar]
- ASTM D7012; Standard Test Methods for Compressive Strength and Elastic Moduli of Intact Rock Core Specimens under Varying States of Stress and Temperatures. ASTM International: West Conshohocken, PA, USA, 2014.
- Hussian, S.; Mohammad, N.; Ali, S.; Rehman, Z.U.; Khan, M.N.; Shahzada, K.; Tahir, M.; Raza, S.; Sherin, S. Review of the Geological Strength Index (GSI) as an Empirical Classification and Rock Mass Property Estimation Tool: Origination, Modifications, Applications, and Limitations. Adv. Civ. Eng. 2020, 2020, 6471837. [Google Scholar] [CrossRef]
- Hoek, E.; Diederichs, M.S. Quantification of the geological strength index chart. In Proceedings of the 2013 US Rock Mechanics/Geomechanics Symposium, San Francisco, CA, USA, 23–26 June 2013. [Google Scholar]
- Rocscience Inc. SLIDE—2D Limit Equilibrium Analysis for Slopes Software. 2D and 3D Geotechnical Software. 2018. Available online: https://www.rocscience.com/slide2/ (accessed on 13 April 2021).
- Rocscience Inc. Documentation and Theory Overview for SLIDE. 2020. Available online: https://www.rocscience.com/help/slide2/overview (accessed on 15 April 2021).
- Rocscience Inc. Software Program for Determining Rock Mass Strength Parameters. 2018. Available online: https://www.rocscience.com/support/rocdata/ (accessed on 13 April 2021).


| No. | Parameter | Unit | Value |
|---|---|---|---|
| 1 | Slope height, H | m | 17 |
| 2 | Slope angle, β | degree | 63 |
| 3 | Slope surface | - | Natural |
| 4 | Seepage | - | Dry |
| 5 | Weathering | - | Low to medium |
| 6 | GSI | - | 52 |
| 7 | Geology | - | Marlstone |
| Evaluation Criteria | Results |
|---|---|
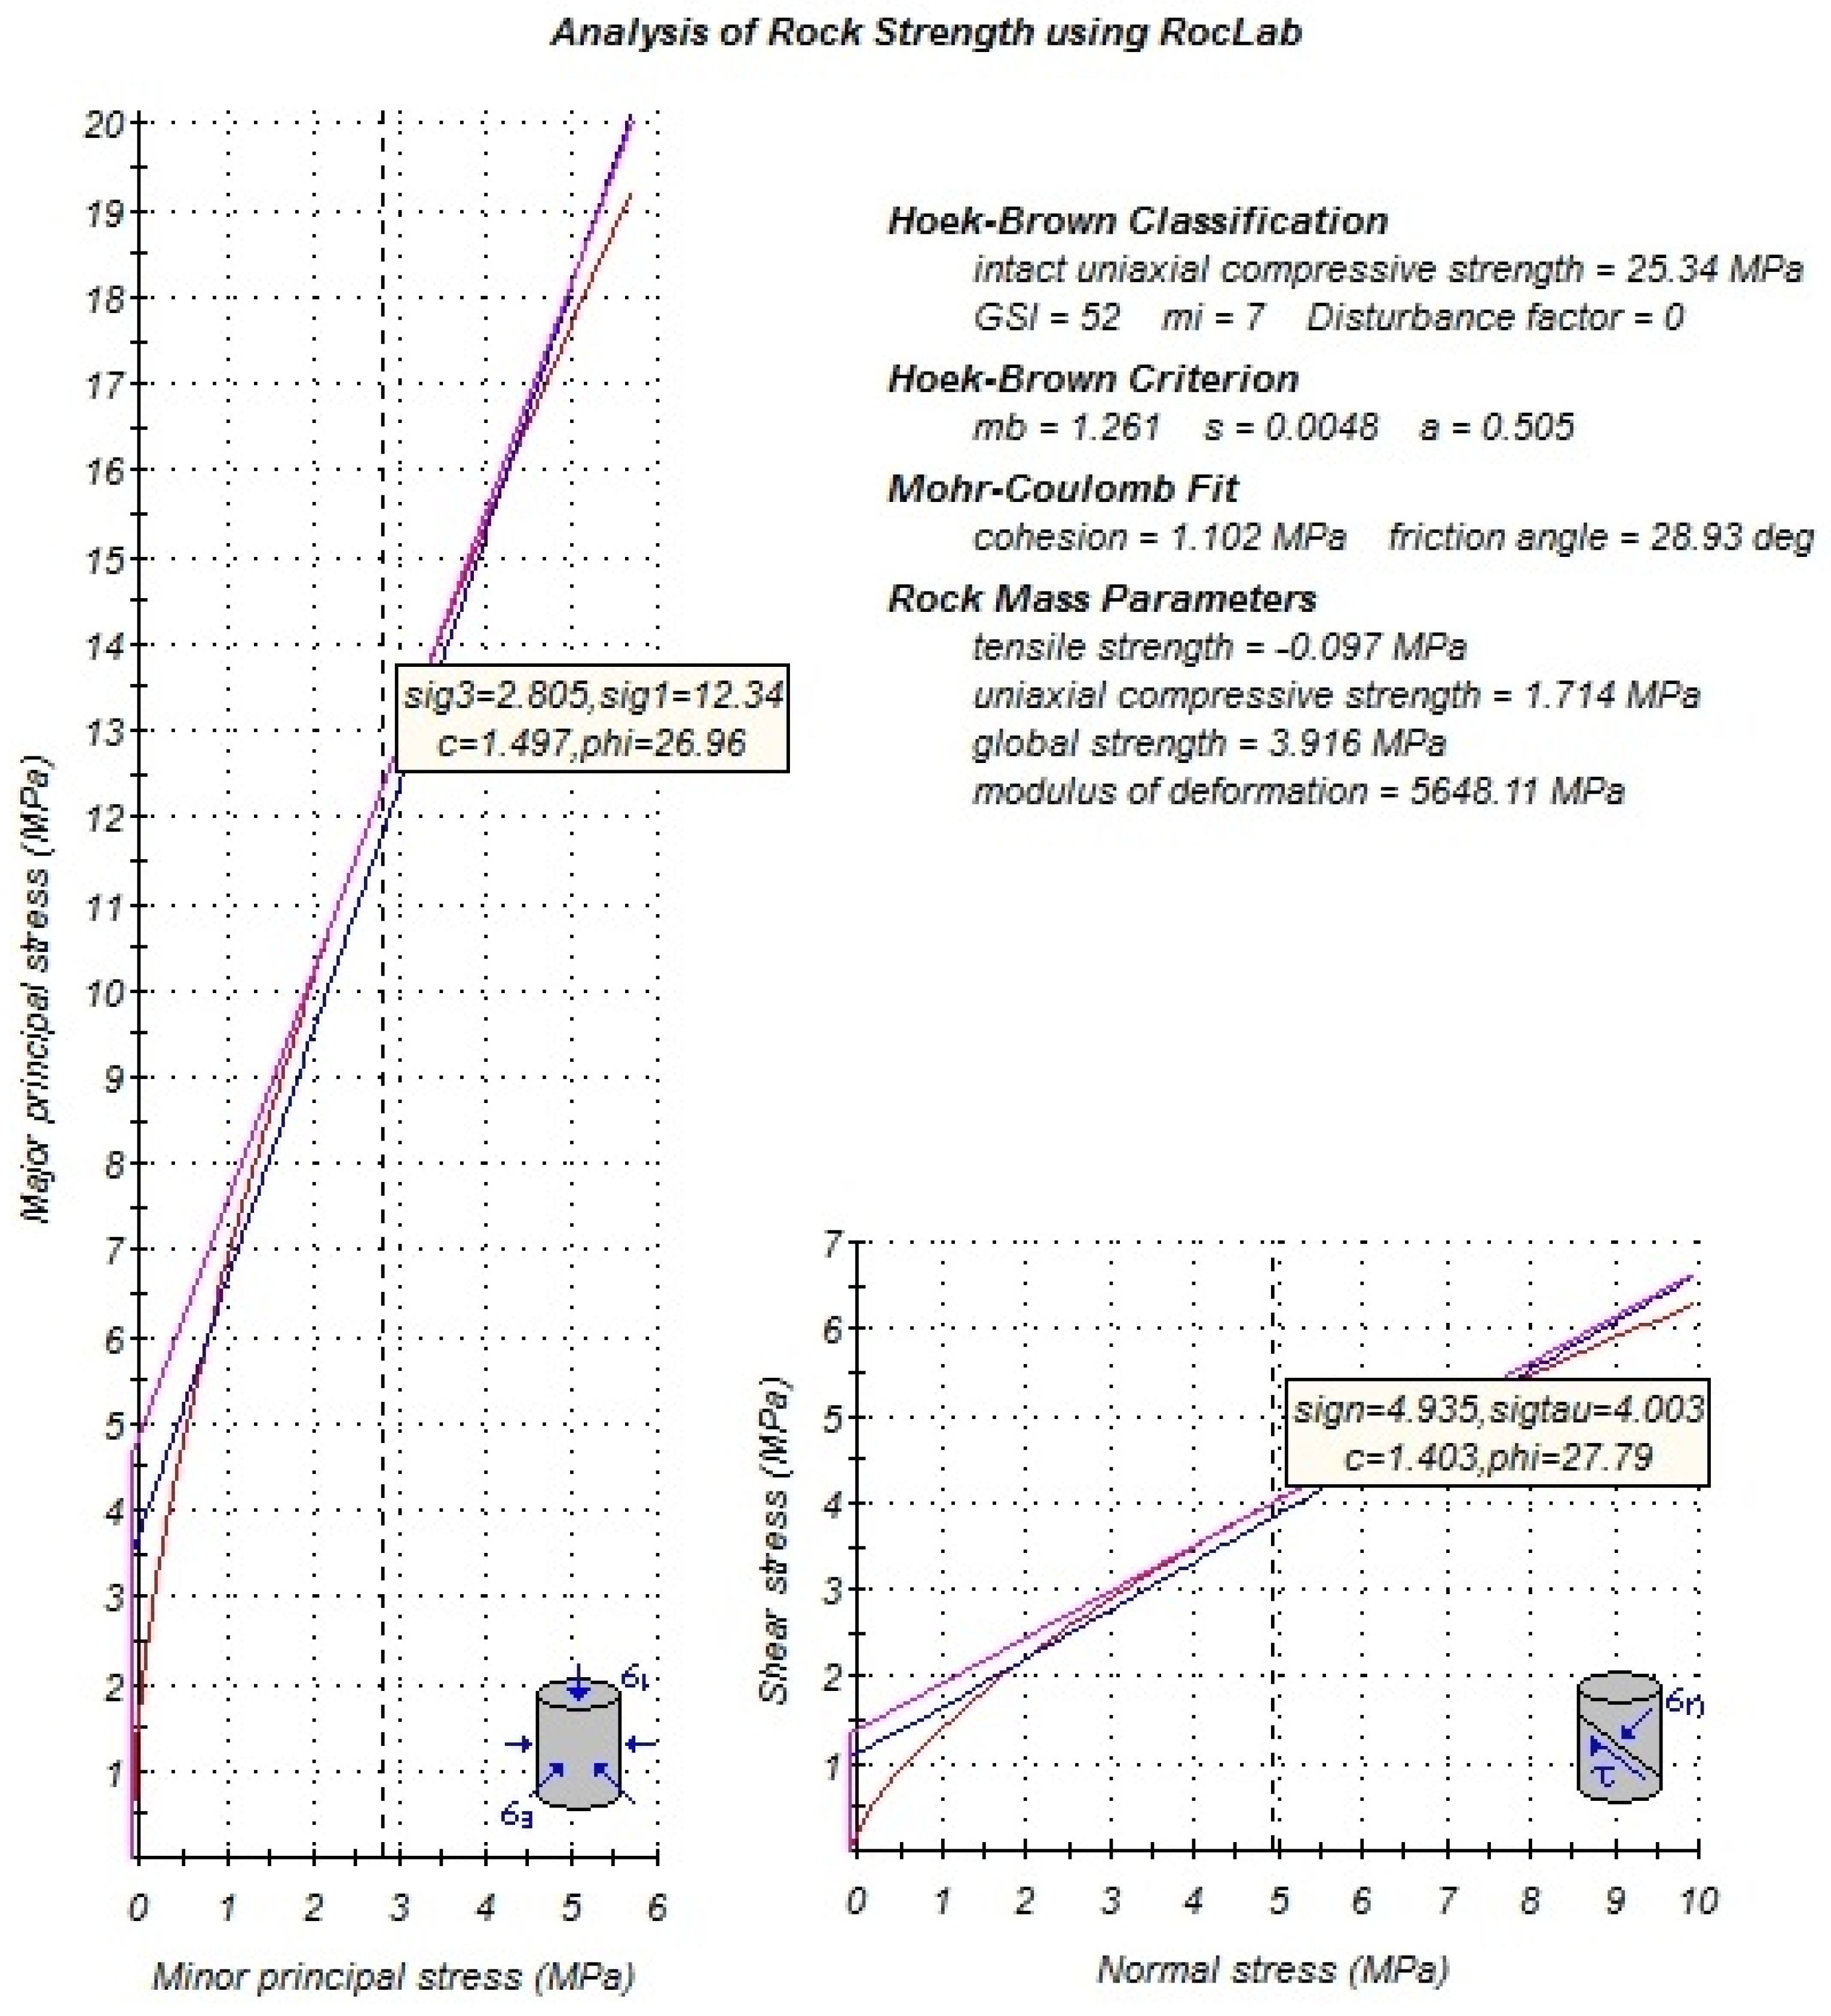
| Hoek–Brown | mb = 1.261; s = 0.0048; a = 0.505 |
| Mohr–Coulomb | C = 1.102 MPa; phi = 28.93° |
| Analysis Method | Estimated sValue | Representative Factor of Safety | Description | Decision |
|---|---|---|---|---|
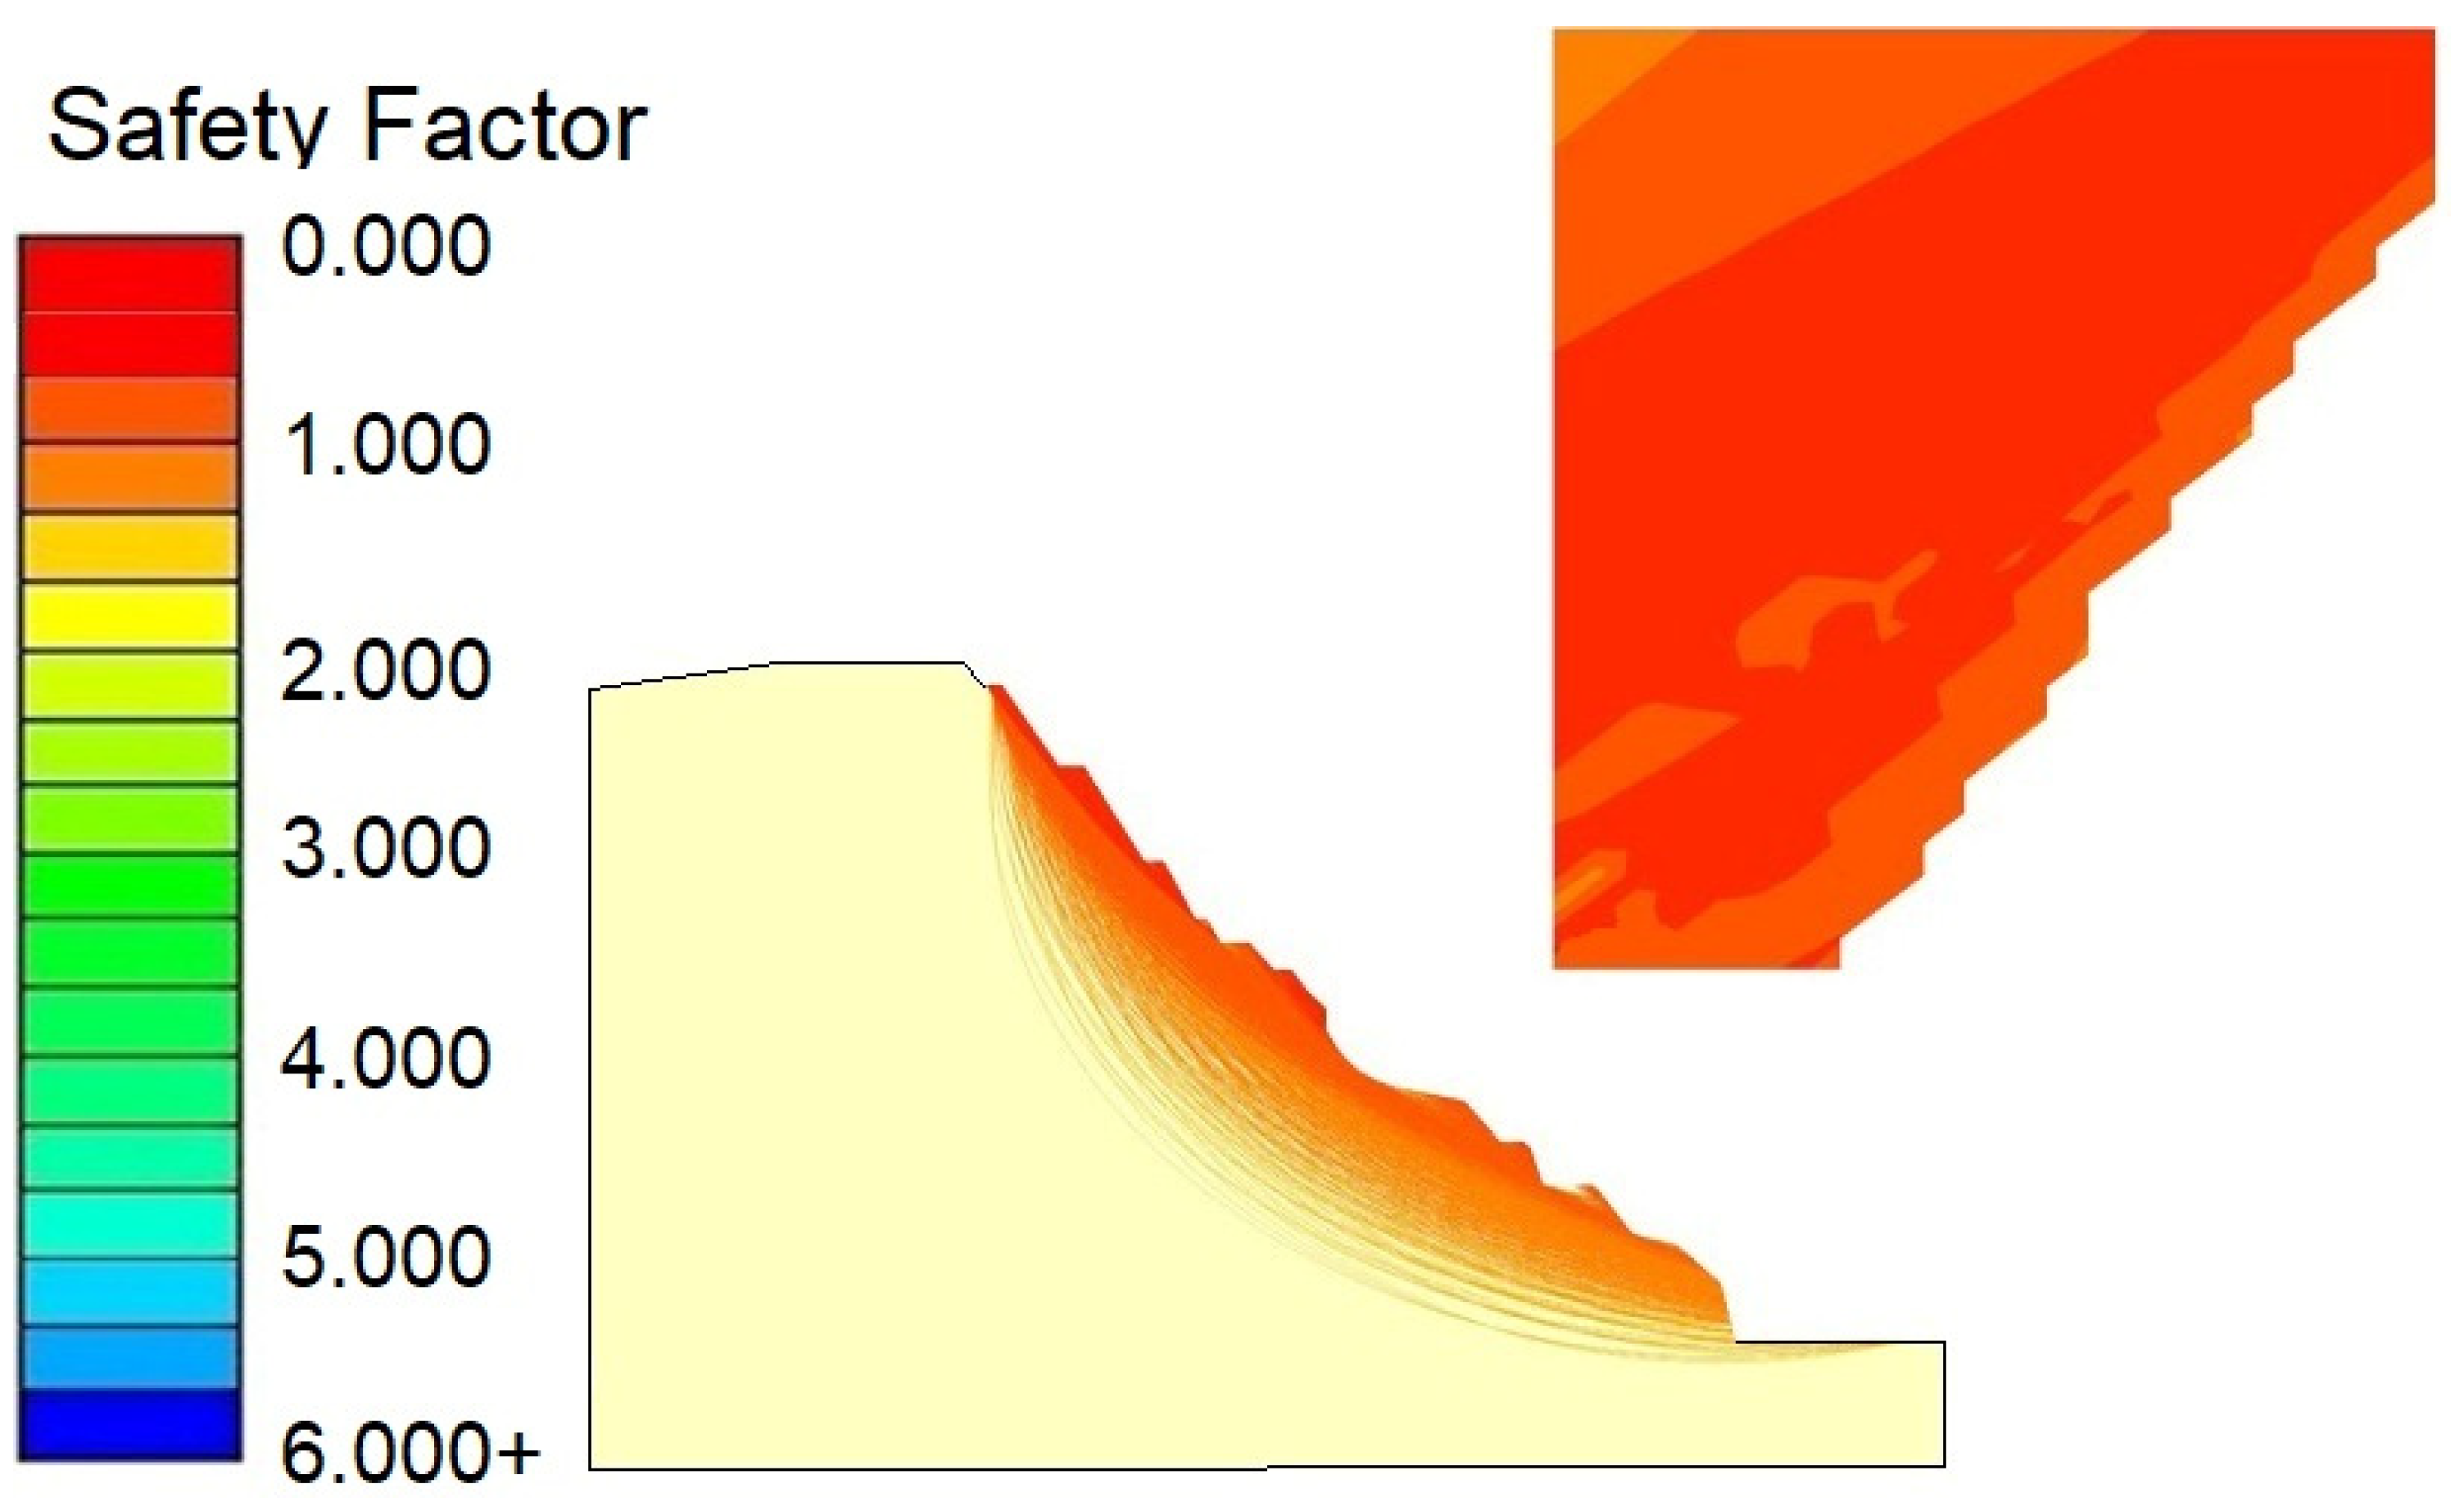
| Limit equilibrium method | 1.035 | 1.035 | Stable with a low safety factor | Critical state |
| Expert opinion | Failure | ~1.00 | Slope need attention | Unstable |
| Qslope | 0.094 | <1.00 | Unstable | Local unstable |
| Fuzzy Qslope_classic | 44.49 (<50%) | 1.047 | Unstable | Local unstable |
| Fuzzy Qslope_modified | 36.45 (<50%) 34.12 (<50%) | 1.057 (Upper) 1.059 (Lower) | Unstable | Local unstable |
Disclaimer/Publisher’s Note: The statements, opinions and data contained in all publications are solely those of the individual author(s) and contributor(s) and not of MDPI and/or the editor(s). MDPI and/or the editor(s) disclaim responsibility for any injury to people or property resulting from any ideas, methods, instructions or products referred to in the content. |
© 2023 by the authors. Licensee MDPI, Basel, Switzerland. This article is an open access article distributed under the terms and conditions of the Creative Commons Attribution (CC BY) license (https://creativecommons.org/licenses/by/4.0/).
Share and Cite
Mao, Y.; Chen, L.; Nanehkaran, Y.A.; Azarafza, M.; Derakhshani, R. Fuzzy-Based Intelligent Model for Rapid Rock Slope Stability Analysis Using Qslope. Water 2023, 15, 2949. https://doi.org/10.3390/w15162949
Mao Y, Chen L, Nanehkaran YA, Azarafza M, Derakhshani R. Fuzzy-Based Intelligent Model for Rapid Rock Slope Stability Analysis Using Qslope. Water. 2023; 15(16):2949. https://doi.org/10.3390/w15162949
Chicago/Turabian StyleMao, Yimin, Liang Chen, Yaser A. Nanehkaran, Mohammad Azarafza, and Reza Derakhshani. 2023. "Fuzzy-Based Intelligent Model for Rapid Rock Slope Stability Analysis Using Qslope" Water 15, no. 16: 2949. https://doi.org/10.3390/w15162949
APA StyleMao, Y., Chen, L., Nanehkaran, Y. A., Azarafza, M., & Derakhshani, R. (2023). Fuzzy-Based Intelligent Model for Rapid Rock Slope Stability Analysis Using Qslope. Water, 15(16), 2949. https://doi.org/10.3390/w15162949