1. Introduction
The balance between the development, utilization, and conservation of groundwater resources is a crucial issue for the sustainable use of groundwater. However, due to the high uncertainty associated with groundwater extraction and recharge rates, it is essential to establish standards for the allowable groundwater withdrawal to prevent groundwater overexploitation and its associated hazards. These standards serve as the basis for groundwater management in different regions. Various factors influence the allowable groundwater withdrawal in different areas, such as groundwater recharge capacity, water rights, water quality, economic considerations, and social factors. Therefore, the establishment of these standards needs to take into account the specific characteristics and conditions of each region. By considering these factors, a more balanced and sustainable management approach can be adopted to ensure the long-term availability and viability of groundwater resources.
There are several methods for establishing groundwater management standards, such as safe yield, optimal yield, sustainable yield, and standardized groundwater index assessment. Safe yield refers to the amount of groundwater that can be extracted from an aquifer without causing adverse effects on the aquifer itself [
1,
2,
3,
4,
5,
6,
7]. It has been widely used by hydrogeologists as a management method to regulate groundwater extraction [
4,
8,
9]. Despite its widespread use in groundwater resource assessment, the concept of safe yield remains controversial. To address this, the concept of optimal yield has been proposed from an optimization perspective [
10]. The optimal yield is determined by selecting the best groundwater management option from a set of possible alternatives, considering social, economic, and water resource use evaluations. Zhou [
11] clarified the dispute over safe yield and explored the concepts of safe yield and sustainable yield using water balance equations. Chen et al. [
12] used Darcy’s law and established optimization linear models with limited data to assess the optimal safe yield of groundwater, integrating grey theory to evaluate parameter uncertainty. Seward et al. [
13] focus on the concept of “capture” rather than “recharge” as a measure of sustainable groundwater use. Capture refers to the total of the increase in recharge introduced by pumping and the decrease in recharge caused by pumping. Sustainable groundwater use depends on the additional pumping volume and is compensated through capture, which can be acceptable to stakeholders. However, uncertainty exists in factors such as pumping time, pumping volume, pumping locations, aquifer heterogeneity, and recharge, making it challenging to precisely determine groundwater balance. Consequently, using pumping volume as a basis for groundwater management can be difficult. Groundwater levels, on the other hand, can be directly and accurately measured. Therefore, groundwater level variations can be utilized as a method for groundwater resource management, such as standardized groundwater index assessment, groundwater level exceedance probabilities, and runs theory.
Runs theory has been applied in several studies to analyze droughts. Yevjevich [
14] proposed three attractive parameters to define droughts, including the duration of a drought, the severity of a drought, and the area run as the deficit of water over a specific time duration and area of drought. Saldariaga and Yevjevich [
15] used run theory and time series to predict drought occurrences. Sen [
16,
17] introduced methods to calculate run lengths and run sum for annual hydrological data. Moye et al. [
18] developed a relevant probability distribution based on difference equations. This distribution enables hydrologists to estimate the expected number of droughts of a specified duration and the average drought length over a desired time period. Moye and Kapadia [
19] used run theory to predict events based on order statistics. Sen [
20] presented a general method to determine the exact probability distribution function of the longest drought duration in a finite sample of any process based on runs theory and enumeration techniques. Saghafian et al. [
21] determined the severity, magnitude, and duration of drought periods on a monthly and longer time basis using a dimensionless Z-score and run theory. Karamouz et al. [
22] developed an algorithm to study drought characteristics, such as duration and severity, for a region. They generated a large sequence of synthetic data to develop the probability density function of drought characteristics for planning and water allocation purposes. Peters et al. [
23] indicated that hydrologic droughts include both streamflow and groundwater drought characteristics. Severity–duration–frequency (SDF) curves are very useful in the analysis of drought phenomena. Station-level information obtained from SDF curves can be interpolated to obtain severity maps for fixed return periods, enabling the joint analysis of the spatial variability of drought characteristics (e.g., severity, duration, and frequency) [
24,
25].
The Pingtung Plain is an important aquifer in southern Taiwan and a key region for agricultural development. Surface water supply in the Pingtung area accounts for only 20% of the total water demand, with groundwater being the primary water source for various water users [
26]. Due to the lack of effective management of groundwater extraction and the fact that groundwater pumping areas are often not recharge areas, excessive pumping during the dry season can easily lead to groundwater over-withdrawal, resulting in land subsidence and seawater intrusion in coastal areas of the Pingtung Plain [
27,
28,
29,
30,
31]. Despite monitoring and management efforts by the government, the actual total volume of groundwater extraction remains unknown. Therefore, sustainable utilization of surface water and groundwater resources has become a critical mission in agricultural water use in the past decade [
31]. In recent years, extreme climate events have significantly impacted the groundwater quality and quantity in the Pingtung Plain. Consequently, innovative scientific analyses are needed for groundwater management to develop better water management strategies. Chang et al. [
32], based on long-term groundwater level data from the Pingtung Plain, used Principal Component Analysis (PCA) and Self-Organizing Map (SOM) regression analysis to assess the fundamental characteristics of the groundwater system. The analysis results suggested that groundwater management plans should take into account the zonal differences of the groundwater system to achieve groundwater protection goals.
This study is based on groundwater level observation data and utilizes the runs theory, a drought analysis method, to analyze the safe groundwater levels in the proximal fan area, mid fan area, and distal fan area of the Pingtung Plain. Additionally, the study aims to analyze the occurrence cycles of groundwater over-extraction in these areas.
3. Methodology
3.1. Data Characteristics Analysis
The Pingtung Plain has 61 self-recording and stratified groundwater level observation stations [
34], which were installed between 1995 and 1998. Over the past 30 years, Taiwan has undergone social development, leading to changes in land use patterns. The area of rice paddies has gradually decreased, while dry fields and aquaculture areas have increased. Consequently, the patterns of groundwater usage have also changed accordingly.
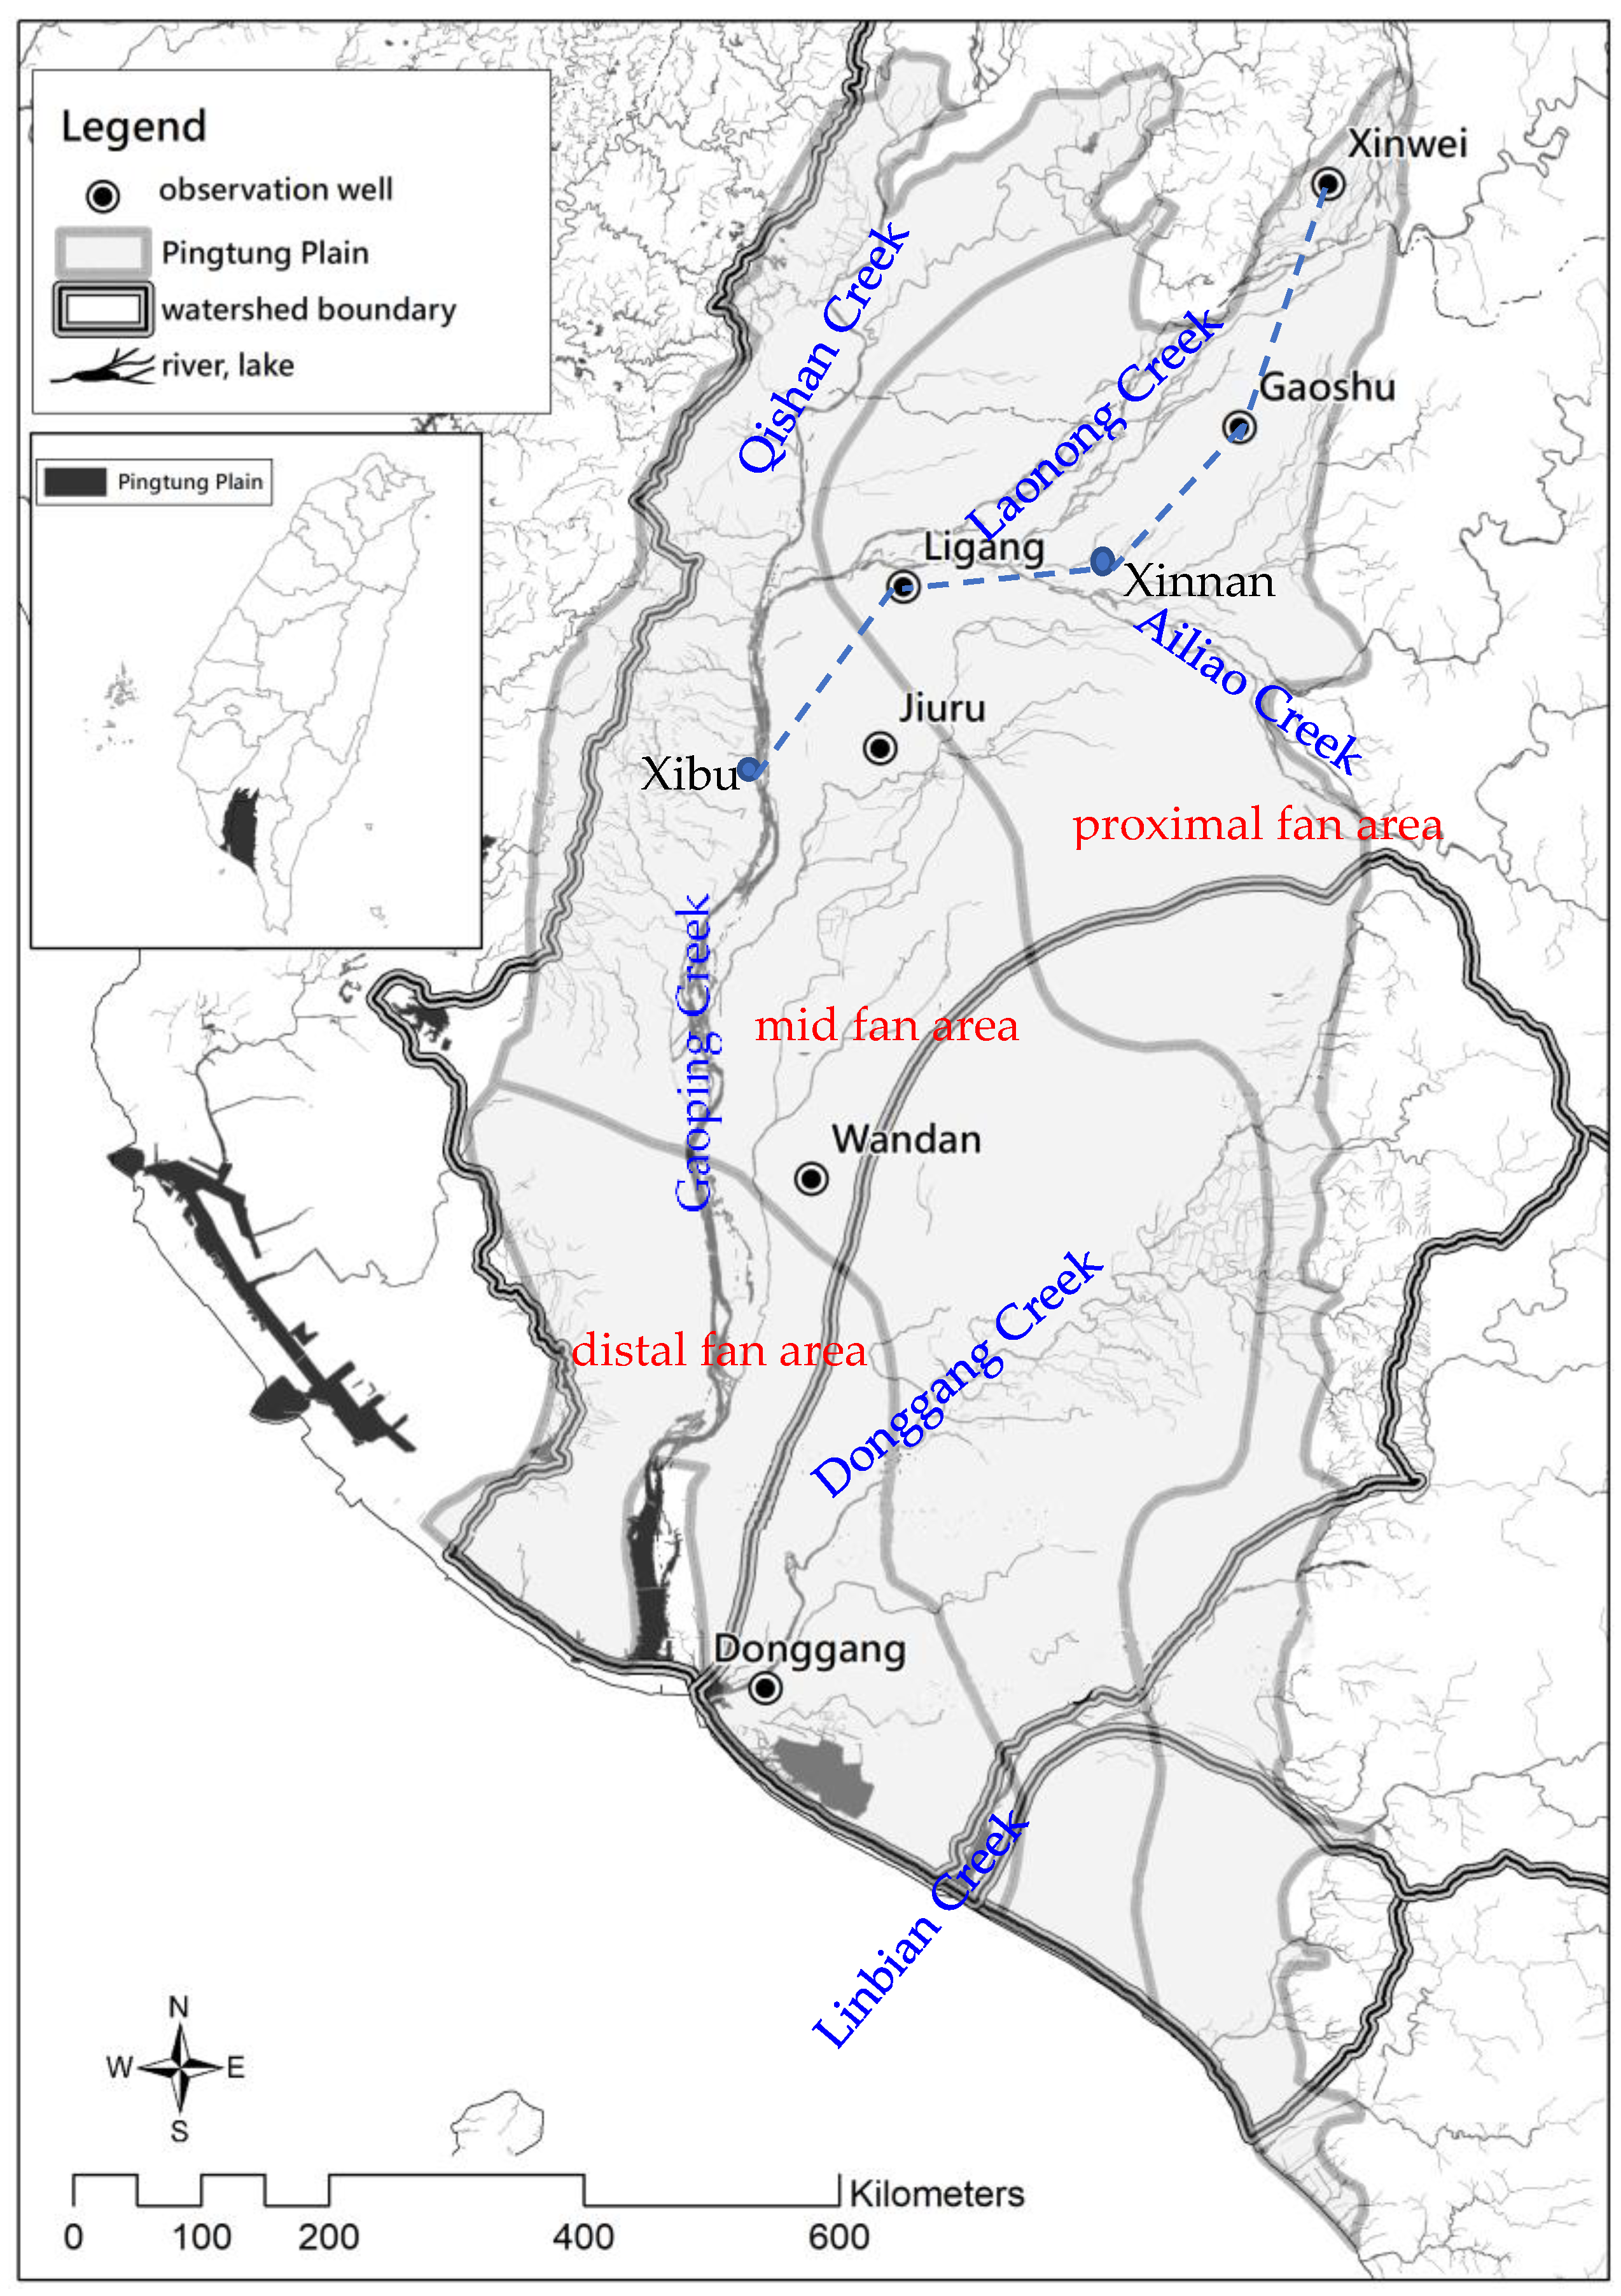
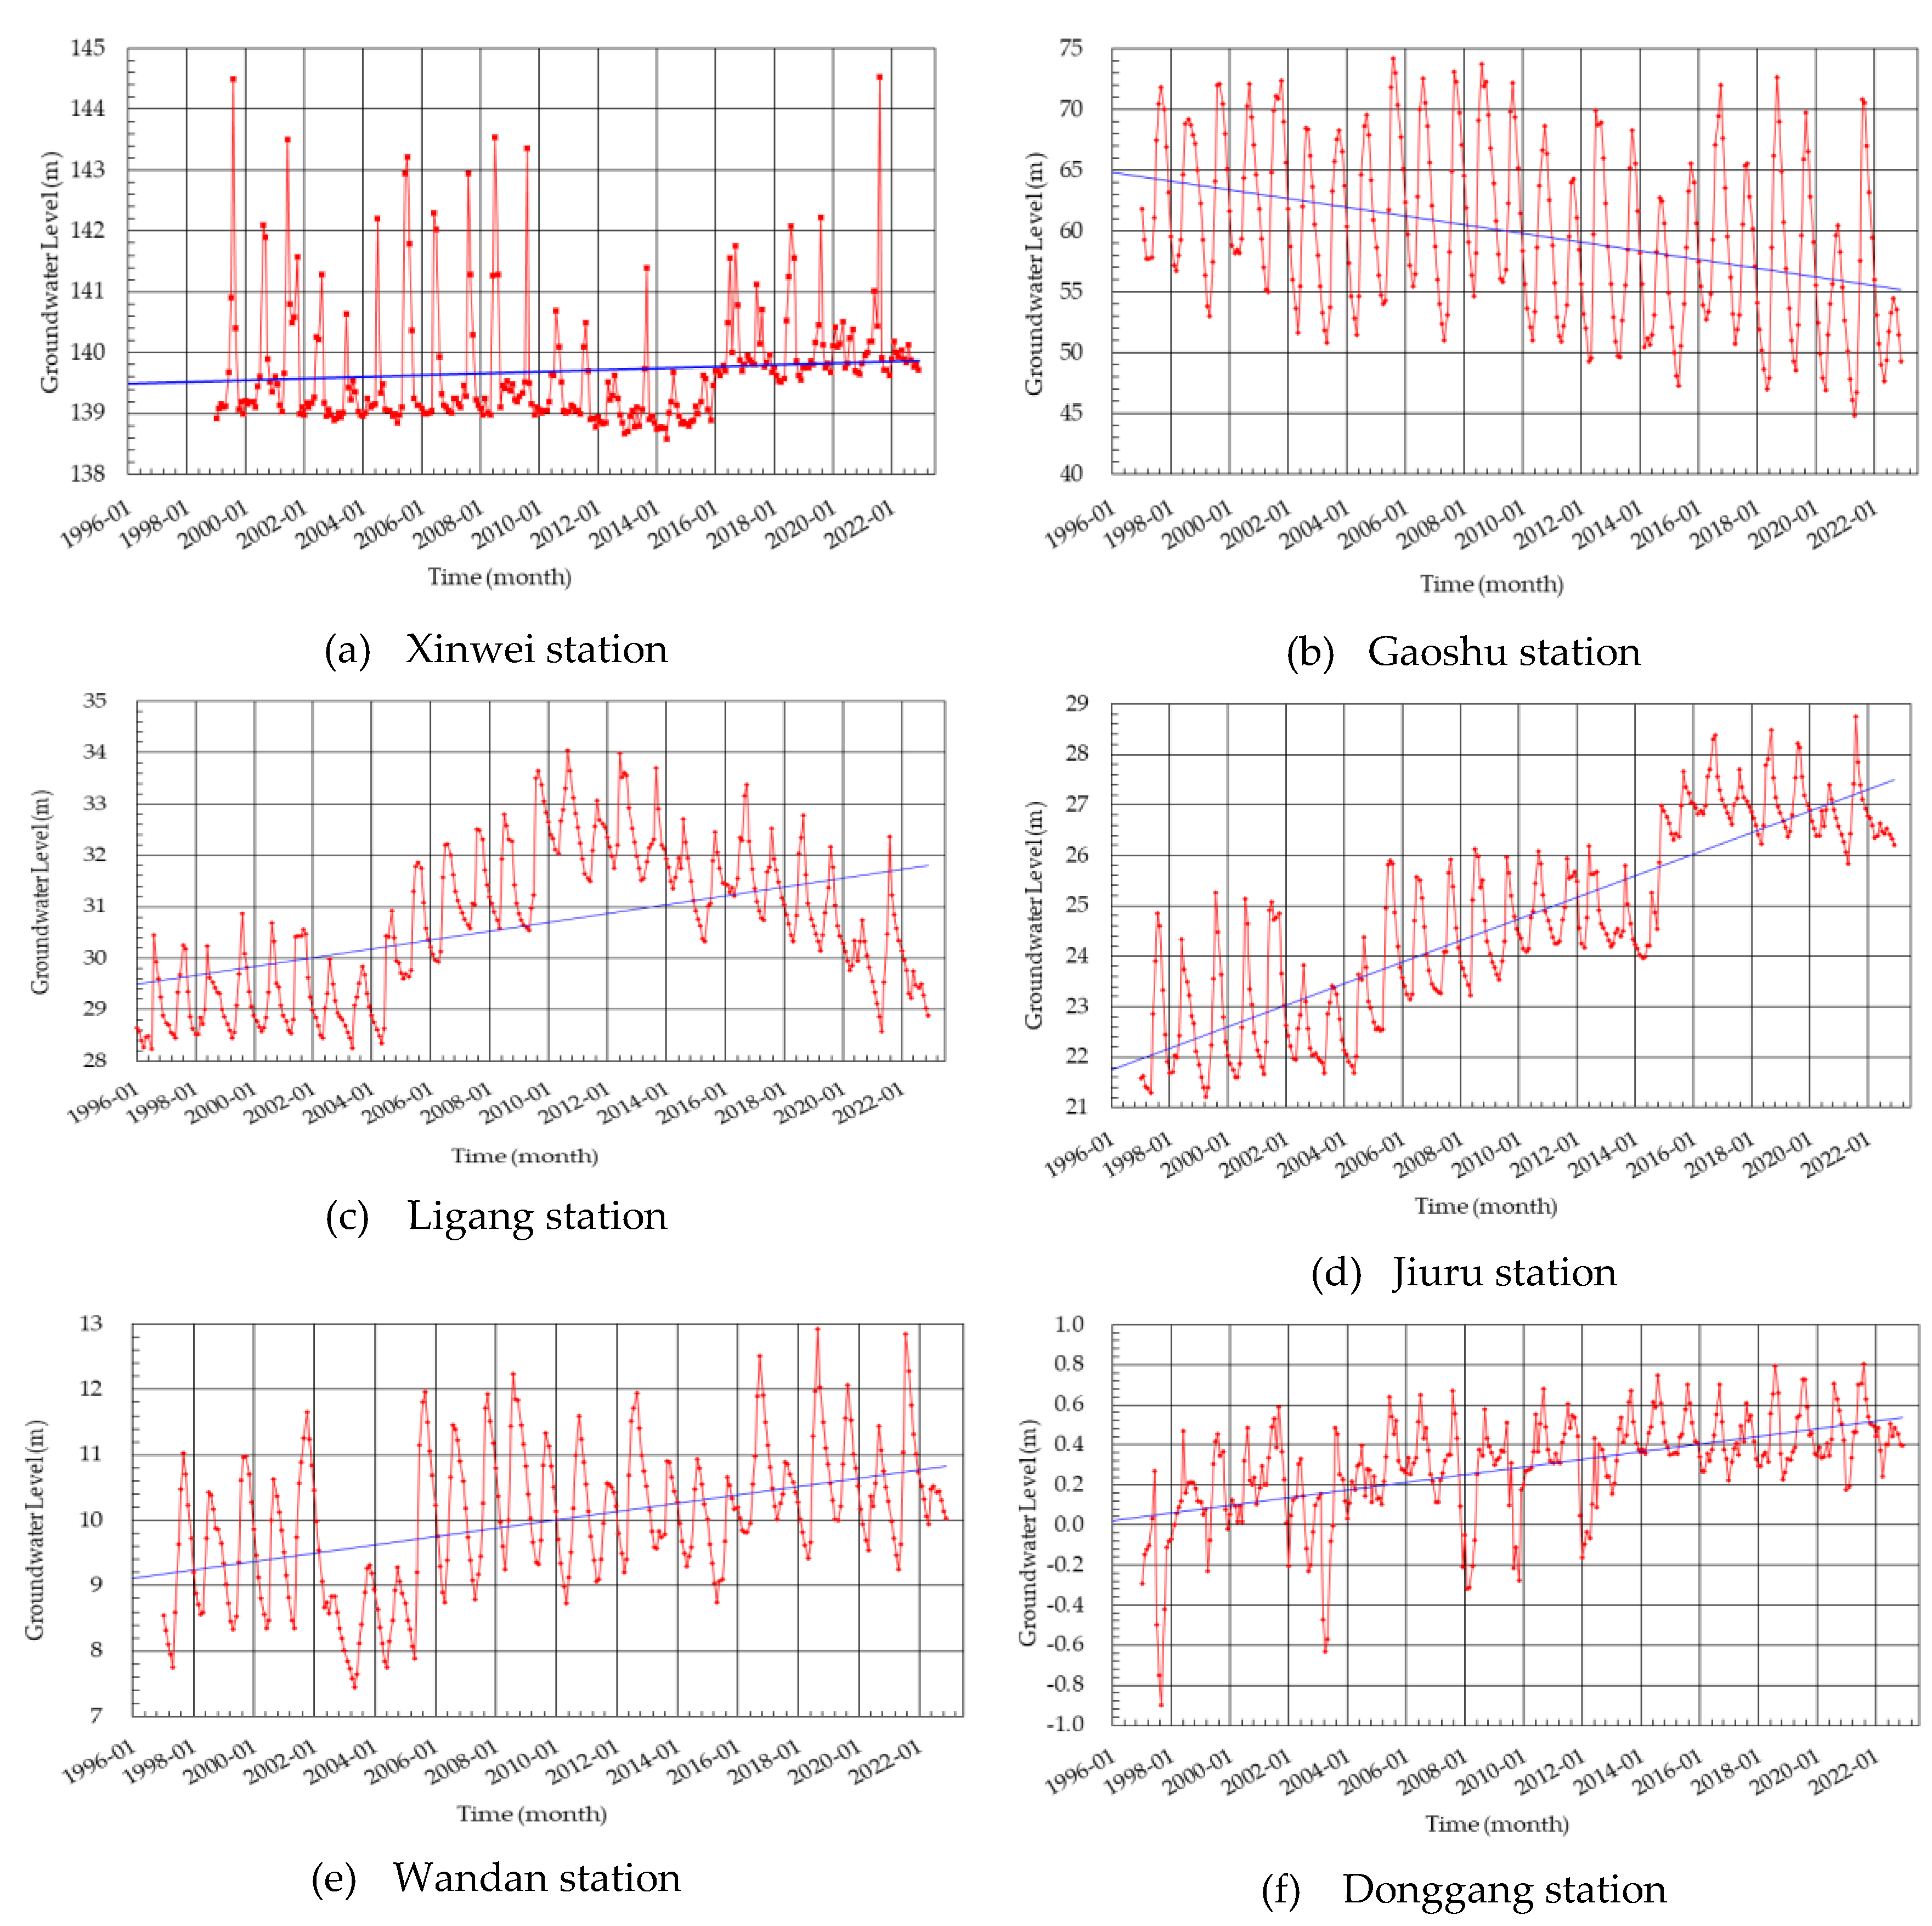
The present study collected monthly average groundwater level data from six shallow monitoring wells located in the Pingtung Plain, including the Xinwei, Gaoshu, Ligang, Jiuru, Wandan, and Donggang stations. The locations of each station and the historical groundwater level profiles are shown in
Figure 1 and
Figure 5, respectively. Among them, the Xinwei, Gaoshu, and Ligang stations are located in the proximal fan area, while the Jiuru and Wandan stations are in the mid fan area, and the Donggang station is in the distal fan area.
The Xinwei station is situated upstream of the Laolong Creek, with a wellhead elevation of 152.023 m, making it the highest-located observation station. The Gao-Shu station is positioned between the Laolong Creek and the Ailiao Creek, mainly dedicated to rice and fruit tree cultivation. The Ligang station is adjacent to the Laolong Creek and serves as an important aquaculture area in Pingtung County, with groundwater being the main water source for aquaculture. The Jiuru and Wandan stations are located upstream and midstream of the Gaoping Creek, respectively. The area is primarily involved in paddy rice, upland crop, and fruit tree cultivation, with groundwater being the primary irrigation source. The Donggang station is situated downstream of the Donggang Creek and falls within an area of seawater intrusion and land subsidence, resulting in its groundwater use being regulated.
Based on the collected groundwater level data, various historical water level characteristics of each observation station were statistically analyzed, as shown in
Table 1. The data include the wellhead elevation, groundwater level observation time, average water level, highest and lowest water levels, and the standard deviation of the water level. Additionally, the groundwater management levels set by the Water Resources Agency for each station are provided in
Table 1 [
35].
3.2. Safe Groundwater Level Analysis
This study defines the groundwater level as the safe level when it is at a certain water level reference and relative time duration reference. When the groundwater level exceeds this water level reference, it is considered to be in a state of groundwater over-withdrawal. If the time duration of groundwater over-withdrawal exceeds the time duration reference, the groundwater system is considered to be in a potentially hazardous stage. Therefore, the determination of the safe groundwater level depends on the groundwater level and its relative time duration. In this study, the runs theory is used to establish the safe groundwater level in the Pingtung Plain. The runs theory is an objective tool for analyzing droughts [
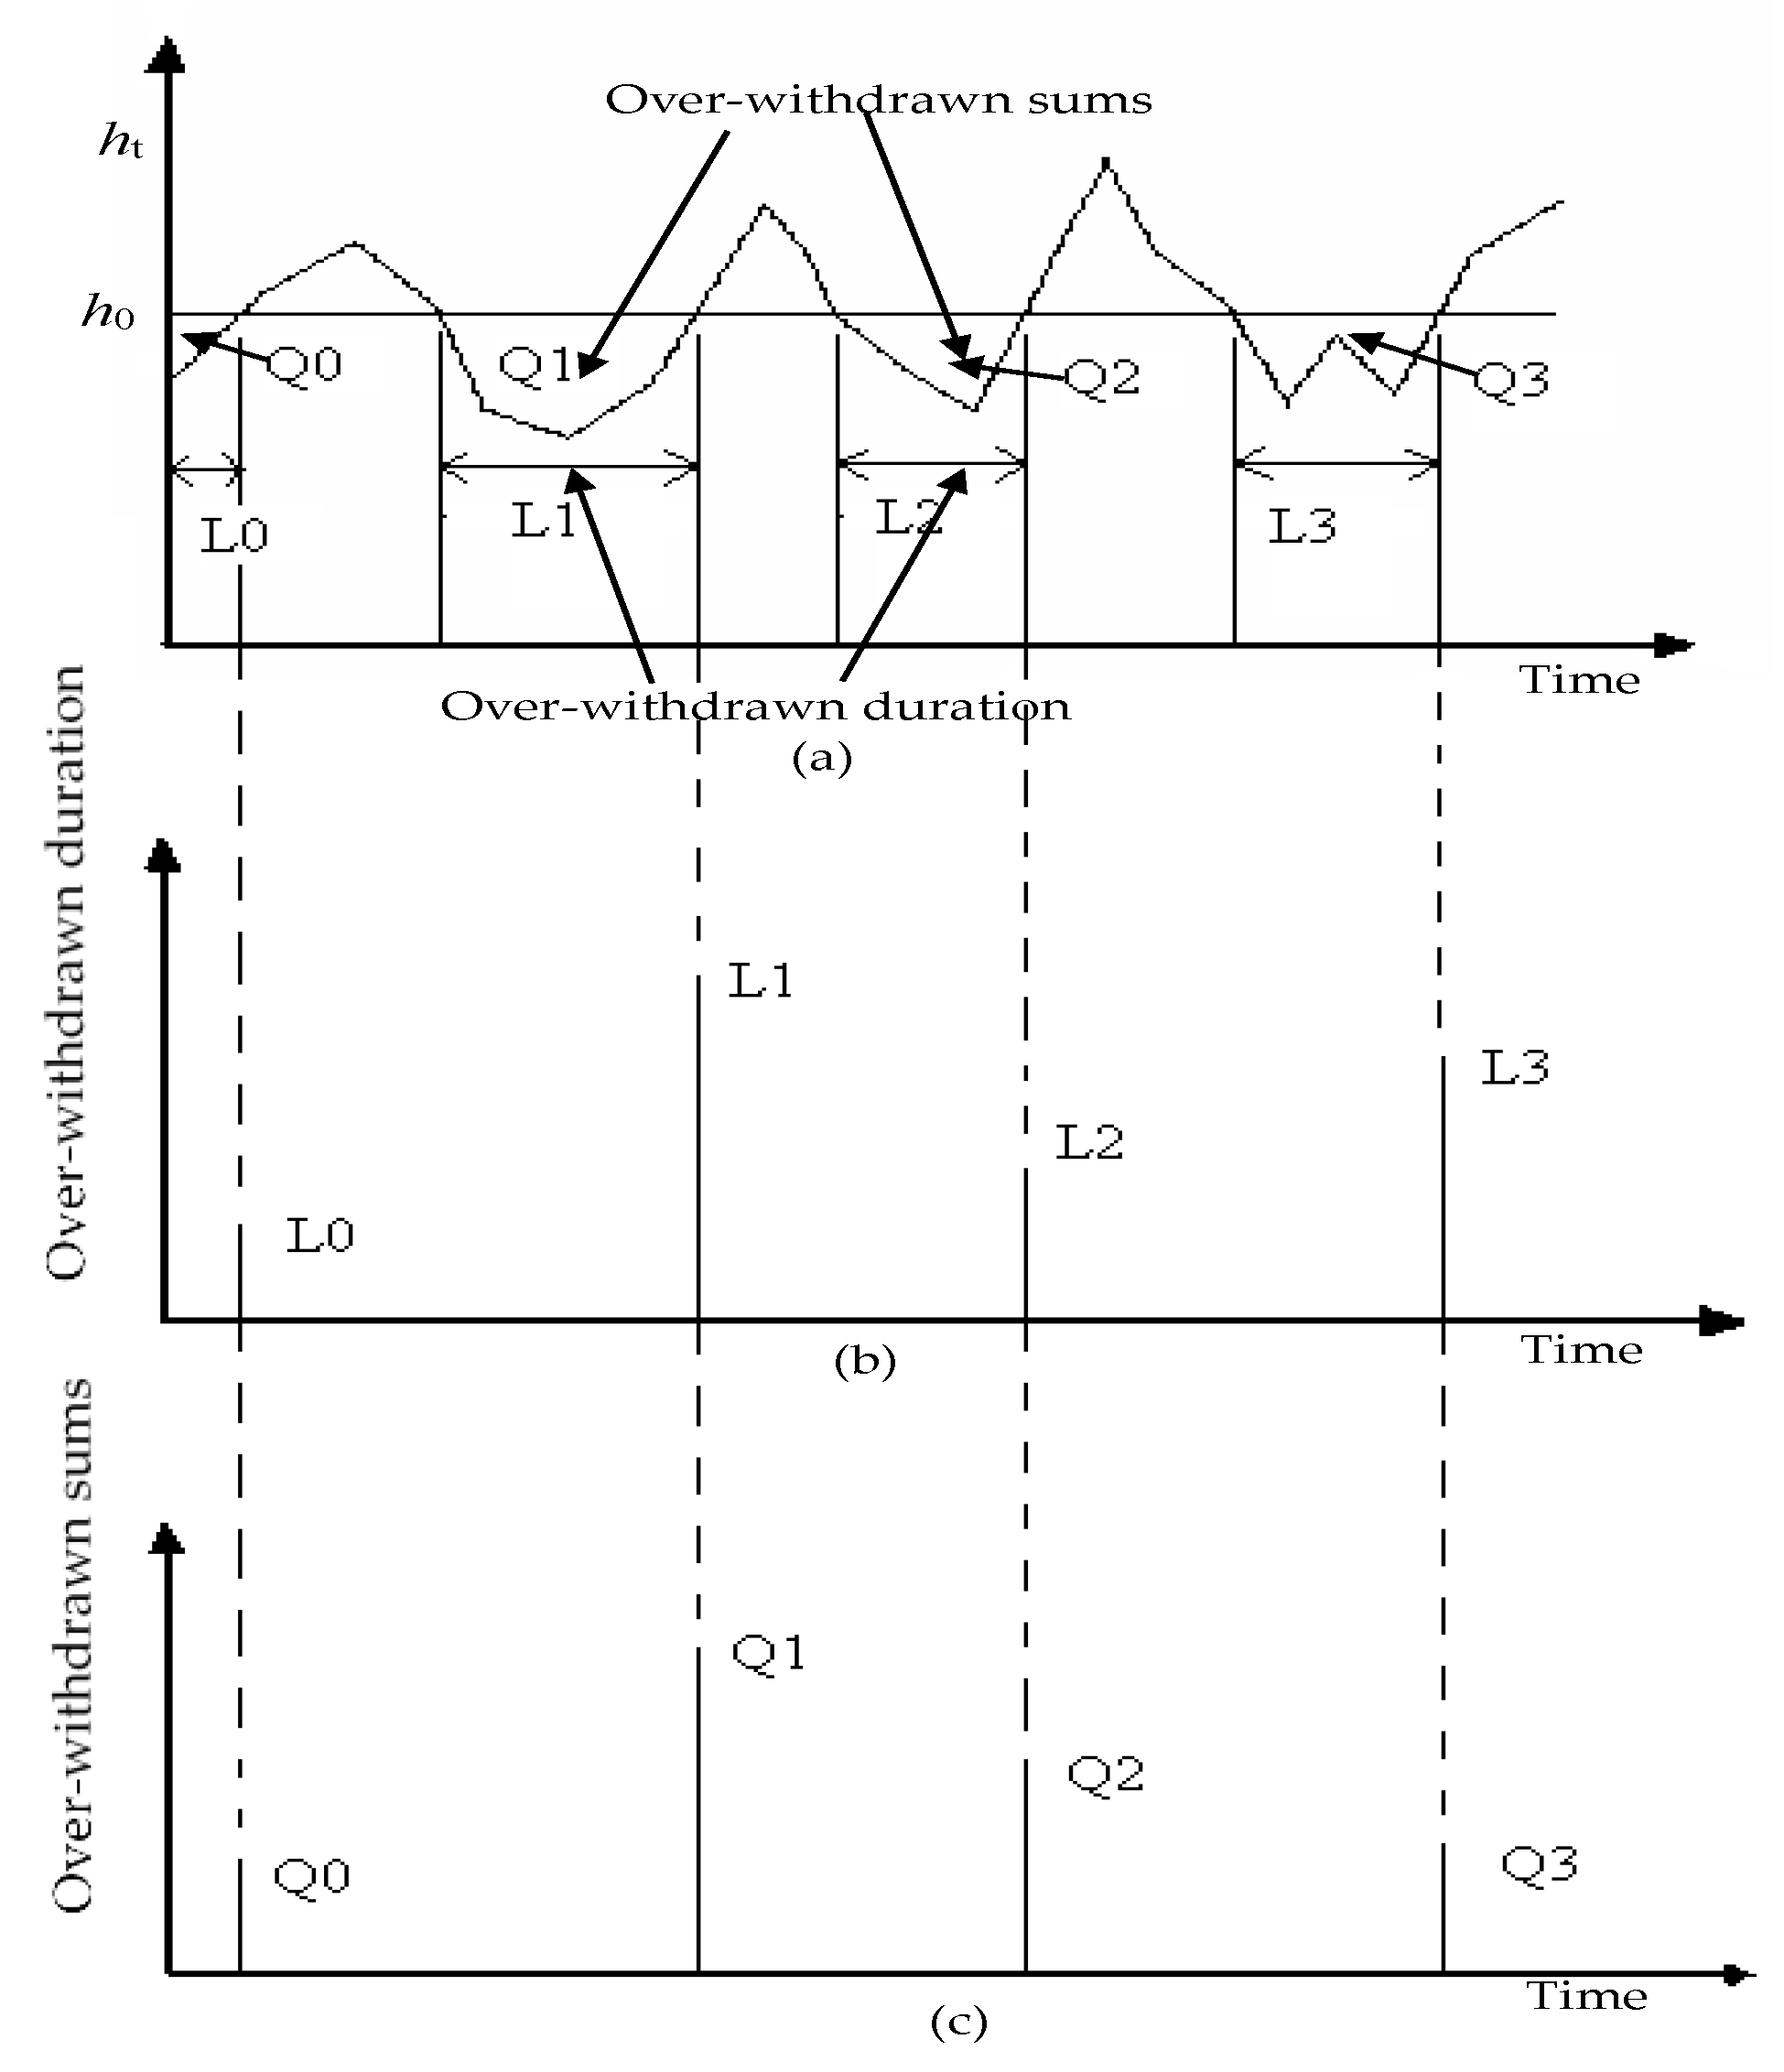
15], and it uses the truncation level to divide the selected variables into two states (as shown in
Figure 6). In this study, the truncation level is defined as the reference for the safe groundwater level. In the figure, the symbol “Qi” represents the cumulative sum of groundwater overdrafts that occurred at each overdraft duration “Li”. Thus, for the study of the safe groundwater level, the range below the truncation level is considered as negative runs, representing the time duration of groundwater over-withdrawal. The area enclosed by the truncation level and the variable curve in the negative runs region represents the cumulative total of groundwater over-withdrawal. In determining the safe groundwater level, five factors are considered: the truncation level, over-withdrawal time duration, cumulative total of over-withdrawal, severity, and over-withdrawal period. These factors are used to assess the risk of hydrogeological disasters relative to groundwater levels falling below the safe level.
The determination of the truncation level varies depending on the geological conditions and the characteristics of groundwater extraction and recharge at different observation sites. In this study, the observed groundwater levels between the maximum and minimum values are divided into 20 equal intervals. The observed groundwater levels are sorted from the smallest to the largest, and the frequency of occurrence and percentage frequency are calculated for each interval. Then, the cumulative frequency percentiles for each interval are calculated. The groundwater levels corresponding to the 10%, 20%, 30%, 40%, 50%, 60%, 70%, 80%, and 90% cumulative frequency percentiles are taken as the truncation levels.
The determination of the over-withdrawn duration is obtained from the groundwater level hydrograph in relation to the truncation level, which provides the time duration of each over-drawdown event. The over-withdrawn duration criterion is defined based on the ease of groundwater recharge and the time period for recharge. In this study, the period of high water availability, such as the wet season, is used as the over-withdrawn duration criterion. The over-withdrawn volume is defined as the area enclosed by the groundwater level hydrograph and the truncation level. Severity (M) is calculated by dividing the over-withdrawn volume (S) by the super-drawdown duration (D), i.e., M = S/D. The over-withdrawn period represents the average time interval between occurrences of groundwater over-withdrawn events, as determined by the safe withdrawal intervals.
The determination of safe groundwater levels depends on the geological conditions and the conditions of groundwater extraction and recharge at each observation station. In the proximal fan area and distal fan area, the safe groundwater levels are set as the mean of the observation data plus 0.5 times the standard deviation. In the mid fan area, the safe groundwater level is set as the mean of the observation data.
4. Analysis Results and Discussion
Based on the statistical data from
Table 1, it can be observed that among the six observation stations, the groundwater level variability is highest at the Gaoshu station and lowest at the Donggang station. Additionally, the groundwater management levels set by the Water Resources Agency (WRA) are higher than the average groundwater levels at all stations. Analyzing the long-term groundwater level trends from
Figure 5, in this figure, the blue line represents the linear regression trend of groundwater level observation data. Trend analysis indicates that among the six observation stations, only the groundwater level at Gaoshu station shows a decreasing trend, while the other five stations exhibit an upward trend over the long term. This information indicates that the groundwater conditions in the study area vary significantly among the observation stations. The Gaoshu station experiences the highest fluctuation in groundwater levels, while the Donggang station remains relatively stable. The WRA’s management strategy of maintaining groundwater levels above average levels could be a proactive measure to prevent excessive groundwater overdraft and potential adverse effects on the aquifer system.
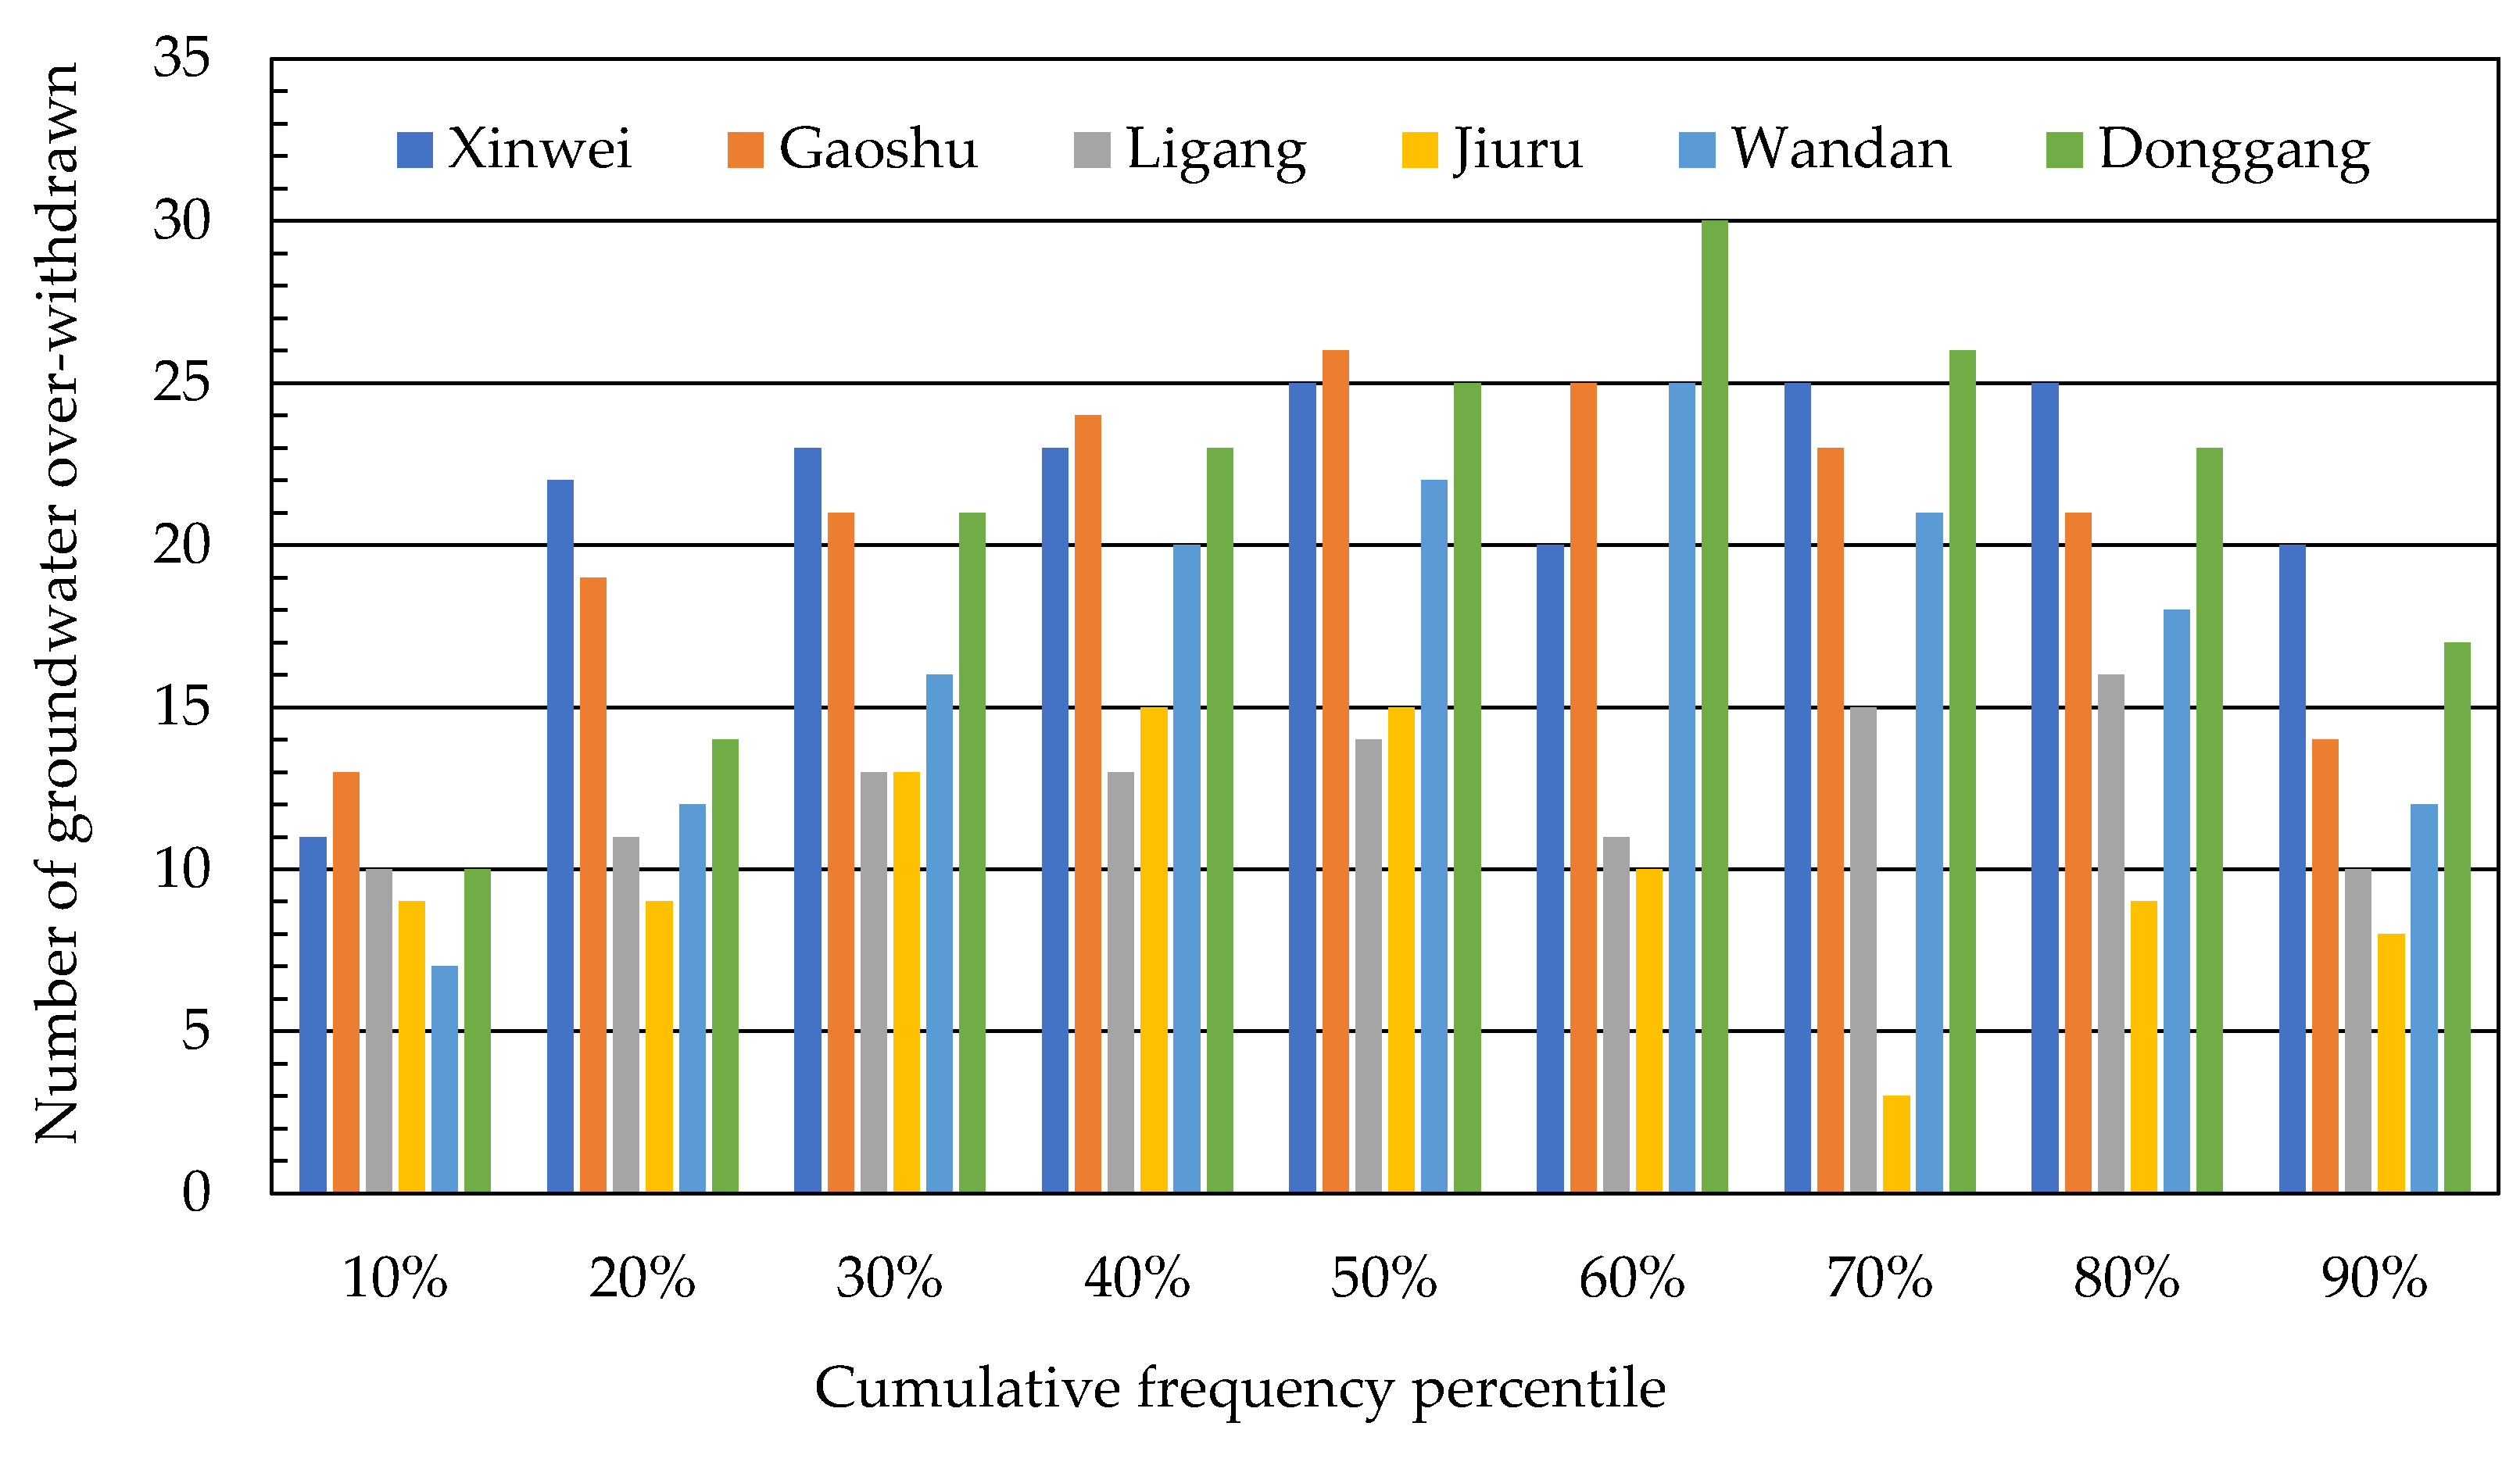
Based on the data collected from various groundwater observation stations, the cumulative frequency percentile corresponding to groundwater levels was used as a truncation level for the analysis of groundwater overdraft using the runs theory, as shown in
Figure 7. From this figure, it can be observed that the average frequency of groundwater overdraft is highest at the Xinwei station in the proximal fan area and at the Donggang station in the distal fan area. Additionally, the Donggang station exhibits the highest standard deviation in groundwater overdraft frequency, indicating that groundwater level variations in the distal fan area are influenced significantly by both extraction and recharge processes. On the other hand, the soil texture in the proximal fan area is characterized by good permeability, making it an easily rechargeable zone. As a result, the groundwater levels in this area exhibit lower variability. Furthermore, the analysis of groundwater overdraft frequency based on different cumulative frequency percentiles reveals that the 50% percentile has the highest frequency of groundwater overdraft events, while the 10% percentile has the fewest occurrences.
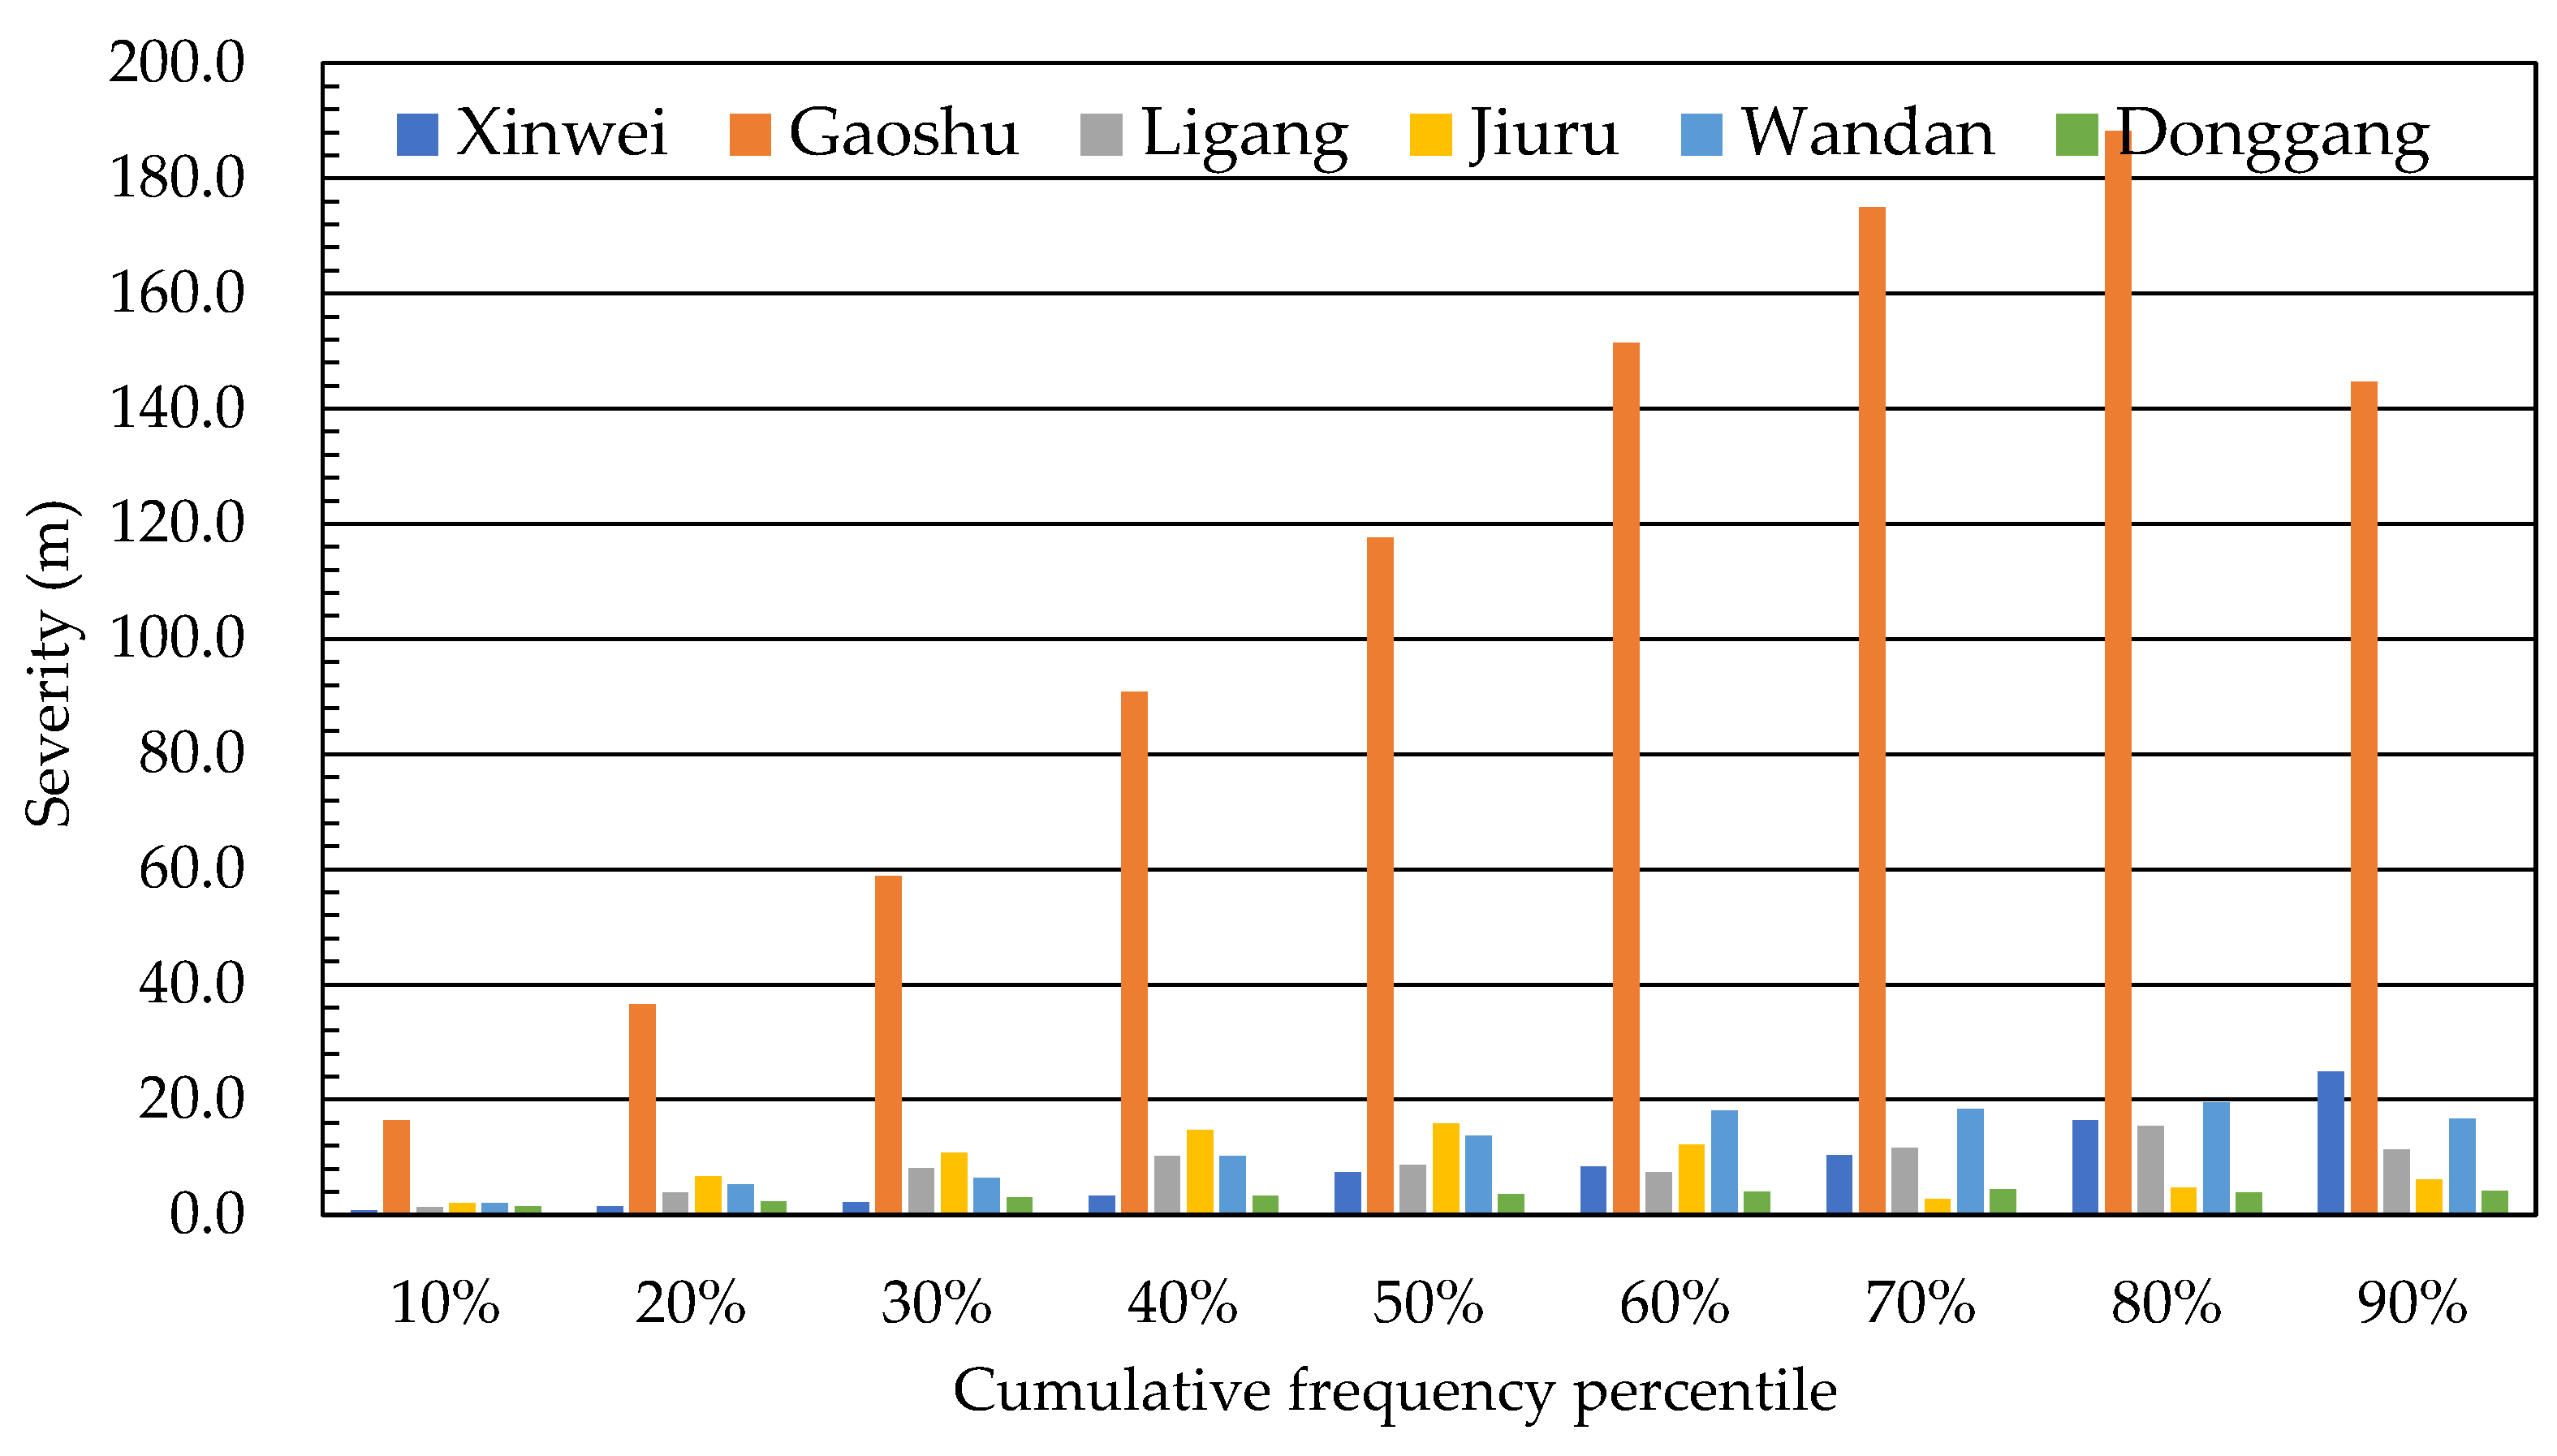
The analysis of the runs theory provides the cumulative total of groundwater over-withdrawn and the corresponding over-withdrawn duration at various percentiles for each observation well. By calculating the severity of groundwater over-withdrawal at different cumulative percentiles, as shown in
Figure 8, it is evident that the highest severity of groundwater over-withdrawal occurs at the Gaoshu observation well, especially at the 80th percentile. This indicates that the groundwater over-withdrawal at Gaoshu station is most severe and occurs frequently, posing potential risks to the aquifer in that area. On the other hand, the Donggang station shows the lowest severity of groundwater over-withdrawal. This is expected, since this station is located in a groundwater extraction regulated area, where measures are implemented to control groundwater extraction and prevent excessive over-withdrawal. Moreover, across all the cumulative percentiles, the 80th percentile demonstrates the highest severity of groundwater over-withdrawal, while the 10th percentile exhibits the lowest severity. This suggests that the more extreme and intense over-withdrawal events are more likely to occur at higher cumulative percentiles, which underscores the importance of sustainable groundwater management practices to mitigate the adverse impacts of groundwater over-extraction. Overall, the analysis using the runs theory provides valuable insights into the severity and frequency of groundwater over-withdrawal at different observation wells, guiding better management strategies to ensure the sustainable use of groundwater resources in the Pingtung Plain.
From the data collected at each groundwater observation well, the over-withdrawn duration, cumulative over-withdrawn sum, and severity of over-withdrawal at various cumulative percentiles can be determined based on the corresponding groundwater levels at each percentile. The distribution of over-withdrawn duration at different percentiles can be obtained, and the average over-withdrawn duration and its standard deviation are calculated as shown in
Table 2. According to
Table 2, it can be observed that as the groundwater levels at the percentile-based segmentation decrease, the management of groundwater becomes more relaxed, but it also increases the risk of groundwater over-withdrawal. Smaller average over-withdrawn durations are associated with smaller standard deviations in over-withdrawn duration. Conversely, as the groundwater levels at the percentile-based segmentation increase, the average over-withdrawn duration also increases, indicating more stringent management of groundwater extraction and potentially higher management costs. At the Jiuru station, the average over-withdrawn duration is the highest at the 70th percentile, as shown in
Figure 7, which indicates that this station experiences the least frequent groundwater over-withdrawal events. However, it also exhibits the highest variation in over-withdrawn duration, suggesting a more unpredictable pattern of groundwater extraction in this area.
Based on the regression analysis using the groundwater levels at different percentiles and the average over-withdrawn duration from
Table 2, the coefficient of determination was used to determine the best-fitting equation for each observation well. The regression equations for each observation well are presented in
Table 3. It is evident that the regression equations for Xinwei, Wandan, and Donggang stations follow a quadratic polynomial form, while the equations for Gaoshu and Ligang stations exhibit a power function. On the other hand, the regression equation for Jiuru station takes the form of an exponential function.
These diverse regression equations indicate that the relationship between groundwater levels and average over-withdrawn duration varies across different observation wells. Understanding these relationships can assist in formulating specific groundwater management strategies tailored to each site’s characteristics, ensuring sustainable groundwater use in the Pingtung Plain. Based on the determination of the safe groundwater levels using the average and standard deviation data from
Table 1, the approach of adding 0.5 times the standard deviation to the average groundwater level was applied for the proximal and distal fan areas, while the average groundwater level was used for the mid fan area. By substituting the safe groundwater levels and the management groundwater levels into the regression equations from
Table 3, the calculated over-withdrawn duration periods are presented in
Table 4. From
Table 4, it can be observed that the safe groundwater levels for Xinwei, Gaoshu, and Ligang stations in the proximal fan area are 140.0, 64.0, and 31.0 m, respectively. For the mid fan area, Jiuru and Wandan stations have safe groundwater levels of 24 and 10 m, respectively. In the distal fan area, the safe groundwater level for Donggang station is 0.4 m. The over-withdrawn duration periods for the proximal fan area, mid fan area, and distal fan area are 8 to 10 months, 6 to 9 months, and 8 months, respectively. These results provide valuable information for groundwater management and sustainable use in different areas of the Pingtung Plain.
5. Conclusions
This study utilized runs theory to analyze the safe groundwater levels and overdraft duration periods of six groundwater observation stations in the Pingtung Plain. The analysis revealed that, in the long term, only the groundwater level at Gaoshu station showed a declining trend, while the other five stations exhibited rising trends. Additionally, Gaoshu station had the highest variability in groundwater levels. The occurrence of groundwater overdraft varied, with the highest frequency at the 50% cumulative frequency percentile and the lowest at the 10% percentile. The determined safe groundwater levels for the proximal fan area were 140.0, 64.0, and 31.0 m for Xinwei, Gaoshu, and Ligang stations, respectively. In the mid fan area, the safe groundwater levels were 24 and 10 m for Jiuru and Wandan stations, respectively. For the distal fan area, the safe groundwater level at Donggang station was 0.4 m. The over-withdrawn duration periods for the proximal fan area, mid fan area, and distal fan area were 8 to 10 months, 6 to 9 months, and 8 months, respectively. These findings provide valuable insights into the groundwater management and sustainable use in different regions of the Pingtung Plain.
In future groundwater management in the Pingtung Plain, apart from analyzing the changes in observed groundwater levels, it is important to consider the potential impact of excessive pumping duration when groundwater levels fall below the safe threshold. Therefore, establishing a reasonable groundwater overdraft duration is crucial for the sustainable utilization and management of groundwater resources. It is suggested that in the future, discussions could be focused on how the changing rainfall distribution due to climate change might influence the safe groundwater levels and the management of overdraft duration in the Pingtung Plain.
