Article

Characteristics of the Sediment Transport Process in Vegetation Hillslopes under Different Flow Rates

1
School of Geographic Information and Tourism, Chuzhou University, Chuzhou 239000, China
2
School of Water Sciences, Beijing Normal University, No. 19 Xinjiekouwai Street, Beijing 100875, China
*
Authors to whom correspondence should be addressed.
Water 2023, 15(16), 2922; https://doi.org/10.3390/w15162922
Submission received: 23 June 2023 / Revised: 31 July 2023 / Accepted: 10 August 2023 / Published: 13 August 2023

Abstract

:
Vegetation filter strips (VFSs) have always been an important measure to control agricultural soil erosion, especially in mountainous and hilly areas with more sloping farmland. To investigate the mechanism of the sediment-trapping process by VFSs, a series of tests were conducted with four gradients of flow rate, 7.5–45 L min−1 m−1, and two different sediment concentrations of 40 and 120 g L−1. The whole process of overland flow was monitored, and sediment and particle size samples from the inflow and outflow were collected and measured. The results showed that the changes in sediment concentration did not significantly affect the corresponding coefficients in the power function relationship between overland flow rate and velocity. Using the Reynolds number alone cannot effectively indicate the flow pattern of overland flow on vegetation hillslopes. The peak particle size and linear function were effective in describing the relationship between sediment particle composition and delivery rate during the sediment-trapping process by VFSs. During the sediment-trapping process, the sediment-trapping capacity of VFSs continued to decrease. The increase in sediment discharge was accompanied by a higher proportion of coarse particles. Under the same flow rate conditions, when the sediment concentration was higher, the coarse particles and their proportion also increased faster. Therefore, using only a certain particle size threshold to distinguish suspended and transported sediment may lead to inaccurate estimation of the sediment-trapping performance of VFSs. This study deepened the understanding of the mechanism of water–sediment processes on vegetation hillslopes and promoted the widespread and efficient application of VFSs management technology.

1. Introduction

The protection of the water and soil environment has always been a hot research topic in the 21st century and has received widespread attention from natural scientists and sociologists [1]. The rapid growth of the total population has aggravated the global food crisis. Meanwhile, agricultural land is becoming scarce, vegetation is often destroyed by humans, soil loss and river pollution are gradually aggravated, and environmental problems are becoming increasingly serious [2,3]. To control such serious soil erosion and improve the ecological environment, the Chinese government has implemented the “Grain for Green Project” since 1999 [4]. For more than 20 years, vegetation has been gradually restored in many bare soil areas under the measures of closing hillsides to facilitate afforestation and artificial planting [5].
Vegetation on hillslopes has great sediment-trapping capacity and is the main area where sediment deposition occurs in watersheds [6]. Vegetation has been shown to increase the resistance and shear stress close to the bed surface, consume the kinetic energy, and slow the shallow overland flow [7]. The results of Gumiere et al. showed that the resistance of vegetation to overland flow was to the square of velocity [8]. Some studies have noted that in the sediment-trapping process on vegetation hillslopes, vegetation resistance decreases the sediment transport capacity of overland flow and sediment deposition occurs when the transport capacity is less than the real-time sediment-laden amount [9]. The results of Ghadiri et al. showed that the sediment transport capacity of overland flow increased by more than 60 times as the slope increased from 1.5% to 5.2%. This indicates that on steep slopes, the overland flow on the hillslope has better sediment transport capacity, which corresponds to a worse sediment-trapping effect [10]. On the one hand, the deposited sediment can be rolled up again [11]. On the other hand, the deposited sediment moved downhill in the form of a wedge-shaped bedload [12]. Sediment deposition, re-entrainment, and movement occurred at the same time during this process [11]. Other studies have noted that microtopography, litter, etc., on the VFS bed surface can accumulate some deposited sediment. However, when the sediment was deposited to a certain depth in the area and the microtopography was filled with sediment cover, a large amount of sediment suddenly and rapidly flowed out at the outlet [13,14].
The sediment-trapping process on vegetated hillslopes may be comprehensively affected by many factors, such as slope gradient, flow rate, sediment concentration, sediment particle composition, vegetation type, and plant density [15,16]. At present, there is still no consensus on the effects of flow rate and sediment concentration on the sediment-trapping capacity of hillslope vegetation. For example, some experimental results have shown that flow rate and sediment concentration have little effect on the sediment trapping of vegetation [17]. Zhao et al. used PVC pipes to simulate vegetation, and the results showed that a greater sediment concentration would lead to a greater total sediment deposition amount but had no significant impact on sediment-trapping efficiency [18]. Although a lower flow rate caused a greater STE, it had little effect on total sediment deposition. However, the results of the sediment-trapping tests using real grass strips showed that the two designed unit flow rates (20 and 60 L min−1 m−1) do not lead to significant differences in sediment deposition amount and a higher sediment concentration corresponds to a greater sediment deposition amount and lower sediment-trapping efficiency [19]. There was a power function relationship between the flow rate and sediment transport capacity [20]. The study results of Pan et al. indicated that the flow rate is positively proportional to the total amount of trapped sediment [21].
The movement laws of different sediment particles on hillslopes are significantly different due to the difference in particle size and gravity, resistance, and settling speed [11]. Farenhorst and Bryan used a small flume on a 0.035 m m−1 slope to study the particle selectivity of sediment transport in shallow flow [22]. The results showed that the maximum flow rate (0.816 L s−1 m−1) has enough energy to transport all sediment particles but the particles in the range of 355–595 μm are preferentially transported. The lower flow rates (0.399, 0.292, and 0.139 L s−1 m−1) can also transport particles of all sizes but always give priority to transportation of the sediment particles in the size range of 45–125 μm. Jin and Römkens used simulated grass strips in a flume to conduct sediment-trapping tests and found that the deposited sediment particle sizes were mostly greater than 150 μm [17]. With the increase in slope gradient, the sediment deposition area moved to the downhill section of grass strips and the particle sizes of deposited sediment were also coarser.
Generally, coarse particles are more prone to deposition, while small particles are more easily transported by overland flow. However, some experimental results indicated that this is not absolute. Ma et al. conducted experiments on simulated grass strips with three slopes (3°, 9°, and 15°), two flow rates (20 and 60 L min−1 m−1), and sediment concentrations in the range of 100–300 g L−1. The results indicate that the proportion of coarse particles > 25 μm was greater, while the deposition efficiency of particles < 1 μm and 10–25 μm was greater than that of particles of 1–10 μm [19]. This study explained some particle selectivity characteristics of silt-laden overland flow passing through VFSs but did not further explore the differences in the process caused by different flow rates.
When calculating sediment trapping by VFSs, it is necessary to consider the differences in sediment particle size composition. Hayes et al. divided the sediment particle sizes into nine ranges when building a vegetation sediment-trapping model, and the first two ranges were fine particles smaller than 4 μm and 4–37 μm medium-sized particles [23]. Hairsine et al. divided sediment particles into 10 categories according to their sizes and assumed that the deposition rate of each category of particles is proportional to their settling velocity [11]. The “Aberdeen formula” calculates the number of deposited particles using the settling speed of particles and the length of the vegetation zone, which could determine the sediment-trapping efficiency of vegetation [24]. In the experimental study of Ma et al., the median particle size d50 was employed to express the sediment-trapping efficiency [19]. In some formulae for calculating the sediment-trapping capacity of overland flow proposed by Zhang et al., d50 was used to quantify the overall particle size of sediment [25]. To accurately quantify the process of sediment transported by the overland flow on vegetation hillslopes, it is necessary to pay attention to the movement of different-sized particles, as well as the effects of flow rate and sediment concentration slope on the movement law of sediment particles with different sizes.
This study involved a series of sediment-trapping tests under different inflow rate conditions on a vegetation hillslope and mainly measured the overland flow, sediment delivery amount, and sediment particle distribution. It focused on the movement law of sediment particles with different sizes in the sediment-trapping process. The main purpose of this study was to explore the effect of flow rates on sediment trapping by VFSs, which has not been clearly explained in previous studies. The novelty of this study is mainly the measurement of the changes in sediment particle size composition during sediment trapping by VFSs and its relationship with sediment transport rate under different flow rates.

2. Materials and Methods

2.1. Experimental Apparatus and Treatments

The experiments were conducted at the Fangshan station of Beijing Normal University, Beijing, China. The size of the experimental flume (Instrument and Equipment Factory of Institute of Soil and Water Conservation, Chinese Academy of Sciences, Shaanxi, China) was 10 × 1 × 0.5 m (Figure 1), and it was filled with soil, planted with green bristle grass (Setaria viridis (L.) Beauv.), and equipped with sediment and water supply devices.
The density of the grass was 4520 ± 700 stems m−2, its height was in the range of 30–90 cm, and its coverage rate was >90%. Spring and winter have less rainfall and usually do not produce overland flow, making them inactive seasons for soil erosion. Therefore, this study has good representativeness of the Loess Plateau region in China. To eliminate differences in soil moisture among experiments, the grassland was sprinkled evenly before each experiment until overland flow occurred. To avoid interference from sediment deposited in previous experiments, the sediment deposited on the bed surface of the grassland in each experiment was flushed away using slow-flowing clean water.
The Loess Plateau is located in the northern central part of China, with a warm temperate continental monsoon climate. The precipitation characteristics of summer and autumn are rainy, while winter and spring are dry, with an annual precipitation of 150–750 mm. During the year, precipitation is mostly concentrated from July to September, accounting for 60–80% of the annual precipitation, while winter precipitation generally only accounts for approximately 5% [26]. The terrain in the loess hilly and gully areas is fragmented, with a high density of gullies and valleys. The proportion of sloping farmland is high, and the erosion of hillslope overland flow is active, resulting in a high risk of soil erosion. The experimental soil was obtained in Jixian County, Shanxi Province, China. It is representative of the hill and gully region of the Loess Plateau. The soil of this area is vulnerable to erosion, as it is loose and the particles are fine. A 0.5 cm sieve was used to remove impurities, such as roots, litter, and stones, from the experimental soil. A blower ensured that the sediment was mixed uniformly into the water. The particle size distribution of the experimental soil is shown in Table 1.
Based on the short-duration high-intensity rainstorms occurring on the Loess Plateau, partial cross-experimental designs of four representative upslope inflow rates (i.e., 7.5, 15, 30, and 45 L min−1 m−1) with two different sediment concentrations (i.e., 40 and 120 g L−1) were applied [27]. The experimental conditions were nonsubmerged overland flow. In the “Grain for Green Project” of China, 15° is adopted as one of the main limiting criteria for determining the suitability of a hillslope area for inclusion in the program [4]. Therefore, a 15° slope was chosen for the experiments in this study. For further details of the experimental design, see Table 2.

2.2. Data Measurement and Analysis

The durations of experiments were different, so an appropriate sampling time interval was chosen for each experiment (generally 1, 2, 4, or 8 min). The collected outlet runoff samples were weighed and precipitated, and then the upper clear liquid was separated. The remaining sediment samples were baked in an oven at 105 °C for 24 h and finally weighed again [27]. Particle size samples were collected at the outlet over time and measured by an MS2000 Laser Size Classifier, Malvern, UK [28].
The overland flow surface velocity was measured using a dye tracer (KMnO4, Henan Huakai Biotechnology Co., Ltd., Henan, China) method [29]. When using the dye tracer (KMnO4) method to measure the flow velocity on vegetation hillslopes, the leaves are pushed aside at the measurement location to prevent obstruction of the view. The experimental vegetation in this study was rigid and the leaves did not directly contact the overland flow, which did not affect the flow velocity. Five sections were selected along the grassland. Each section and its interval were both 1 m long. The mean overland flow velocity (V) was calculated by
V = μ V s ,
where μ and Vs represent the correction coefficient and the measured surface velocity of overland flow, respectively. The grass strip used in this study had a rough bed surface, so μ = 0.75 for transitional or turbulent flow [30]. The Froude number (Fr) and Reynolds number (Re) are often used to describe surface roughness characteristics and express the resistances to overland flow offered by bed surfaces and vegetation, and they were calculated using the following equations [31]:
F r = V g h ,
R e = V R ν m ,
where R (m) is the hydraulic radius, g (m s−2) is gravity acceleration, and h (m) and νm (m2 s−1) represent the mean depth and kinematic viscosity coefficient of overland flow, respectively. The overland flow is considered laminar when Re < 500 and turbulent flow when Re > 500. h was calculated as
h = Q V B ,
where Q (m3 s−1) is the flow rate and B (m) is the width of the water-crossing section.

3. Results and Discussion

3.1. Overland Flow Pattern under Different Inflow Rates

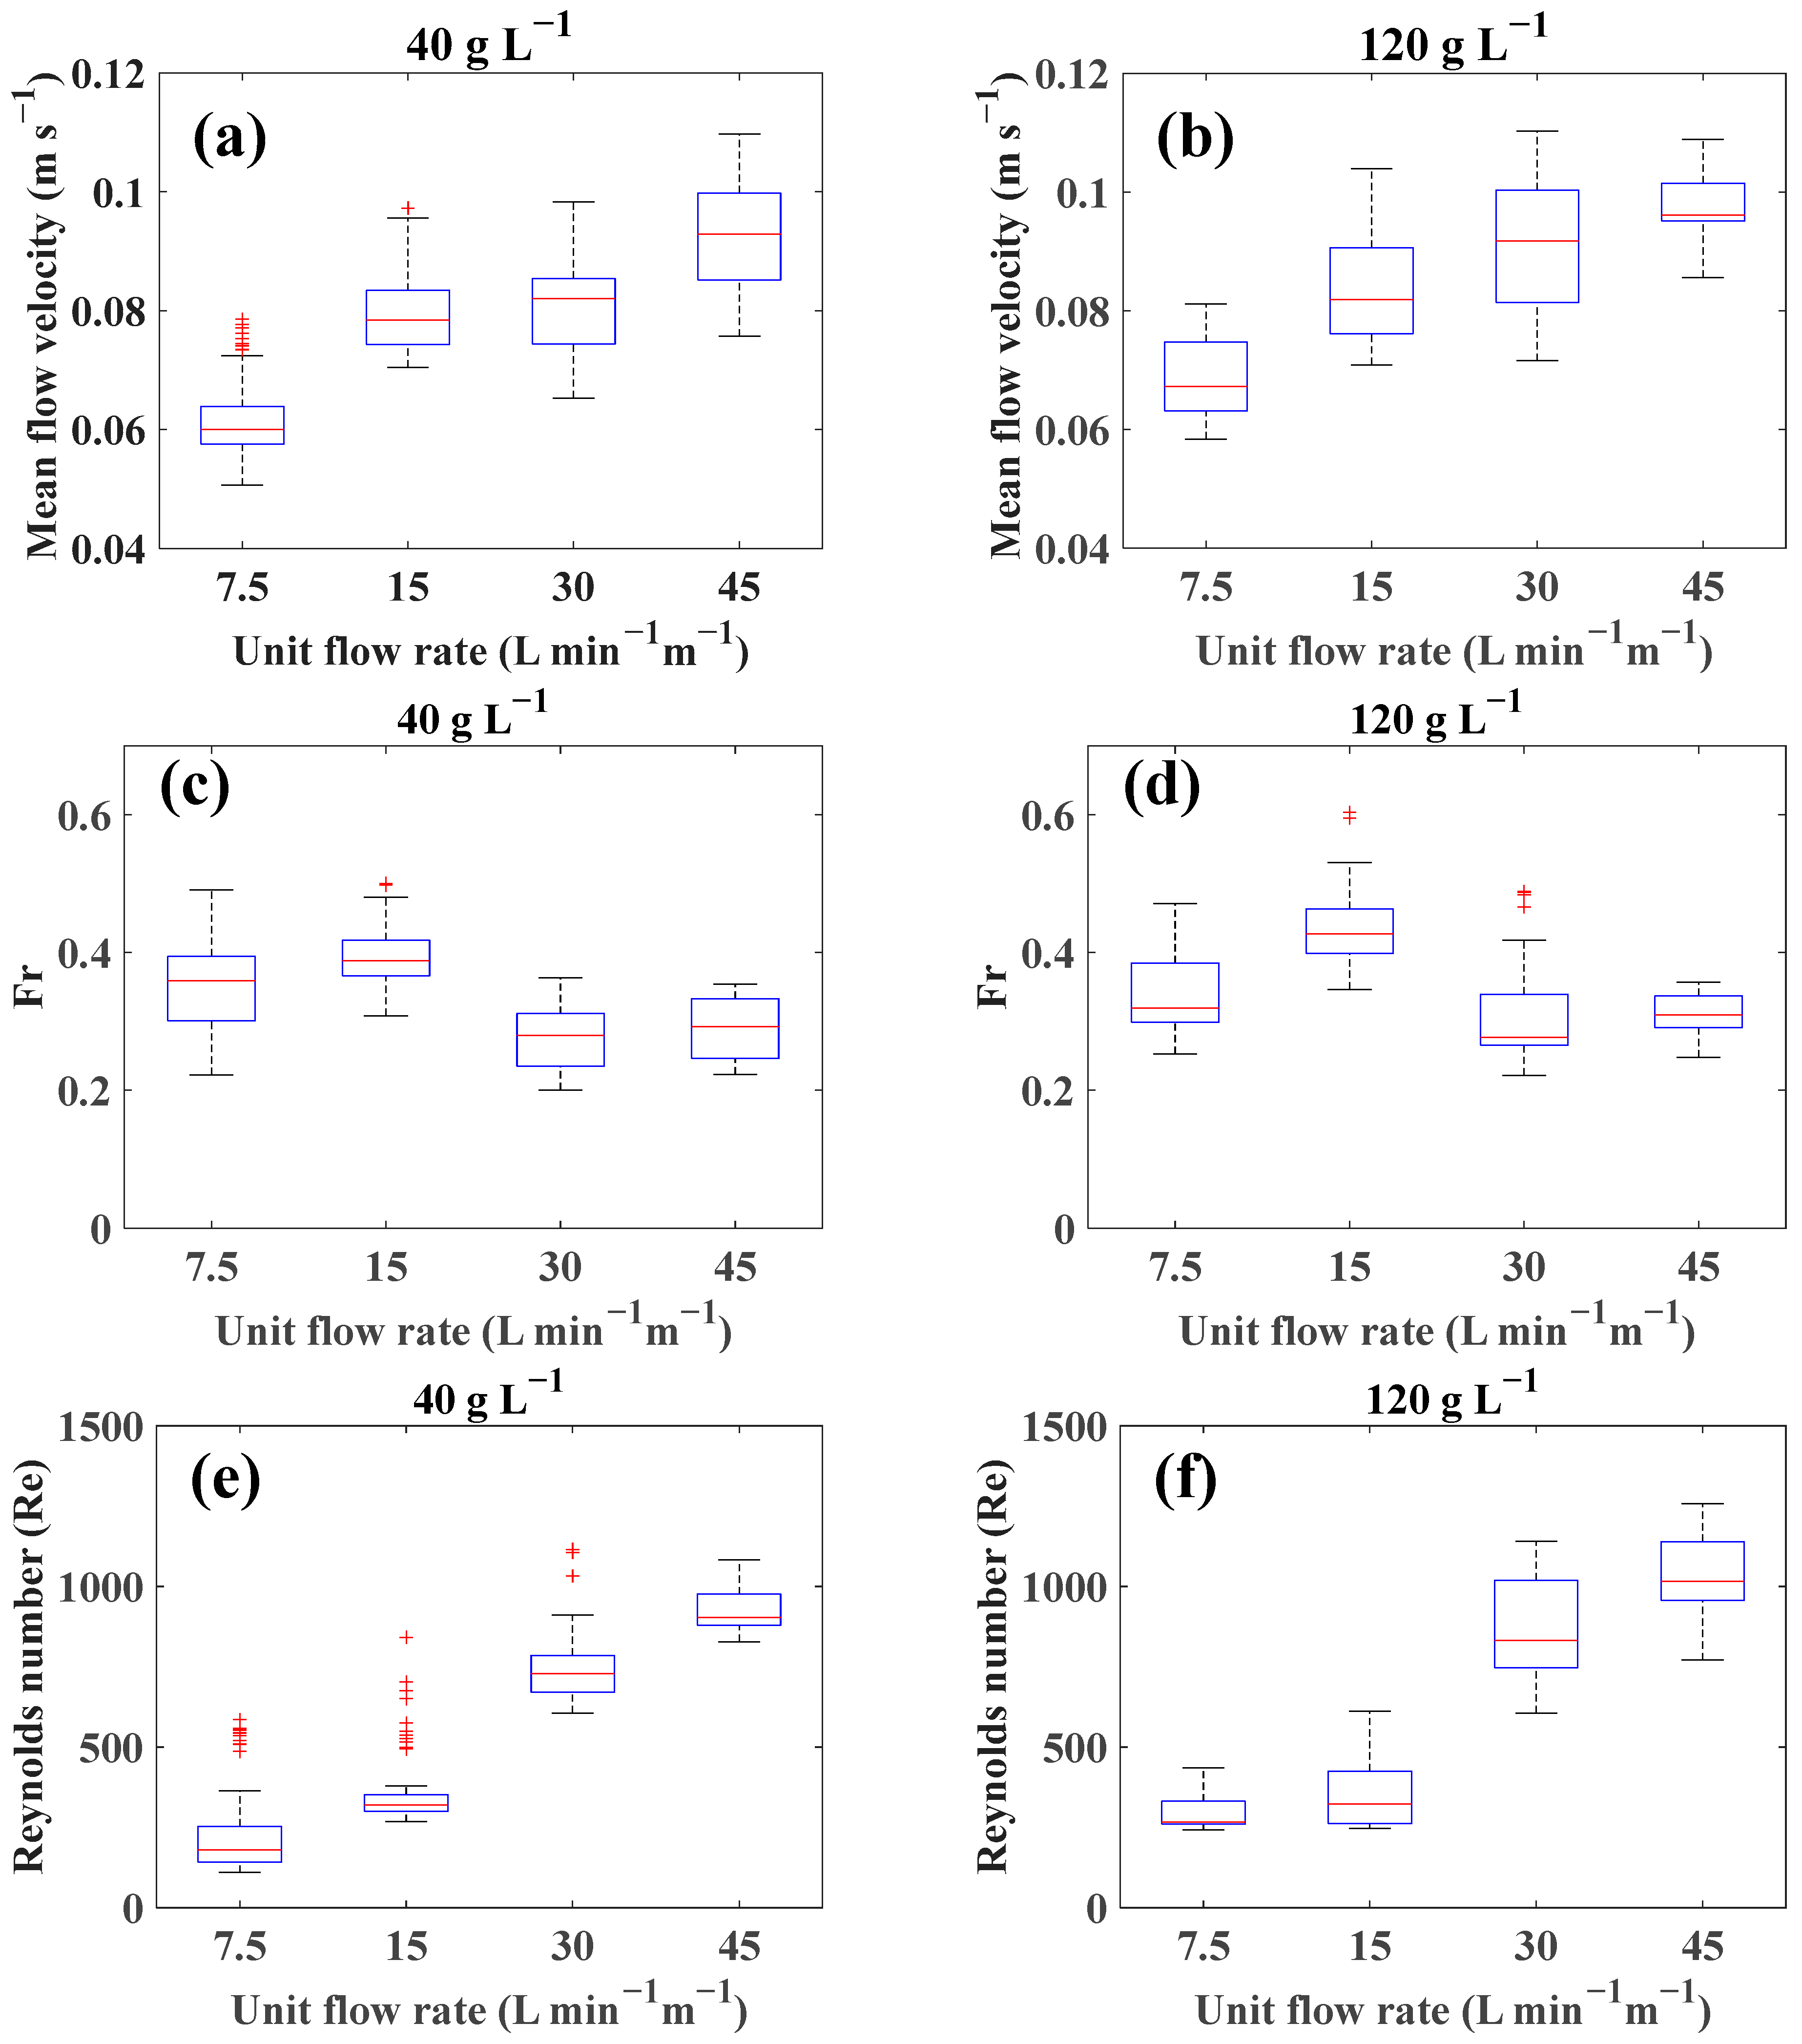
The overland flow was monitored at multiple measurement sections during different periods for each experiment. The flow velocity (V), Froude number (Fr), and Reynolds number (Re) of the overland flow were calculated by Equations (1)–(4). Their ranges are listed in Table 3, and quartile distribution box plots are shown in Figure 2.
In Figure 2a,b, these values range widely. The overland flow velocities increased as the inflow rate increased from 7.5 to 45 L min−1 m−1. The median values of overland flow velocity were 0.060, 0.078, 0.082, and 0.093 m s−1 for the 40 g L−1 experimental group and 0.067, 0.082, 0.092, and 0.096 m s−1 for the 120 g L−1 group. The relationship between the discharge and velocity of overland flow is commonly written as
V s = γ S m q n
where Vs is the surface velocity of overland flow (m s−1), S is the slope gradient of the hillslope (−), q is the inflow rate (L min−1 m−1), and γ, m, and n are the corresponding coefficient values [29]. In this study, a 15° hillslope was used in all experiments, and the slope gradient was constant, so the relationship between q and Vs could be simplified as follows:
V s = φ q n ,
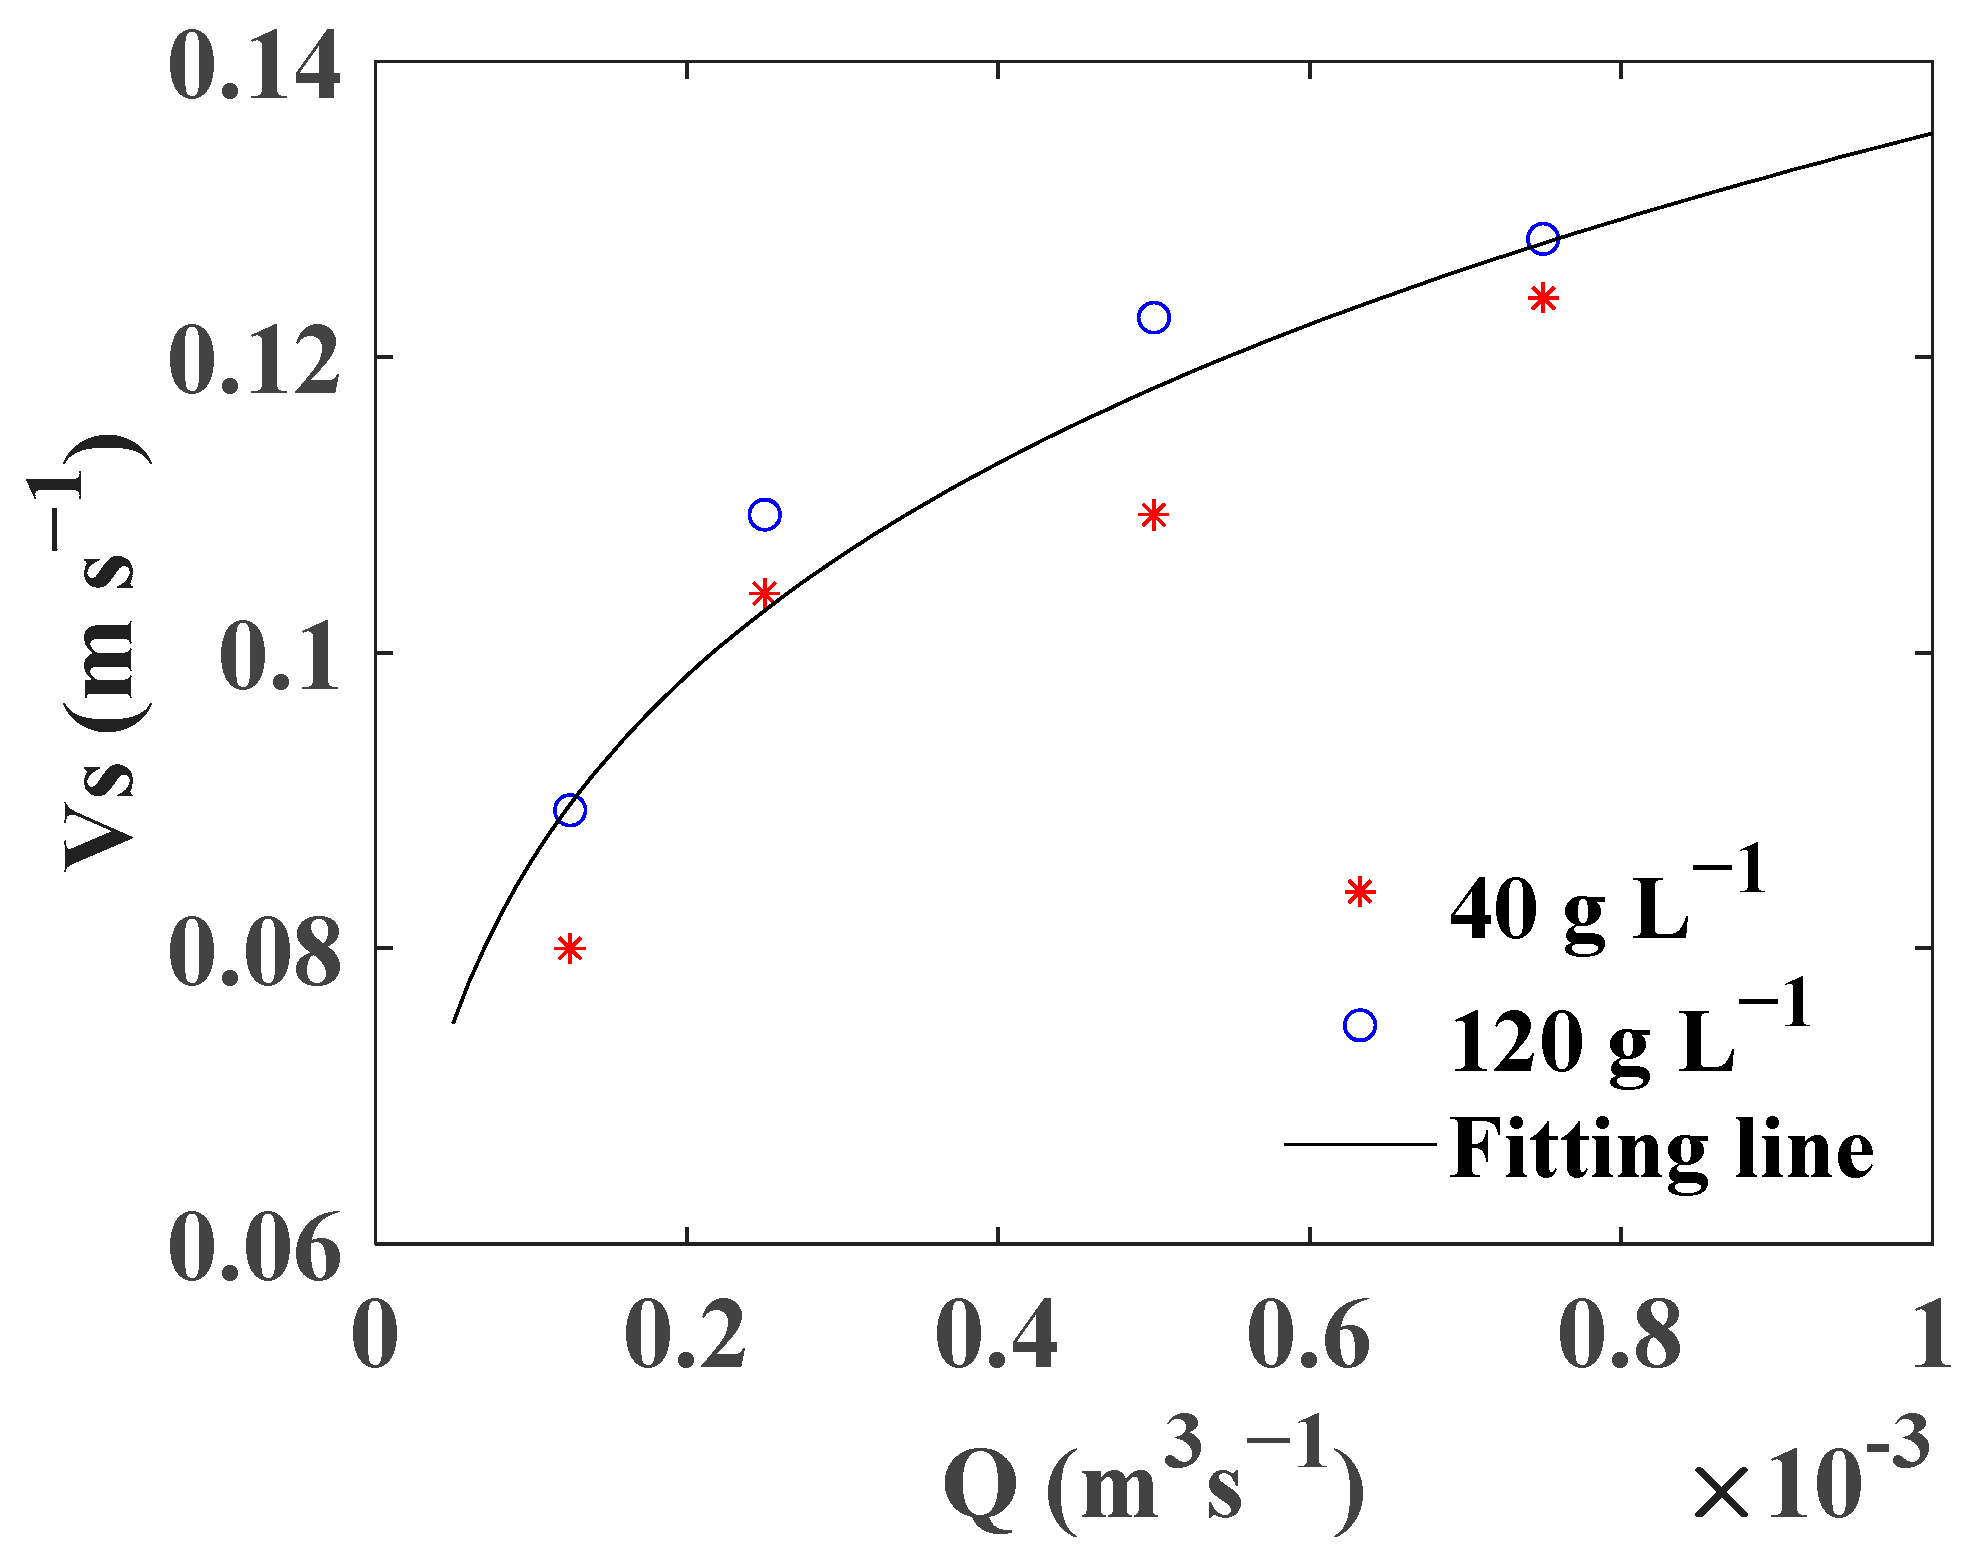
where φ is a new coefficient. The median values of the surface velocity and flow rates of all tests were fitted by Equation (6), and the result was:
V s = 0.523 q 0.197 ,   R 2 = 0.89 ***   N = 8 ,
where N represents the number of points and the number of tests, n = 0.197. The goodness of fit R2 is 0.89, which shows a good fitting effect. As shown in Figure 3, the two sets of points were evenly distributed on both sides of the curve, which indicated that the difference in sediment concentration of inflow does not significantly affect their relationship, as shown in Equation (7). The unit of flow rate (q) can affect the coefficient φ value but does not affect the value of n. The value of n was only decided by the power function relationship between q and Vs. Pan et al. conducted experiments on grass strips with 8.7–50% slope, 0.1–0.9 cm2 s−1 inflow rate, and 70% vegetation cover rate [29]. The results showed that n = 0.687, which was ˃0.197, the n value in this study. This may be because the vegetation cover rate (70%) was smaller than that in this study (˃90%). Vegetation had a smaller effect on overland flow, and the direct effect of flow rate on velocity was greater than that in this study. In addition, the hydrodynamic change caused by the flow rate will further affect sediment transport and deposition on vegetated hillslopes.
Fr was calculated by Equation (2), and the range of all tests was 0.20–0.60 (Table 3). There was no obvious regular difference in the Fr ranges for different flow rates (Figure 2c,d). However, all Fr values were <1, indicating that the overland flow was tranquil flow. Mu et al. conducted experiments under the conditions of flow rates of 0.5–2 L s−1, slope gradients of 8.8–25.9%, and stem covers of 0–30%. The results showed that the Fr ranged from 0.07 to 3.98 and the overland flows were supercritical (torrent flow) when the stem cover was between 0 and 2.5% and subcritical (tranquil flow) when the stem cover was greater than 2.5% [32]. Luo et al. conducted experiments under the conditions of a 5° slope, 30 L min−1 m−1 unit flow rate, and 120 g L−1 sediment concentration to study the effects of different aboveground structural parts of grass strips on the sediment-trapping process [33]. The Fr range was 0.09–0.49 under the completed grass strip treatment tests, which was also tranquil flow. Fr ˃ 1 only occurred with both green grass and litter removed in the treatment tests. These results were consistent with those of this study. Zhao et al. used coarse PVC tubes to simulate vegetation stems and conducted tests with four levels of vegetation cover (0%, 4%, 11%, and 17%), two flow rates (15 and 30 L min−1), and one slope gradient of 9% [18]. The Fr values were ˂1 when the flow rate was 15 L min−1, while Fr values were ˃1 when 30 L min−1. The torrent flow might be caused by the diameter of the simulated stems used in the tests of 2.0, 3.2, and 4.0 cm, which were much thicker than that of natural hillslope grass. The diameter of natural grass stems is generally at the millimeter level. Moreover, the bottom layer was a smooth iron sheet. Therefore, the resistances to overland flow were small. These results indicated that the overland flow on vegetation hillslopes is generally tranquil flow, which is very important for the study of erosion and deposition processes.
As shown in Table 3, in the two sets of experiments, the overland flows were turbulent flows (Re ˃ 500) when the flow rates were 30 and 45 L min−1 m−1. Figure 2e,f show that Re ˂ 500 (laminar flow) when the flow rates were 7.5 and 15 L min−1 m−1, except for some outliers. Fu et al. investigated the soil erosion properties of bare hillslopes and economic forests [34]. The shallow flow was pseudo laminar flow under 0.5, 1.2, and 1.8 mm min−1 rainfall, and the runoff upslope was tranquil flow and then changed to torrential flow downslope with increasing hillslope length.
There is currently no widely accepted parameter for qualitative analysis of the pattern of shallow flow on hillslopes. Re is still used in relevant studies. Even slight disturbances caused by raindrops can result in almost no laminar flow on the hillslope [35]. Therefore, the disturbance of vegetation cannot maintain laminar flow on the hillslope. Although many Re values of shallow flows on hillslopes were ˂500, these shallow flows disturbed by rainfall were not real laminar flows [35] and this study refers to them as pseudo laminar flows. Some data from measuring points showed that the overland flow was laminar flow (Re ˂ 500). In fact, it was difficult to form laminar flow due to the disturbance of such dense vegetation. During the experiments, when the flow velocity was measured using the dye tracer (KMnO4) method, the dye droplets significantly diffused while migrating downhill. The overland flow should be pseudo laminar flow. Therefore, only using Re to judge the flow pattern of shallow overland flow on vegetation hillslopes has great limitations.

3.2. Relationship between Representative Particle Sizes and Sediment Delivery Rate

According to the collection, baking, and weighing of the outlet runoff samples, the sediment delivery rates at the outlet are illustrated in Figure 4. The results indicated that the sediment delivery rate increased, while the inflow rate and sediment concentration were stable. That is, the sediment amount passing through the vegetation hillslope gradually increased and then basically remained stable during this process. Sediment deposition mainly occurred in the early stage of the sediment-trapping process. However, this can only show the sediment delivery rate at the outlet. To elucidate the mechanism of the sediment transport process on vegetated hillslopes, we should pay more attention to the particle size composition.
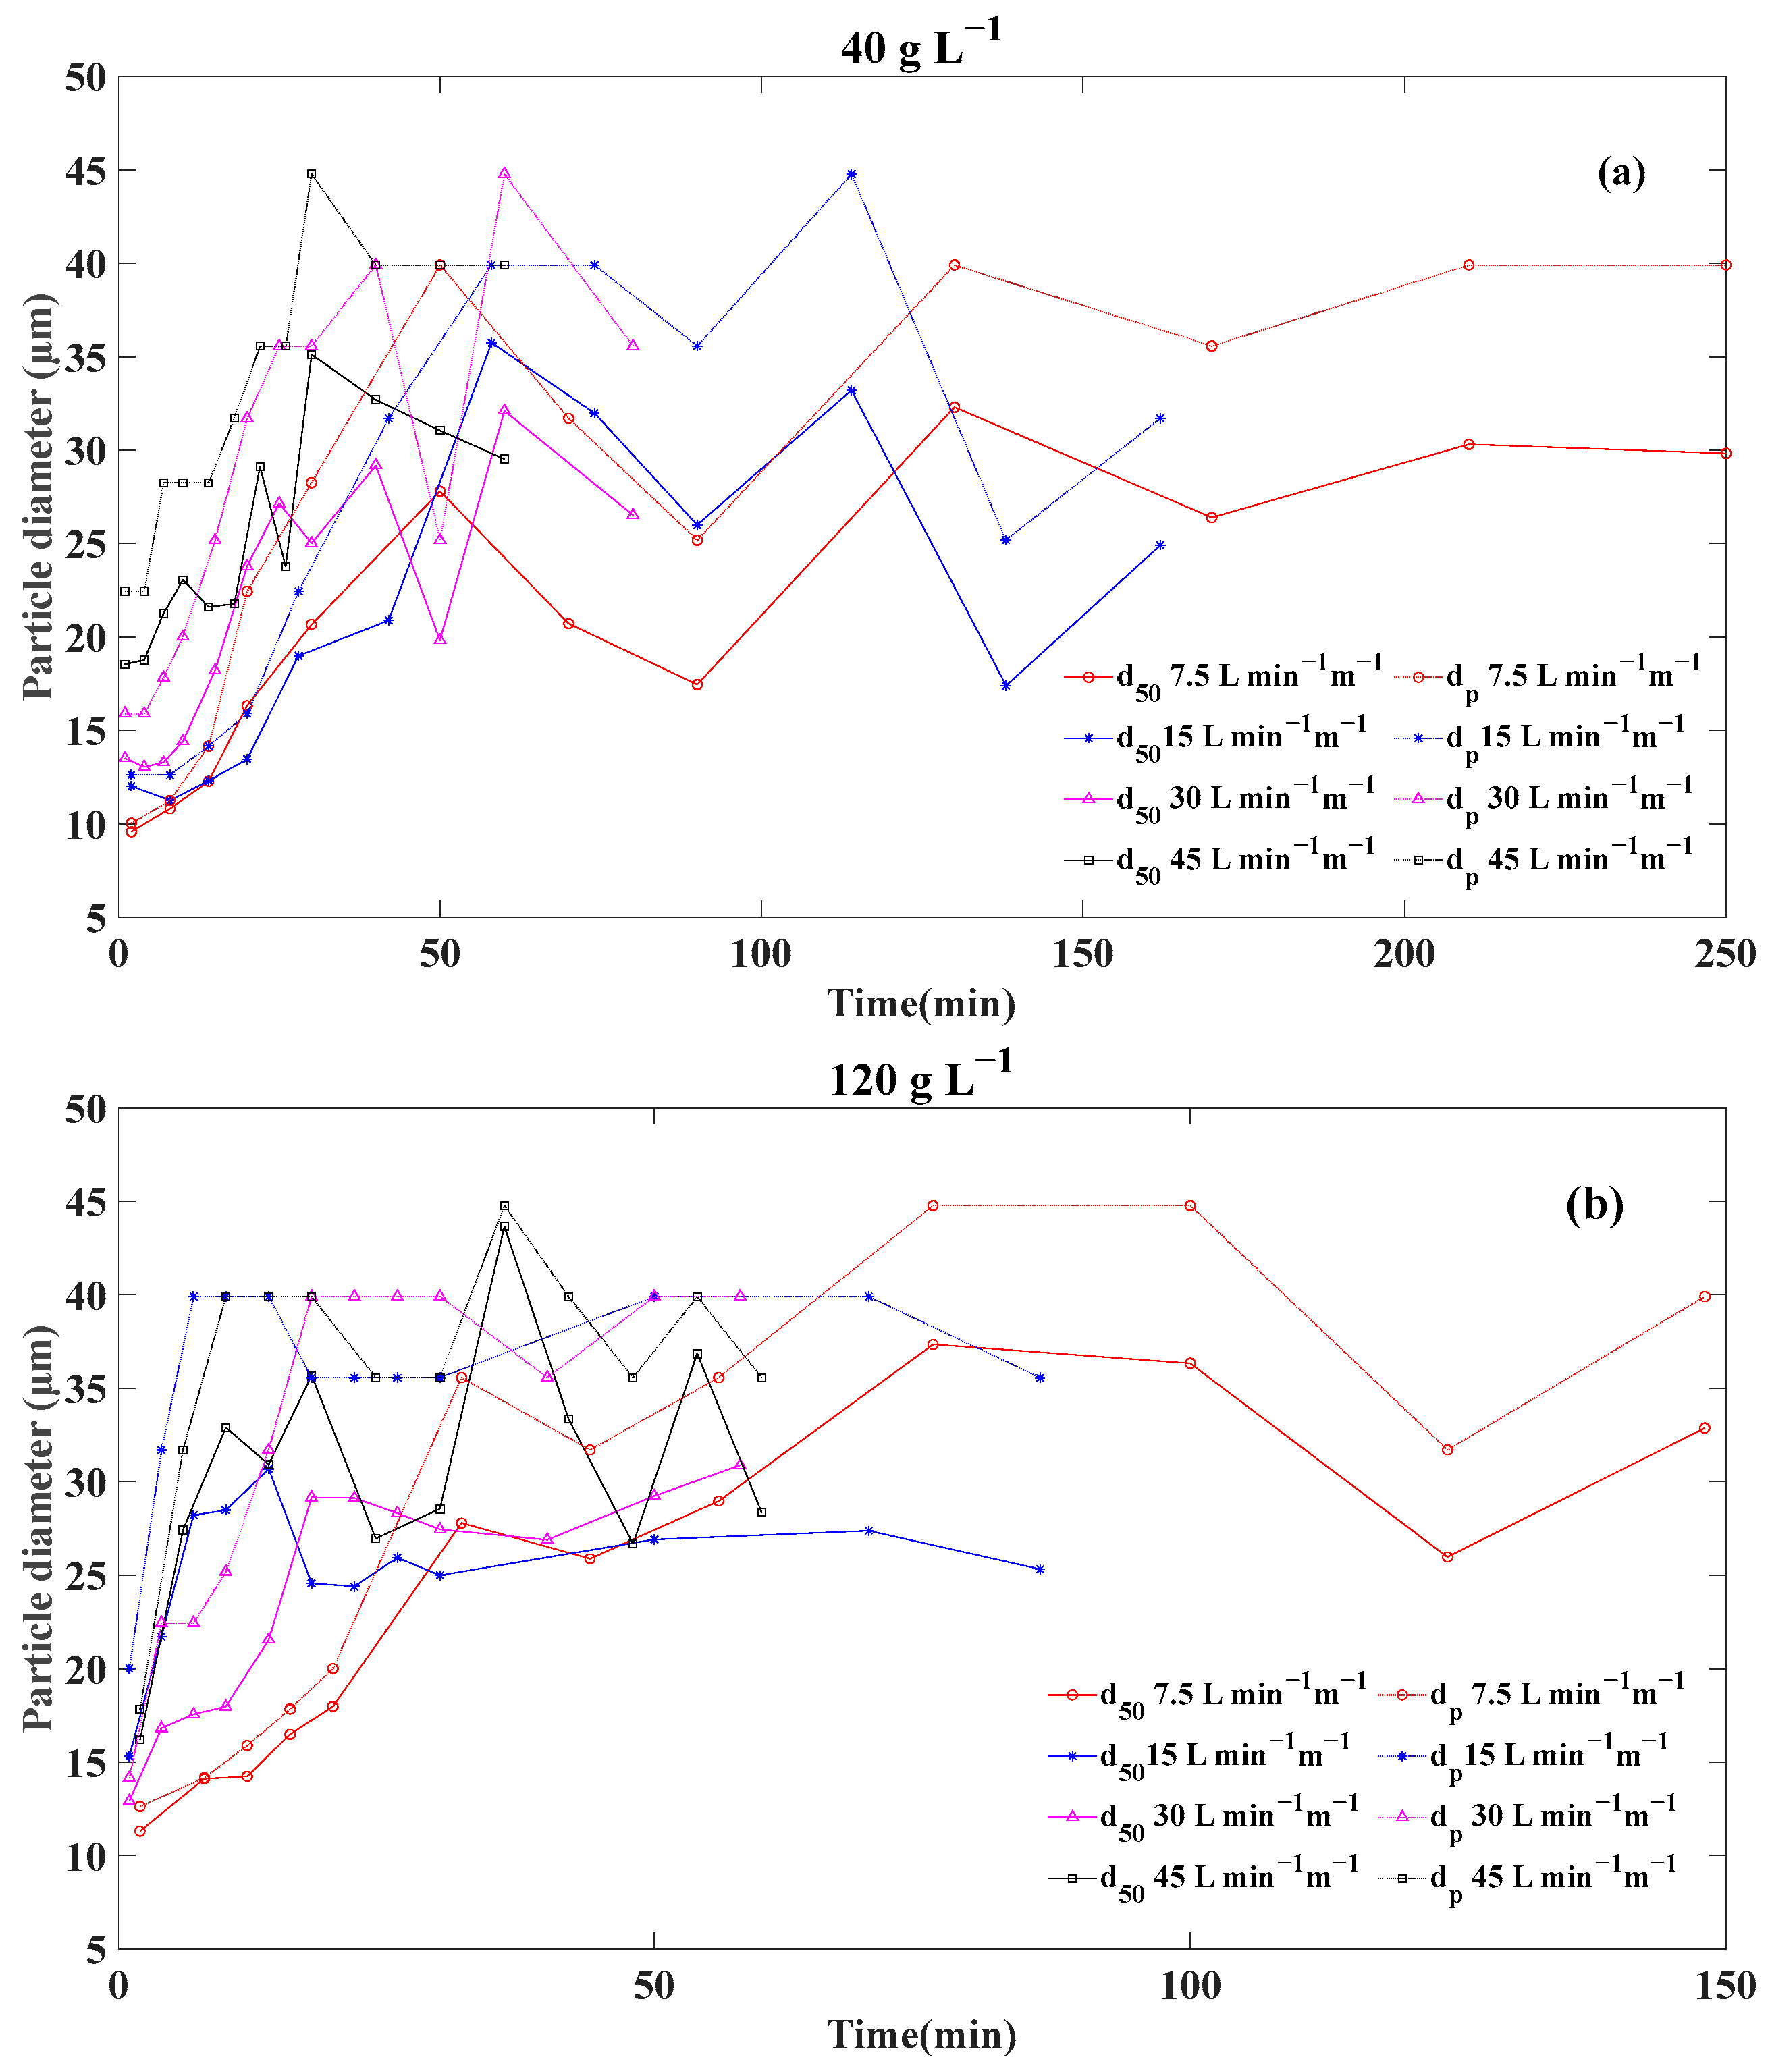
The median particle diameter d50 is often used to quantify the overall particle size level of sediment. In addition, the peak particle diameter dp, which accounts for the highest proportion of sediment, can also be used to describe the major characteristics of sediment particle size composition. The d50 and dp of outlet sediment samples during the experimental process are plotted as solid lines and dotted lines in Figure 5, respectively. In the two sets of tests, sediment concentrations were 40 and 120 g L−1, which showed that the d50 and dp of outflow sediment both gradually increased at the beginning and then stayed at a stable level. This result indicated that an increasing number of coarse particles can be exported from the hillslope vegetation area during this process. Initially, the greater the inflow rate was, the larger the d50 and dp of the outflow sediment. However, there was almost no difference among tests with different flow rates in the stable stage. That is, the change in the inflow rate had no significant effect on the sediment particle size of the outflow at the stable stage. There were the same significant differences between d50 and dp. The dp values were commonly greater than the corresponding d50 in the same test, but they were not strictly proportional. Therefore, there are generally some differences in describing the sediment transport process on vegetation hillslopes using d50 and dp.
When the sediment-laden overland flow passes through the VFS and sediment deposition occurs, the sediment delivery rate at the outlet is the maximum sediment amount that can be transported by overland flow [36]. The inflow sediment was composed of particles of various sizes. As the overland flow can carry more sediment out of the VFS, the particle size composition of sediment in the outflow changes accordingly. This is the particle-sorting process of overland sediment-laden flow on vegetation hillslopes. Therefore, there should be a strong positive correlation between the sediment delivery rate at the outlet and sediment particle size composition. According to the sediment-laden outflow samples and particle size samples collected during each test, a power function and linear function were used to fit the relationship between the representative particle sizes (d50 and dp) and sediment delivery rate (T) at the outlet. The results are listed in Table 4. It was feasible to use d50 or dp, and a power or linear function, to express the relationship, as the goodness of fit values R2 were generally good. However, there were still some differences in the overall effectiveness among these formulas in Table 4.
The d50 and power function were used for the eight tests; among these R2 values, one was ˃0.8, three ranged from 0.7 to 0.8, and two ranged from 0.6 to 0.7. The two remaining R2 values were 0.34 for S15Q15SC120 and 0.38 for S15Q45SC120. When d50 and the linear function were chosen, the maximum R2 value was 0.91, one was in the range of 0.8–0.9, and two were in the range of 0.7–0.8. The R2 value of S15Q15SC40 decreased slightly from 0.61 to 0.59, that of S15Q45SC120 was not changed, still 0.38, and those of the other six tests were improved to different degrees. Therefore, it was better to describe the relationship between d50 and the sediment delivery rate at the outlet with a linear function.
Power and linear functions were also used to fit the relationship between the peak particle diameters dp and the sediment delivery rates of outflow. For the power function, except for S15Q30SC40, which decreased slightly from 0.72 to 0.71, the other R2 values of dp were greater than those of d50. For example, the R2 values of S15Q15SC40 and S15Q45SC40 were improved from 0.61 and 0.73 to 0.73 and 0.86, respectively. In particular, that of S15Q45SC120 significantly increased from 0.38 to 0.58. When dp was used, the fitting effects of linear and power functions were compared. The results showed that except for the R2 value of S15Q15SC40, which decreased slightly from 0.73 to 0.71, the R2 values of the other tests were increased. In particular, S15Q15SC120 and S15Q45SC120 increased significantly from 0.39 and 0.58 to 0.44 and 0.63, respectively.
The particle size composition of the sediment has approximately a nonstandard normal distribution. The horizontal axis here represents the median particle size d50 and the peak particle size dp in units of μm. Even if there is very little sediment at the outlet, when detected, d50 and dp are still values greater than 0. Therefore, the intercept of the vertical axis should theoretically be negative. Most of the results are consistent with this situation, with only S15Q15SC40 showing a positive ordinate intercept, 1.94 for d50 and 1.66 for dp. This may be due to the high initial sampling particle size and measurement results.
Both linear and power function models are empirical regression models based on experimental data, which were used to explore possible relationship expressions. The results showed that the power function model can better express this relationship, but the linear model has more stable performance. This can provide a helpful reference when building a water–sediment process model. Here, R2 is the goodness of fit rather than the correlation coefficient. The low values of R2 in some tests (S15Q15SC120 and S15Q45SC120) may be due to the large size of the experimental plot, which is 10 m in length. It is difficult to ensure that the optimal state can be achieved during each experimental process, which may result in some experimental data being biased. However, under the same data conditions, linear models exhibit better stability.
In summary, the relationship between sediment particle size and sediment delivery rate at the outlet was expressed by a linear function that was better than the power function, and the peak particle diameter was better than the median particle diameter from the overall fitting effects. Therefore, the median particle diameter can be replaced by the peak particle diameter for sediment transport capacity calculation on vegetation hillslopes in erosion and deposition models.

3.3. Particle Sorting of Sediment Transport by Overland Flow in VFSs

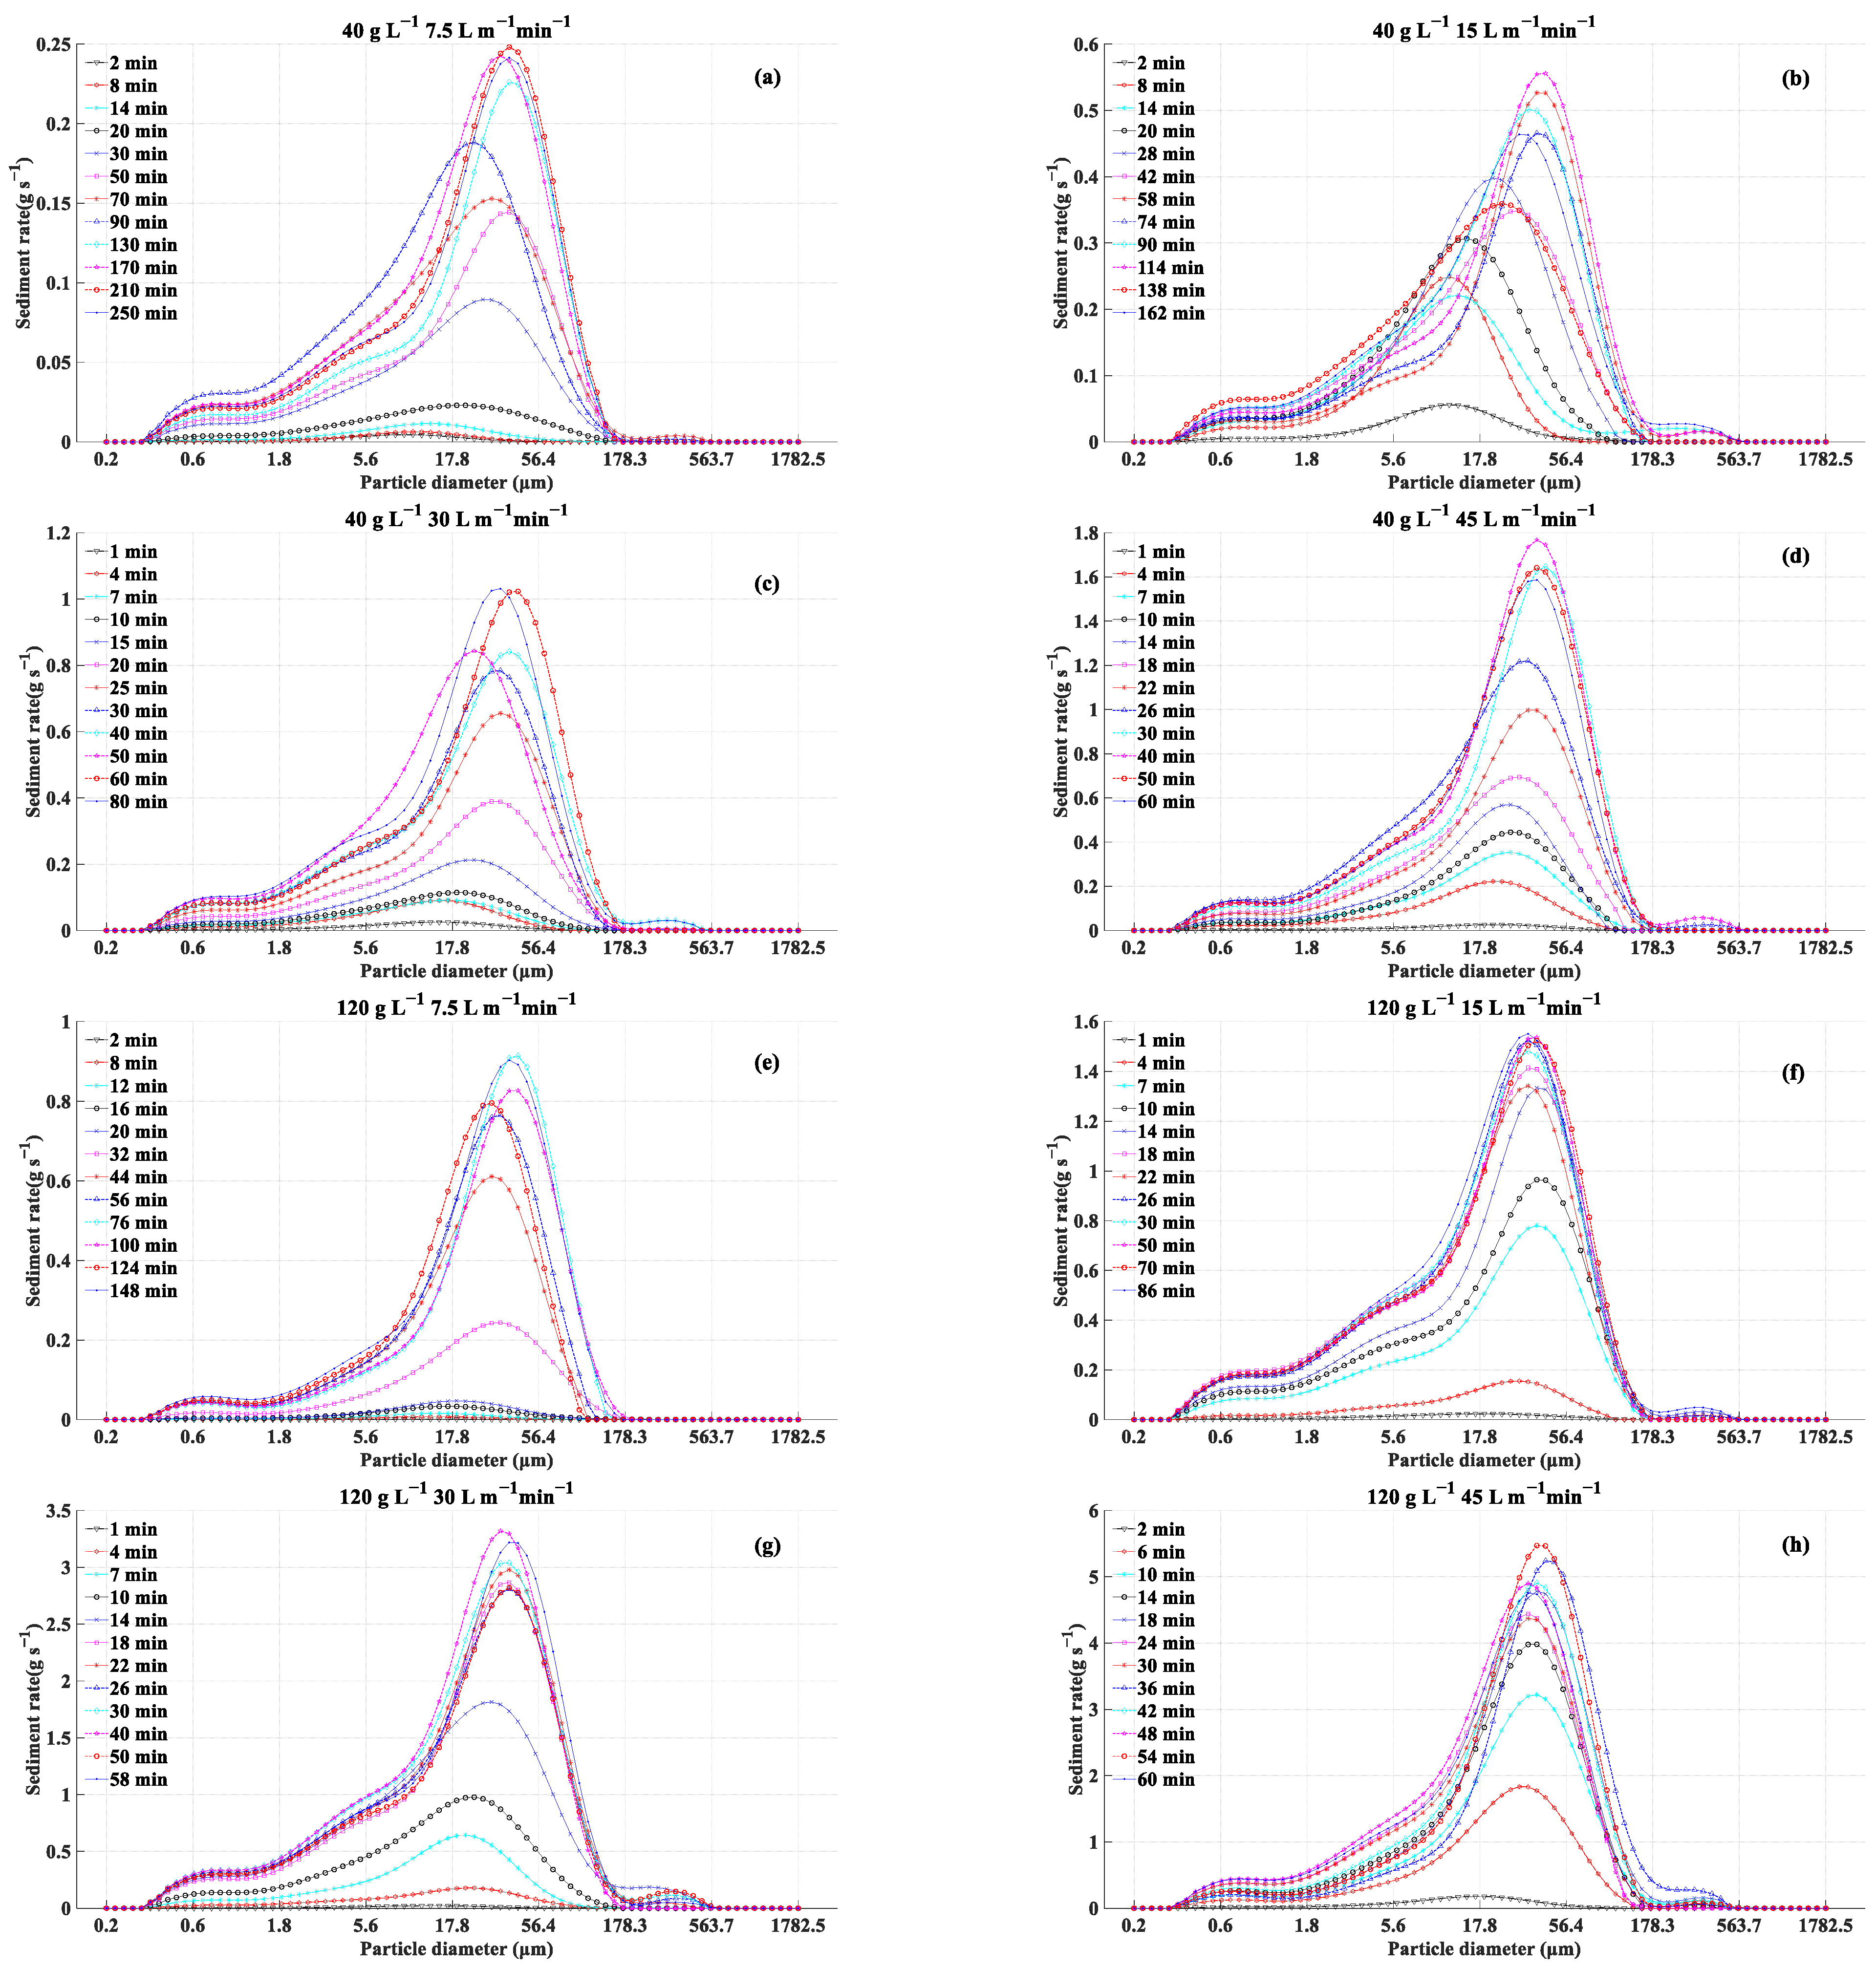
Using only these representative particle size values, such as median particle diameter d50 and/or peak particle diameter dp, generally cannot clearly describe the particle size distributions of outlet sediment during the sediment-trapping process by VFSs. The sediment delivery rates of each particle size at the outlet are plotted in Figure 6. They were obtained by multiplying particle size distribution percentages and instantaneous sediment delivery rates. The ordinate of each point in these curves represents the instantaneous sediment delivery rate of the corresponding particle size on the horizontal axis, and the unit is g S−1. The results showed that the first sample was mostly collected within 1 or 2 min of each test, and the sediment amount at the outlet was very small at the beginning. The main particle size ranged from 5.6 to 56.4 μm. In the two tests under 120 g L−1 sediment concentration with 7.5 (Figure 6e) and 30 L m−1 min−1 (Figure 6g) flow rates, the sediment amounts of the first sample were too small, so their particle size distributions were not obvious. The dp of the initial sediment sample at the outlet was 10.0–22.4 μm.
Comparing the sediment delivery rates of inflow and outflow, deposition occurred when sediment-laden overland flow passed through the VFS. The amounts of all size sediment particles at the outlet were increasing at the beginning. The peak particle size of the outflow sediment gradually increased, and the amounts of coarser particles ˃22.4 μm also increased and finally remained relatively stable. For example, in test S15Q7.5SC40 (Figure 6a), the sediment amount of all particle sizes at the outlet gradually increased before 90 min and the peak particle diameter at 90 min was 25.2 μm. During this process, the sediment-trapping capacity of the VFS gradually decreased and more sediment passed through the VFS. Then, the sediment amounts of particles > 25.2 μm increased. The peak particle diameter reached 39.9 μm at 130 min, and then it fluctuated at approximately 39.9 μm. The variation processes of sediment particle size distribution from the outlet in other tests were roughly similar to the above. However, the increase speeds of peak particle size were different among tests, which was caused by the differences in inflow rate and sediment concentration. The processes shown by dotted lines in Figure 5 were roughly consistent with the finding that the greater the inflow rate was, the faster the amount and proportion of coarse particles increased.
From Figure 6a–h, the two sets of tests showed that as the flow rate increased, the sediment amount of each particle size increased faster and its peak particle size also moved to the right on the coordinate axis, that is, the direction of greater particle sizes. However, after the peak particle size of sediment at the outlet reached 39.9 μm, it fluctuated around it and did not significantly move to the right afterwards. Meanwhile, the sediment delivery rates at the outlet also increased, as shown in Figure 4. This result indicated that the amount of sediment output increased in the later stage, but there was no significant change in the overall particle size composition.
The movement of particles has a certain regularity during the sediment-trapping process by vegetation hillslopes. The inflow rate and sediment concentration were constants, so the change in sediment amount and particle size composition of the outflow was mainly caused by the variation in the underlying surface in the VFS. This kind of change is commonly caused by sediment deposition or erosion. This result indicated that the main factor was the sediment deposited in this study according to the sediment amount of inflow and outflow. There are many descriptions of the process of sediment trapping by VFSs. For example, the VFS was divided into four regions to simulate the sediment-trapping process in the University of Kentucky algorithm. This algorithm assumed that coarse particles (defined as diameter ˃ 37 μm) were deposited during the process of sediment-laden overland flow passing through the VFS. These coarse particles mainly migrate on the vegetation hillslope as in the bed load sediment, and they move downhill in the form of a “wedge zone” [12]. If this is true, the sediment delivery rate and particle size should both increase rapidly when the “wedge zone” reaches the outlet. In the processes of sediment delivery rate at the outlet in Figure 4, the growth speed in the early stage was relatively slow, and then a rapid increase stage occurred at a certain moment. This result was roughly consistent with the assumption that part of the sediment moves as a “wedge zone”. However, from the median particle size and peak particle size of outflow sediment samples illustrated in Figure 5, the processes gradually increased and then stabilized, rather than increasing instantaneously.
In addition, the process in Figure 6 shows that ˃37 μm particles flow out through the VFS in the whole process and cannot be ignored relative to the total amount. Therefore, the assumption in the University of Kentucky algorithm may have some shortcomings, which will lead to higher sediment-trapping efficiency calculated by this algorithm than in the actual situation. Grass with coverage of 20~90% and typical soil in the Loess Plateau of China on a 15° slope were used in the sediment-trapping tests of Pan et al. [37]. The results showed that the sediment-trapping efficiency of ˃50 μm particles ranged from 0.04 to 0.70 (average: 0.3365). These experimental results indicated that the sediment-trapping efficiency may be overestimated because ˃37 μm particles were classified as bed load sediment. In addition, many studies have also noted that the VFSMOD model, which is based on the University of Kentucky algorithm, has the risk of overestimating the sediment-trapping efficiency of VFSs, especially in poor vegetation conditions [38,39]. Some previous studies focused on the process variation of sediment-trapping efficiency by VFSs but have not revealed the laws of this process from the perspective of sediment particle size [17,37]. Overall, the variation process of sediment particle size composition at the outlet shows that in the early stage of sediment trapping by the VFS, all particle sizes exhibit high deposition rates (Figure 6). However, as the sediment-trapping process continues, the sediment particles of each size at the outlet gradually increase. From Figure 2, as the flow rate increases and the average flow velocity increases, the resistance f of the VFS to overland flow increases. The grass used in this study was a rigid plant, and its resistance to overland flow was mainly the result of the soil bed surface, litter, and stems. This is because the sediment cover weakened the resistance of the VFS to overland flow and enhanced the overland flow dynamics and more sediment particles were exported from the VFS. In the later stage, the output sediment volume remains stable (Figure 4), and the overall particle size level and composition of sediment also remain relatively stable (Figure 5 and Figure 6).
This study still has some limitations, mainly including the inability to distinguish the differences in sediment particle movement caused by rigid and flexible vegetation and the inability to identify the impact of the vegetation growth cycle on its processes. When modeling, the problem is finally simplified with different particle size thresholds, which cannot yet be provided in this study.

4. Conclusions

The main findings are summarized as follows.
(1)
During the process of sediment trapping by VFSs, the differences in sediment concentration of overland flow do not affect the parameters in the power relationship between the discharge and flow velocity.
(2)
The calculation results showed that some measurement points were still laminar flow when Re was used to indicate the flow pattern of the shallow overland flow on the vegetation hillslope. Under the influence of dense vegetation on the slope, it is difficult to form laminar flow when the slope flow is disturbed. Therefore, using Re alone may not be effective in determining the flow pattern on vegetation-covered hillslopes.
(3)
When describing the relationship between sediment particle size and sediment delivery rate on vegetation hillslopes, the peak particle size was better than the median particle size and the linear function was more stable than the power function. Therefore, they can be considered for the construction of relevant erosion models.
(4)
During the sediment-trapping process by VFSs, the sediment-trapping capacity of VFSs gradually decreases and the increase in sediment discharge is accompanied by a greater proportion of coarse sediment particles. Under the same flow rate conditions, when the sediment concentration was greater, the amount and proportion of coarse sediment particles at the outlet increased faster. Using only a certain particle size threshold to distinguish suspended and bed load sediment may lead to inaccurate estimation of sediment-trapping performance by VFSs. The assumption that the coverage of sediment deposition changes the original underlying surface, resulting in a decrease in sediment-trapping efficiency, should be considered simultaneously.
This study deepens the understanding of the mechanism of water and sediment processes on vegetation hillslopes, has important significance for erosion control on the Loess Plateau, helps to enhance the functionality of vegetation modules in soil and water models, and promotes the widespread and efficient application of VFSs management technology.

Author Contributions

Conceptualization, M.L.; methodology, M.L. and C.P.; software, M.L.; validation, M.L.; formal analysis, M.L.; investigation, M.L.; resources, C.P.; data curation, M.L.; writing—original draft preparation, M.L.; writing—review and editing, M.L. and C.P.; visualization, M.L. and L.W.; supervision, M.L.; project administration, C.P.; funding acquisition, M.L., C.P., J.P., and L.W. All authors have read and agreed to the published version of the manuscript.

Funding

This research was funded by Initial Scientific Research Fund Project of Chuzhou University (2022qd002), National Natural Science Foundation of China Project (42077059, 41771305), Natural Science Research Project of Anhui Educational Committee (2022AH040155), and Humanity and Social Science Research Project of Anhui Educational Committee (SK2021A0687).

Institutional Review Board Statement

Not applicable.

Informed Consent Statement

Not applicable.

Data Availability Statement

The data that support the findings of this study are available from the corresponding author upon reasonable request.

Acknowledgments

The authors wish to thank all of the technicians involved in field and laboratory work.

Conflicts of Interest

The authors declare no conflict of interest.

References

  1. Ahmad, N.S.B.N.; Mustafa, F.B.; Didams, G. A systematic review of soil erosion control practices on the agricultural land in Asia. Int. Soil Water Conserv. Res. 2020, 8, 103–115. [Google Scholar] [CrossRef]
  2. Meena, D.C.; Rao, C.A.R.; Dhyani, B.L.; Dogra, P.; Samuel, J.; Dupdal, R.; Dubey, S.K.; Mishra, P.K. Socio-Economic and Environment Benefits of Soil and Water Conservation Technologies in India: A Critical Review. Int. J. Curr. Microbiol. Appl. Sci. 2020, 9, 2867–2881. [Google Scholar] [CrossRef]
  3. Sharifi, A.; Hosseingholizadeh, M. The Effect of Rapid Population Growth on Urban Expansion and Destruction of Green Space in Tehran from 1972 to 2017. J. Indian Soc. Remote. Sens. 2019, 47, 1063–1071. [Google Scholar] [CrossRef]
  4. Deng, L.; Shangguan, Z.-P.; Li, R. Effects of the grain-for-green program on soil erosion in China. Int. J. Sediment Res. 2012, 27, 120–127. [Google Scholar] [CrossRef]
  5. Sun, W.; Shao, Q.; Liu, J.; Zhai, J. Assessing the effects of land use and topography on soil erosion on the Loess Plateau in China. Catena 2014, 121, 151–163. [Google Scholar] [CrossRef]
  6. Mekonnen, M.; Keesstra, S.D.; Stroosnijder, L.; Baartman, J.E.M.; Maroulis, J. Soil Conservation Through Sediment Trapping: A Review. Land Degrad. Dev. 2015, 26, 544–556. [Google Scholar] [CrossRef]
  7. Baptist, M.J.; Babovic, V.; Uthurburu, J.R.; Keijzer, M.; Uittenbogaard, R.; Mynett, A.; Verwey, A. On inducing equations for vegetation resistance. J. Hydraul. Res. 2007, 45, 435–450. [Google Scholar] [CrossRef]
  8. Gumiere, S.J.; Le Bissonnais, Y.; Raclot, D.; Cheviron, B. Vegetated filter effects on sedimentological connectivity of agricultural catchments in erosion modelling: A review. Earth Surf. Process. Landforms 2011, 36, 3–19. [Google Scholar] [CrossRef]
  9. Flanagan, D.C.; Nearing, M.A. Sediment particle sorting on hillslope profiles in the WEPP model. Trans. ASAE 2000, 43, 573–583. [Google Scholar] [CrossRef]
  10. Ghadiri, H.; Rose, C.W.; Hogarth, W.L. The influence of grass and porous barrier strips on runoff hydrology and sediment transport. Trans. ASAE 2001, 44, 259–268. [Google Scholar] [CrossRef]
  11. Hairsine, P.B.; Beuselinck, L.; Sander, G.C. Sediment transport through an area of net deposition. Water Resour. Res. 2002, 38, 22-1–22-7. [Google Scholar] [CrossRef]
  12. Muñoz-Carpena, R.; Parsons, J.E.; Gilliam, J. Modeling hydrology and sediment transport in vegetative filter strips. J. Hydrol. 1999, 214, 111–129. [Google Scholar] [CrossRef]
  13. Luo, M.; Pan, C.; Liu, C. Modeling study on the time-varying process of sediment trapping in vegetative filter strips. Sci. Total Environ. 2020, 725, 138361. [Google Scholar] [CrossRef]
  14. Luo, M.; Pan, C.; Cui, Y.; Wu, Y.; Liu, C. Sediment particle selectivity and its response to overland flow hydraulics within grass strips. Hydrol. Process. 2020, 34, 5528–5542. [Google Scholar] [CrossRef]
  15. Saleh, I.; Kavian, A.; Roushan, M.H.; Jafarian, Z. The efficiency of vegetative buffer strips in runoff quality and quantity control. Int. J. Environ. Sci. Technol. 2018, 15, 811–820. [Google Scholar] [CrossRef]
  16. Zhou, Z.-C.; Gan, Z.-T.; Shangguan, Z.-P. Sediment Trapping from Hyperconcentrated Flow as Affected by Grass Filter Strips. Pedosphere 2013, 23, 372–375. [Google Scholar] [CrossRef]
  17. Jin, C.; Römkens, M.J.M. Experimental studies of factors in determining sediment trapping in vegetative filter strips. Trans. ASAE 2001, 44, 277–288. [Google Scholar] [CrossRef]
  18. Zhao, C.-H.; Gao, J.-E.; Zhang, M.-J.; Wang, F.; Zhang, T. Sediment deposition and overland flow hydraulics in simulated vegetative filter strips under varying vegetation covers. Hydrol. Process. 2016, 30, 163–175. [Google Scholar] [CrossRef]
  19. Ma, L.; Pan, C.; Teng, Y.; Shangguan, Z. The performance of grass filter strips in controlling high-concentration suspended sediment from overland flow under rainfall/non-rainfall conditions. Earth Surf. Process. Landforms 2013, 38, 1523–1534. [Google Scholar] [CrossRef]
  20. Wang, S.; Flanagan, D.C.; Engel, B.A. Estimating sediment transport capacity for overland flow. J. Hydrol. 2019, 578, 123985. [Google Scholar] [CrossRef]
  21. Pan, C.; Ma, L.; Shangguan, Z.; Ding, A. Determining the sediment trapping capacity of grass filter strips. J. Hydrol. 2011, 405, 209–216. [Google Scholar] [CrossRef]
  22. Farenhorst, A.; Bryan, R. Particle size distribution of sediment transported by shallow flow. Catena 1995, 25, 47–62. [Google Scholar] [CrossRef]
  23. Hayes, J.C.; Barfield, B.J.; Barnhisel, R.I. Performance of Grass Filters Under Laboratory and Field Conditions. Trans. ASAE 1984, 27, 1321–1331. [Google Scholar] [CrossRef]
  24. Deletic, A. Sediment transport in urban runoff over grassed areas. J. Hydrol. 2005, 301, 108–122. [Google Scholar] [CrossRef]
  25. Zhang, G.-H.; Wang, L.-L.; Tang, K.-M.; Luo, R.-T.; Zhang, X.C. Effects of sediment size on transport capacity of overland flow on steep slopes. Hydrol. Sci. J. 2011, 56, 1289–1299. [Google Scholar] [CrossRef]
  26. Wang, W.; Li, Z.; Su, H.; Xiao, J.; Han, F.; Li, Z. Spatial and seasonal variability, control factors and health risk of fluoride in natural water in the Loess Plateau of China. J. Hazard. Mater. 2022, 434, 128897. [Google Scholar] [CrossRef] [PubMed]
  27. Wu, T.; Pan, C.; Li, C.; Luo, M.; Wang, X. A field investigation on ephemeral gully erosion processes under different upslope inflow and sediment conditions. J. Hydrol. 2019, 572, 517–527. [Google Scholar] [CrossRef]
  28. Martínez-Mena, M.; Castillo, V.; Albaladejo, J. Relations between interrill erosion processes and sediment particle size distribution in a semiarid Mediterranean area of SE of Spain. Geomorphology 2002, 45, 261–275. [Google Scholar] [CrossRef]
  29. Pan, C.; Ma, L.; Wainwright, J.; Shangguan, Z. Overland flow resistances on varying slope gradients and partitioning on grassed slopes under simulated rainfall. Water Resour. Res. 2016, 52, 2490–2512. [Google Scholar] [CrossRef] [Green Version]
  30. Luk, S.H.; Merz, W. Use of the salt tracing technique to determine the velocity of overland flow. Soil Technol. 1992, 5, 289–301. [Google Scholar] [CrossRef]
  31. Shang, H.; Zhang, K.; Wang, Z.; Yang, J.; He, M.; Pan, X.; Fang, C. Effect of varying wheatgrass density on resistance to overland flow. J. Hydrol. 2020, 591, 125594. [Google Scholar] [CrossRef]
  32. Mu, H.; Yu, X.; Fu, S.; Yu, B.; Liu, Y.; Zhang, G. Effect of stem basal cover on the sediment transport capacity of overland flows. Geoderma 2019, 337, 384–393. [Google Scholar] [CrossRef]
  33. Luo, M.; Pan, C.; Cui, Y.; Guo, Y.; Wu, Y. Effects of Different Aboveground Structural Parts of Grass Strips on the Sediment-Trapping Process. Sustainability 2021, 13, 7591. [Google Scholar] [CrossRef]
  34. Fu, X.T.; Zhang, L.P.; Wu, X.Y.; Wang, X.Y.; Zhang, H.S. Dynamic simulation on hydraulic characteristic values of overland flow. Water Resour. 2012, 39, 474–480. [Google Scholar] [CrossRef]
  35. Liu, G.; Xu, W.N.; Zhang, Q.; Xia, Z.Y. Interrill and Rill Erosion on Hillslope. Appl. Mech. Mater. 2012, 170, 1344–1347. [Google Scholar] [CrossRef]
  36. Beuselinck, L.; Govers, G.; Hairsine, P.; Sander, G.; Breynaert, M. The influence of rainfall on sediment transport by overland flow over areas of net deposition. J. Hydrol. 2002, 257, 145–163. [Google Scholar] [CrossRef]
  37. Pan, C.; Ma, L.; Wainwright, J. Particle selectivity of sediment deposited over grass barriers and the effect of rainfall. Water Resour. Res. 2016, 52, 7963–7979. [Google Scholar] [CrossRef] [Green Version]
  38. Lambrechts, T.; François, S.; Lutts, S.; Muñoz-Carpena, R.; Bielders, C.L. Impact of plant growth and morphology and of sediment concentration on sediment retention efficiency of vegetative filter strips: Flume experiments and VFSMOD modeling. J. Hydrol. 2014, 511, 800–810. [Google Scholar] [CrossRef]
  39. Pan, D.; Gao, X.; Dyck, M.; Song, Y.; Wu, P.; Zhao, X. Dynamics of runoff and sediment trapping performance of vegetative filter strips: Run-on experiments and modeling. Sci. Total. Environ. 2017, 593, 54–64. [Google Scholar] [CrossRef]
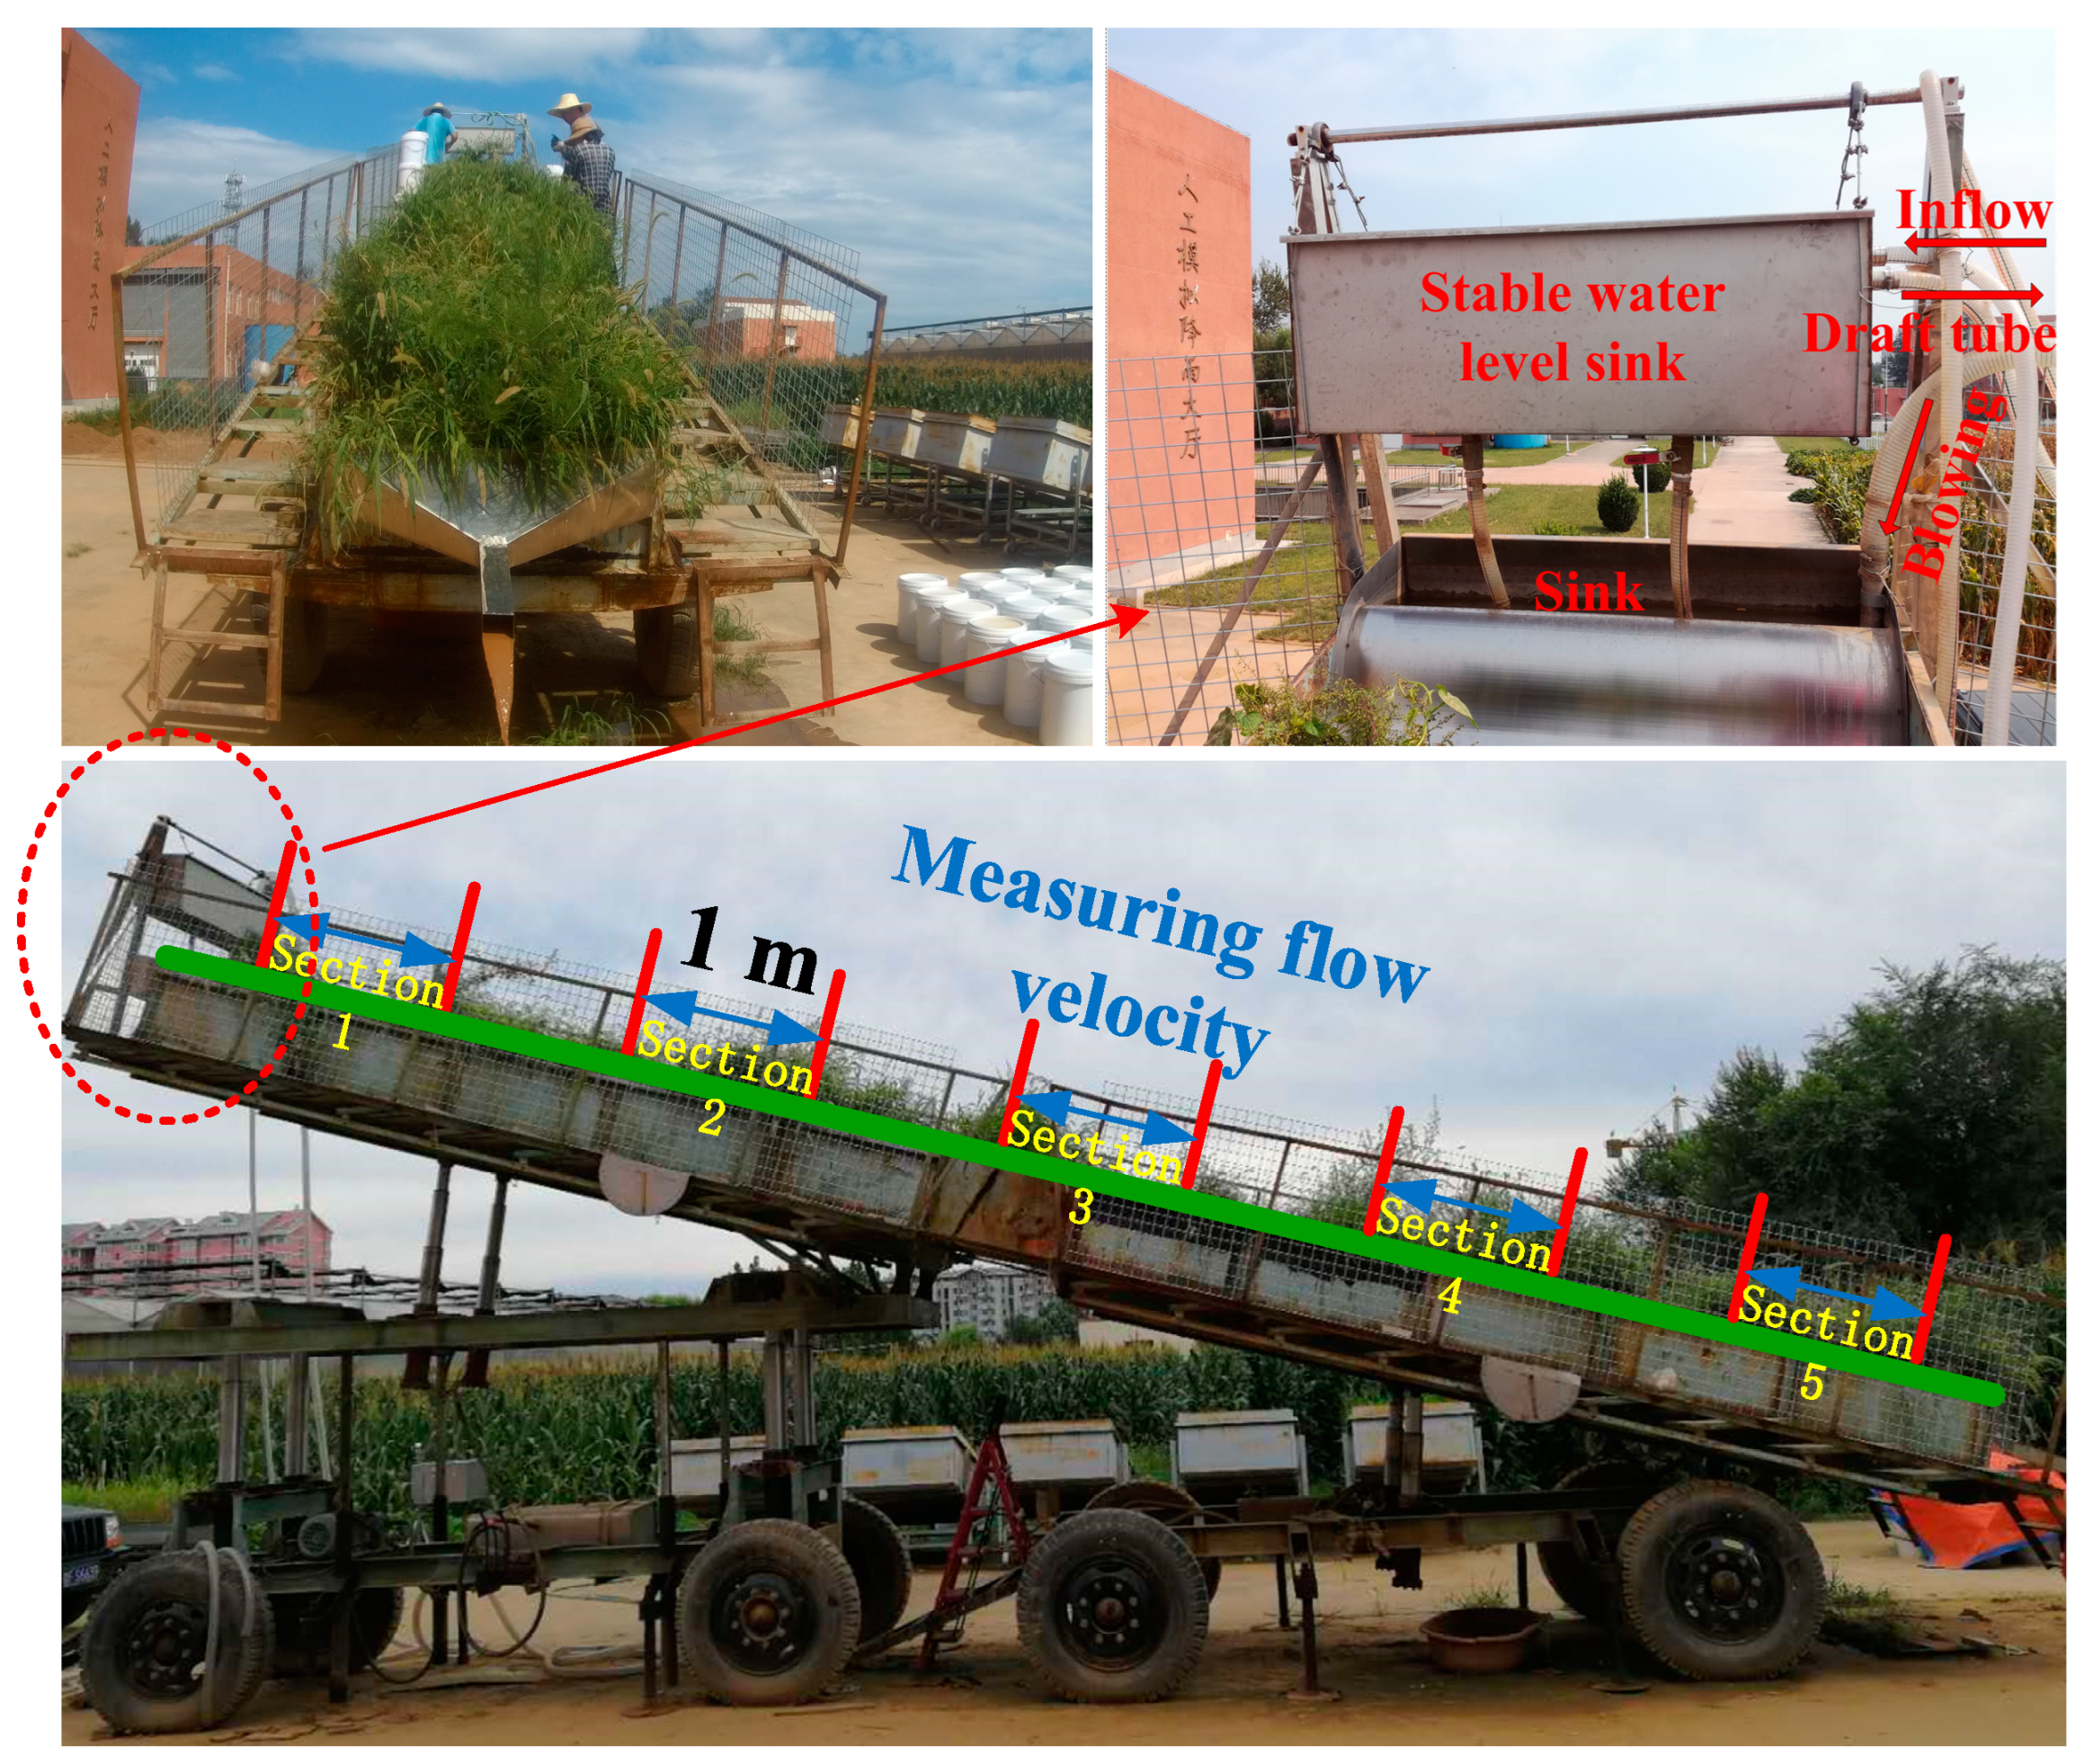
Figure 1. Experimental setup and grass strips.
Water 15 02922 g001
Figure 2. Overland flow pattern under different experimental treatments. Subfigures (a,c,e) are the V, Fr, and Re of tests under the conditions of the sediment concentration of 40 g L−1with flow rates of 7.5, 15, 30, and 45 L min−1 m−1; (b,d,f) are V, Fr, and Re of tests under the conditions of the sediment concentration of 120 g L−1 with flow rates of 7.5, 15, 30, and 45 L min−1 m−1, respectively. Note(s): These figures are box plots. The middle red line represents the median. The lower and upper blue lines represent the first and third quartiles, respectively. The two black lines above and below the blue box are the maximum and the minimum values (except the outliers), respectively. The red plus signs are the outlier points. The outliers of the box plots in this study were identified via the following process. The lower and upper quartiles (D1 and D3) are the 25% and 75% positions of the ascending sequence, respectively. The interquartile range (IQR) = D 3 D 1 . In a box plot, the data of > D 3 + 3 2 I Q R or > D 1 3 2 I Q R were identified as outliers in this study.
Water 15 02922 g002
Figure 3. Relationship between flow rate and mean flow velocity.
Water 15 02922 g003
Figure 4. Sediment delivery rate of the outflow.
Water 15 02922 g004
Figure 5. Variation process of the median particle size (d50) and the peak particle diameter (dp) of sediment in outlet runoff. Subfigures (a,b) are the d50 and dp of two sets of experiments under conditions of sediment concentrations of 40 and 120 g L−1, respectively.
Water 15 02922 g005
Figure 6. Composition of sediment particle size at the outlet. Subfigures (ad) are the results of tests under the conditions of sediment concentration of 40 g L−1with flow rates of 7.5, 15, 30, and 45 L min−1 m−1; (eh) are the results of tests under the conditions of a sediment concentration of 120 g L−1 with flow rates of 7.5, 15, 30, and 45 L min−1 m−1, respectively.
Water 15 02922 g006
Table 1. The physical properties of the soil used in the experiments.
Soil TypeSoil TextureThe Median Diameter (d50/μm)
Loessial soilSandy loam soil39.9 ± 2.7
Particle size distribution (%)/μm
>10001000−500500−250250−100100−5050−2020−22−1<1
00.55 ± 0.341.14 ± 0.075.27 ± 1.4829.15 ± 2.7346.04 ± 1.4315.32 ± 2.150.87 ± 0.111.66 ± 0.14
Table 2. Experiments on sediment trapping of grass strips with inflow rate treatments.
Test Code *Slope and Sediment ConcentrationDesigned Flow Rate Q (L min−1 m−1)Duration t (min)
S15Q7.5SC40S = 15°
SC = 40 g L−1
7.5250
S15Q15SC4015162
S15Q30SC403088
S15Q45SC404562
S15Q7.5SC120S = 15°
SC = 120 g L−1
7.5156
S15Q15SC1201590
S15Q30SC1203058
S15Q45SC1204560
Note(s): * The experimental conditions can be obtained directly from the test code, such as S15Q15SC40, which indicates that the slope is 15°, the flow rate is 15 L min−1 m−1, and the sediment concentration is 40 g L−1.
Table 3. The ranges of the mean velocity (V), Froude number (Fr), and Reynolds number (Re) of overland flow in the different treatment experiments.
Experimental CodeV (m/s)FrRe
S15Q7.5SC400.051~0.0790.22~0.49110~585
S15Q15SC400.070~0.0970.31~0.50268~842
S15Q30SC400.065~0.0980.20~0.36606~1115
S15Q45SC400.076~0.1100.22~0.35828~1083
S15Q7.5SC1200.058~0.0810.25~0.47243~436
S15Q15SC1200.071~0.1040.35~0.60247~612
S15Q30SC1200.072~0.1100.22~0.49606~1141
S15Q45SC1200.086~0.1090.25~0.36771~1257
Table 4. The fitting results of the relationship between the representative particle sizes (d50 and dp) and sediment delivery rate (T) at the outlet.
Test
Code
T = α d 50 β T = k d 50 + b T = α d p β T = k d p + b
αβR2kbR2αβR2kbR2
S15Q7.5SC400.0281.4710.650.196−1.550.690.0161.5200.720.141−1.380.74
S15Q15SC400.8810.6230.610.2461.940.580.6940.7170.730.2051.660.71
S15Q30SC400.0261.9270.720.944−10.230.760.0261.7580.710.640−8.390.74
S15Q45SC400.0102.2910.731.730−26.830.780.0022.6320.861.458−30.890.91
S15Q7.5SC1200.0092.0720.780.647−8.560.840.0091.9450.790.488−6.960.83
S15Q15SC1200.1161.6320.341.734−21.280.390.0241.9130.391.277−23.010.44
S15Q30SC1200.0282.2690.863.722−48.240.910.0122.3130.902.538−41.640.92
S15Q45SC1203.0710.9170.382.429−4.040.380.3081.5110.583.145−43.950.63
Disclaimer/Publisher’s Note: The statements, opinions and data contained in all publications are solely those of the individual author(s) and contributor(s) and not of MDPI and/or the editor(s). MDPI and/or the editor(s) disclaim responsibility for any injury to people or property resulting from any ideas, methods, instructions or products referred to in the content.