Comparative Application of Rain Gauge, Ground- and Space-Borne Radar Precipitation Products for Flood Simulations in a Dam Watershed in South Korea
Abstract
:1. Introduction
2. Materials and Methods
2.1. Study Area
2.2. Data
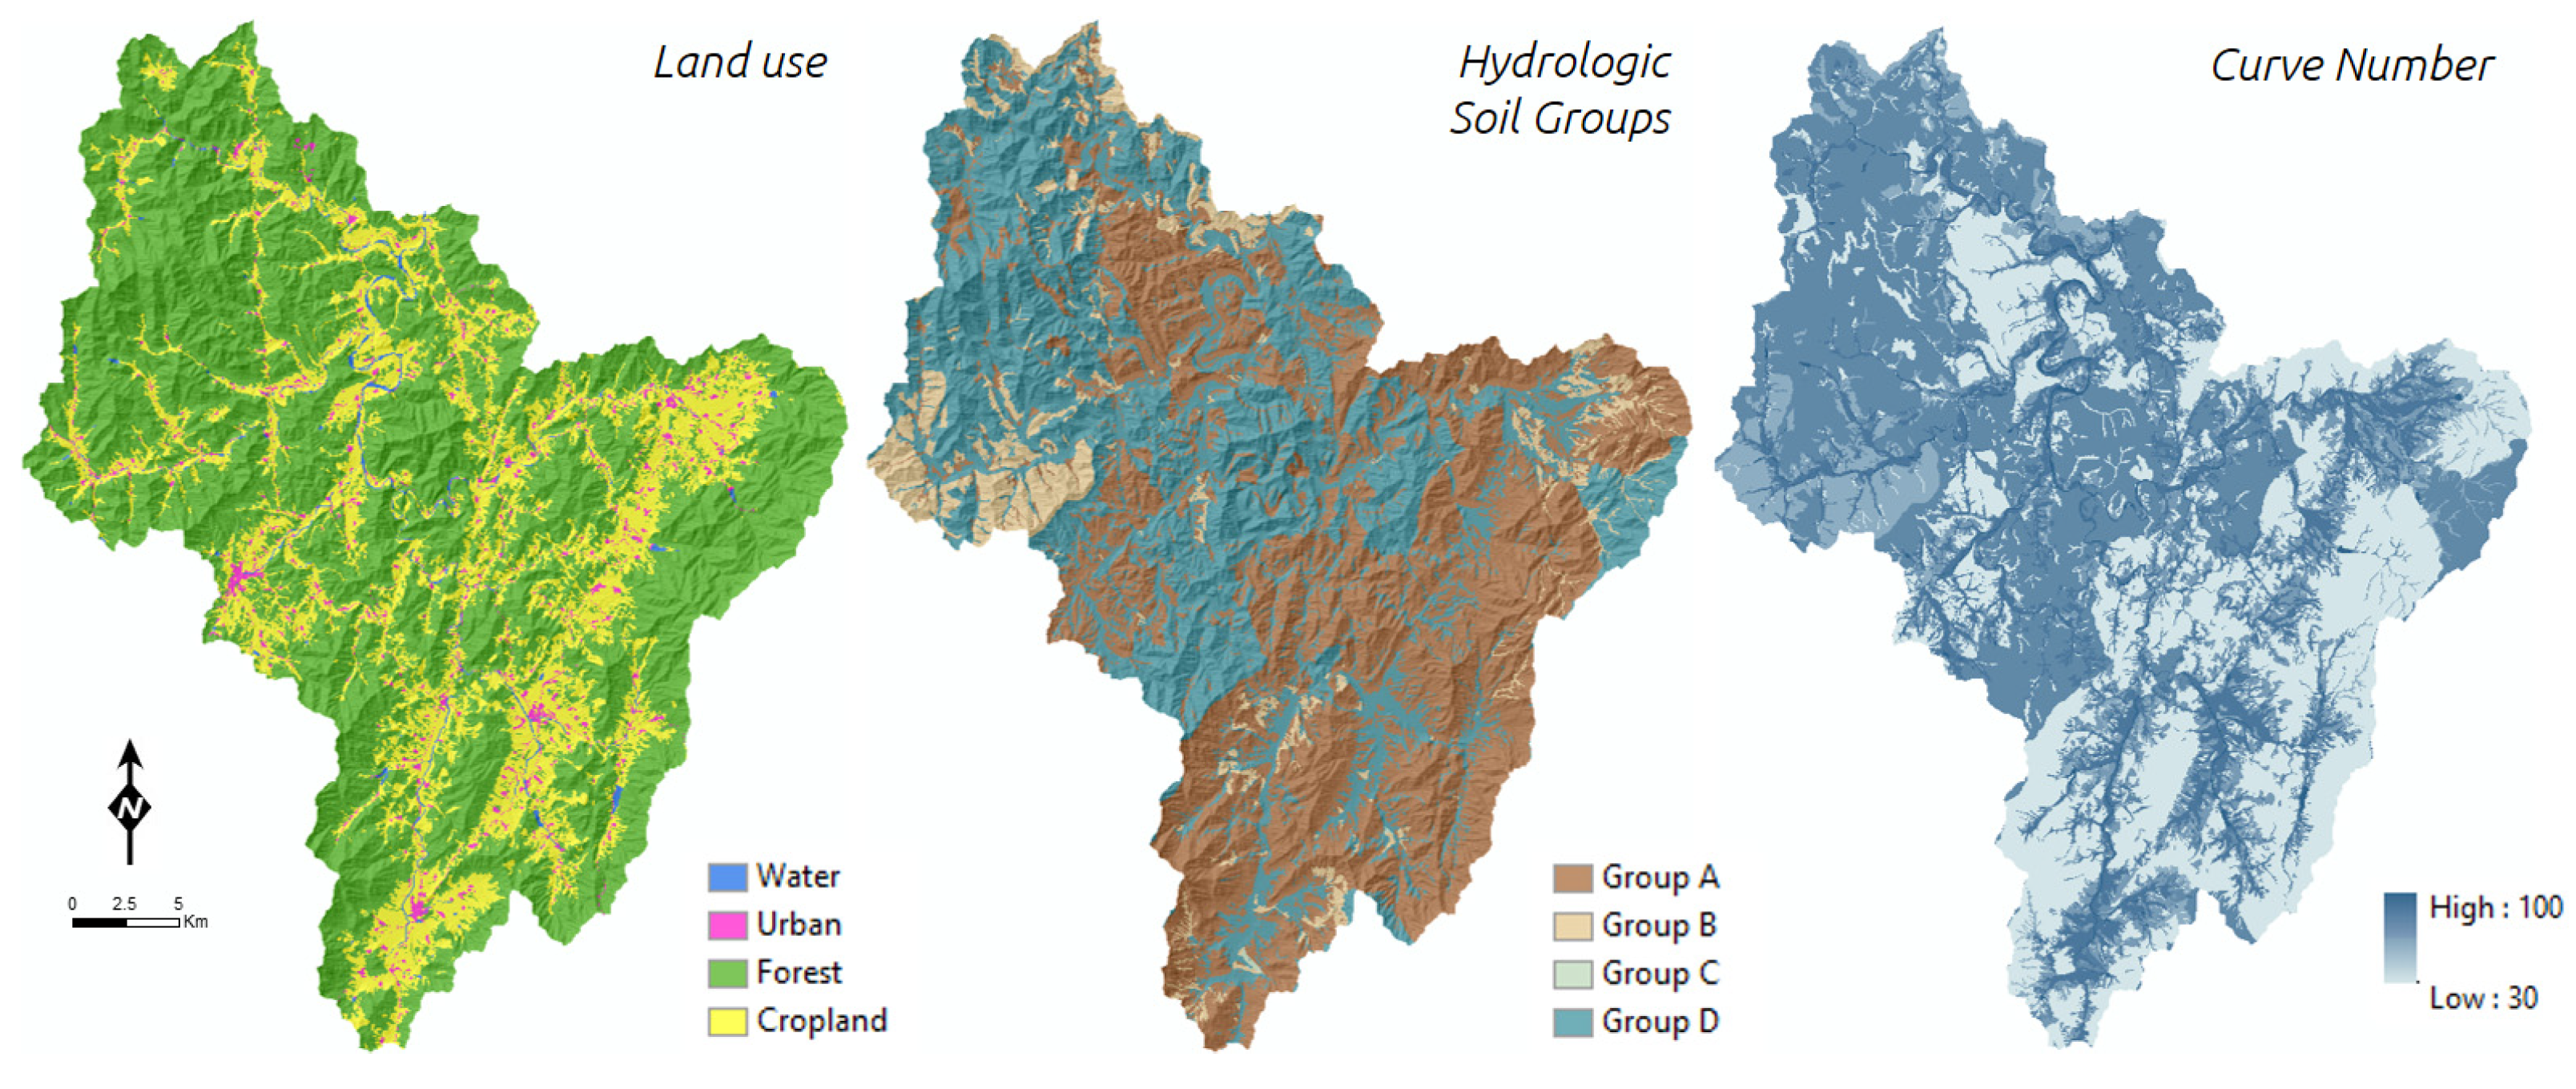
2.2.1. Land Surface Data
2.2.2. Gauged Data
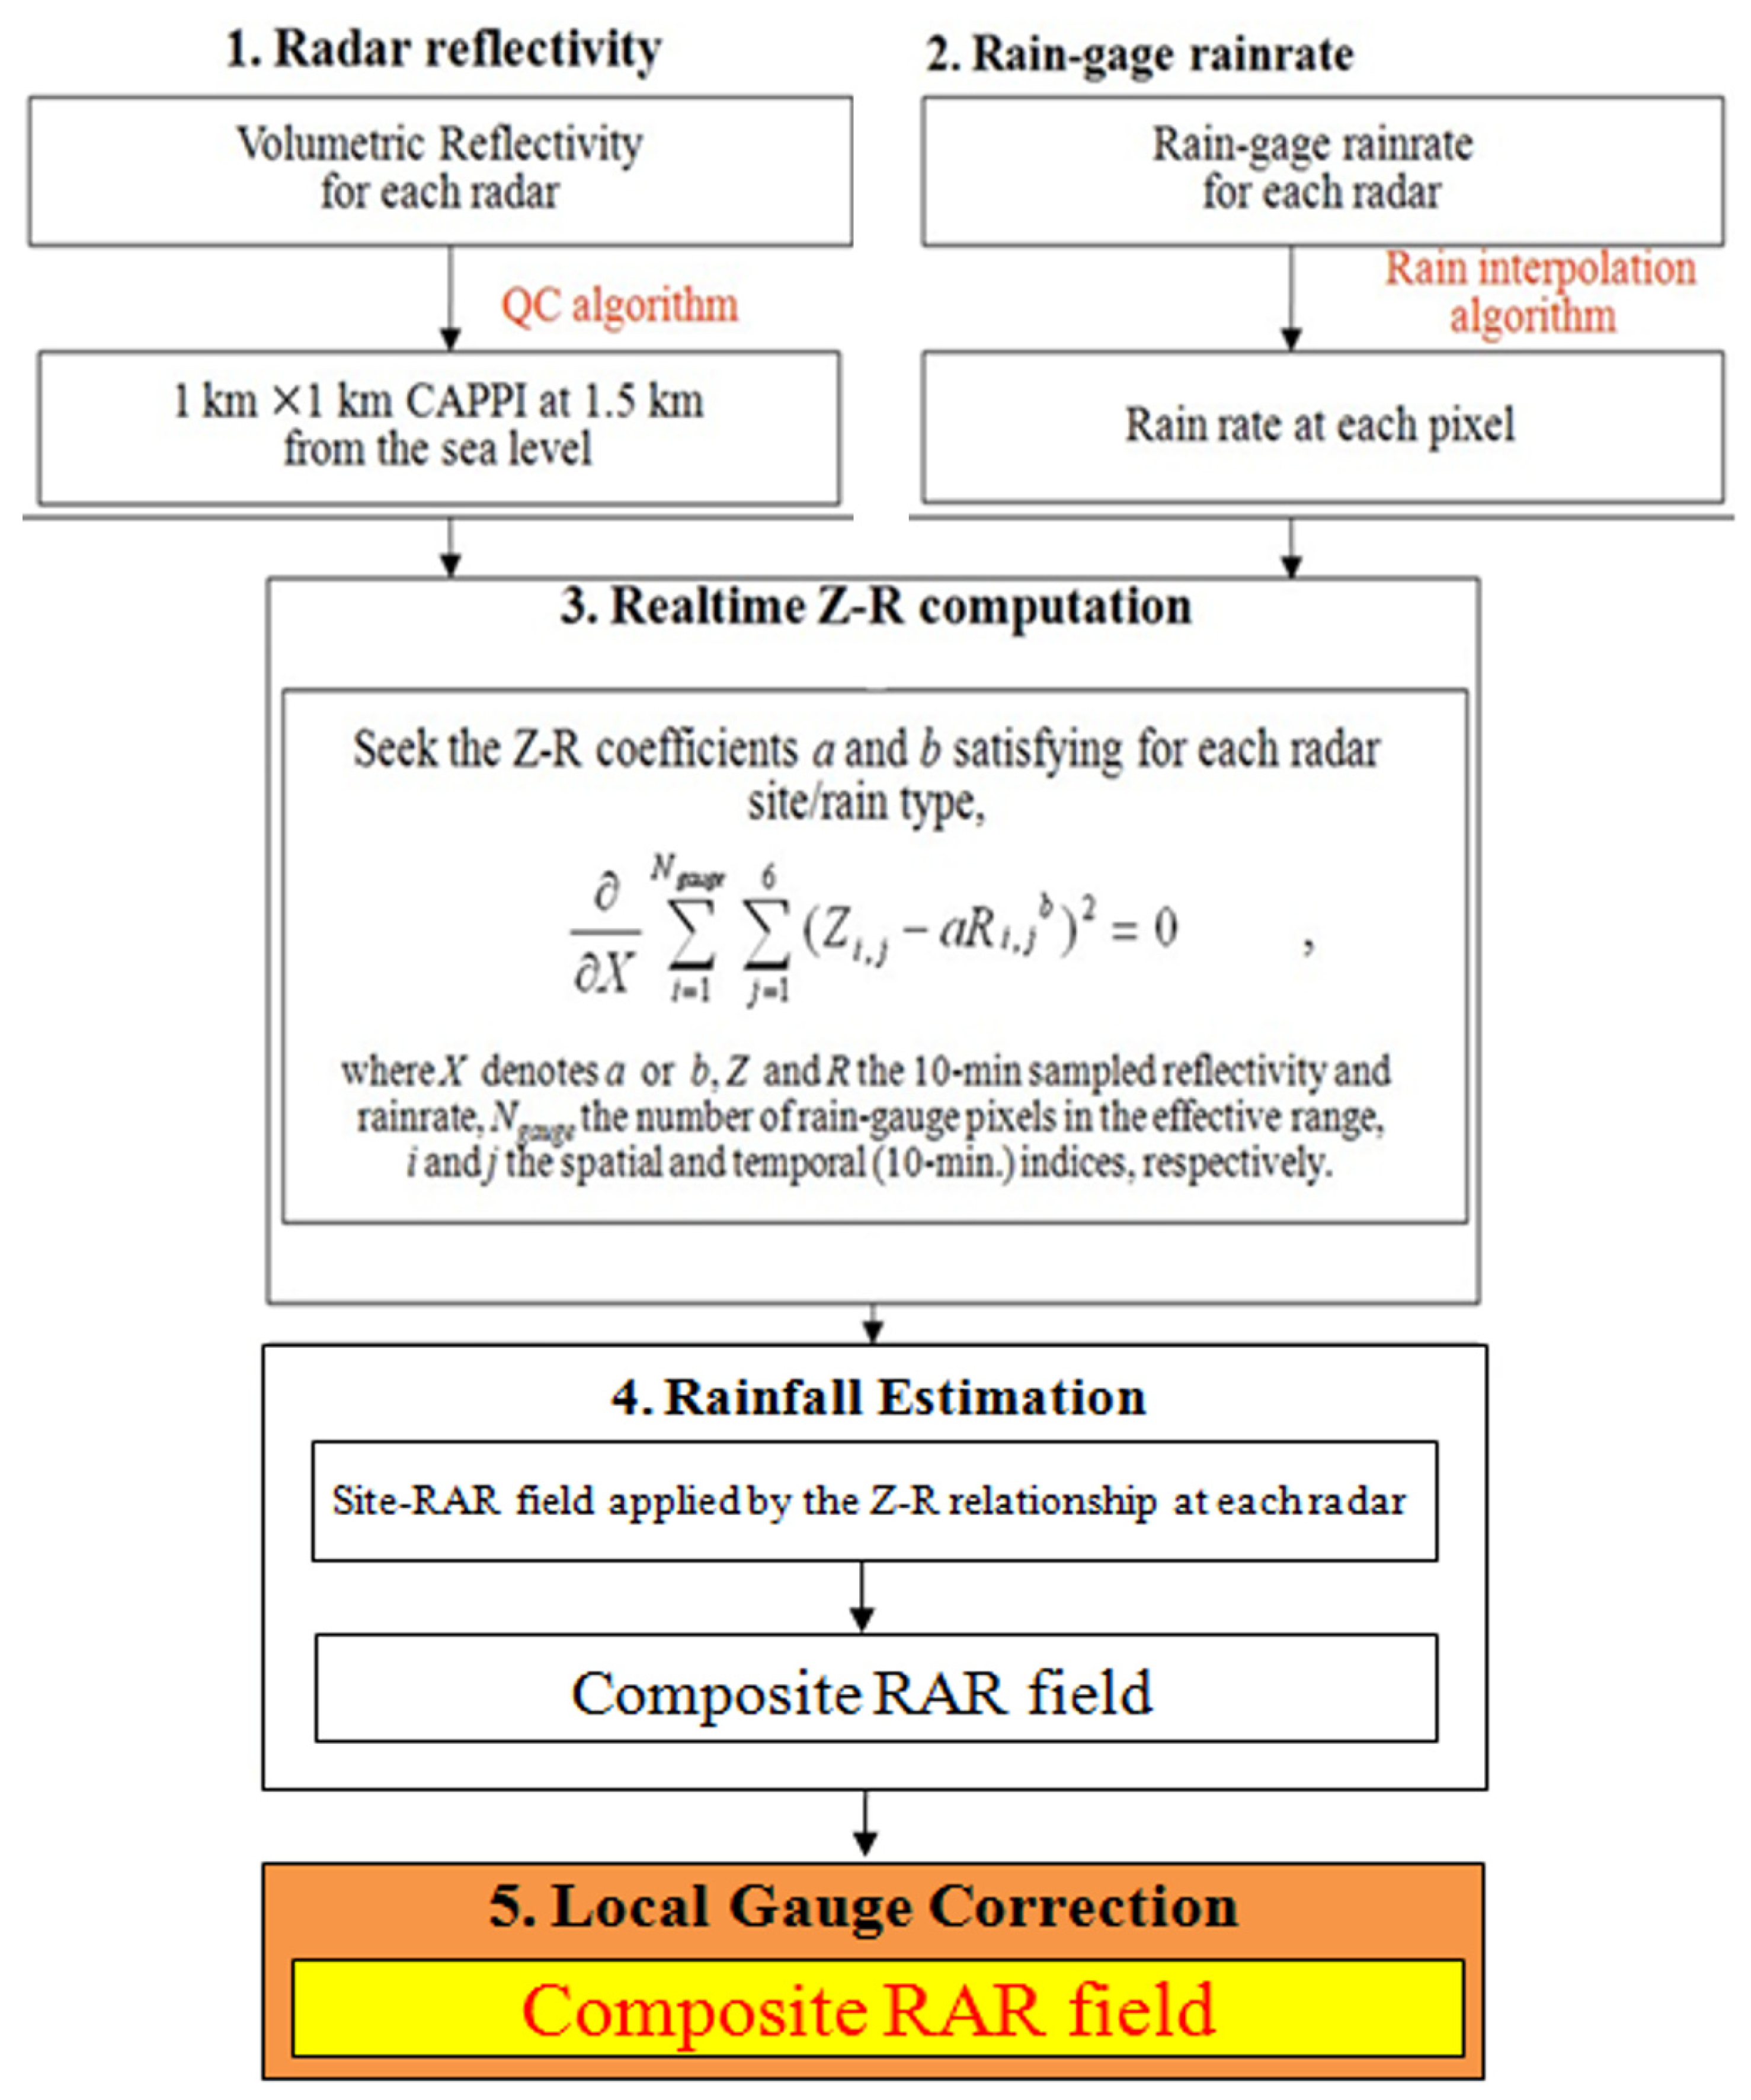
2.2.3. Ground-Borne Radar Precipitation Product (RAR)
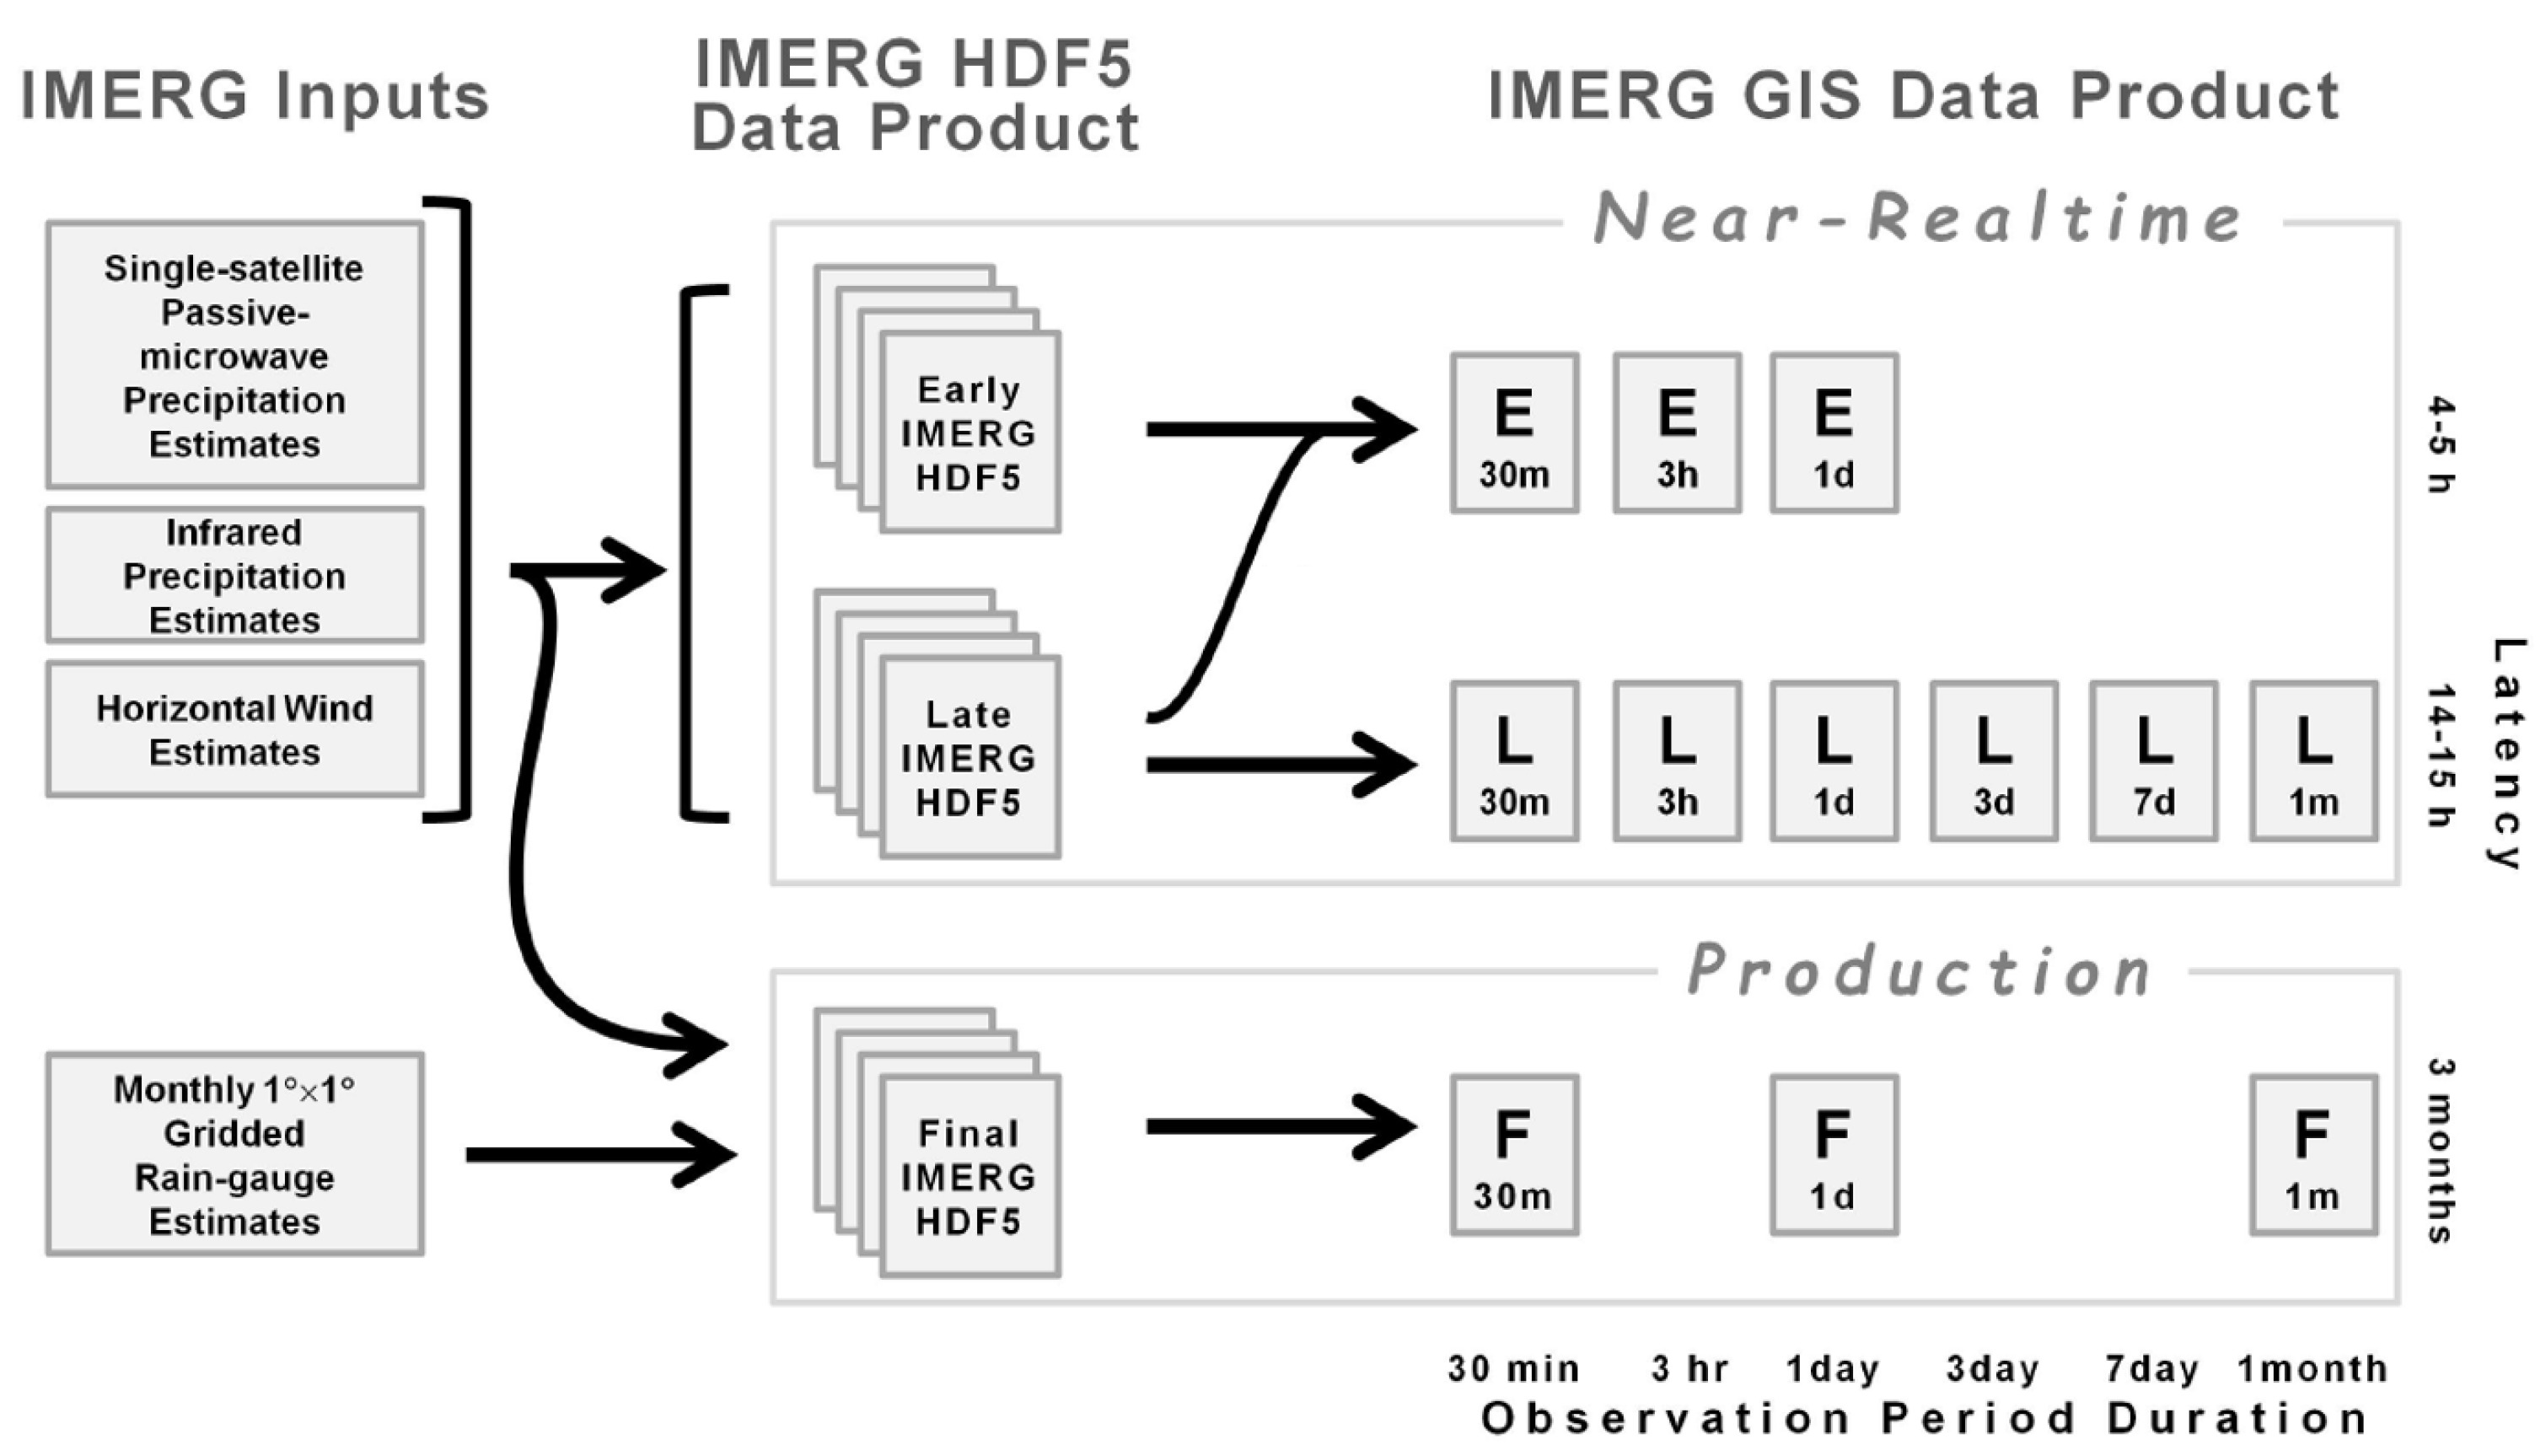
2.2.4. Space-Borne Radar Precipitation Product (IMERG)
2.3. Hydrologic Model
2.4. Methods
2.4.1. Flood Events Selection
2.4.2. Radar Precipitation Products Processing
2.4.3. HEC-HMS Model Development
2.4.4. Flood Simulation and Evaluation
3. Results and Discussion
3.1. Precipitation Estimates
3.1.1. Amounts
3.1.2. Spatial Variability
3.2. Model Development
3.3. Flood Simulations
4. Conclusions
- (1)
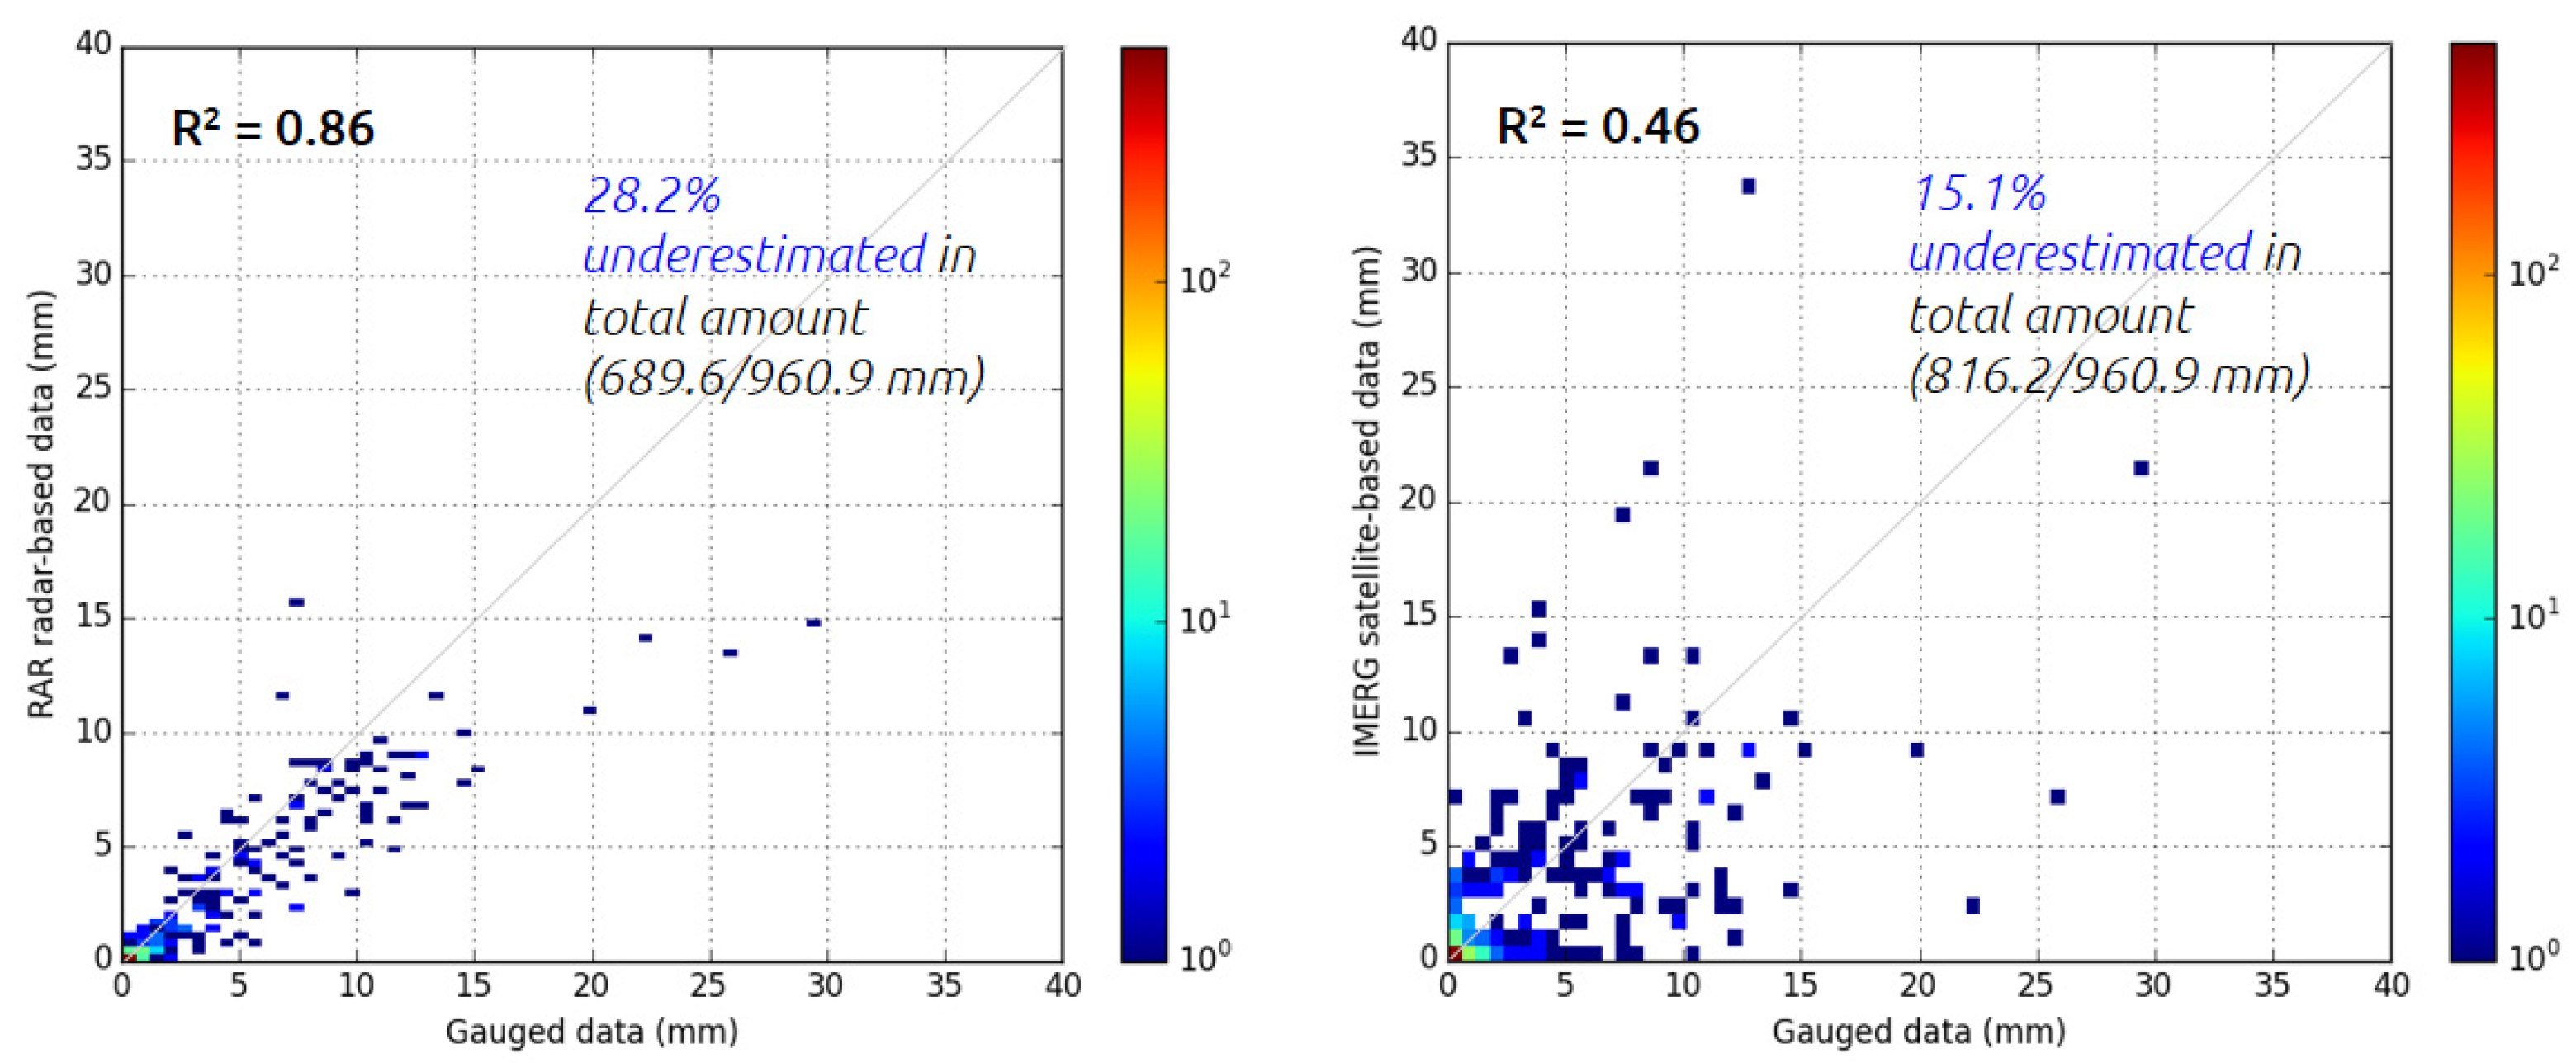
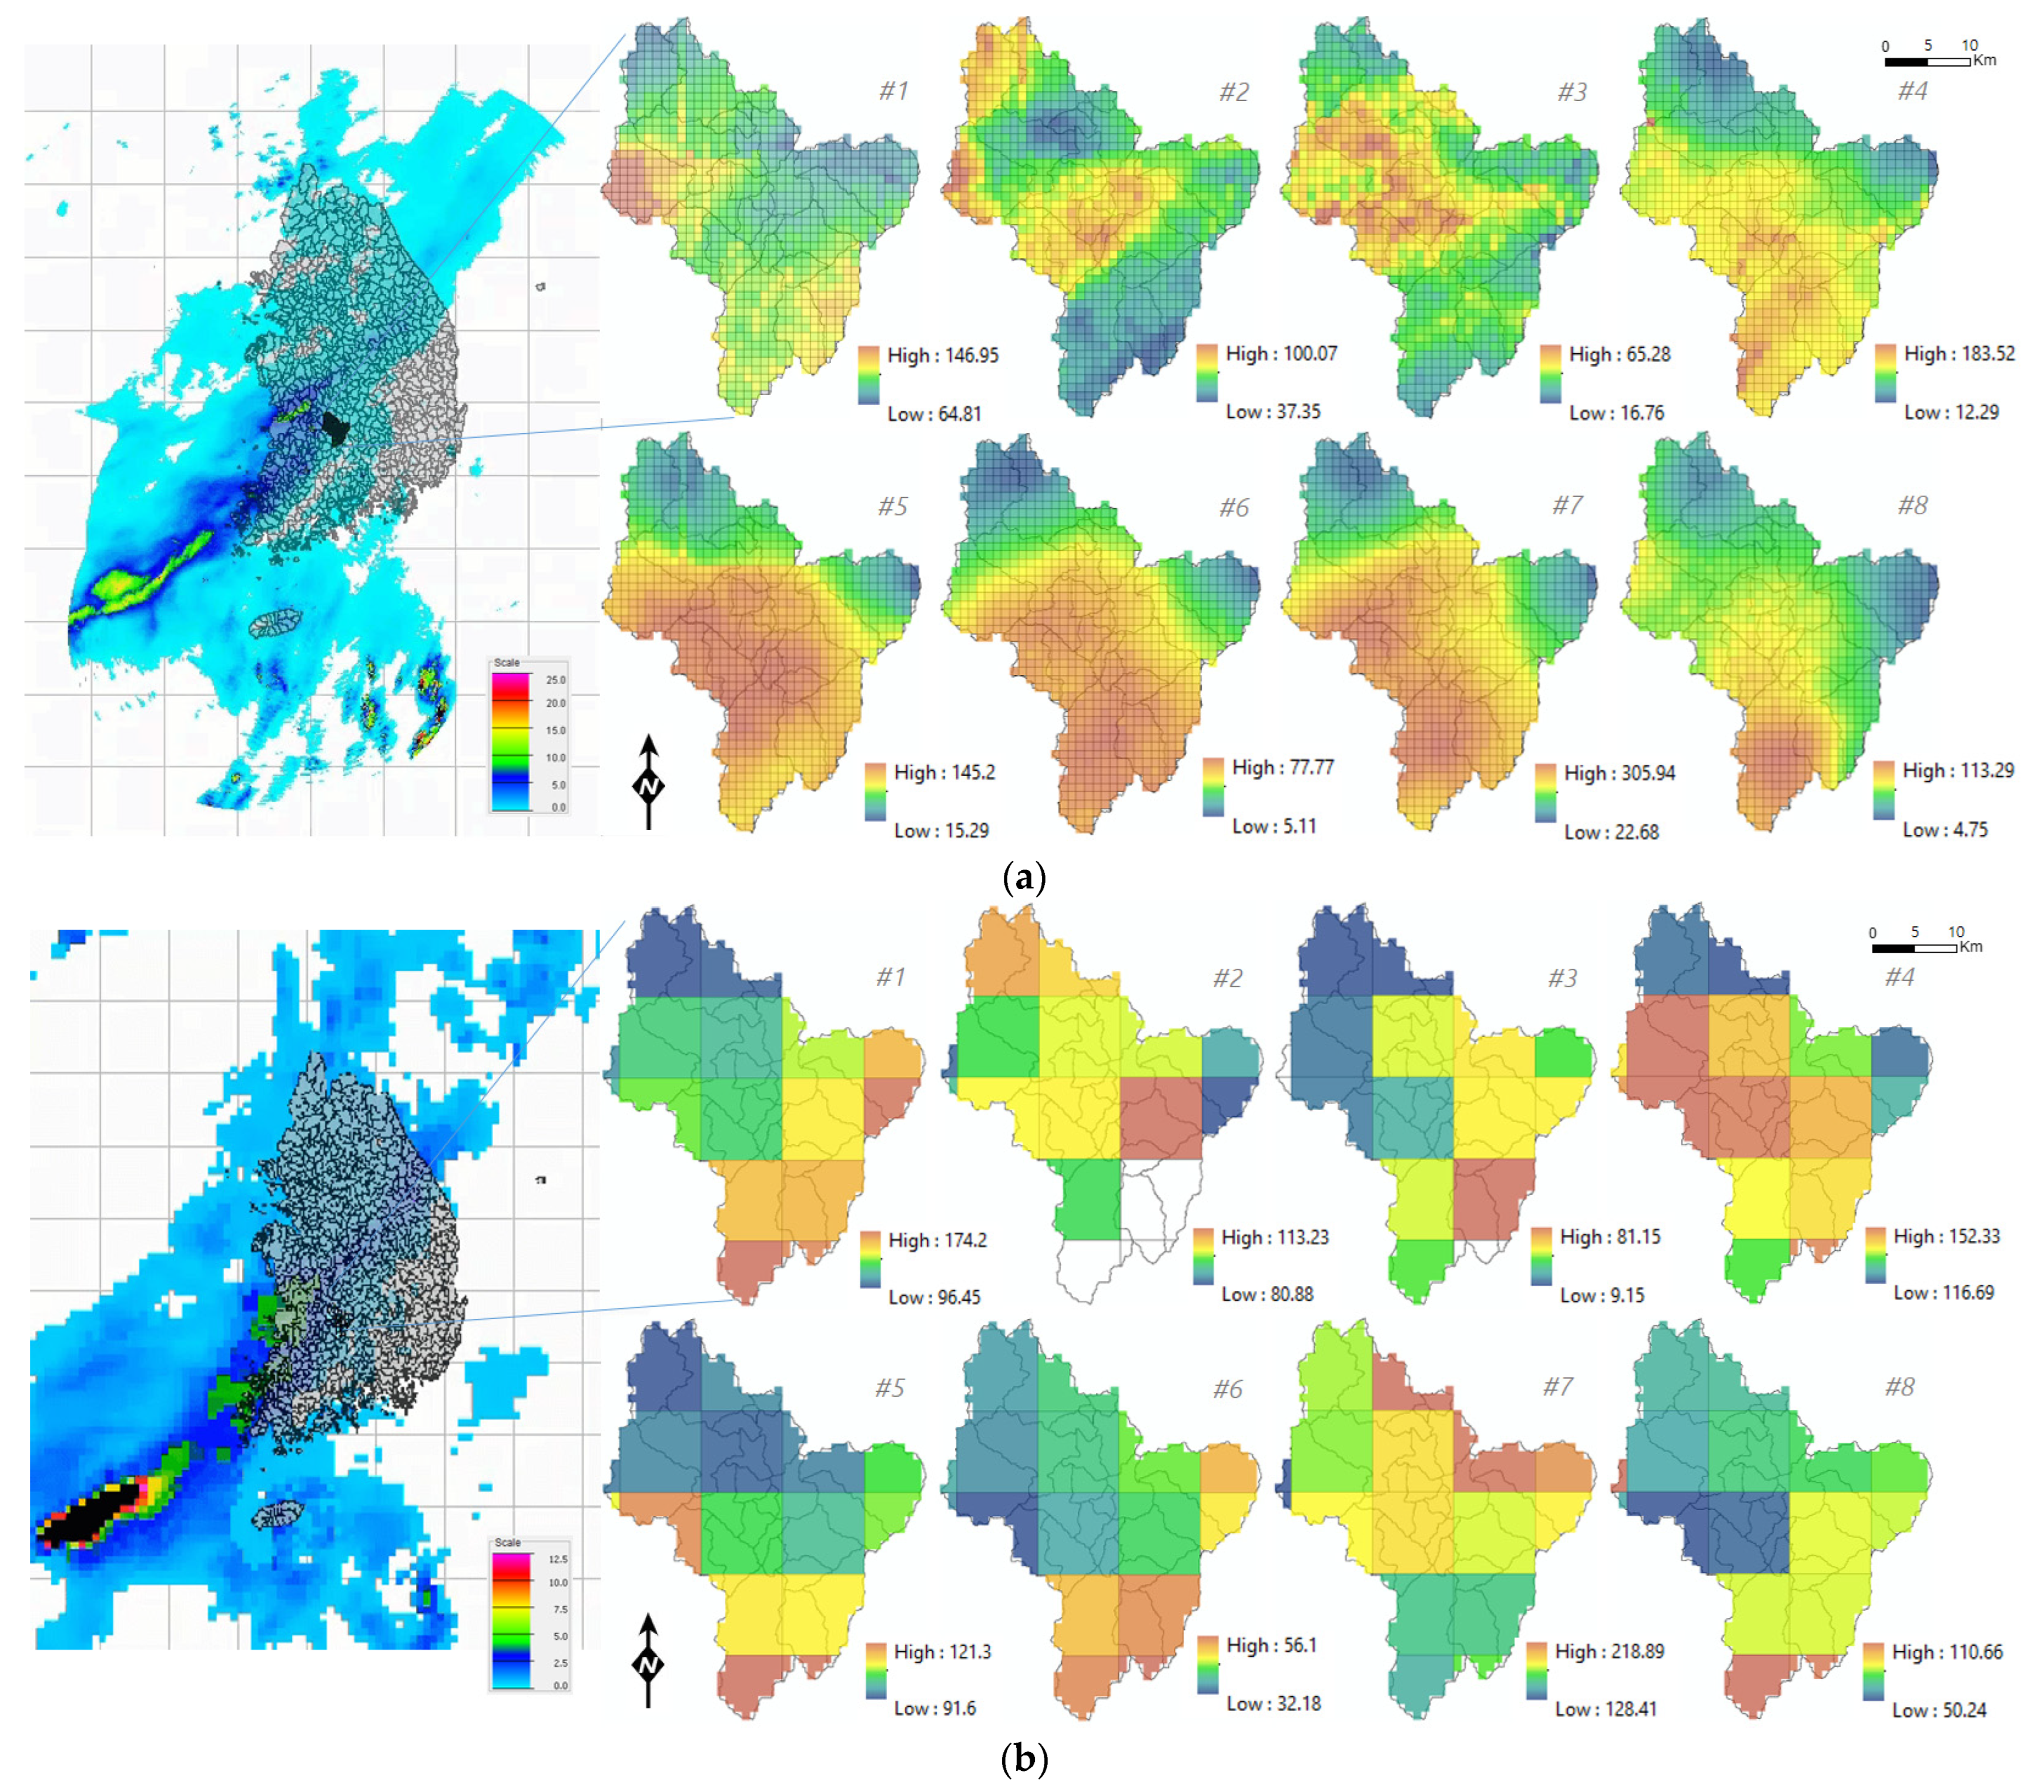
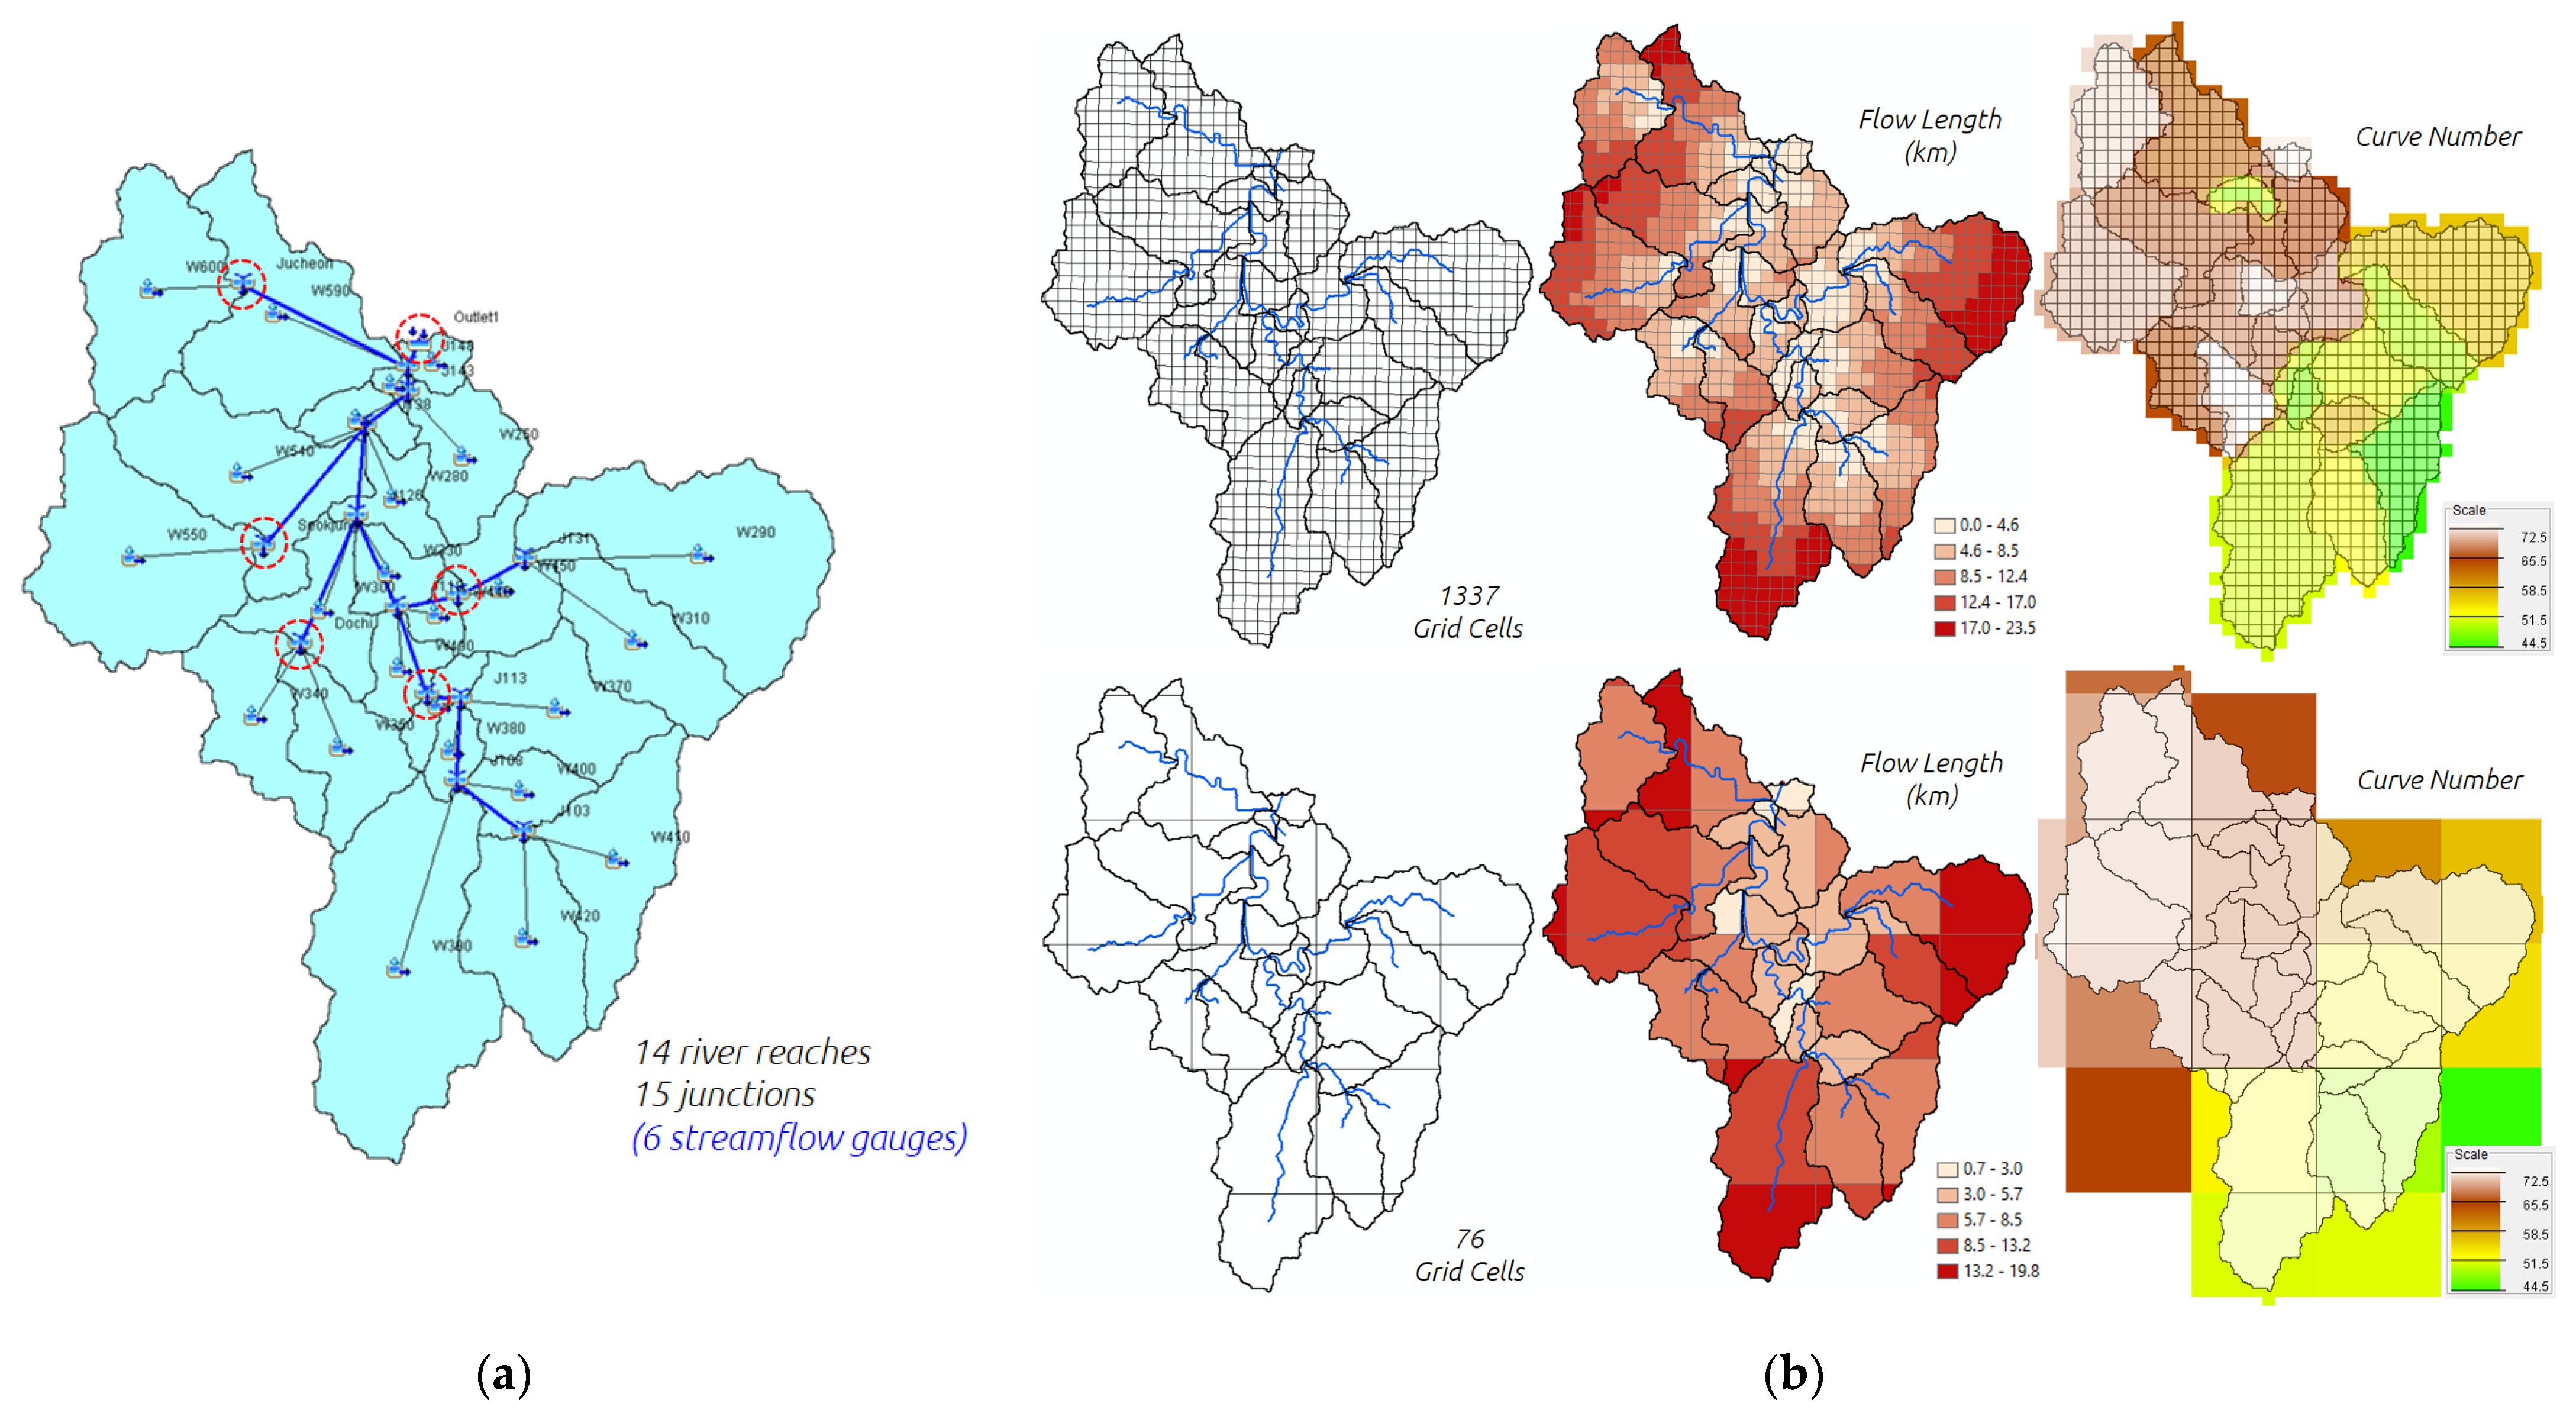
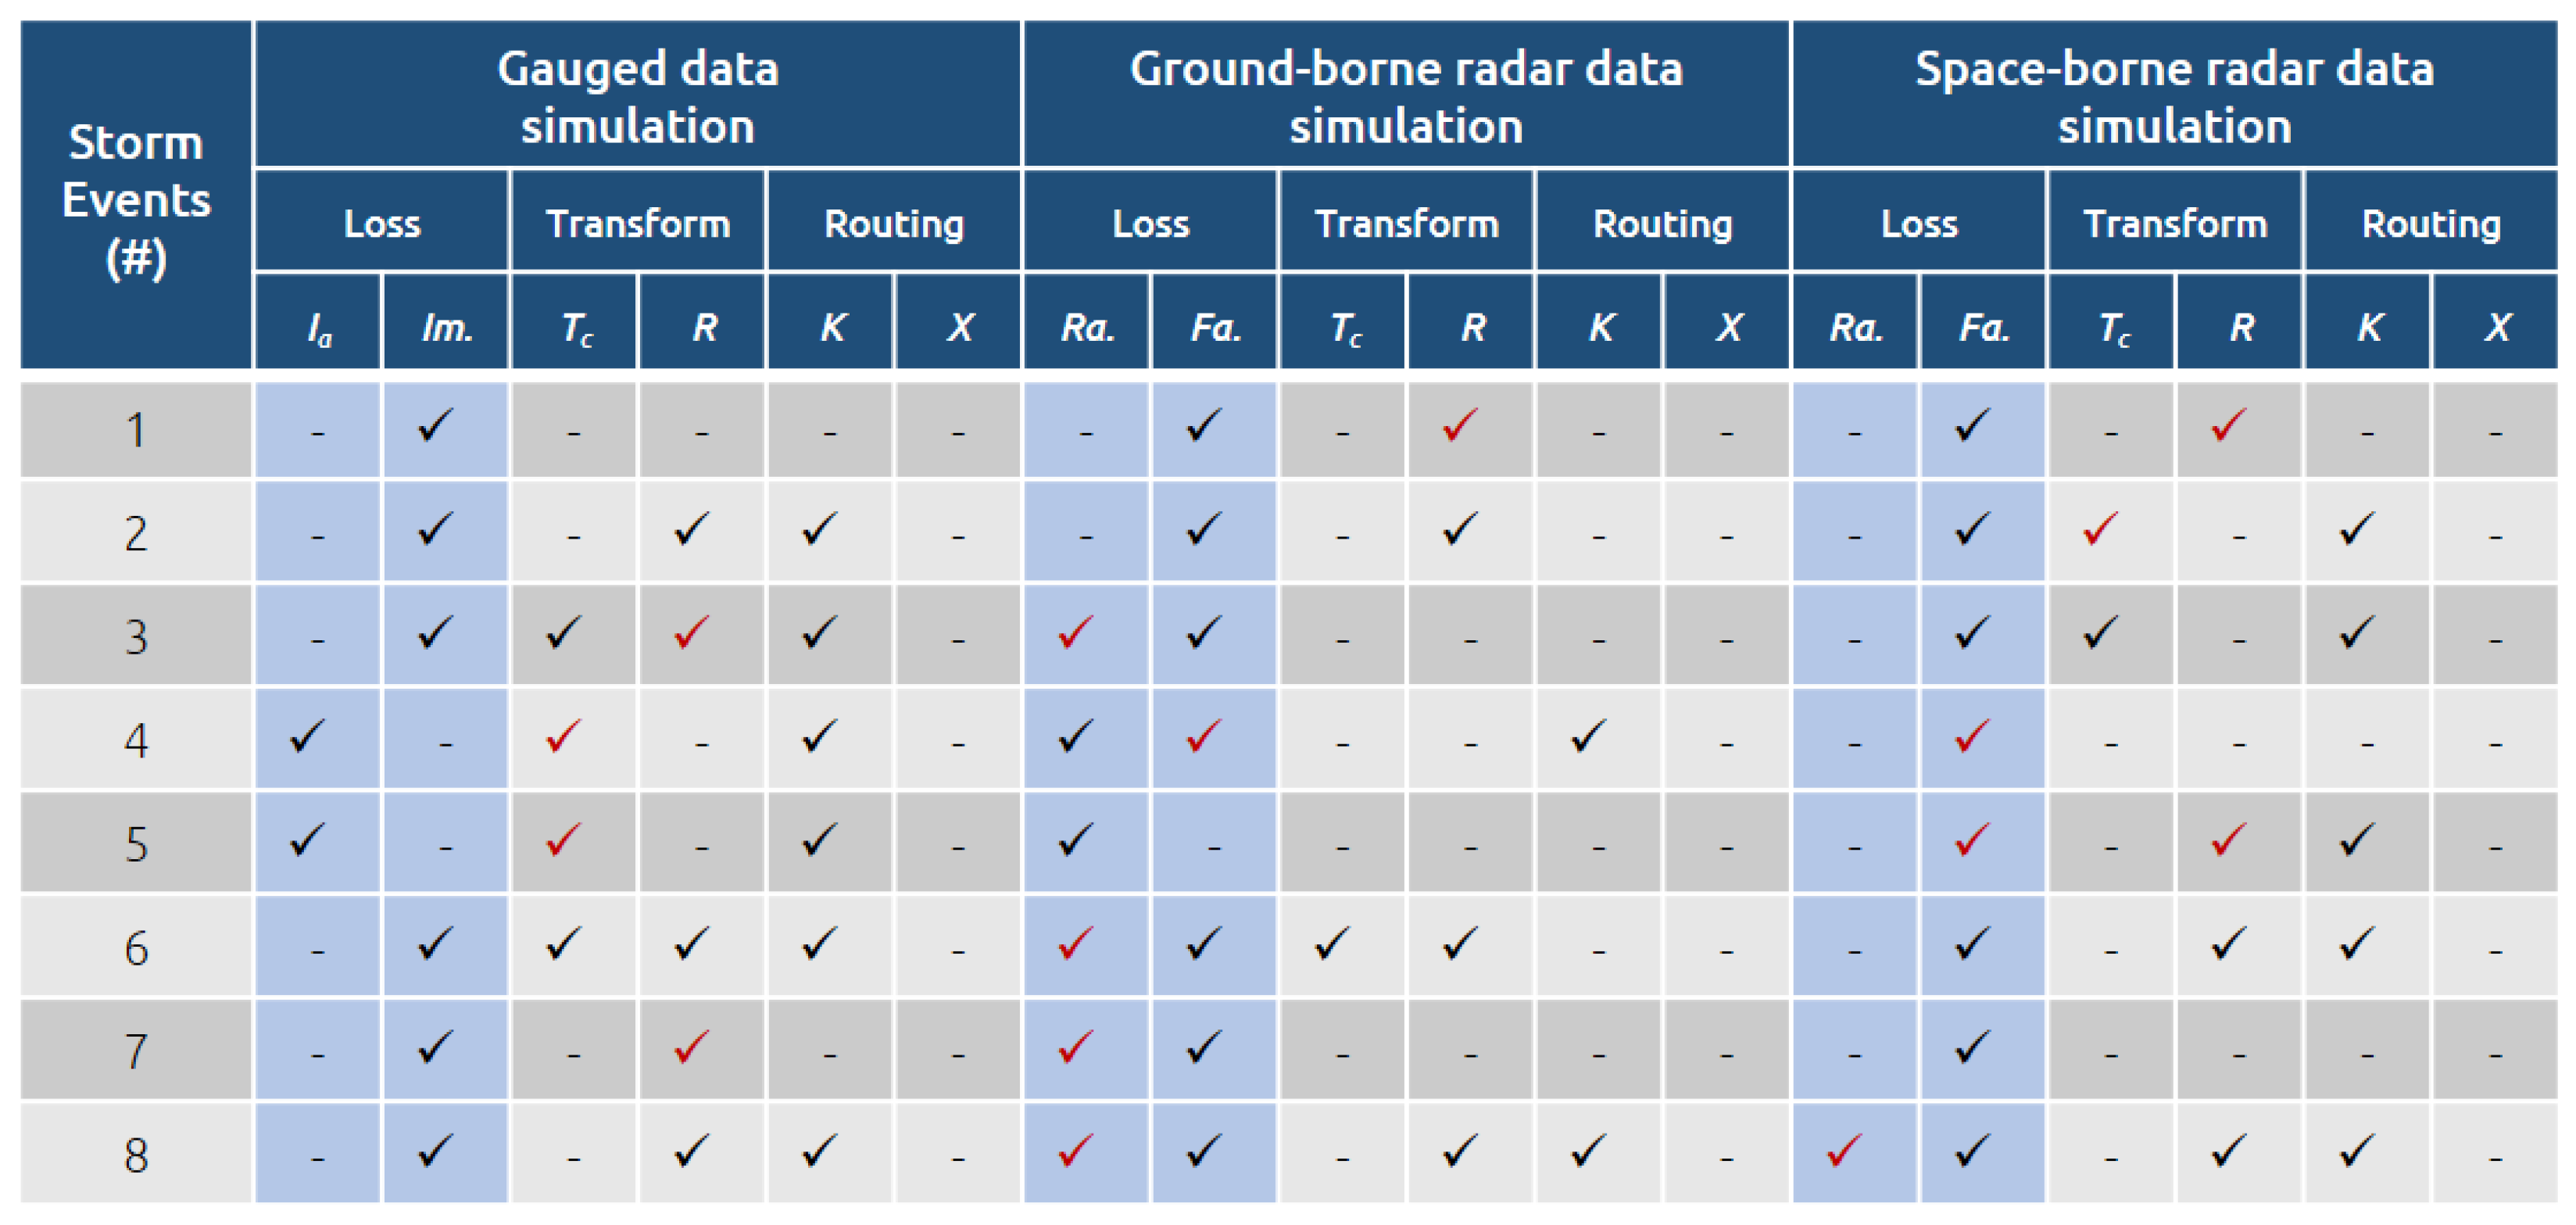
- Overall, the Korea Meteorological Administration’s ground-borne weather radar data (RAR) exhibited a slight underestimation of precipitation values compared to gauge point observations, with a difference of 28.2% across all eight flood events (R2 0.86). Consequently, adjustments to related model parameter values were necessary for flood analysis using the RAR data. However, due to the spatial distribution advantages of radar rainfall, aspects related to rainfall-runoff transformation and river channel routing, such as travel time, could be simulated to generate hydrographs that closely resembled the observed discharge without the need to adjust the related parameter values;
- (2)
- For space-borne (i.e., satellite-based) IMERG precipitation data, the total observed amount was underestimated by 15.1% across the eight flood events. However, the correlation coefficient (R2) was 0.46, indicating significant differences from the gauged data. Even with adjustments to parameter values, flood simulations using the IMERG product demonstrated relatively lower correlation and model efficiency compared to the observations. This indicates a significant limitation in using the half-hourly IMERG data for flood modeling in ungauged watersheds. Despite this constraint, it is still inferred that in locations where some discharge data are available, the utilization of the model through verification and calibration is feasible;
- (3)
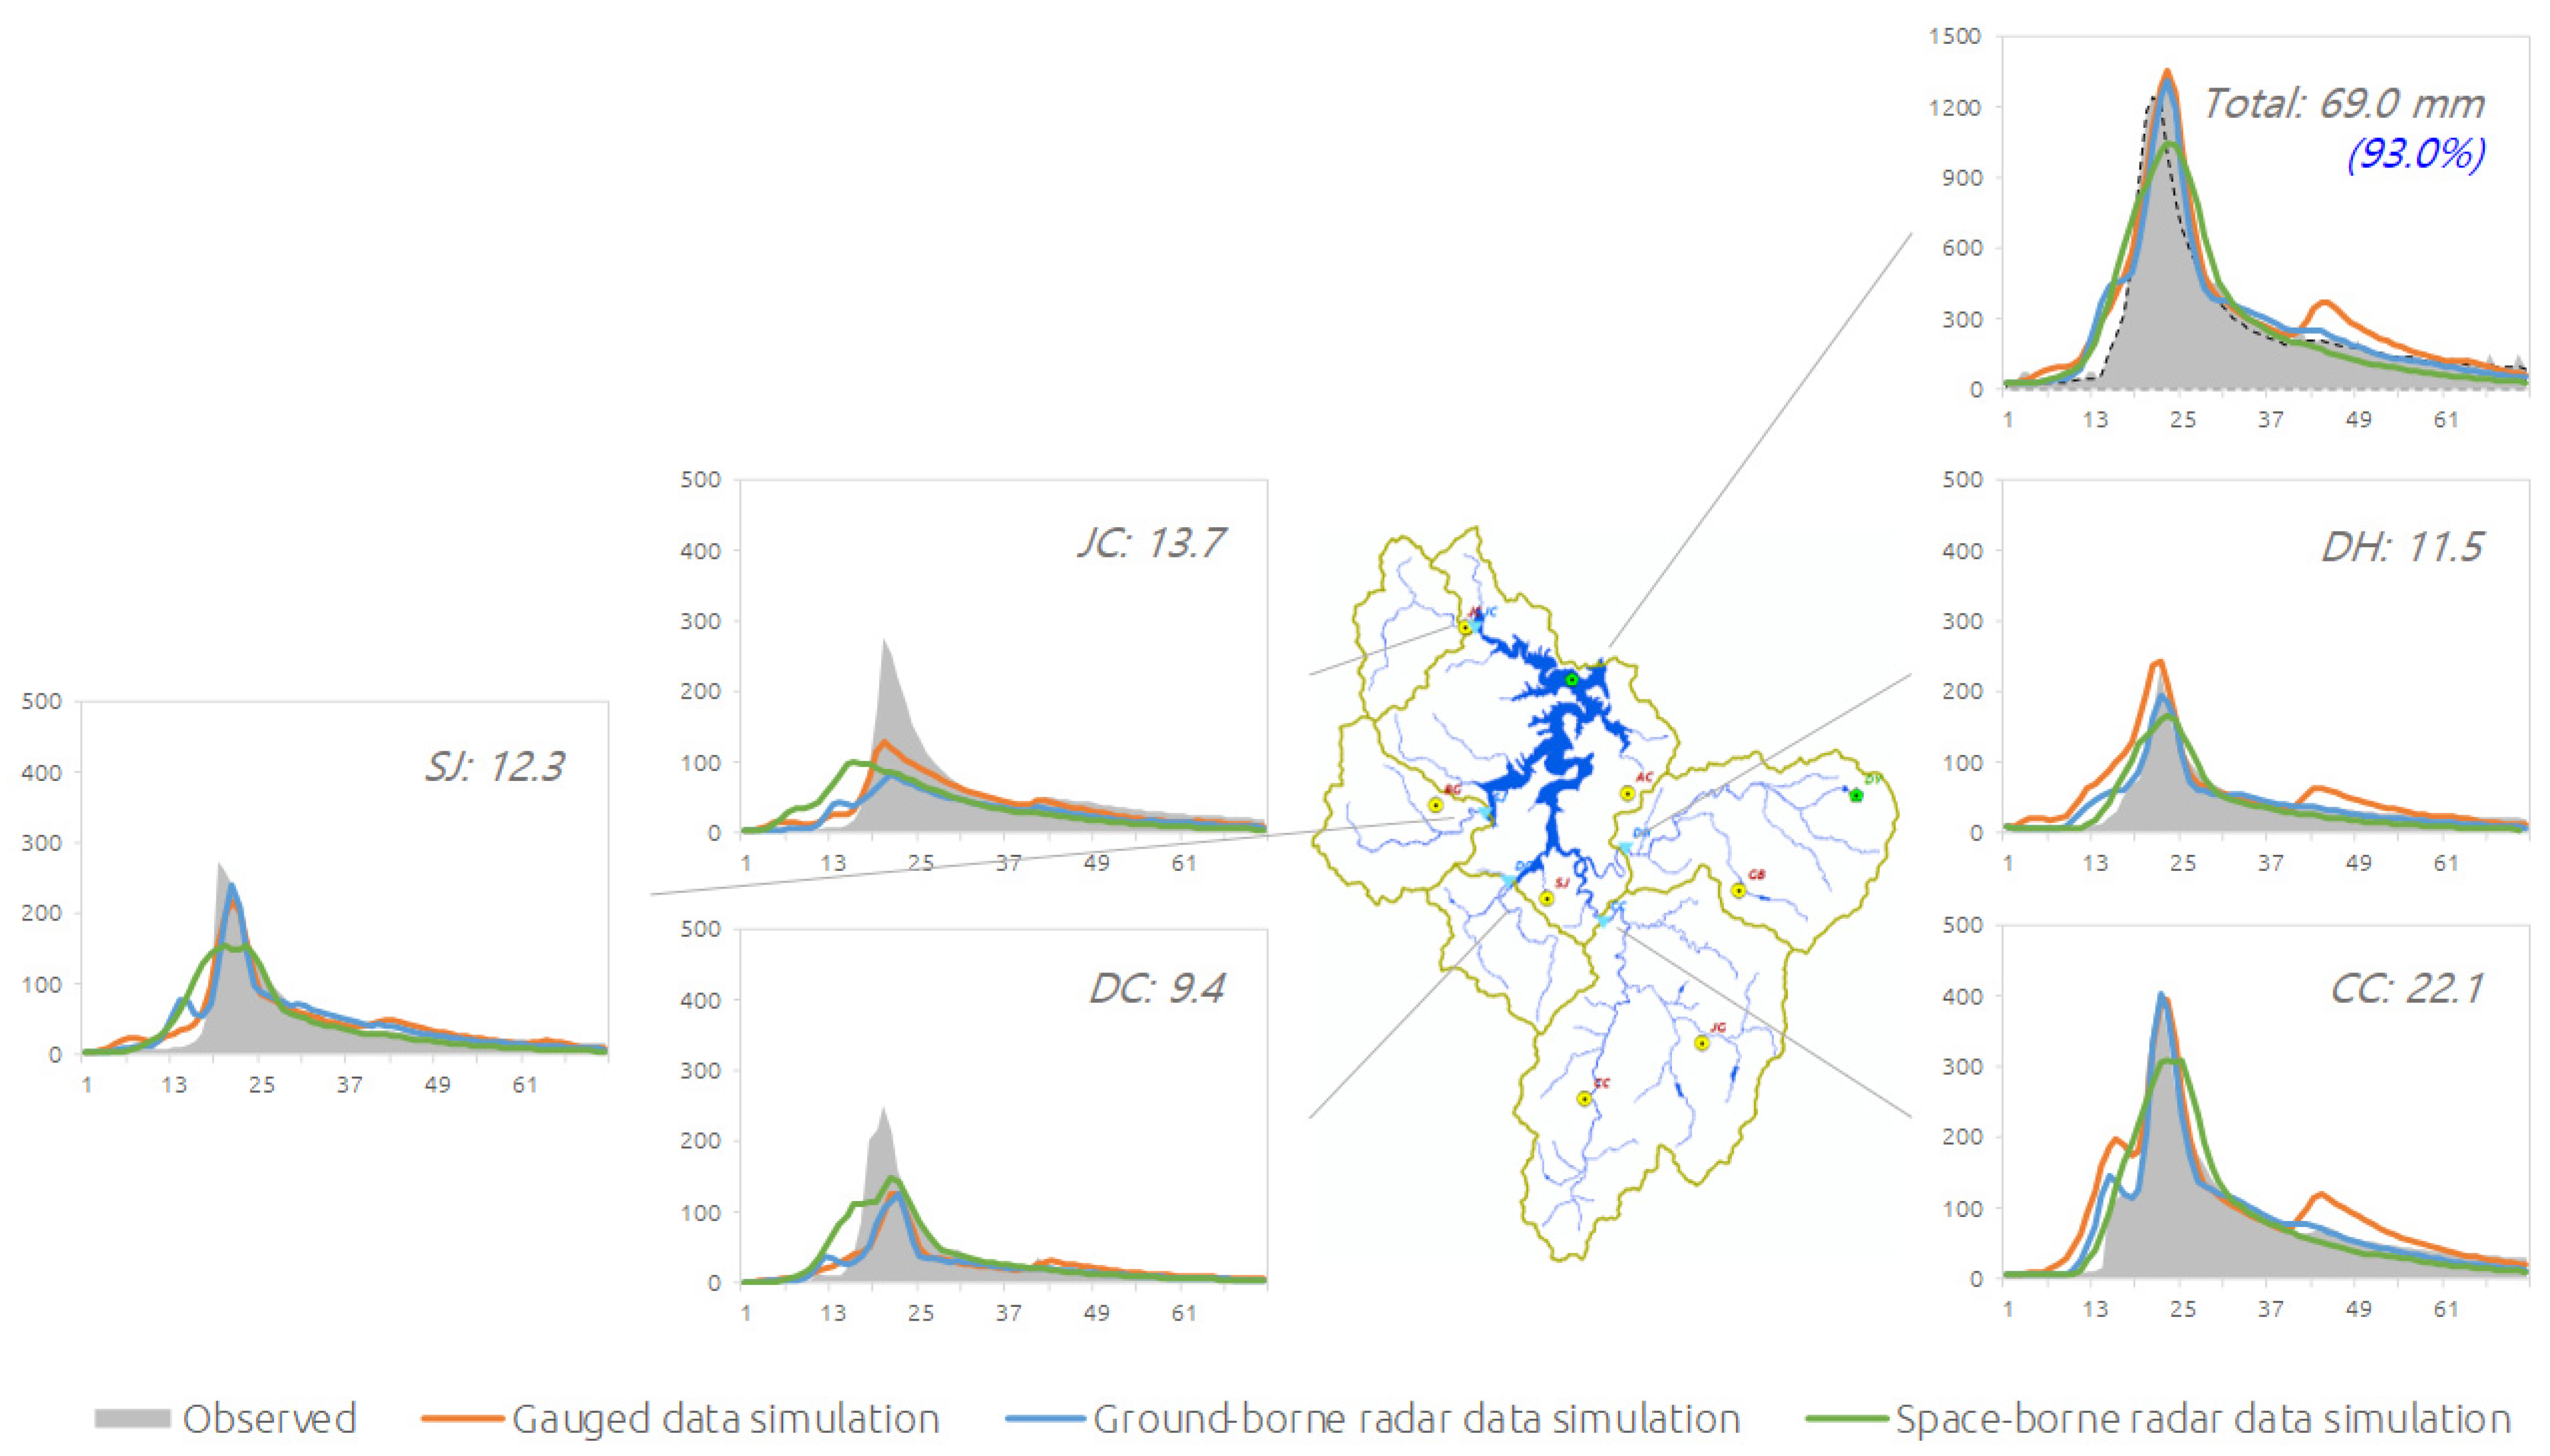
- When comparing the flood simulation results using the conventional method based on rain gauge observations with those using weather radar and satellite-based precipitation data, the models utilizing both radar data sources exhibited an average Nash–Sutcliffe efficiency (ENS) of 0.863 and 0.776, an R2 of 0.873 and 0.787, and a percent bias (PBIAS) of 7.49% and 7.15%, respectively. The model using the areal-averaged values showed an ENS of 0.895, an R2 of 0.906, and a PBIAS of 7.42%. Although there were some differences, simulations using the RAR data demonstrated relatively satisfactory performance without adjusting parameter values, confirming their utility and efficiency;
- (4)
- Despite varying ratios ranging from 26.0% to 82.2% depending on antecedent rainfall conditions, the analysis of the eight selected flood events revealed the characteristic of watershed flood discharge with an average runoff ratio of 52.5%.
Funding
Data Availability Statement
Acknowledgments
Conflicts of Interest
Appendix A

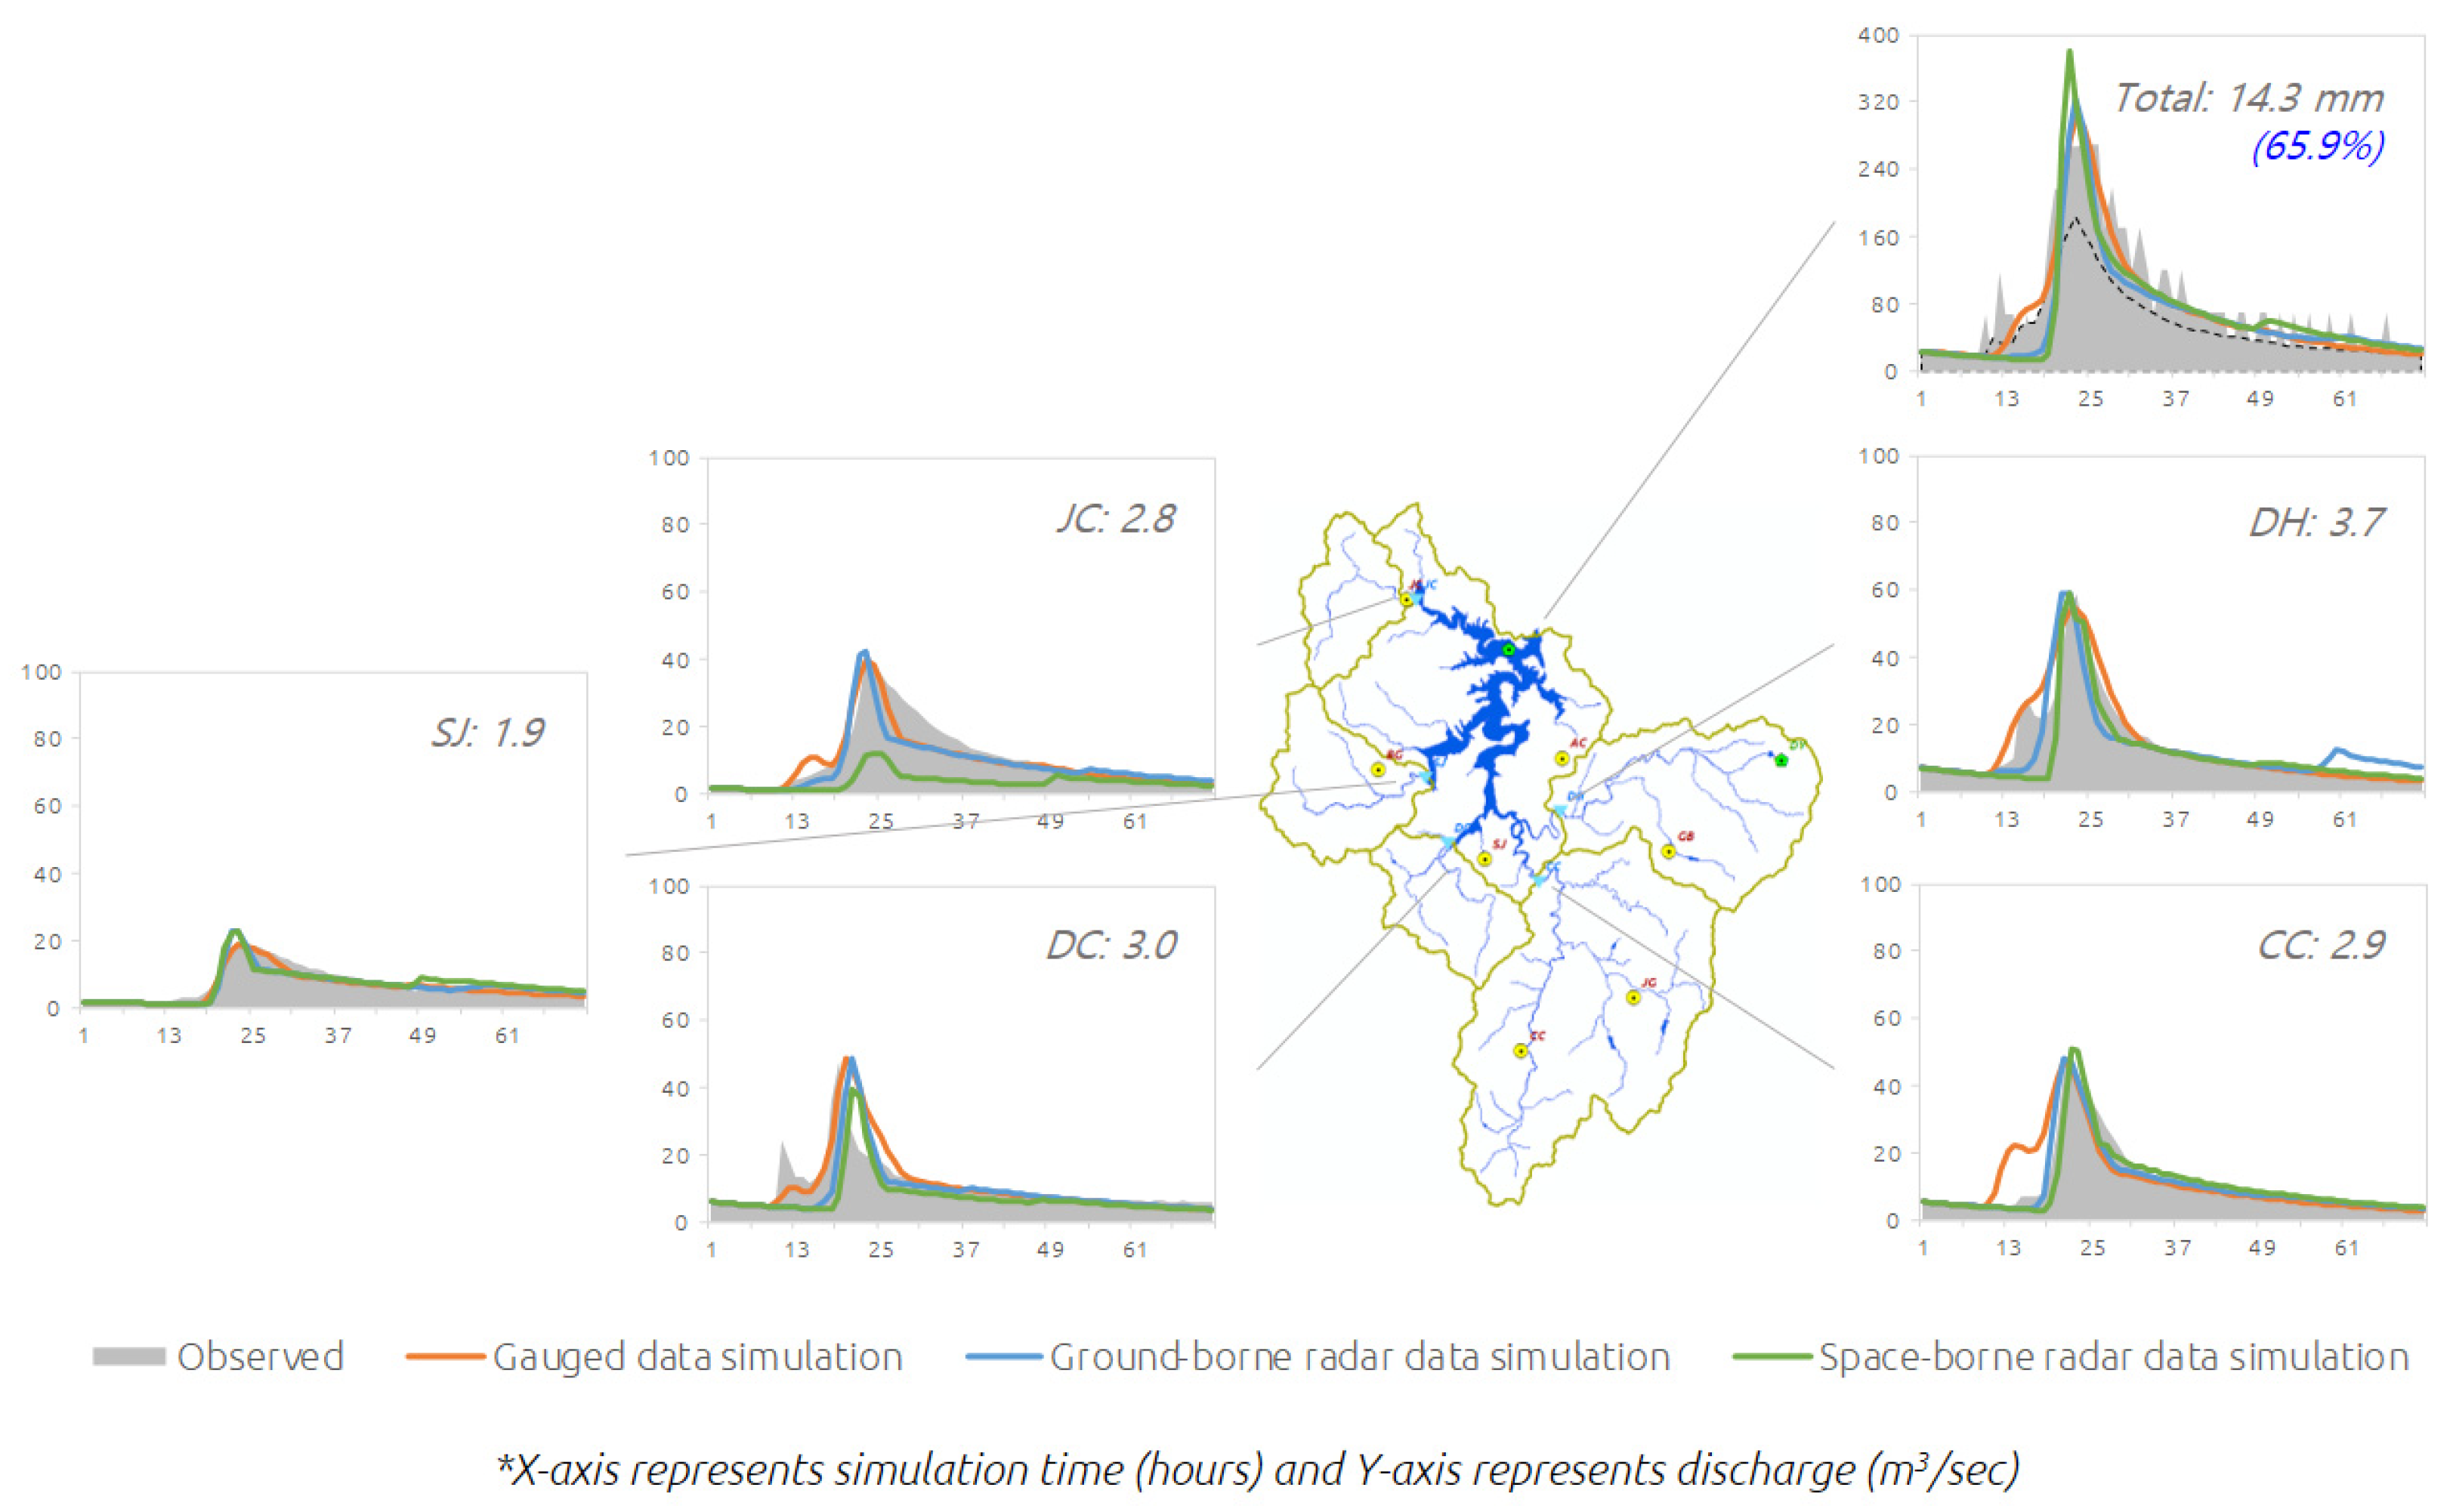
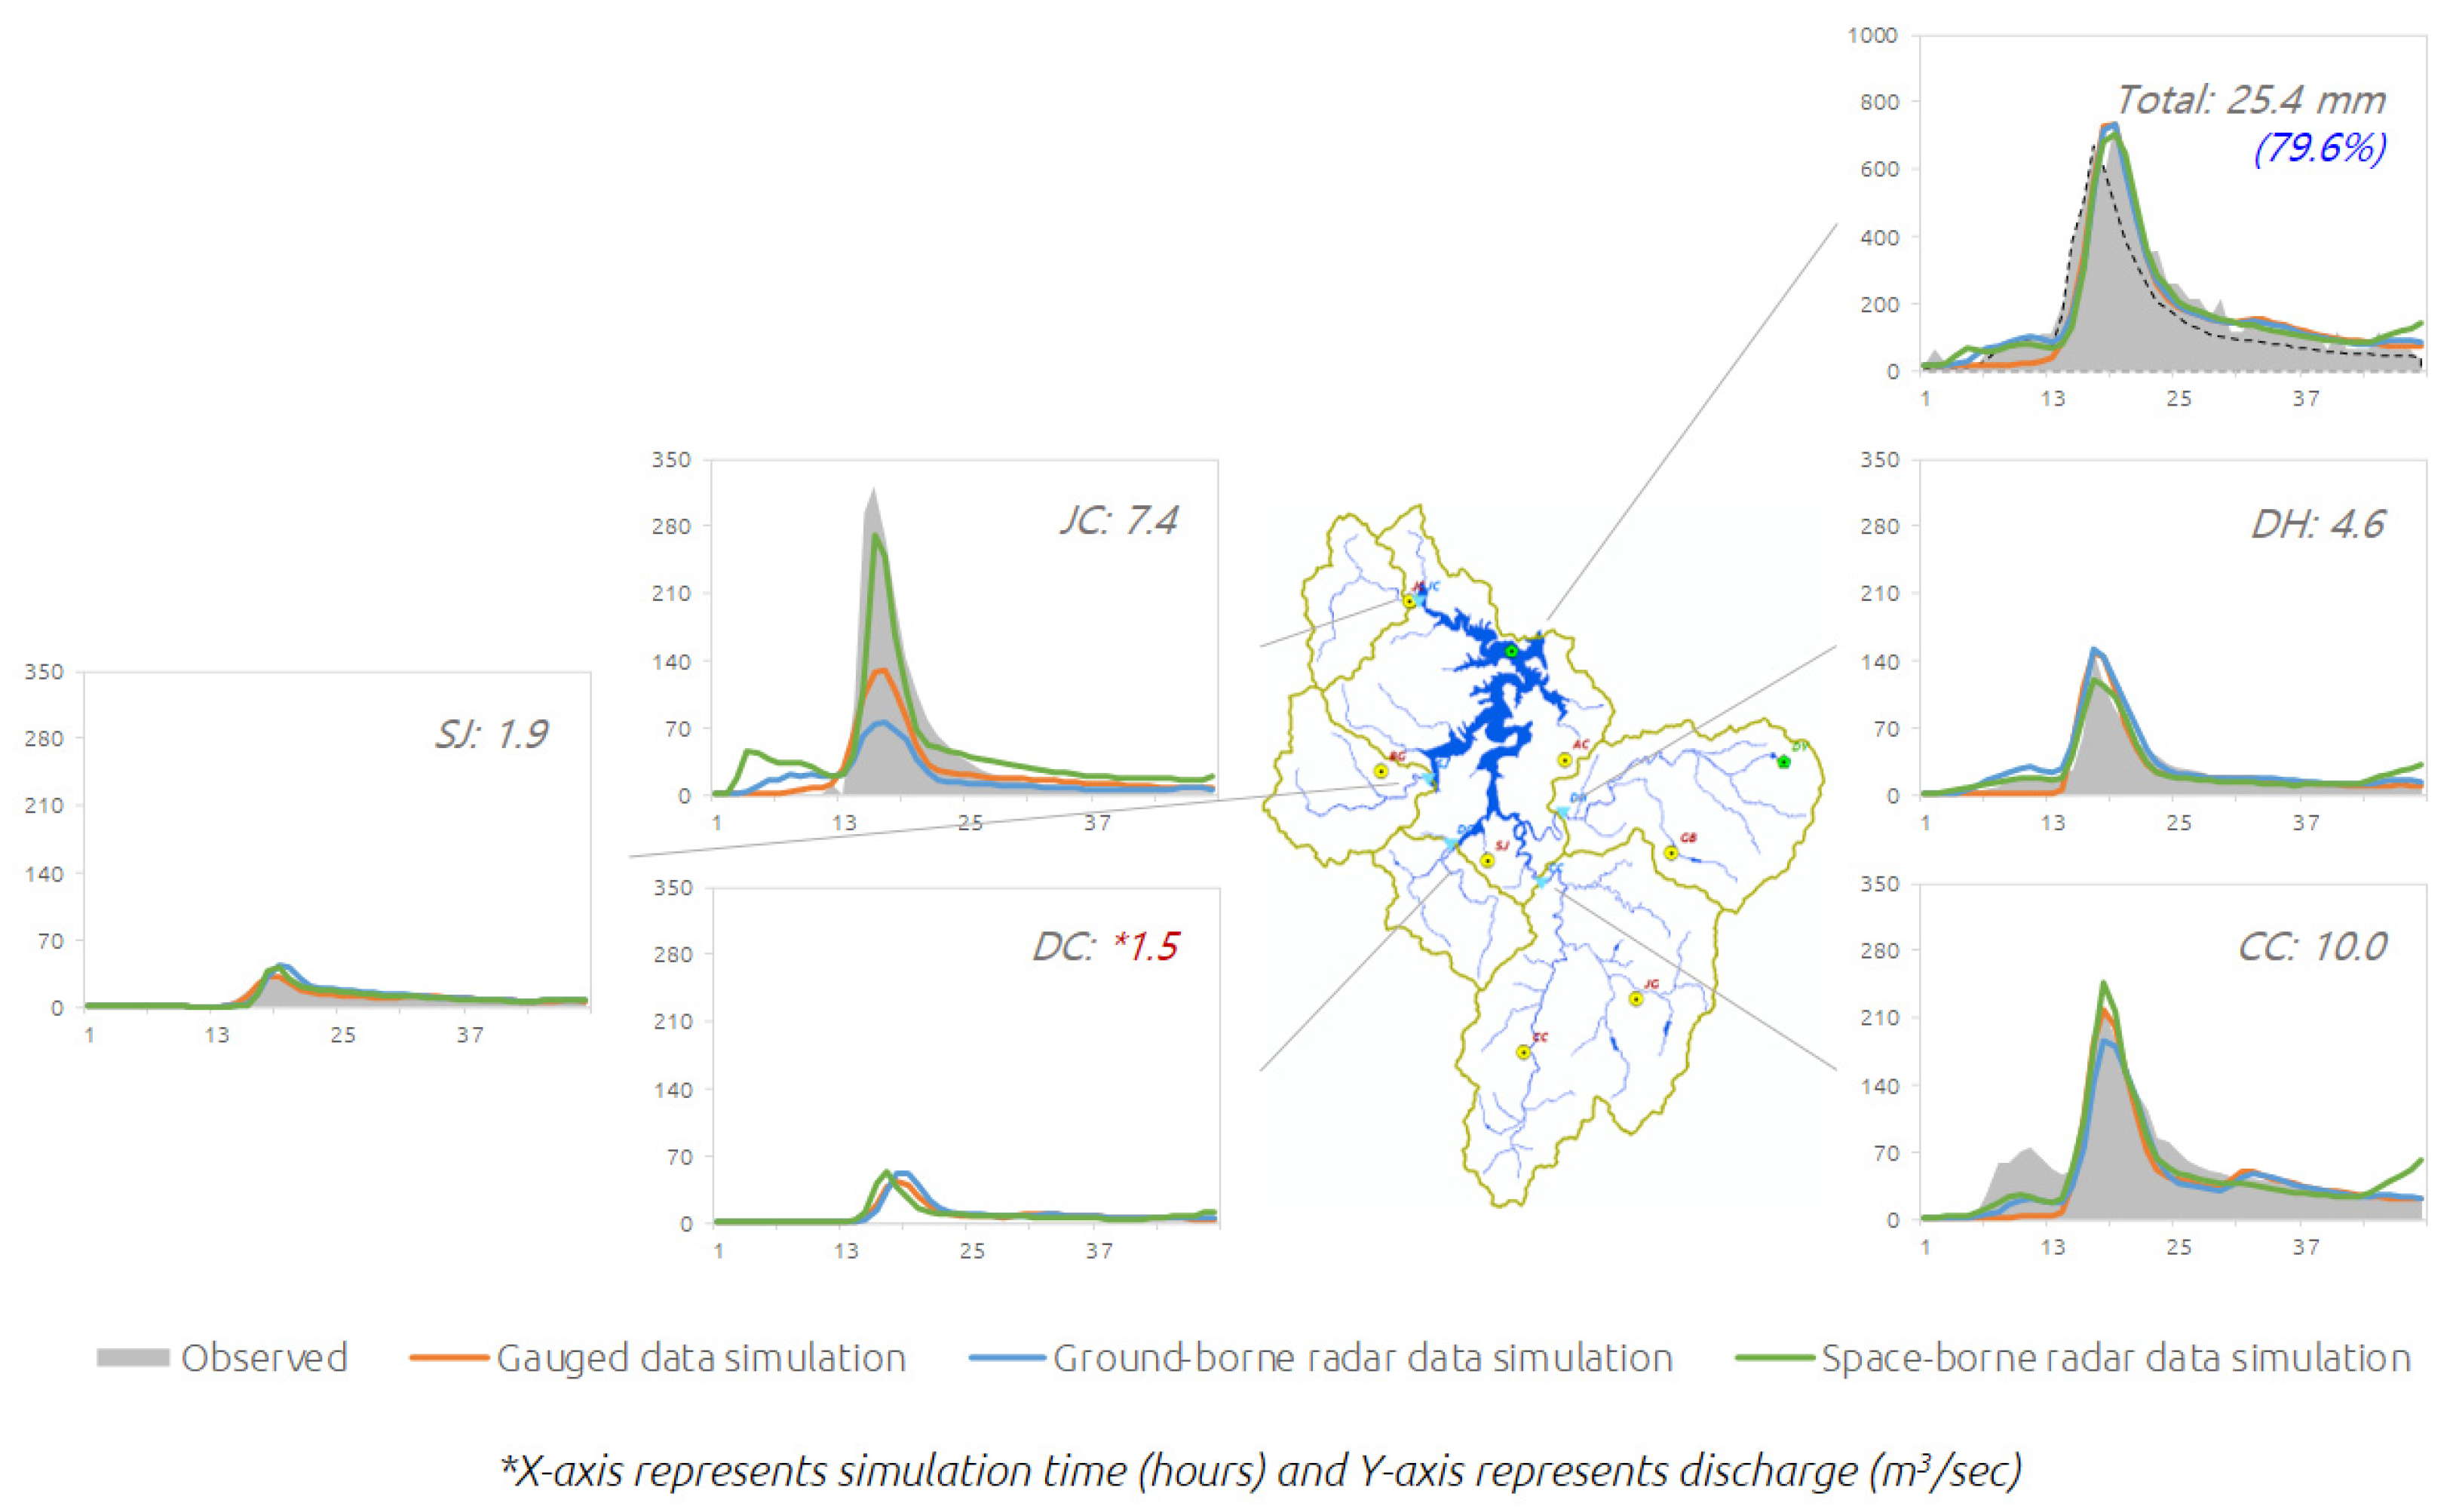
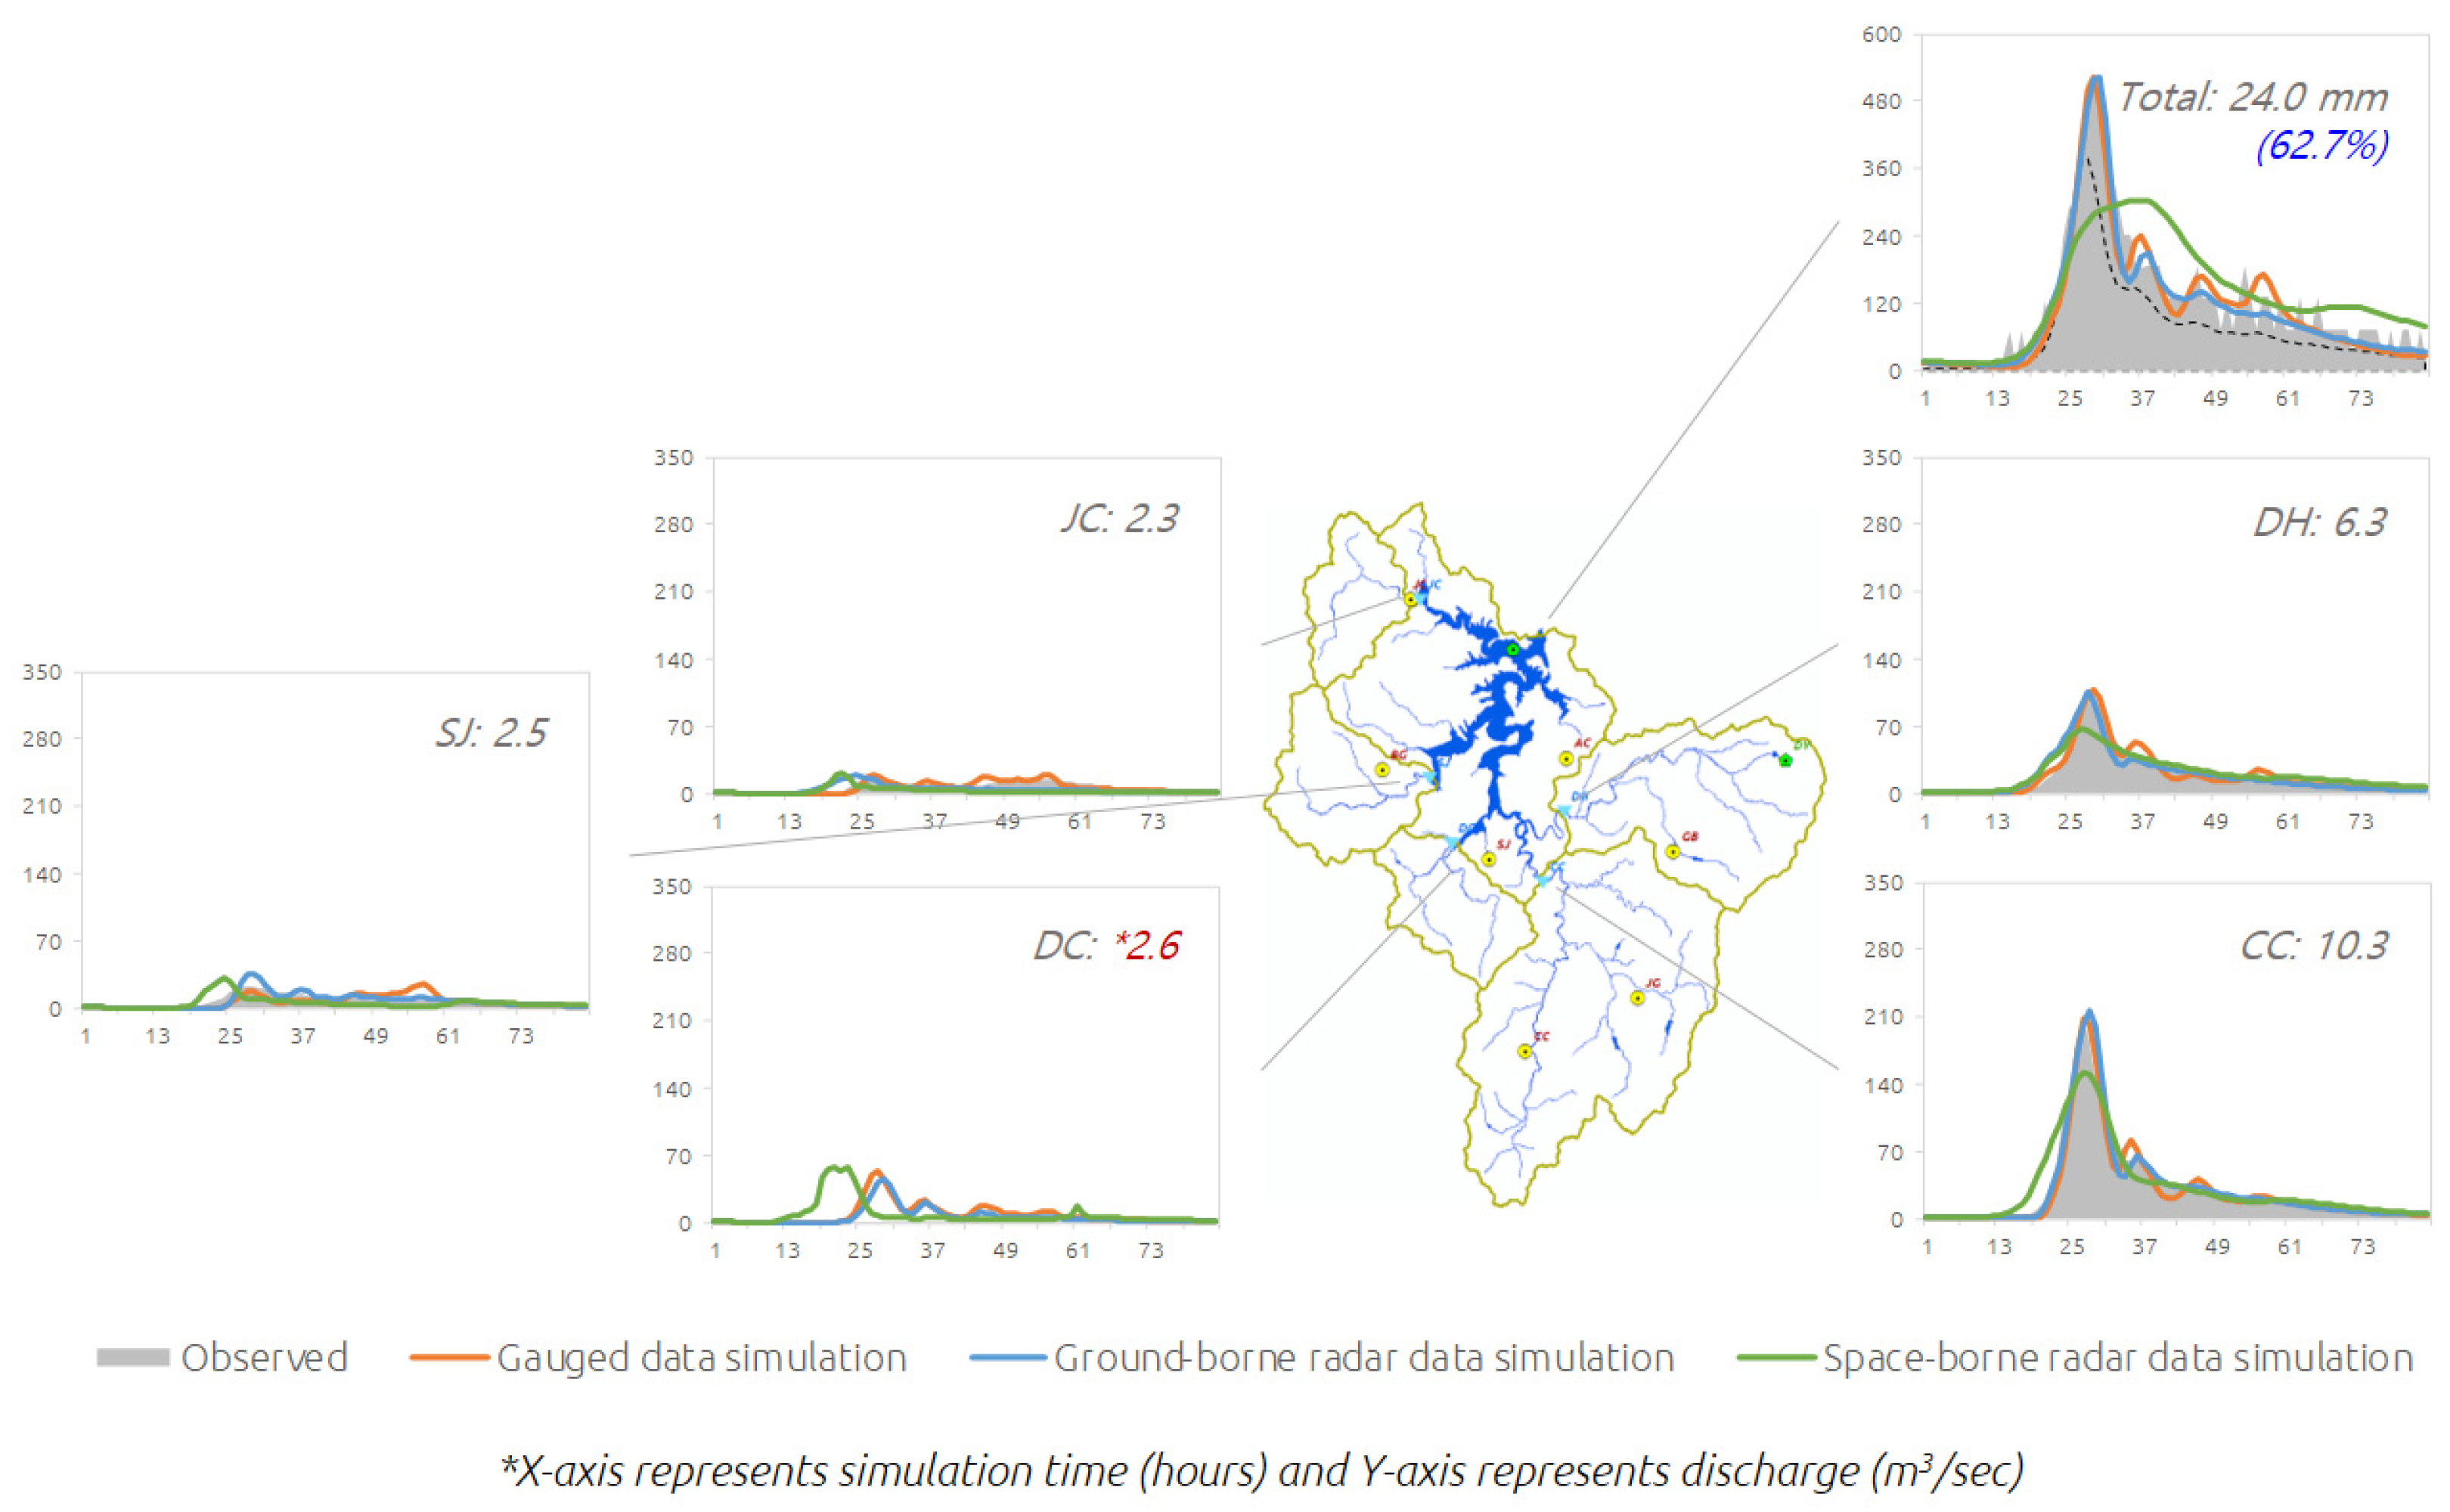

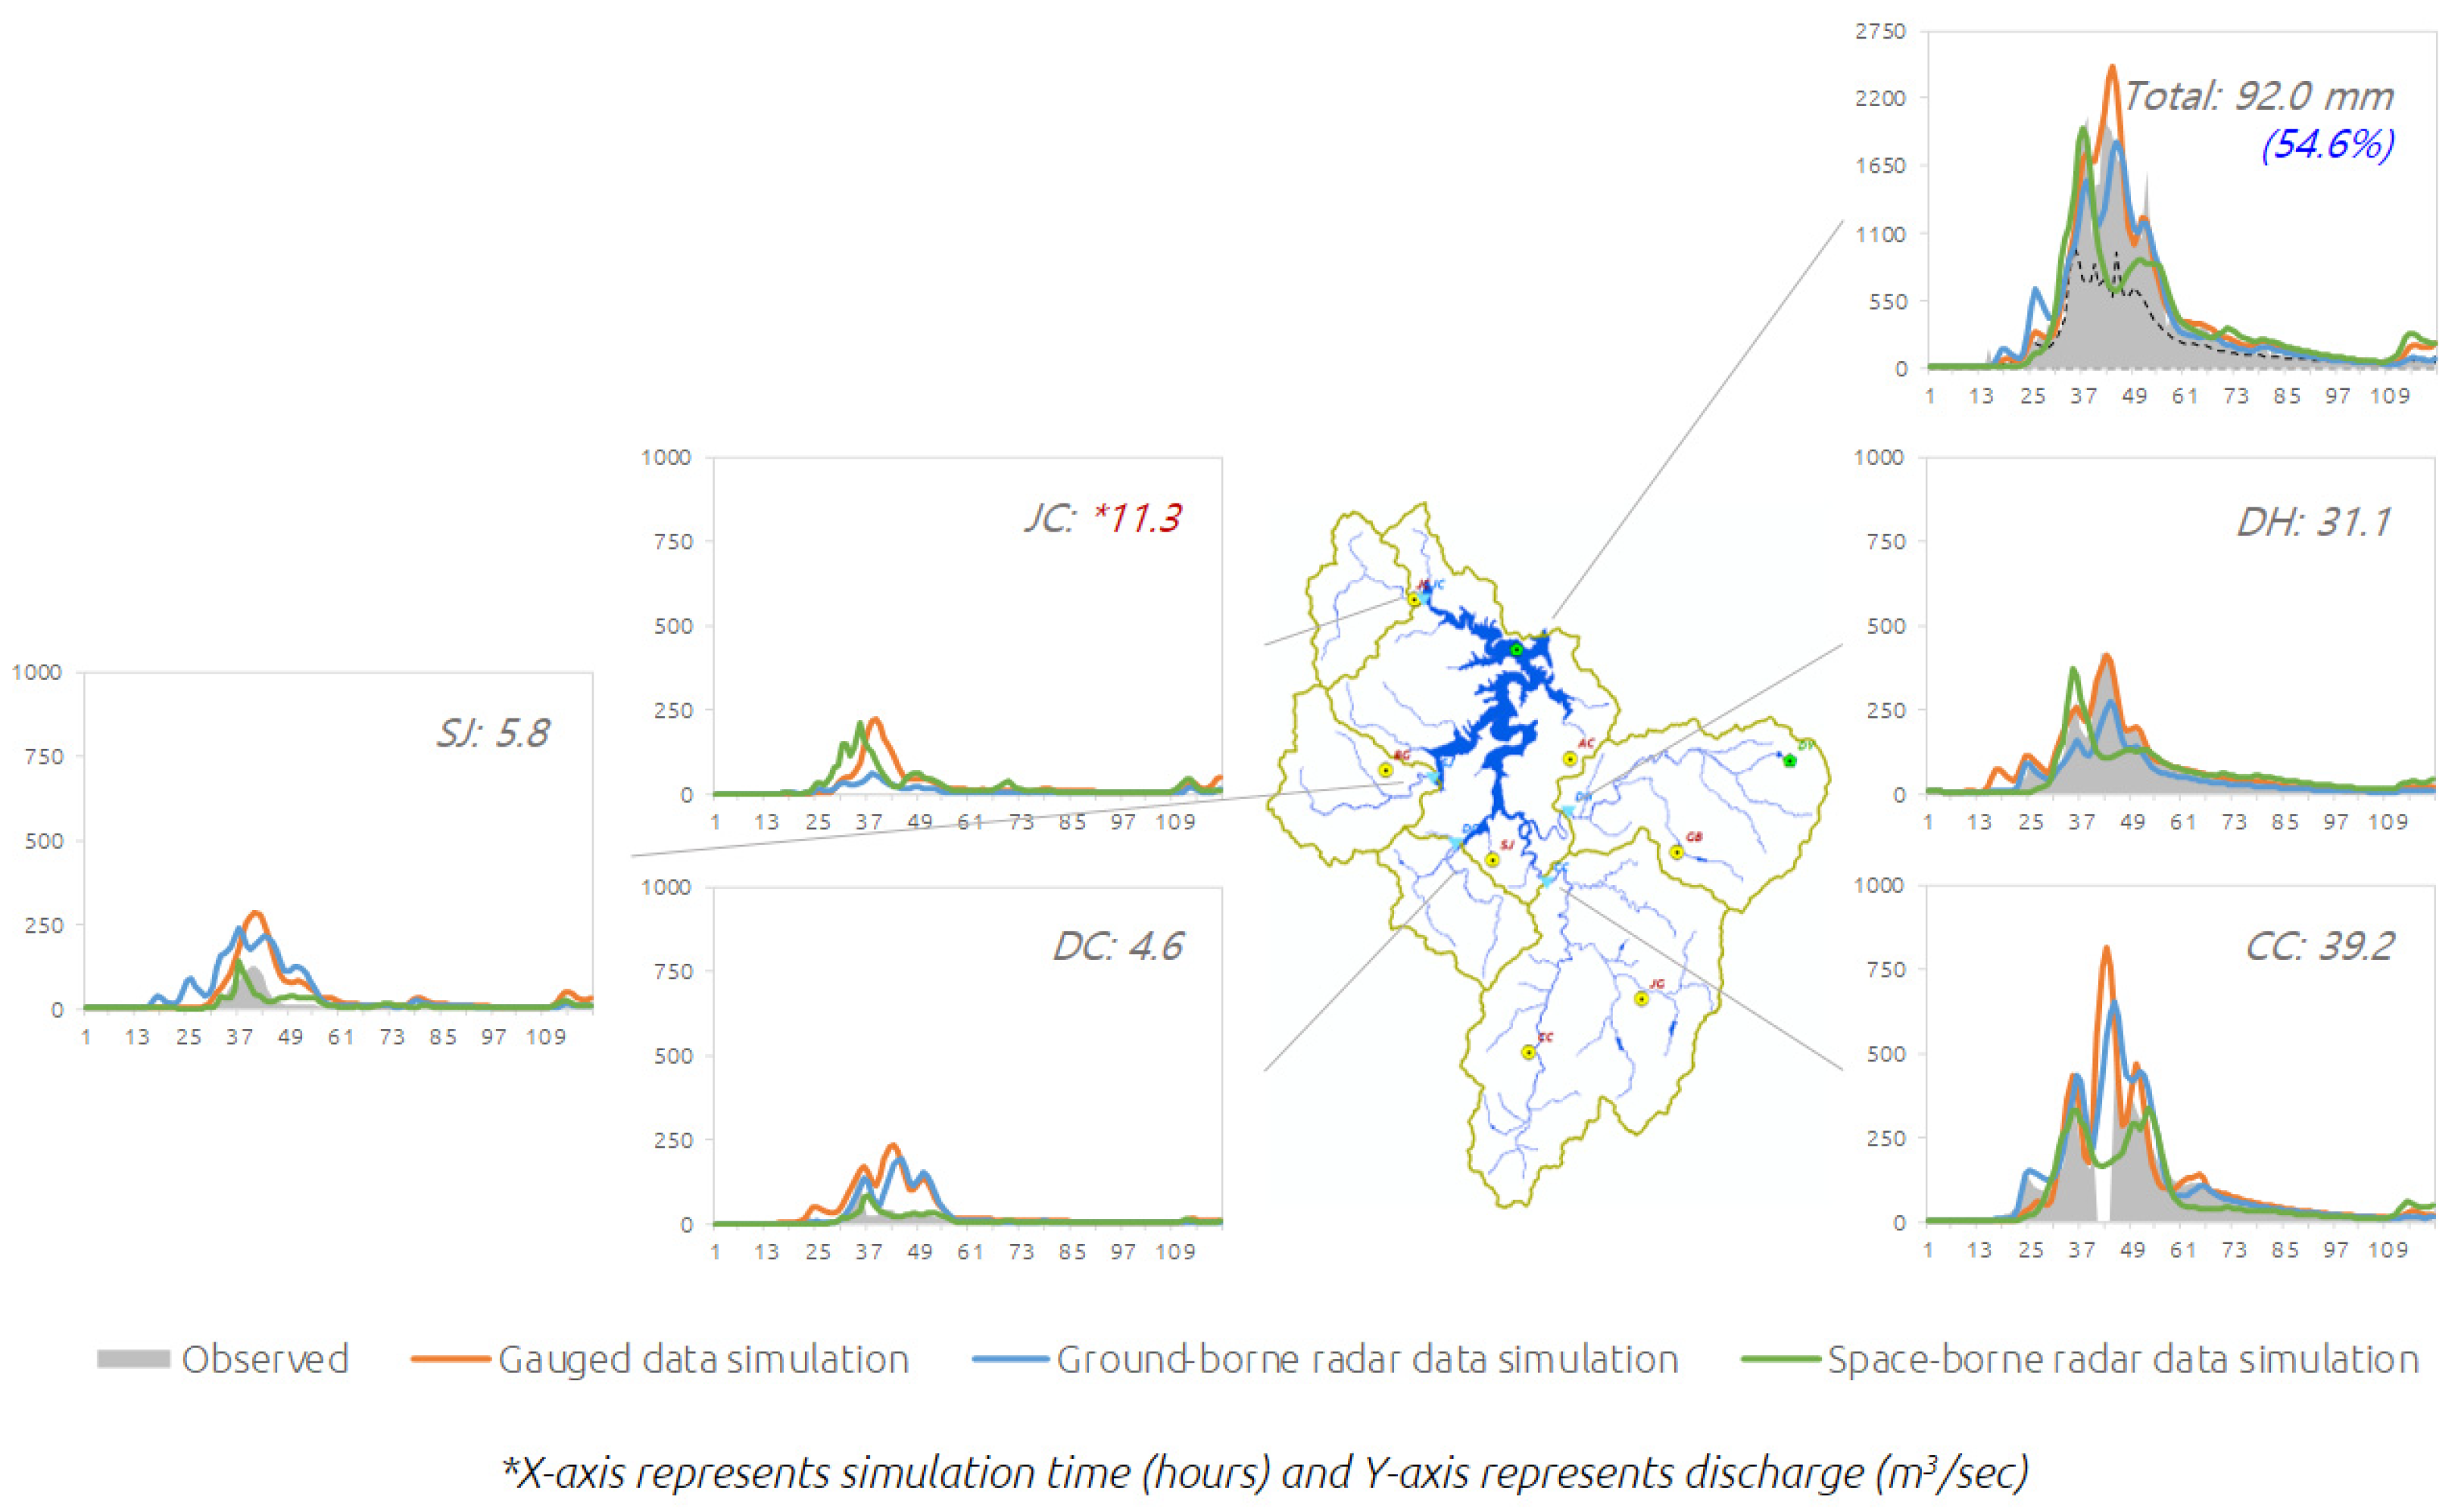

References
- Cho, Y. Application of NEXRAD Radar-Based Quantitative Precipitation Estimations for Hydrologic Simulation Using ArcPy and HEC Software. Water 2020, 12, 273. [Google Scholar] [CrossRef] [Green Version]
- Michaelides, S. Editorial for special issue “remote sensing of precipitation”. Remote Sens. 2019, 11, 389. [Google Scholar] [CrossRef] [Green Version]
- Cho, Y.; Engel, B.A. NEXRAD quantitative precipitation estimations for hydrologic simulation using a hybrid hydrologic model. J. Hydrometeorol. 2017, 18, 25–47. [Google Scholar] [CrossRef]
- Cho, Y.; Engel, B.A. Spatially distributed long-term hydrologic simulation using a continuous SCS CN method-based hybrid hydrologic model. Hydrol. Process. 2018, 32, 904–922. [Google Scholar] [CrossRef]
- Hou, A.Y.; Kakar, R.K.; Neeck, S.; Azarbarzin, A.A.; Kummerow, C.D.; Kojima, M.; Oki, R.; Nakamura, K.; Iguchi, T. The Global Precipitation Measurement Mission. Bull. Amer. Meteor. Soc. 2014, 95, 701–722. [Google Scholar] [CrossRef]
- Skofronick-Jackson, G.; Petersen, W.A.; Berg, W.; Kidd, C.; Stocker, E.F.; Kirschbaum, D.B.; Karar, R.; Braun, S.A.; Huffman, G.J.; Iguchi, T.; et al. The Global Precipitation Measurement (GPM) Mission for Science and Society. Bull. Amer. Meteor. Soc. 2017, 98, 1679–1695. [Google Scholar] [CrossRef]
- Kirschbaum, D.B.; Huffman, G.J.; Adler, R.F.; Braun, S.; Garrett, K.; Jones, E.; McNally, A.; Skofronick-Jackson, G.; Stocker, E.; Wu, H.; et al. NASA’s Remotely Sensed Precipitation, A Reservoir for Applications Users. Bull. Amer. Meteor. Soc. 2017, 98, 1169–1184. [Google Scholar] [CrossRef]
- Huffman, G.J.; Bolvin, D.T.; Braithwaite, D.; Hsu, K.; Joyce, R.; Kidd, C.; Nelkin, E.J.; Sorooshian, S.; Tan, J.; Xie, P. NASA Global Precipitation Measurement (GPM) Integrated Multi-satellitE Retrievals for GPM (IMERG), Algorithm Theoretical Basis Document (ATBD) Version 06. Available online: https://gpm.nasa.gov/sites/default/files/2020-05/IMERG_ATBD_V06.3.pdf (accessed on 3 January 2020).
- Kelley, O. The IMERG Multi-Satellite Precipitation Estimates Reformatted as 2-byte GeoTIFF Files for Display in a Geographic Information System (GIS). Available online: https://pps.gsfc.nasa.gov/Documents/README.GIS.pdf (accessed on 16 March 2022).
- Li, N.; Tang, G.; Zhao, P.; Hong, Y.; Gou, Y.; Yang, K. Statistical assessment and hydrological utility of the latest multi-satellite precipitation analysis IMERG in Ganjiang River basin. Atmos. Res. 2017, 183, 212–223. [Google Scholar] [CrossRef]
- Yuan, F.; Wang, B.; Shi, C.; Cui, W.; Zhao, C.; Liu, Y.; Ren, L.; Zhang, L.; Zhu, Y.; Chen, T.; et al. Evaluation of hydrological utility of IMERG Final run V05 and TMPA 3B42V7 satellite precipitation products in the Yellow River source region, China. J. Hydrol. 2018, 567, 696–711. [Google Scholar] [CrossRef]
- Wang, Z.; Zhong, R.; Lai, C.; Chen, J. Evaluation of the GPM IMERG satellite-based precipitation products and the hydrological utility. Atmos. Res. 2017, 196, 151–163. [Google Scholar] [CrossRef]
- Lu, D.; Yong, B. Evaluation and Hydrological Utility of the Latest GPM IMERG V5 and GSMaP V7 Precipitation Products over the Tibetan Plateau. Remote Sens. 2018, 10, 2022. [Google Scholar] [CrossRef] [Green Version]
- Su, J.; Lu, H.; Zhu, Y.; Cui, Y.; Wang, X. Evaluating the hydrological utility of latest IMERG products over the Upper Huaihe River Basin, China. Atmos. Res. 2019, 225, 17–29. [Google Scholar] [CrossRef]
- Ji, H.; Peng, D.; Gu, Y.; Liang, Y.; Luo, X. Evaluation of multiple satellite precipitation products and their potential utilities in the Yarlung Zangbo River Basin. Sci. Rep. 2022, 12, 13334. [Google Scholar] [CrossRef] [PubMed]
- Li, X.; Chen, Y.; Deng, X.; Zhang, Y.; Chen, L. Evaluation and Hydrological Utility of the GPM IMERG Precipitation Products over the Xinfengjiang River Reservoir Basin, China. Remote Sens. 2021, 13, 866. [Google Scholar] [CrossRef]
- Tang, G.; Zeng, Z.; Long, D.; Guo, X.; Yong, B.; Zhang, W.; Hong, Y. Statistical and Hydrological Comparisons between TRMM and GPM Level-3 Products over a Midlatitude Basin: Is Day-1 IMERG a Good Successor for TMPA 3B42V7? J. Hydrometeor. 2016, 17, 121–137. [Google Scholar] [CrossRef]
- Zubieta, R.; Getirana, A.; Espinoza, J.C.; Lavado-Casimiro, W.; Aragon, L. Hydrological modeling of the Peruvian-Ecuadorian Amazon Basin using GPM-IMERG satellite-based precipitation dataset. Hydrol. Earth Syst. Sci. 2017, 21, 3543–3555. [Google Scholar] [CrossRef] [Green Version]
- He, Z.; Yang, L.; Tian, F.; Ni, G.; Hou, A.; Lu, H. Intercomparisons of Rainfall Estimates from TRMM and GPM Multisatellite Products over the Upper Mekong River Basin. J. Hydrometeor. 2017, 18, 413–430. [Google Scholar] [CrossRef] [Green Version]
- Jiang, S.; Ren, L.; Xu, C.-Y.; Yong, B.; Yuan, F.; Liu, Y.; Yang, X.; Zeng, X. Statistical and hydrological evaluation of the latest Integrated Multi-satellitE Retrievals for GPM (IMERG) over a midlatitude humid basin in South China. Atmos. Res. 2018, 214, 418–429. [Google Scholar] [CrossRef]
- Mohammed, I.N.; Boten, J.D.; Srinivasan, R.; Lakshmi, V. Satellite observations and modeling to understand the Lower Mekong River Basin streamflow variability. J. Hydrol. 2018, 564, 559–573. [Google Scholar] [CrossRef]
- Jiang, L.; Bauer-Gottwein, P. How do GPM IMERG precipitation estimates perform as hydrological model forcing? Evaluation for 300 catchments across Mainland China. J. Hydrol. 2019, 572, 486–500. [Google Scholar] [CrossRef]
- Li, R.; Shi, J.; Ji, D.; Zhao, T.; Plermkamon, V.; Moukomla, S.; Kuntiyawichai, K.; Kruasilp, J. Evaluation and Hydrological Application of TRMM and GPM Precipitation Products in a Tropical Monsoon Basin of Thailand. Water 2019, 11, 818. [Google Scholar] [CrossRef] [Green Version]
- Zhang, Z.; Tian, J.; Huang, Y.; Chen, X.; Chen, S.; Duan, Z. Hydrologic Evaluation of TRMM and GPM IMERG Satellite-Based Precipitation in a Humid Basin of China. Remote Sens. 2019, 11, 431. [Google Scholar] [CrossRef] [Green Version]
- Sharif, H.O.; Al-Zahrani, M.; Hassan, A.E. Physically, Fully-Distributed Hydrologic Simulations Driven by GPM Satellite Rainfall over an Urbanizing Arid Catchment in Saudi Arabia. Water 2017, 9, 163. [Google Scholar] [CrossRef]
- Tam, T.H.; Rahman, M.Z.A.; Harun, S.; Hanapi, M.N.; Kaoje, I.U. Application of Satellite Rainfall Products for Flood Inundation Modelling in Kelantan River Basin, Malaysia. Hydrology 2019, 6, 95. [Google Scholar] [CrossRef] [Green Version]
- Zhou, L.; Rasmy, M.; Takeuchi, K.; Koike, T.; Selvarajah, H. Adequacy of Near Real-Time Satellite Precipitation Products in Driving Flood Discharge Simulation in the Fuji River Basin, Japan. Appl. Sci. 2021, 11, 1087. [Google Scholar] [CrossRef]
- Llauca, H.; Lavado-Casimiro, W.; León, K.; Jimenez, J.; Traverso, K.; Rau, P. Assessing Near Real-Time Satellite Precipitation Products for Flood Simulations at Sub-Daily Scales in a Sparsely Gauged Watershed in Peruvian Andes. Remote Sens. 2021, 13, 826. [Google Scholar] [CrossRef]
- Chancay, J.; Espitia-Sarmiento, E.F. Improving Hourly Precipitation Estimates for Flash Flood Modeling in Data-Scarce Andean-Amazon Basins: An Integrative Framework Based on Machine Learning and Multiple Remotely Sensed Data. Remote Sens. 2021, 13, 4446. [Google Scholar] [CrossRef]
- Yuan, F.; Zhang, L.; Soe, K.M.W.; Ren, L.; Zhao, C.; Zhu, Y.; Jiang, S.; Liu, Y. Applications of TRMM- and GPM-Era Multiple-Satellite Precipitation Products for Flood Simulations at Sub-Daily Scales in a Sparsely Gauged Watershed in Myanmar. Remote Sens. 2019, 11, 140. [Google Scholar] [CrossRef] [Green Version]
- Jiang, S.; Ding, Y.; Liu, R.; Wei, L.; Liu, Y.; Ren, M.; Ren, L. Assessing the Potential of IMERG and TMPA Satellite Precipitation Products for Flood Simulations and Frequency Analyses over a Typical Humid Basin in South China. Remote Sens. 2022, 14, 4406. [Google Scholar] [CrossRef]
- Gilewski, P.; Nawalany, M. Inter-Comparison of Rain-Gauge, Radar, and Satellite (IMERG GPM) Precipitation Estimates Performance for Rainfall-Runoff Modeling in a Mountainous Catchment in Poland. Water 2018, 10, 1665. [Google Scholar] [CrossRef] [Green Version]
- Saouabe, T.; Khaliki, E.M.E.; Saidi, M.E.M.; Najmi, A.; Hadri, A.; Rachidi, S.; Jadoud, M.; Tramblay, Y. Evaluation of the GPM-IMERG Precipitation Product for Flood Modeling in a Semi-Arid Mountainous Basin in Morocco. Water 2020, 12, 2516. [Google Scholar] [CrossRef]
- Benkirane, M.; Amazirh, A.; Laftouhi, N.-E.; Khabba, S.; Chehbouni, A. Assessment of GPM Satellite Precipitation Performance after Bias Correction, for Hydrological Modeling in a Semi-Arid Watershed (High Atlas Mountain, Morocco). Atmosphere 2023, 14, 794. [Google Scholar] [CrossRef]
- Min, X.; Yang, C.; Dong, N. Merging Satellite and Gauge Rainfalls for Flood Forecasting of two Catchments under Different Climate Conditions. Water 2020, 12, 802. [Google Scholar] [CrossRef] [Green Version]
- Tang, X.; Yin, Z.; Qin, G.; Guo, L.; Li, H. Integration of Satellite Precipitation Data and Deep Learning for Improving Flash Flood Simulation in a Poor-Gauged Mountainous Catchment. Remote Sens. 2021, 13, 5083. [Google Scholar] [CrossRef]
- Soo, E.Z.X.; Jaafar, W.Z.W.; Lai, S.H.; Othman, F.; Elshafie, A. Enhancement of Satellite Precipitation Estimations with Bias Correction and Data-Merging Schemes for Flood Forecasting. J. Hydrol. Eng. 2022, 27, 05022009. [Google Scholar] [CrossRef]
- Patel, P.; Thakur, P.K.; Aggarwal, S.P.; Garg, V.; Dhote, P.R.; Nikam, B.R.; Swain, S.; Al-Ansari, N. Revisiting 2013 Uttarakhand flash floods through hydrological evaluation of precipitation data sources and morphometric prioritization. Geomat. Nat. Hazards Risk 2022, 13, 646–666. [Google Scholar] [CrossRef]
- Kim, J.-H.; Ou, M.-L.; Park, J.-D.; Morris, K.R.; Schwaller, M.R.; Wolff, D.B. Global Precipitation Measurement (GPM) Ground Validation (GV) Prototype in the Korean Peninsula. J. Atmos. Ocean. Technol. 2014, 31, 1902–1921. [Google Scholar] [CrossRef]
- Nguyen, G.V.; Le, X.-H.; Van, L.N.; Jung, S.; Yeon, M.; Lee, G. Application of Random Forest Algorithm for Merging Multiple Satellite Precipitation Products across South Korea. Remote Sens. 2021, 13, 4033. [Google Scholar] [CrossRef]
- Kim, K.; Park, J.; Baik, J.; Choi, M. Evaluation of topographical and seasonal feature using GPM IMERG and TRMM 3B42 over Far-East Asia. Atmos. Res. 2017, 187, 95–105. [Google Scholar] [CrossRef]
- Lee, J.; Lee, E.-H.; Seol, K.-H. Validation of Integrated MultisatellitE Retrievals for GPM (IMERG) by using gauge-based analysis products of daily precipitation over East Asia. Theor. Appl. Climatol. 2019, 225, 2497–2512. [Google Scholar] [CrossRef]
- Land Information Platform. Available online: https://map.ngii.go.kr (accessed on 21 July 2023).
- Environmental Geographic Information Service. Available online: https://egis.me.go.kr (accessed on 21 July 2023).
- Korean Soil Information System. Available online: http://soil.rda.go.kr (accessed on 21 July 2023).
- Water Resources Management Information System. Available online: https://wamis.go.kr (accessed on 21 July 2023).
- Korea Meteorological Administration. Improvement of Post-Processing Correction Method for Radar Quantitative Precipitation Estimations and Reproduction of Historical Data; WRC2014-05; KMA Weather Radar Center: Seoul, Republic of Korea, 2014; pp. 1–69. [Google Scholar]
- Zhange, J.; Howard, K.; Langston, C.; Vasiloff, S.; Kaney, B.; Arthur, A.; Cooten, S.V.; Kelleher, K.; Kitzmller, D.; Ding, F.; et al. National mosiaic and multi-sensor QPE (NMQ) system. Bull. Amer. Meteor. Soc. 2011, 92, 1321–1338. [Google Scholar] [CrossRef] [Green Version]
- Lee, J.-K.; Kim, J.-H.; Park, J.-S.; Kim, K.-H. Application of Radar Rainfall Estimates Using the Local Gauge Correction Method to Hydrolgic Model. J. Korean Soc. Hazard Mitig. 2014, 14, 67–78. [Google Scholar] [CrossRef] [Green Version]
- Lee, J.-K.; Lee, M.-H.; Suk, M.-K.; Park, H.-S. Application of the Radar Rainfall Estimates Using the Hybrid Scan Reflectivity Technique to the Hydrologic Model. J. Korea Water Res. Assoc. 2014, 47, 867–878. [Google Scholar] [CrossRef] [Green Version]
- Scharenberg, B.; Bartles, M.; Braurer, T.; Fleming, M.; Karlovits, G. Hydrologic Modeling System HEC-HMS User’s Manual; Version 4.3; U.S. Army Corps of Engineers Institute for Water Resources Hydrologic Engineering Center (CEIWR-HEC): Davis, CA, USA, 2018; pp. 1–624. [Google Scholar]
- Fleming, M.J.; Doan, J.H. HEC-GeoHMS Geospatial Hydrologic Modeling Extension User’s Manual; Version 10.1; U.S. Army Corps of Engineers Institute for Water Resources Hydrologic Engineering Center (HEC): Davis, CA, USA, 2013; pp. 1–193. [Google Scholar]
- Peters, J.C.; Easton, D.J. Runoff simulation using radar rainfall data. Water Resour. Bull. 1996, 32, 753–760. [Google Scholar] [CrossRef]
- Kull, D.W.; Feldman, A.D. Evolution of Clark’s unit graph method to spatially distributed runoff. J. Hydrol. Eng. 1998, 3, 9–19. [Google Scholar] [CrossRef]
- Clark, C.O. Storage and the unit hydrograph. Trans. Am. Soc. Civ. Eng. 1945, 110, 1419–1446. [Google Scholar] [CrossRef]
- Arc Hydro. Available online: https://www.esri.com/en-us/industires/water-resources/arc-hydro (accessed on 21 July 2023).
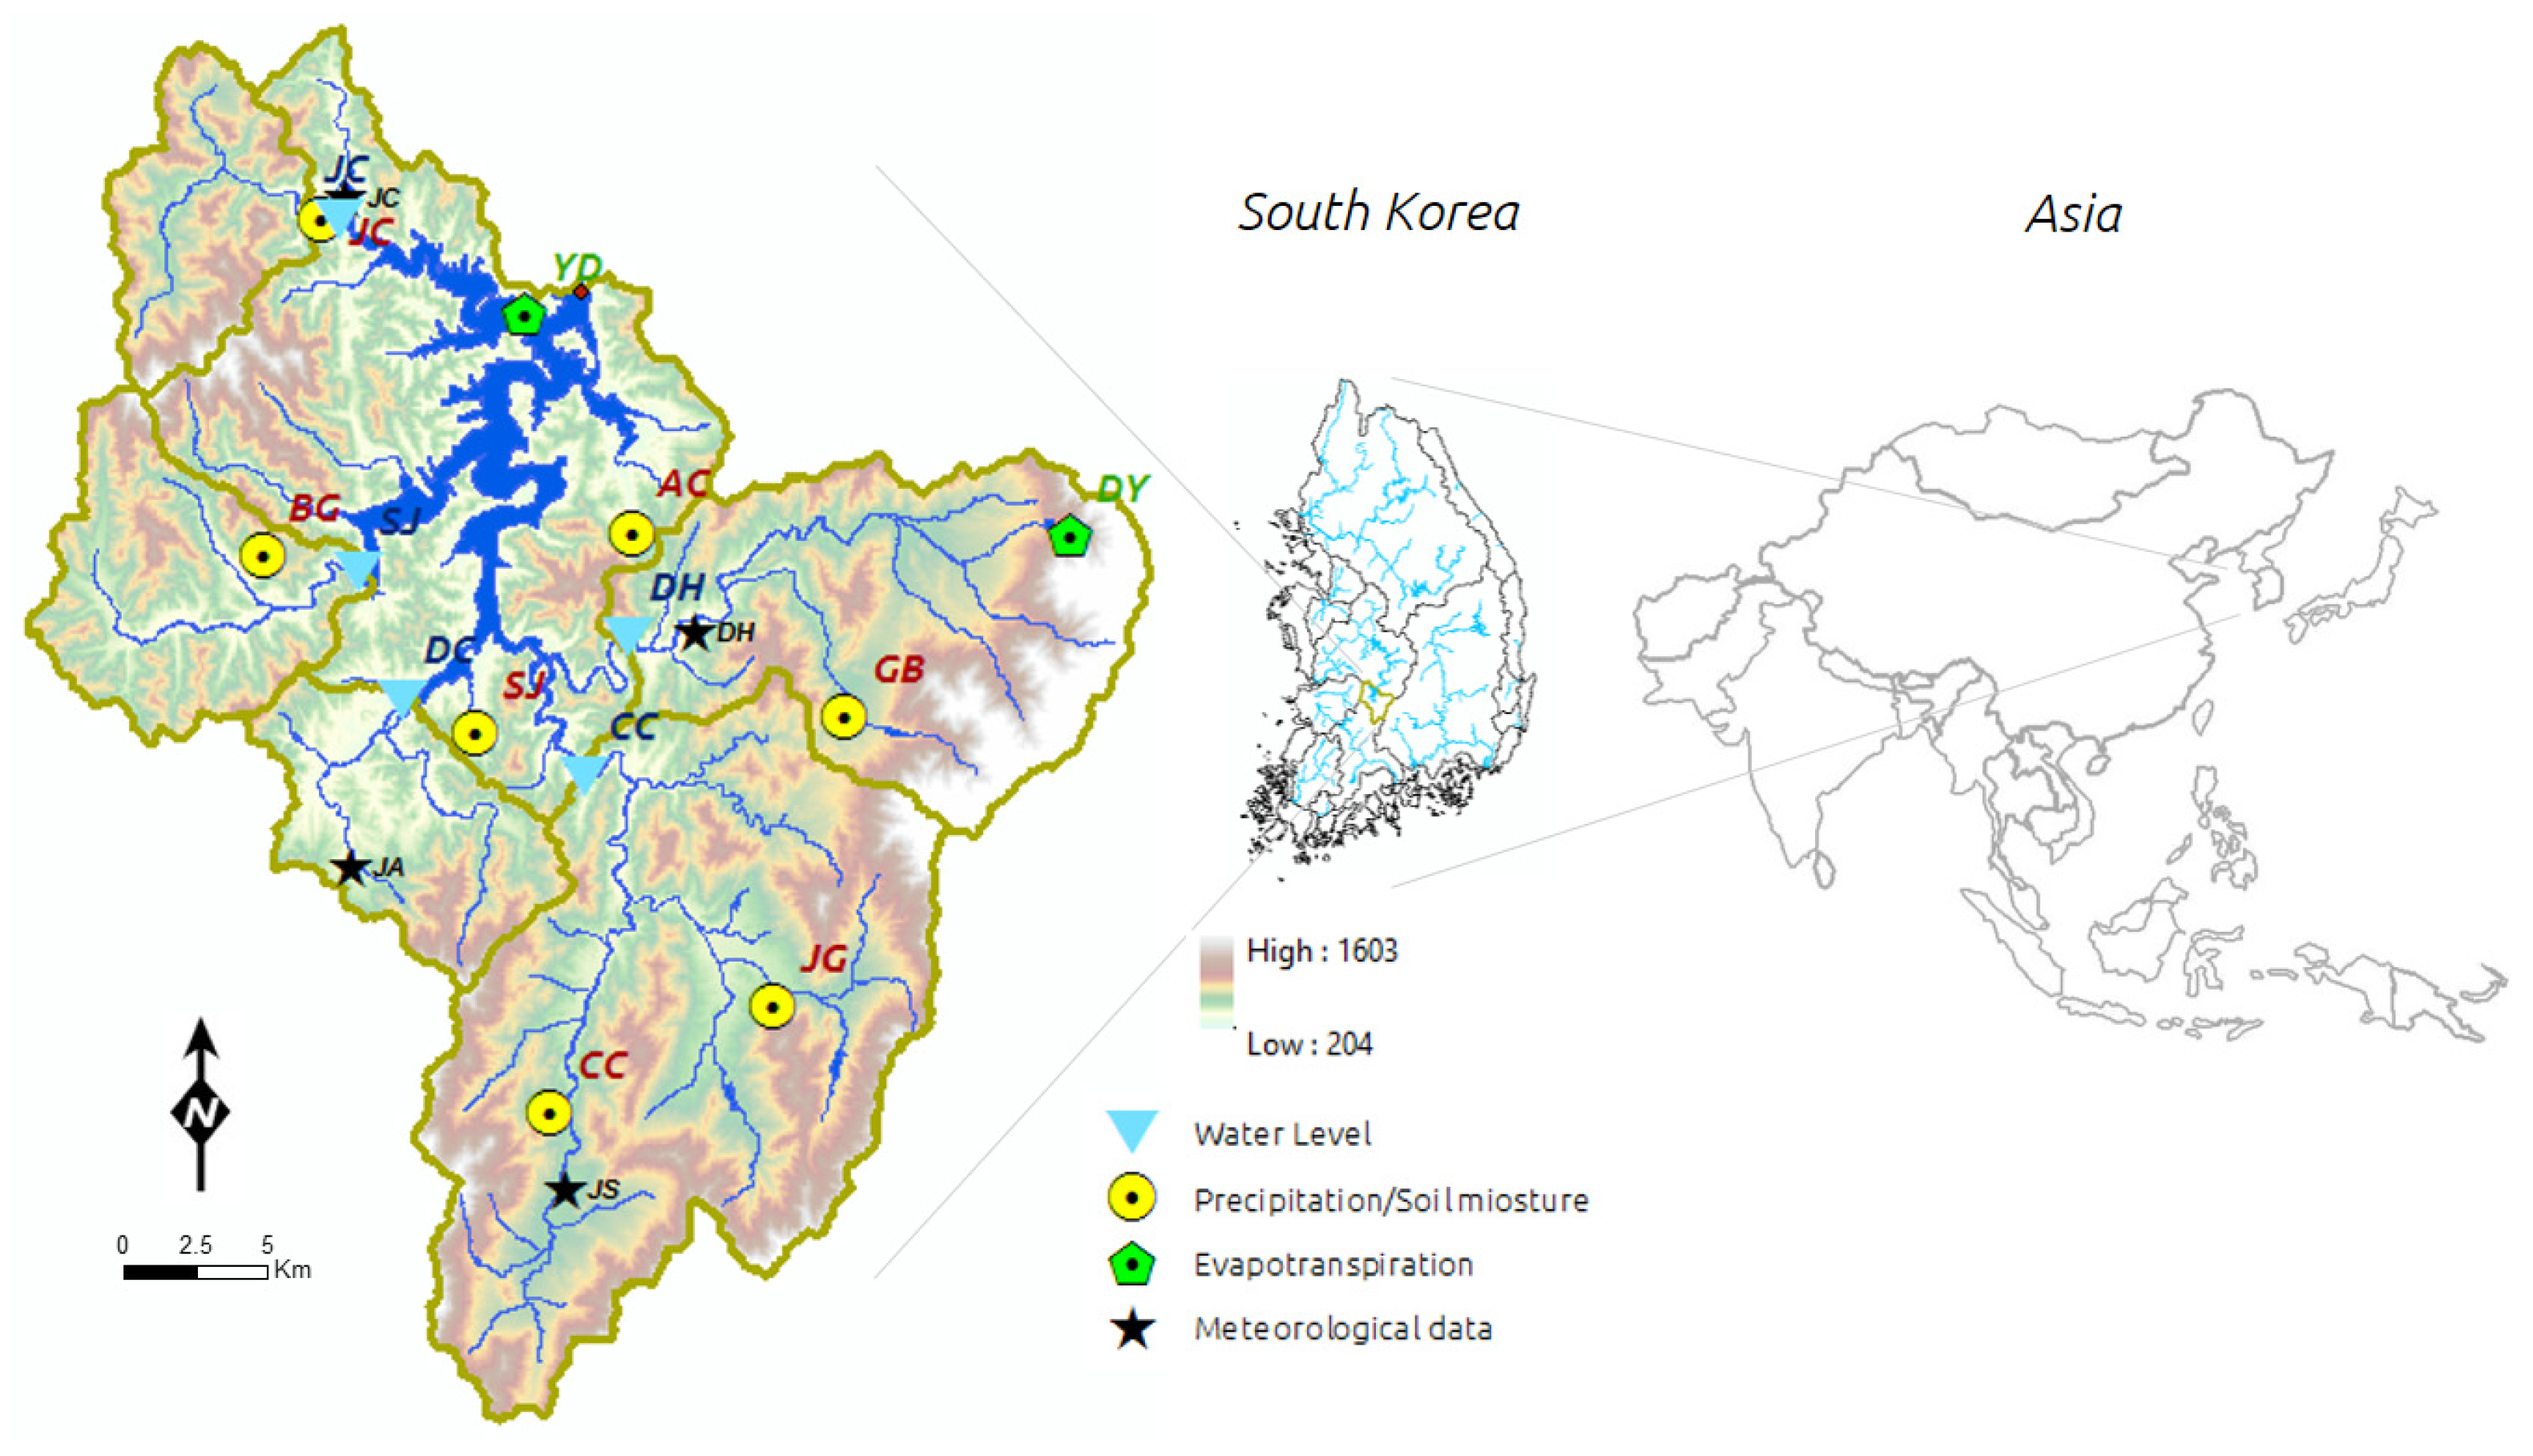


| Type | Station (Abrev.) | Longitude | Latitude | Elevation [MASL 1] |
|---|---|---|---|---|
| Precipitation | Gyebuk (GB) | 127°37′46″ E | 35°48′27″ N | 453.00 |
| Janggye (JG) | 127°36′03″ E | 35°42′54″ N | 422.00 | |
| Cheoncheon (CC) | 127°30′49″ E | 35°40′54″ N | 409.00 | |
| Sangjeon (SJ) | 127°29′10″ E | 35°48′11″ N | 334.00 | |
| Bugwi (BG) | 127°24′12″ E | 35°51′36″ N | 396.00 | |
| Jucheon (JC) | 127°25′34″ E | 35°58′04″ N | 303.00 | |
| Ancheon (AC) | 127°32′48″ E | 35°52′01″ N | 313.00 | |
| Discharge | Yongdam Dam (YD) | 127°31′40″ E | 35°56′36″ N | 268.50 |
| Cheoncheon (CC) | 127°31′38″ E | 35°47′19″ N | 273.50 | |
| Donghyang (DH) | 127°32′41″ E | 35°49′59″ N | 291.50 | |
| Dochi (DC) | 127°27′27″ E | 35°48′43″ N | 261.10 | |
| Seokjeong (SJ) | 127°26′24″ E | 35°51′16″ N | 266.48 | |
| Jucheon (JC) | 127°25′58″ E | 35°58′03″ N | 270.86 |
| RAR Specifications | |||
|---|---|---|---|
| File Name: RDR_ROQCZ_CP15AA_$YYYY$MM$DD$HH$NN.bin.gz | |||
| Resolution | Description | ||
| Temporal | 10 min | ||
| Spatial | 1 km | ||
| Data structure | Description | ||
| Map system | Lambert Conformal Conic projection | ||
| Grid cell size | 1 km | ||
| X and Y dimension | 1241 and 1761 | ||
| Longitude of central meridian | 126.0° E (cell number 460) | ||
| Latitude of the projection origin | 38.0° N (cell number 925) | ||
| Data table structure | |||
| Record | Item | Description | |
| 1 | Precipitation | float | mm/h |
| 2 | Radar coverage | unsigned char | 0: inner/1: outer |
| 3 | Map information | unsigned char | - |
| IMERG Specifications | |
|---|---|
| File Name: 3B-HHR.MS.MRG.3IMERG.$YYYY$MM$DD-S$HH$MM$NN-E$HH$MM$NN.$MMMM.V06B.HDF5.nc4 | |
| Resolution | Description |
| Temporal | 30 min (final run, 3.5 months latency) |
| Spatial | about 10 km (from 90° N–90° S) 60° N–60° S full |
| Data structure | Description |
| Map system | WGS84 |
| Storm Events | Rain Gauge Precipitation Total (mm) | Discharge | |||||||||
|---|---|---|---|---|---|---|---|---|---|---|---|
| # | Period | GB | JG | CC | SJ | BG | JC | AC | Areal Average | Peak (m3/s) | Total (mm) |
| 1 | 17 August 2014 13:00~2014.08.20 12:00 | 97 | 114 | 128 | 100 | 121 | 100 | 101 | 108.3 | 1339.9 | 74.2 |
| 2 | 24 August 2014 01:00~2014.08.28 24:00 | 90 | 71 | 64 | 106 | 57 | 87 | 101 | 82.2 | 906.0 | 67.6 |
| 3 | 8 August 2015 13:00~2015.07.11 12:00 | 51 | 37 | 47 | 77 | 59 | 61 | 69 | 57.3 | 269.7 | 21.7 |
| 4 | 1 July 2016 13:00~2016.07.03 12:00 | 119 | 128 | 153 | 125 | 101 | 124 | 115 | 122.9 | 729.7 | 31.9 |
| 5 | 16 September 2016 13:00~2016.09.19 24:00 | 147 | 129 | 158 | 148 | 134 | 145 | 162 | 146.1 | 517.3 | 38.3 |
| 6 | 10 September 2017 01:00~2017.09.12 24:00 | 69 | 77 | 78 | 73 | 73 | 57 | 78 | 71.8 | 341.4 | 29.7 |
| 7 | 25 August 2018 13:00~2018.08.30 12:00 | 245 | 286 | 331 | 316 | 288 | 269 | 285 | 286.3 | 2192.9 | 168.5 |
| 8 | 30 August 2018 13:00~2018.09.02 12:00 | 84 | 110 | 98 | 84 | 69 | 100 | 61 | 86.0 | 1127.8 | 68.1 |
| Dataset | Data Processing and Program | ||
|---|---|---|---|
| Conversion | Geo-Referencing | DSS File Generation | |
| RAR | Binary to ASCII <NCL script> | Lambert Conformal Conic to SHG grid (Albers Equal-Area) <Python script> | HEC-GridUtil <asc2dssGrid.exe> |
| IMERG | netCDF4 to ASCII 1 | WGS84 to SHG grid (ITRF2000) 1 | |
| Hydrologic Element | Calculation Type | Methods | |
|---|---|---|---|
| Gauged Data Simulation | Radar-Based Data Simulation | ||
| Precipitation | Gauge Weights (Thiessen polygon) | Gridded data (RAR, IMERG) | |
| Subbasin | Runoff-depth | SCS Curve Number (CN) | Gridded SCS CN |
| Direct-runoff (Transform) | Clark Unit Hydrograph (Clark) | Modified Clark Method (ModClark) | |
| Baseflow | Recession | ||
| Reach | Routing | Muskingum | |
| Storm Events | Precipitation Total (mm) | |||||||
|---|---|---|---|---|---|---|---|---|
| # | Period | Gauged Data | Ground-Borne Radar Data | Space-Borne Radar Data | ||||
| Areal Average | Min | Max | Areal Average | Min | Max | Areal Average | ||
| 1 | 17 August 2014 13:00~2014.08.20 12:00 | 108.3 | 64.8 | 146.9 | 88.7 | 96.5 | 174.2 | 134.4 |
| 2 | 24 August 2014 01:00~2014.08.28 24:00 | 82.2 | 37.4 | 100.1 | 58.9 | 80.9 | 113.2 | 99.5 |
| 3 | 8 August 2015 13:00~2015.07.11 12:00 | 57.3 | 16.8 | 65.3 | 38.1 | 9.2 | 81.2 | 39.0 |
| 4 | 1 July 2016 13:00~2016.07.03 12:00 | 122.9 | 12.3 | 183.5 | 96.9 | 116.7 | 152.3 | 138.9 |
| 5 | 16 September 2016 13:00~2016.09.19 24:00 | 146.1 | 15.3 | 145.2 | 101.1 | 91.6 | 121.3 | 102.0 |
| 6 | 10 September 2017 01:00~2017.09.12 24:00 | 71.8 | 5.1 | 77.8 | 50.6 | 32.2 | 56.1 | 42.1 |
| 7 | 25 August 2018 13:00~2018.08.30 12:00 | 286.3 | 22.7 | 305.9 | 198.6 | 128.4 | 218.9 | 189.4 |
| 8 | 30 August 2018 13:00~2018.09.02 12:00 | 86.0 | 4.8 | 113.3 | 56.7 | 50.2 | 110.7 | 71.0 |
| Hydrologic Element | Process | Initial Parameter Values | |
|---|---|---|---|
| Gauged Data Simulation | Radar-based Data Simulation | ||
| Subbasin | Loss | SCS Curve Number (CN) - CN: determined - Initial abstraction (mm): 0 - Impervious (%): 0 | Gridded SCS CN - CN: determined - Ratio: 0.05 - Factor: 1.0 |
| Transform | Clark Unit Hydrograph and ModClark - Time of concentration (HR): determined - Storage coefficient (HR): 2.0 | ||
| Baseflow | Recession - Initial discharge (m3/s): observed - Recession constant: 0.2 - Ratio to peak: 0.4 | ||
| Reach | Routing | Muskingum - Muskingum K (HR): 0.25 - Muskingum X: 0.25 - Number of subreaches: 1 | |
| Storm Events # | Gauged Data Simulation | Ground-Borne Radar Data Simulation | Space-Borne Radar Data Simulation | ||||||
|---|---|---|---|---|---|---|---|---|---|
| ENS | R2 | PBIAS (%) | ENS | R2 | PBIAS (%) | ENS | R2 | PBIAS (%) | |
| 1 | 0.914 | 0.937 | 16.97 | 0.914 | 0.914 | 4.01 | 0.878 | 0.878 | −1.20 |
| 2 | 0.941 | 0.945 | −5.61 | 0.919 | 0.925 | 9.54 | 0.842 | 0.843 | −3.14 |
| 3 | 0.844 | 0.853 | −9.05 | 0.716 | 0.752 | −18.06 | 0.663 | 0.697 | −13.90 |
| 4 | 0.920 | 0.928 | −7.35 | 0.921 | 0.920 | −2.57 | 0.906 | 0.905 | −0.99 |
| 5 | 0.893 | 0.902 | −6.69 | 0.912 | 0.921 | −7.28 | 0.611 | 0.629 | 14.35 |
| 6 | 0.800 | 0.812 | 0.38 | 0.763 | 0.765 | −0.63 | 0.773 | 0.790 | 9.05 |
| 7 | 0.930 | 0.948 | 11.87 | 0.895 | 0.896 | −0.18 | 0.670 | 0.673 | −7.34 |
| 8 | 0.921 | 0.925 | 1.43 | 0.865 | 0.891 | −17.64 | 0.861 | 0.878 | −7.19 |
| Avg. * | 0.895 | 0.906 | 7.42 | 0.863 | 0.873 | 7.49 | 0.776 | 0.787 | 7.15 |
| Storm Events # | Gauged Data Simulation | Ground-Borne Radar Data Simulation | Space-Borne Radar Data Simulation | ||||||||||||
|---|---|---|---|---|---|---|---|---|---|---|---|---|---|---|---|
| CC | DH | DC | SJ | JC | CC | DH | DC | SJ | JC | CC | DH | DC | SJ | JC | |
| 1 | 0.81 | 0.55 | 0.61 | 0.88 | 0.68 | 0.93 | 0.90 | 0.60 | 0.80 | 0.35 | 0.88 | 0.82 | 0.73 | 0.69 | 0.27 |
| 2 | 0.92 | 0.92 | 0.71 | 0.88 | 0.38 | 0.93 | 0.92 | 0.66 | 0.48 | 0.40 | 0.71 | 0.70 | 0.65 | 0.89 | 0.44 |
| 3 | 0.66 | 0.93 | 0.51 | 0.92 | 0.85 | 0.93 | 0.73 | 0.15 | 0.80 | 0.74 | 0.89 | 0.75 | −0.1 | 0.74 | −0.14 |
| 4 | 0.74 | 0.81 | N/A * | 0.86 | 0.60 | 0.81 | 0.85 | N/A * | 0.76 | 0.31 | 0.83 | 0.89 | N/A * | 0.77 | 0.79 |
| 5 | 0.95 | 0.95 | N/A * | 0.08 | 0.65 * | 0.96 | 0.90 | N/A * | 0.61 | −0.42 * | 0.91 | 0.85 | N/A * | −0.28 | −1.18 * |
| 6 | 0.86 | 0.91 | 0.82 | N/A * | 0.94 | 0.96 | 0.95 | 0.86 | N/A * | 0.86 | 0.95 | 0.90 | 0.61 | N/A * | 0.79 |
| 7 | −0.74 * | 0.95 | −4.58 * | −2.02 * | N/A * | −0.08 * | 0.79 | −2.89 * | −3.09 * | N/A * | 0.64 * | 0.49 | 0.40 * | 0.57 * | N/A * |
| 8 | 0.85 | 0.94 | −1.19 * | 0.97 | N/A * | 0.94 | 0.83 | −1.46 * | 0.96 | N/A * | 0.74 | 0.94 | 0.60 * | 0.86 | N/A * |
| Avg. | 0.83 | 0.87 | 0.66 | 0.77 | 0.69 | 0.92 | 0.86 | 0.57 | 0.74 | 0.53 | 0.83 | 0.79 | 0.47 | 0.61 | 0.43 |
Disclaimer/Publisher’s Note: The statements, opinions and data contained in all publications are solely those of the individual author(s) and contributor(s) and not of MDPI and/or the editor(s). MDPI and/or the editor(s) disclaim responsibility for any injury to people or property resulting from any ideas, methods, instructions or products referred to in the content. |
© 2023 by the author. Licensee MDPI, Basel, Switzerland. This article is an open access article distributed under the terms and conditions of the Creative Commons Attribution (CC BY) license (https://creativecommons.org/licenses/by/4.0/).
Share and Cite
Cho, Y. Comparative Application of Rain Gauge, Ground- and Space-Borne Radar Precipitation Products for Flood Simulations in a Dam Watershed in South Korea. Water 2023, 15, 2898. https://doi.org/10.3390/w15162898
Cho Y. Comparative Application of Rain Gauge, Ground- and Space-Borne Radar Precipitation Products for Flood Simulations in a Dam Watershed in South Korea. Water. 2023; 15(16):2898. https://doi.org/10.3390/w15162898
Chicago/Turabian StyleCho, Younghyun. 2023. "Comparative Application of Rain Gauge, Ground- and Space-Borne Radar Precipitation Products for Flood Simulations in a Dam Watershed in South Korea" Water 15, no. 16: 2898. https://doi.org/10.3390/w15162898
APA StyleCho, Y. (2023). Comparative Application of Rain Gauge, Ground- and Space-Borne Radar Precipitation Products for Flood Simulations in a Dam Watershed in South Korea. Water, 15(16), 2898. https://doi.org/10.3390/w15162898


