Article

Temporal Analysis of Water Quality for the Nilo Coelho Reservoir, Terra Nova, Pernambuco, Brazil

1
Center for Philosophy and Human Sciences, Department of Geographical Sciences, Federal University of Pernambuco, Recife 50670-901, Brazil
2
Department of Education, Bahia State University, Paulo Afonso, Salvador 41180-045, Brazil
3
Center for Technology and Geosciences, Department of Civil Engineering, Federal University of Pernambuco, Recife 50740-550, Brazil
*
Author to whom correspondence should be addressed.
Water 2023, 15(16), 2899; https://doi.org/10.3390/w15162899
Submission received: 18 July 2023 / Revised: 6 August 2023 / Accepted: 8 August 2023 / Published: 11 August 2023
(This article belongs to the Section Hydrology)

Abstract

:
The Brazilian northeast has a characteristic relationship with water resources because, in this region, water scarcity is associated with natural factors and accentuated by anthropic actions that interfere with water quality. The present work aimed to perform a temporal analysis of the water quality of the Nilo Coelho reservoir, municipality of Terra Nova, a semi-arid region of Pernambuco. Initially, the parameters of dissolved oxygen, nitrate, and phosphorus, available in the system of hydrological response units for Pernambuco (SUPer), following the resolution of the National Environment Council (CONAMA), for the years 1963–2021, were analyzed. Subsequently, land use and occupation mapping were carried out to identify the activities that developed in the region. The result of the analysis of water quality for the Nilo Coelho reservoir classifies it as little compromised, since the parameters are within acceptable limits, with greater variations for phosphorus. Regarding the use and occupation of the soil, there was an increase in water availability and agricultural areas, with a reduction in the caatinga. Continuous monitoring of water quality in the reservoir is recommended, in addition to the application of SUPer and land use and occupation maps as tools for the management of water resources.

1. Introduction

The impacts of the growing demand for water, in addition to its multiple uses, have caused crises of scarcity and, consequently, conflicts, threats to health, and risks to development [1]. In regions where water availability is reduced, as is the case in the Brazilian northeast, problems related to scarcity are more frequent and associated with natural causes, such as climatic issues, accentuated by anthropic actions in watersheds [2].
The concern with the supply of water in quantity and quality contemplates the Sustainable Development Goals (SDGs). The document created by the United Nations (UN) in 2015, called Agenda 2030 [3], has 17 objectives and 169 goals. Among them, SDG 6—clean water and sanitation—stands out, which aims to “ensure the availability and sustainable management of water and sanitation for all”, as well as universal and equitable access to fresh water, the reduction of water pollution, and the integrated and participatory management of water resources [3].
Anthropic interference causes changes that can affect the physical and chemical characteristics of the soil, which can initiate erosive processes, increase salinity and, consequently, alter the properties of water and the hydrological cycle in a watershed [4]. The increase in degradation in watershed areas occurs due to the removal of natural areas and replacement by other types of land use [5], reinforcing the need for mapping studies of land use and occupation for the planning and management of water resources, since they portray the consequences of anthropogenic activities on the natural elements [6,7].
The monitoring of water quality is a limiting factor in the proposition of certain activities in a region, and in Brazil, it is one of the tools for water management established by the National Water Resources Policy (PNRH) [8], classifying water bodies according to their main uses. The National Council of the Environment (CONAMA), through Resolution No. 357 of 2005 [9], recommends the limits of several parameters for the classification of water bodies in Brazil.
Each parameter interferes differently with water quality, among which dissolved oxygen, nitrate, and phosphorus can be highlighted as some of the most used parameters for its evaluation [10]. Dissolved oxygen (DO) is one of the best indicators of the conservation of water bodies, as it is related to physical, chemical, and biological parameters [11]. In surface waters, nitrate is the main form of nitrogen present and, when absorbed by plants, contributes to the growth of algae and aquatic plants [10]. Similar to nitrate, phosphorus is a nutrient relevant to biological processes, and its excess can cause eutrophication of water bodies [11].
The issue of water quality has emerged as a growing concern among world policymakers, which highlights the negative impact of human activities on water resources. The World Health Organization (WHO) has published guidelines for the quality of fresh water, emphasizing the importance of ensuring the safety and accessibility of the resource and evidencing the influence of human activities and forms of land use and occupation on water quality: “potentially polluting human activity in the catchment will influence water quality downstream and in aquifers” [12] (p. 12).
In Brazil, studies have been conducted to analyze the impact of land use and occupation on water quality. The National Water Resources Policy [8] has comprehensively addressed this concern, seeking to establish guidelines and policies to preserve and restore the quality of Brazilian waters. In this context, the Environmental Plan for the Conservation and Use of the Artificial Reservoir Environment (PACUERA) stands out, which emphasizes the study of water quality as an essential element for the characterization of the impacts of polluting anthropogenic activities on water resources [13].
Information on water quality data is essential for managers to develop measures to protect, preserve, and improve water resources, especially in regions characterized by low water availability [14,15]. The state of Pernambuco is considered the smallest Brazilian state in terms of water availability per inhabitant, presenting 1320 m3/inhabitant/year, equivalent to 3.5% of the national average [16]. The Pernambuco Water and Climate Agency (APAC), responsible for the application of water policy in the State, has developed actions and research for better management of water resources, using technological innovations, such as environmental modeling software.
An example of an innovative tool developed is the Hydrological Response Unit System for Pernambuco (SUPer), an advanced system for modeling water quantity and quality that has considerably increased the usability of the Soil and Water Assessment Tool (SWAT) in terms of simulating the effects of management practices on different types of soil, vegetation cover uses, and scenarios of climate change in hydrology, water quality, and sediment production in Pernambuco watersheds [17].
The absence and lack of hydrological data constitute one of the main difficulties for the development of more effective management of water resources in the northeastern region of Brazil. Given this scenario, the use of hydrological models can be an alternative for monitoring areas affected by water scarcity problems. For this reason, the present study aimed to develop a temporal analysis of water quality parameters through SUPer for the Nilo Coelho reservoir, located in the municipality of Terra Nova, a semi-arid region of the state of Pernambuco, associating it with the land uses of the watershed.

2. Materials and Methods

2.1. Study Area

The Nilo Coelho reservoir is located between the cities of Terra Nova and Cabrobó and is part of the Terra Nova Watershed (Figure 1). It has a storage capacity of 22.71 hm3 [18] and is located in the semi-arid region, in the mesoregion of São Francisco Pernambucano, with an average annual rainfall of 564.50 mm and temperatures ranging from 22 °C to 32 °C [19].
In areas close to the Nilo Coelho reservoir, the predominance of chromic luvisols and lithosols can be observed [20]. The predominant vegetation cover is shrubby and arboreal caatinga, which can be dense or open. Concerning land use and occupation, savannah formation, urban infrastructure, and areas of agriculture and pasture stand out [21]. The basis of the local economy is agropecuary, predominantly sheep and goat herds. In agriculture, onion production stands out.
The reservoir is used as a supply source for the urban area of the municipality of Terra Nova (PE), which has a population of 10,314 inhabitants [22], and also supplies water for irrigation to small agricultural properties located in Cabrobó, Pernambuco [23].

2.2. Data Collected

2.2.1. Estimated Water Quality Data from the Hydrological Response Unit System for Pernambuco (SUPer)

SUPer (https://super.hawqs.tamu.edu/#/) is an advanced system for modeling the quantity and quality of water in the state of Pernambuco’s watersheds, capable of supporting public policies at different spatial and temporal scales. It has a database, interface, and models that are being developed to assess the impacts of soil management, water pollution, and climate change on the quantity and quality of water in rivers and reservoirs in the state [17]. In SUPer, the data are made available by sub-basins, in this case, the Terra Nova watershed is subdivided into 32 sub-basins, in which the Nilo Coelho reservoir is in sub-basin 18 (Figure 2).
SUPer is coupled to the Hydrology and Water Quality System (HAWQS), which is capable of working with large data files and carrying out different calculations. In addition, it also allows the user to generate files in the SWAT (swat2012rev.664 version) input format, run the latest SWAT version available, and analyze its results. It even provides an interactive web interface with maps, preloads input data, shows results that include tables, graphics, and output data, a user guide, and modeling projects with development, execution, and online storage for users [24].
For the analysis of water quality, SUPer has some of the variables used to verify the conditions of ecosystems, among which we can mention dissolved oxygen (Equation (1)), nitrate (Equation (2)), and phosphorus (Equation (3)), obtained through the following equations:
O x s u r f = O x s a t K 1 × c b o d s u r q × t o v 24  
where Oxsurf is the dissolved oxygen concentration in the surface runoff (mg L−1), Oxsat is the saturation oxygen concentration (mg L−1), K1 is the CBOD deoxygenation rate (day1), cbodsurq is the CBOD concentration in the surface runoff (mg L−1) and tov is the runoff concentration time (h).
Δ N O 3 s t r = ( β n , 2 × N O 2 s t r ( 1 f r N H 4 + ) × α 1 × μ a × a l g a e ) × T T
where ∆NO3-str is the nitrate concentration (mg L−1), N is classified from the rate for biological transmission from nitrate to nitrate (day or h), NO2-str is the nitride concentration at the beginning of the day (mg L−1), frNH4+ is the observed algal fraction of the ammonia pool, 1 is the fraction of algal biomass that is tracked (mg N mg alg biomass), α1 is the local algal growth rate (day or h), algae is the concentration of algal biomass at the beginning of the day (mg alg L−1), and TT is the elapsed time of flow in the water (day or h)
Δ o r g P s t r = ( α 2 × ρ a × a l g a e β p , 4 × o r g P s t r × σ 5 × o r g P s t r ) × T T
where ∆orgPstr is the concentration of phosphorus (mg L−1), α2 is the fraction of algal biomass that is phosphorus (mg P mg alg biomass), α is the local respiration or death rate of algae (day or h), algae is the algal biomass concentration at the beginning of the day (mg alg L−1), P,4 is the coefficient of the organic phosphorus mineralization rate (day or h), orgPstr is the phosphorus concentration at the beginning of the day (mg L−1), σ5 is the rate coefficient for organic phosphorus decantation (day or h), and TT is the water flow course time (day or h).

2.2.2. Observed Water Quality Data from the National Water and Basic Sanitation Agency (ANA) and the Ministry of Regional Development (MDR)

The observed water quality data were obtained from ANA through the Hydrological Information System (HidroWeb). The portal is an integral tool of the National Water Resources Information System (SNIRH) and provides a database with information collected by the National Hydrometeorological Network (RHN), gathering data on river levels, flows, rainfall, climatology, water quality, and sediments.
The Nilo Coelho reservoir has a fluviometric station with code 48,177,000, located between −8.23 S latitude and −39.37 W longitude. Data from the following water quality parameters were selected: dissolved oxygen, nitrate, and total phosphorus, for the years 2014–2019, available on the website, as these parameters are also available on SUPer. For the data that were absent from the portal, the value zero was admitted.
The physical-chemical data on the water quality of the MDR were obtained through the request for information registered at Fala.BR under No. 59016.001165/2022-96, from the reports of the Water Quality and Limnology Monitoring Program—PBA 22, of the North Axis of the São Francisco River Integration Project (PISF).

2.3. Statistical Analysis

2.3.1. Accuracy Analysis of Estimated SUPer Data

For the accuracy analysis of the estimated water quality, data obtained from the SUPer were selected according to the availability of available observed data, as shown in Table 1.
To assess the accuracy of the estimated SUPer data, the root mean square error (RMSE) was applied. The RMSE is a measure that calculates the root mean square of errors between observed values and predictions [25], according to Equation (4):
1 n Σ i = 1 n   ( E i O i ) 2
where Ei and Oi are the estimated and observed (measured) values, respectively, and n is the number of observations.
The RMSE is a measure of the average magnitude of the estimated errors, it always has a positive value, and the closer it is to zero, the higher the quality of the measured or estimated values [26].

2.3.2. Temporal Analysis of Water Quality Using SUPer Data

For the temporal analysis of the water quality parameters, the entire historical series available in the SUPer was analyzed, covering the years from 1963 to 2021. The classification and framing of water bodies were determined using Resolution 357 of the National Environment Council (CONAMA) [9]. The resolution also establishes that for water bodies that do not yet have frameworks, which is the case with the Nilo Coelho Reservoir, class 2 is used for fresh water. The limits established for each parameter are shown in Table 2.

2.4. Mapping of Land Use and Occupation

To elaborate the land use and occupation maps, satellite images were acquired through access to the United States Geological Survey (USGS), the TM sensor on board the Landsat 5 satellite, and the Operational Land Imager (OLI) sensor on board the satellite Landsat 8 for orbits and points 216-066, 217-065, and 217-66. For the present study, the dates were chosen considering the same period, the least possible number of clouds, and the proximity of dates between the orbits, using the dates of August and September of the years 1998, 2008, and 2018, according to Table 3.
Initially, the color composition was created with bands 1–7 for Landsat 5 and bands 2–7 for Landsat 8. After that, the coordinates of the images were reprojected for the southern hemisphere, since the scenes acquired in EarthExplorer are projected to the northern hemisphere. As it is a large area, consisting of three scenes (216-066, 217-065, and 217-066), it was necessary to join them using the mosaic tool. This processing consisted of uniting the three images, forming a larger one that encompasses the entire watershed area.
After mosaicking the scenes, compositions 5(R), 4(G), and 3(B) were used for better identification of land use and occupation classes in Landsat images. Subsequently, approximately 120 pixels were collected for each class using the maximum likelihood method [27], establishing four categories for different land uses: water bodies, exposed soil or urbanized areas, agriculture or pastures, and caatinga [28].

3. Results

3.1. Temporal Evaluation of Water Quality Parameters

To analyze the accuracy of the water quality parameter values obtained in SUPer, the values of the corresponding dates of the variables available in the HidroWeb portal (ANA) and provided by the MDR were extracted. The data are arranged in Table 4.
For the RMSE, phosphorus obtained the lowest value, 0.2, while nitrate and dissolved oxygen obtained 0.8 and 1.1, respectively. The table contains the RMSE data obtained for the analyzed years. A similar result was found by Almeida et al. in a study of the prediction of water quality parameters, in which lower RMSE values for phosphorus (0.01) could be identified [29]. It is worth mentioning that the imposed results may be influenced by the lack of available information obtained through the ANA portal.
Although Brazil is one of the most important countries for global water flows, it has limitations in hydrological observations, which generate challenges for adequate knowledge of its water resources [30]. For this reason, hydrological models are shown to be fundamental tools for the management of water resources in these areas, as they provide results for planning multiple water uses [31].
The temporal analysis of water quality parameters (dissolved oxygen, nitrate, and total phosphorus) obtained through SUPer encompasses the years 1963 to March 2021, totaling 699 months. Table 5 contains the mean, standard deviation, minimum, and maximum values for each parameter.
Oxygen is one of the most important parameters of aquatic ecosystem dynamics [32]. For the dissolved oxygen (DO) values obtained in the temporal analysis of the Nilo Coelho reservoir, in more than 74% of the data (corresponding to 522 analyzed months), this parameter remained above 5 mg L−1. Values below 5 mg L−1 (26%) occurred mostly in the rainy season, for example, in January 2016, the value for the DO was 2.2 mg L−1 (Figure 3).
The biochemical processes of nitrogen conversion into nitrate imply the consumption of dissolved oxygen in the environment, which can impact ecosystems [33]. Beyond that, nitrate concentrations are identified in environments with older pollution, while nitrogen and ammonia are found in environments with recent pollution. For the Nilo Coelho reservoir, throughout the temporal analysis, in approximately 57% of the data, the nitrate concentrations remained lower than 1.0 mg L−1. Only twelve months exceeded the value of 10.0 mg L−1, the maximum value allowed by law [9] for the variable nitrate in class 2 fresh water (Figure 4). It is worth highlighting the month of January 2016, where nitrate reached a concentration of 19.1 mg L−1, and for this month, there was a precipitation of 145 mm in Terra Nova [34].
Regarding the total phosphorus parameter, approximately 54% (377 months) of the data remained within the limit for class 2 of fresh water, with values up to 0.03 mg L−1, throughout the temporal analysis (Figure 5). Considering that the highest concentration of total phosphorus coincided with the rainy season, its origin could possibly be from soil leaching. In 43% (299 months) of the data, the total phosphorus value was above 0.05 mg L−1. The increase in nutrient concentration in the rainy season may also be associated with sedimentary erosion [35].

3.2. Analysis of Land Use and Occupation in the Terra Nova Watershed

Over the course of 30 years, the Terra Nova watershed achieved different phases of land use and occupation, with different causes in its space-time variation, from changes in water resources to vegetation and, consequently, in urbanized areas (Figure 6). Mapping land use and vegetation cover is fundamental to understanding the dynamics of watersheds, since the intensive and irregular use of land has led to the deterioration of water quality [36].
The percentages of land use and vegetation cover in the Terra Nova watershed are shown in Table 6.
In the analysis for the class of water bodies, the increase in water availability in the region stands out, which increased from 0.3% to 1%. This variation is related to the construction of the five reservoirs on the North Axis of the PISF, which were already supplied in 2018, the reservoirs of Terra Nova, Serra do Livramento, and Mangueiras.
For the caatinga class, in the years 1998 and 2008, the values remained above 75%. In the Terra Nova watershed, with the increase in water availability and agricultural areas, the caatinga area decreased to 62% of the area in 2018. For the areas of exposed soil and urbanized areas, between the years 1998 and 2008, a decrease in these areas can be observed, going from 11% to 4%, respectively. For the year 2018, this class increased by only 1%, now representing 5% of the basin area.
Regarding the areas of agriculture and pasture, a gradual increase can be identified according to the years, obtaining values of 13% in 1998, 19.2% in 2008, and 32% in 2018. The growing number of agricultural areas can also be seen, in line with the greater availability of water with the waters of the PISF and the consequent reduction in the areas of caatinga. In the area of the watershed, the predominance of onion and rice production can be observed, mainly in the areas close to the São Francisco River [37].

4. Discussion

Water quality is a crucial issue for achieving Sustainable Development Goal (SDG) 6, which aims to ensure the availability and sustainable management of water and sanitation for all. Among the goals of SDG 6 is target 6.3, which highlights the concern to improve water quality by reducing pollution, eliminating dumping, and minimizing the release of chemicals and hazardous materials into water resources. To monitor the evolution of water quality, the indicator proportion of water bodies with water of good and safe quality for specific uses, such as human consumption, agricultural activities, and recreation, corresponding to indicator 6.3.2, is adopted [3].
The growing demand for water, resulting from its multiple uses, is a concern for management agencies, since the water security of regions that already suffer from water scarcity, such as in the Brazilian northeast, is related to the equal supply of water in quantity and quality [38]. However, a major obstacle to advances in research and more effective measures to meet these demands is the absence of hydrological data in this region. Recent research [39,40] highlights that the scarcity of information in the northeast region of Brazil interferes with the development of studies, since there are few historical series related to water quality, in addition to incipient spatiotemporal analyses, due to the low number of monitoring stations.
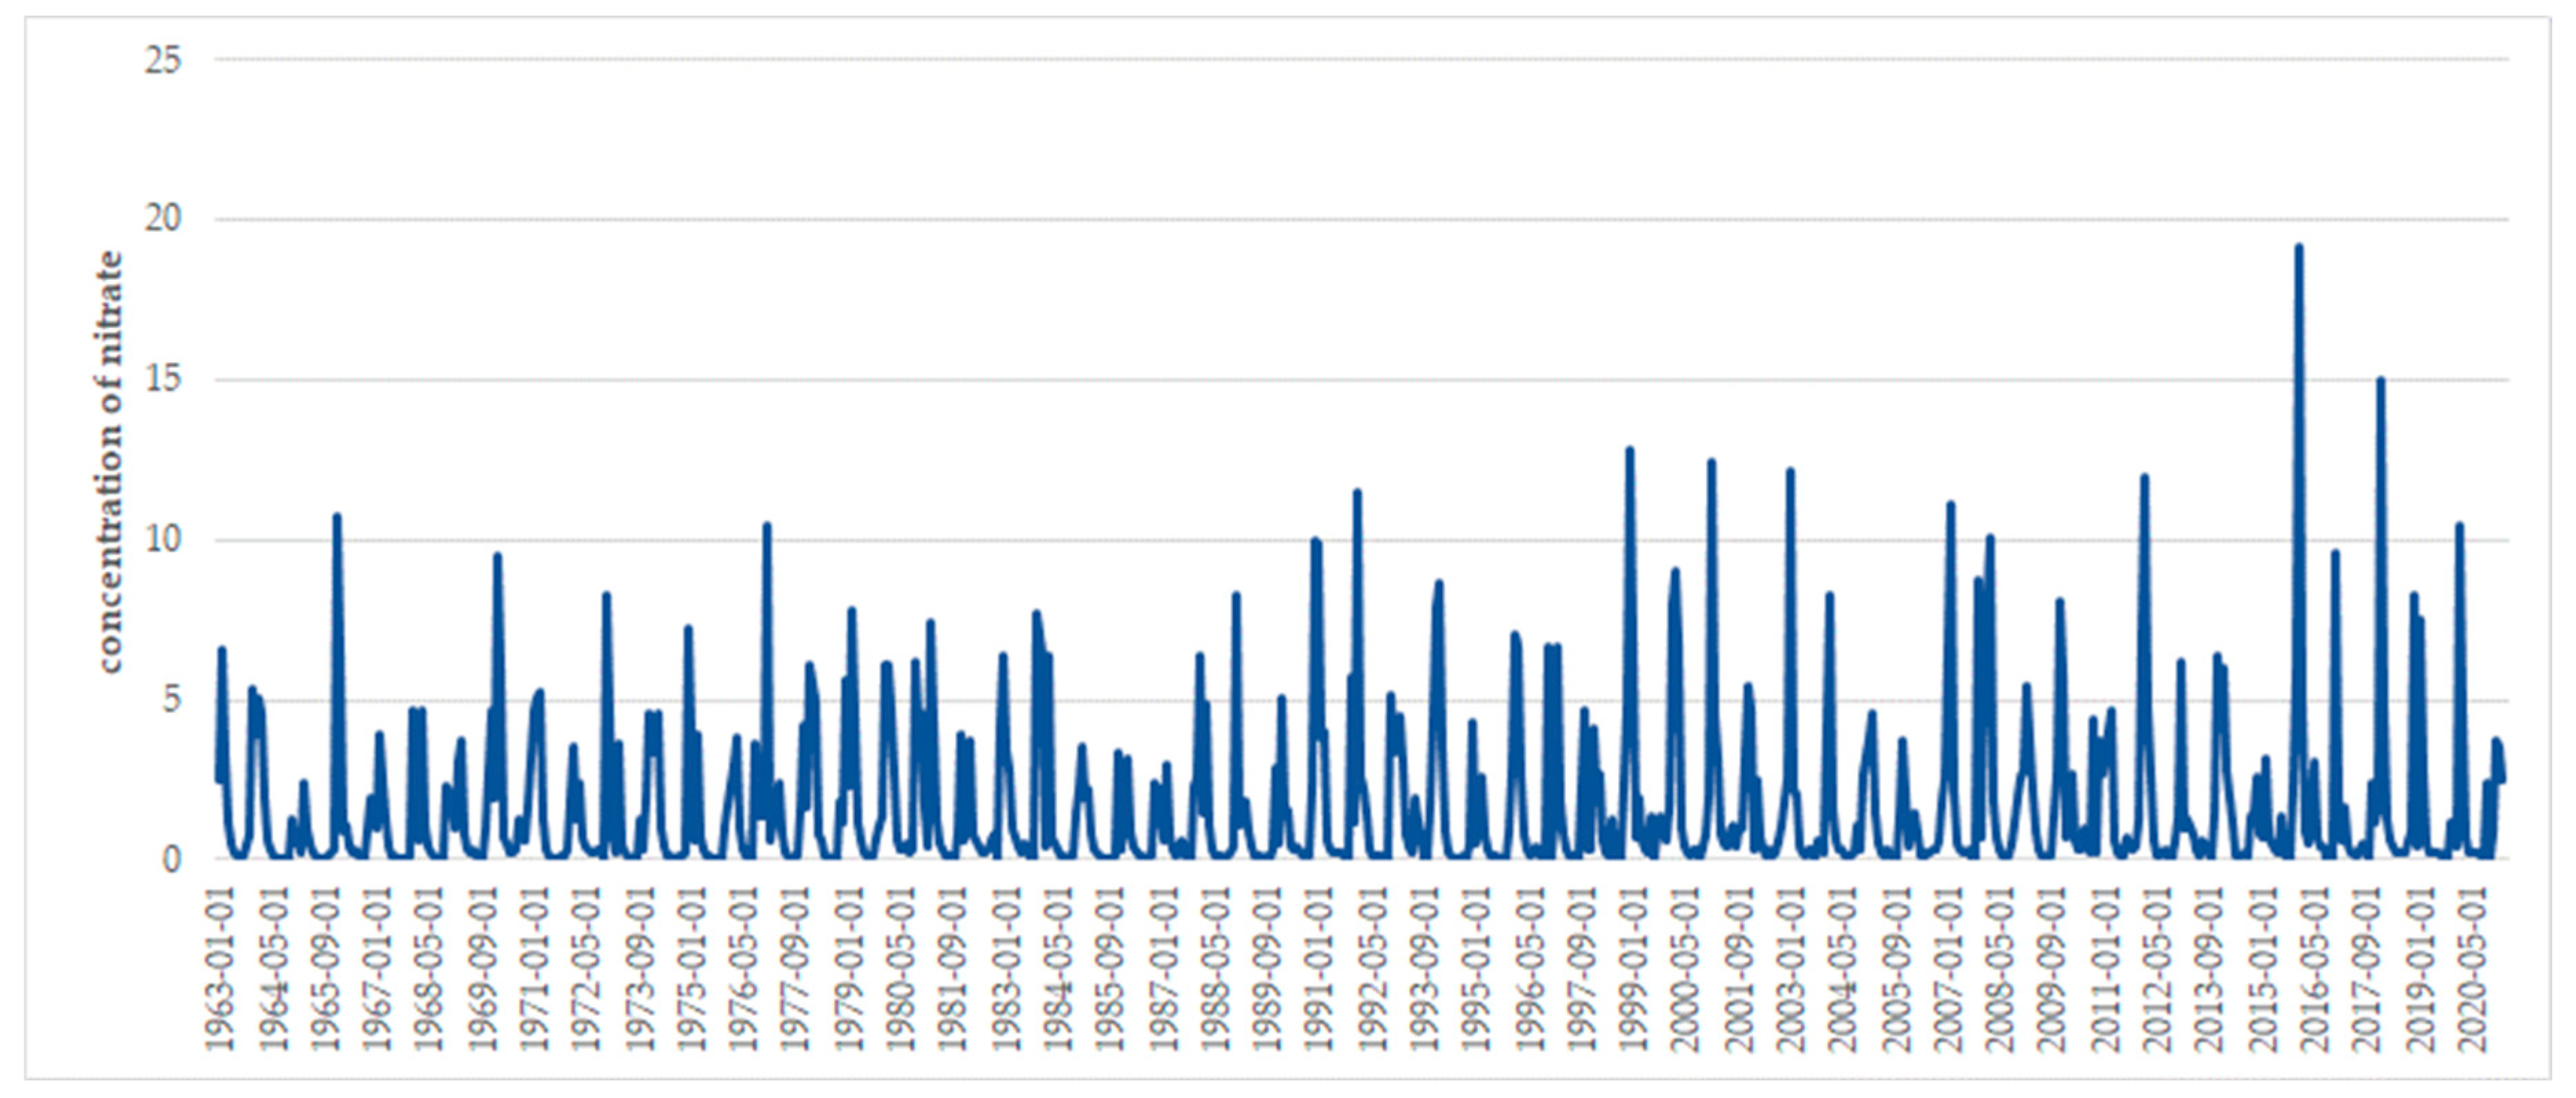
Due to the deficit in the availability of water quality data observed for the Brazilian northeast, hydrological models emerge as an alternative for the management of water resources. Therefore, the applicability of SUPer as a water quality analysis tool emerges as an important instrument for water management, given its robust series of data from 1963 to 2021, assisting in the planning and proposition of public policies that guarantee the quality of water bodies [38].
In the present study, the historical series of dissolved oxygen, nitrate, and total phosphorus were analyzed, following the resolution of CONAMA 357, for class 2 fresh waters [9], since the state of Pernambuco does not yet have a framework of its water resources. For DO, CONAMA [9] establishes a limit of 5 mg L−1, the same value defined by the WHO [12]. As for nitrate, the limit is 10 mg L−1 and, for the WHO, the limit for this variable is 50 mg L−1. For total phosphorus, the value of 0.03 mg L−1 is established for lentic environments.
Regarding DO, the concentration of this parameter is usually higher in environments with low trophic levels, reaching values above 5 mg L−1 [41]. Mean values of RE between 7.9 mg L−1 and 8.0 mg L−1 and values of 5.34 mg L−1 to 6.18 mg L−1 were observed in the hydrographic basin of the Longá River, Piauí [39] and in the La Vega dam, Mexico [42], in this order. In the region of the lower São Francisco, Sergipe, values above 5 mg L−1 were also observed, in compliance with current legislation [43].
The degree of water deoxygenation is related to the concentration of organic matter associated with high temperatures, especially in shallow lagoons, as occurs in most Brazilian lakes and reservoirs. These ecosystems suffer large variations in water level, accentuated in the rainy season, increasing the concentration of organic matter, which directly interferes with the dynamics of dissolved oxygen [32].
Concentrations of DO below 5 mg L−1 were identified in the Moxotó River watershed, Brazil, in the reservoir of the Nova Ponte hydroelectric plant, Minas Gerais, and the Piemonte hydrographic basin, wherein periods of greater rainfall, there is a reduction in the DO, which may contribute to greater availability of organic matter for water from surface runoff in the drainage basin [38,44,45]. Several authors point to dissolved oxygen as the most important parameter, as it is essential for the survival of aquatic organisms. Thus, in cases of low oxygen concentrations, there is a problem in the ecosystem [32,41,46].
As for nitrate, its concentration in water bodies should not exceed 10 mg L−1 [9]. Studies carried out in the Piemonte hydrographic basin, in the Barra do Juá dam, in the Pajéu River watershed and in reservoirs on the east axis of the São Francisco Integration Project (PISF), identified small variations and low nitrate levels, within the limits established by the resolution [43,47,48].
Values above 10 mg L−1 were observed in the rainy season. The same was observed in analyses carried out in the Parnaíba River, which may be indicative of pollution [16]. Studies indicate that eutrophication is the main problem associated with high nitrate concentrations since it is an indispensable element for algae growth [49]. When in excess in the environment, these organisms can cause changes in water bodies, such as organoleptic problems, transparency, oxygen reduction, fish mortality, and obstruction of waterways.
In watershed areas where there are irrigated agriculture activities, increased nitrate may be associated with agricultural practices, fertilizer use, soil disturbance, erosion, and drainage [42]. Since it is present in most surface water and comes from human, animal, and fertilizer sources, nitrate may reflect the condition of water sanitation [50], reinforcing the need to be careful with water intended for human supply and consumption, since the presence of nitrate can cause damage to health [41].
For total phosphorus, the limit established in lentic environments is 0.030 mg L−1 [9]. As in the present study, values above this limit were observed in studies carried out in the Hydrographic Basin of Escola do Jacaré (CWB) and in the Nova Ponte Hydroelectric Power Plant, Minas Gerais, which may be related to the fertilizers used in the agricultural activities of the region [43,44], since there is strong anthropic interference in the surroundings of the reservoir, in addition to the existence of crops. In the surroundings of the reservoir, the predominance of lithic neosols and chromic luvissols favors the leaching of sediments and fertilizers, since they are characterized by being shallow, sandy soils, with the occurrence of tonality on the surface, in addition to a strong tendency to erosion [10].
In a study developed at the La Vega dam, Mexico, values between 0.15 and 0.59 mg L−1 were observed, above the limits established by the Mexican standards of 0.025 mg L−1 [42]. Phosphorus is considered a limiting nutrient for primary aquatic producers [45]. High concentrations of phosphorus are one of the main causes of eutrophication in the aquatic environment. They may be related to anthropic activities, due to the release of domestic sewage, industrial effluents, as well as fertilizer residues, which contribute to the increase in the concentration of nutrients in the water column, accelerating the eutrophication process [5].
The development of activities in areas close to reservoirs can interfere with hydrological dynamics, among which domestic dumps, organic contamination, and pesticides, can cause changes in water flow, and nutrient cycles and, consequently, affect living resources and water quality [4,13]. The National Water Resources Policy in Brazil [8] establishes an articulated management of water and soil, promoting policies that integrate land use, occupation, and conservation policies with water resources policies.
Thus, it is essential to develop studies on the use and occupation of land in areas close to water bodies, seeking to understand how the activities developed by man can interfere with the water dynamics of the region. The improper use of the soil can contribute to the transfer of nutrients to the reservoirs, as in intensive agricultural activities, in this way, the form in which man uses, occupies, and manages the soil directly implies the quality of the water [13].
In the present study, the classes of water bodies, exposed soil or urbanized areas, agriculture or pastures, and caatinga were analyzed. For the class of water bodies, it is possible to observe the increase in water availability in the region, due to the PISF reservoirs. Similar results were observed in the city of Belém do São Francisco, in the years 1985 and 2010, where with the construction of the Itaparica reservoir in the 1980s, there was an increase in the percentage of water bodies from 2.4% to 3.8% [51].
As for the caatinga areas, in the surroundings of the Cachoeira II dam [49], this class was predominant, however, in the region of the São Paulo stream watershed, in the semiarid region of Pernambuco, there was a gradual replacement of the caatinga areas by agriculture and pasture areas between 1991 and 2010 [52], which was also observed in this study.
The growth of exposed soil areas was also found in the municipality of Belém do São Francisco, with a growth of 3.5% of these spaces between 1985 and 2010 [53]. In urbanized areas, it is concluded that hydrographic basins located in interior regions have low representativeness since cities are considered small/medium-sized [54]. Studies reinforce that the increase in areas of exposed soil, associated with the reduction in native vegetation, makes the watersheds vulnerable to erosive processes, requiring adequate management of these areas. Thus, the ideal is the inexistence of this type of use, because it characterizes areas devoid of vegetation, which favors environmental degradation [55,56].
Studies developed in the Espírito Santo watershed indicated that pasture areas represent 36.5% of the analyzed area [55]. In the areas of the Córrego Cantagalo watershed, pasture areas were considered predominant, occupying 71.36% of the total area [57]. The management of these areas is also recommended as an alternative for the conservation of these environments and the reduction of their environmental impacts.
Given the analyses and results obtained, it is observed that the reduction in native vegetation and, consequently, the increase in agricultural areas, due to the greater supply of water in the region, with the construction of the PISF reservoirs. However, the suppression of native vegetation leads to problems such as biodiversity loss, changes in water quality, and soil conservation [4]. The management must happen in a participatory way, aiming at the protection and conservation of ecosystems, while also providing the development of the region, since the guarantee of water security happens when there is water available for the supply of the population and also for the development of activities that depend directly or indirectly on the availability and quality of water.

5. Conclusions

Considering the small amount of observed data available due to the absence of data or failures in the monitoring of the reservoir, there is the possibility of using the SUPer for the management of water resources in the state of Pernambuco due to the long historical series available (1963–2021) of estimated water quality data. Thus, it is recommended to apply precision studies of the series of water quality data estimated by SUPer to other reservoirs in the state where there are monitoring stations. However, it is essential to carry out more on-site collections for analysis and monitoring of water quality, enabling better validation of the SUPer, in addition to making the data available to the community, as recommended by the National Water Resources Policy in Brazil.
For the temporal analysis of water quality, it can be concluded that the water of the Nilo Coelho reservoir can be classified as a little compromised, since most of the data are within the limits established by the resolution. There is greater variation in phosphorus values, which may be associated with the presence of urban areas and, consequently, the release of effluents, as well as agricultural areas around the reservoir. Continuous monitoring in the region is suggested, given that the reservoir is also used for human supply.
The mapping of land use and occupation in the basin region showed that over the analyzed period (30 years), there was an increase in water availability and agricultural areas and, consequently, a reduction in caatinga areas, especially after the construction of the PISF reservoirs. Land use and occupation maps facilitate the understanding of the consequences and impacts of anthropogenic actions in the region. In addition, the maps generated provide data that can be used by society and the government for environmental planning purposes and the formulation of public policies aimed at improving the quality of life of the population.

Author Contributions

N.S.: Conceptualization, Methodology, Software, Formal analysis, Writing—Original Draft; I.T.: Methodology, Software, Writing; G.S.: Validation, Investigation, Data Curation, Writing—Review and Editing; J.G.: Conceptualization, Writing—Review and Editing, Supervision, Project Administration. D.S.: Review and Editing, Supervision; S.M.: Review and Editing, Supervision. All authors have read and agreed to the published version of the manuscript.

Funding

This research was financed by the Pernambuco Science and Technology Support Foundation (FACEPE), INCT—National Observatory of Water Security and Adapted Management and National Council for Scientific and Technological Development (CNPq).

Data Availability Statement

The study’s data are available from the corresponding author by request.

Acknowledgments

The authors would like to thank the Remote Sensing and Geoprocessing Laboratory, the Foundation for the Support of Science and Technology of Pernambuco (FACEPE) for the scholarship granted to the first author and the projects INCT—National Observatory of Water Security and Adaptive Management (Proc. 406919/2022-4), CALL No. 58/2022/CNPq, and CNPq/MCTIC/BRICS 29/2017 (Proc. 442335/2017.2).

Conflicts of Interest

The authors declare no conflict of interest.

Abbreviations

ANANational Water and Basic Sanitation Agency
APACPernambuco Water and Climate Agency
CONAMANational Council of the Environment
DODissolved oxygen
HAWQSHydrology and Water Quality System
MDRMinistry of Regional Development
NNitrate
OLIOperational Land Imager
PBAWater Quality and Limnology Monitoring Program
PISFSão Francisco River Integration Project
PNRHNational Water Resources Policy
RHNNational Hydrometeorological Network
RMSERoot Mean Square Error
SDGsSustainable Development Goals
SNIRHNational Water Resources Information System
SUPerHydrological Response Unit System for Pernambuco
SWATSoil Water Assessment Tool
TPTotal Phosphorus
USGSUnited States Geological Survey

References

  1. Guo, A.; Chang, J.; Wang, Y.; Huang, Q.; Guo, Z.; Li, Y. Uncertainty analysis of water availability assessment through the Budyko framework. J. Hydrol. 2019, 576, 396–407. [Google Scholar] [CrossRef]
  2. Bento, N.L.; Raasch, L.B.; dos Silva, H.C.; Barros, F.M. Impacts of effluent discharge on the water quality of the Catolé Grand River. Braz. J. Dev. 2021, 7, 39134–39149. [Google Scholar] [CrossRef]
  3. United Nations. Agenda 2030. 2015. Available online: https://nacoesunidas.org/pos2015/agenda2030/ (accessed on 3 June 2021).
  4. Calado, T.O. Analysis of the Relationship of Land Use with Water Quality of the Epitácio Pessoa Reservoir in the Eastern Axis of the São Francisco River Integration Project. Master’s Thesis, Federal University of Pernambuco, Recife, Brazil, 2020. [Google Scholar]
  5. Quinelato, R.V.; da Farias, E.S.; Brito, J.M.S.; Virgens, W.A.; Pires, L.C. Temporal space analysis of water quality of the Peruípe, Itanhém and Jucuruçu rivers, Bahia. Sci. Plena 2020, 16, 1–12. [Google Scholar] [CrossRef]
  6. Ferreira, Y.B.C.; Brito, Y.M.A.; Assis, W.D.; Brito, H.C.; Rodrigues, A.C.L. Water Safety in semiarid region: Assessment of Adaptive Capacity in municipalities of Agreste Paraibano. In Environment and Society: Analyses, Dialogues and Environmental Conflicts; Tavares, L.P., Ed.; Amplla: Campina Grande, Brazil, 2020; pp. 9–20. [Google Scholar]
  7. Silveira, N.T.; Martins, L.D.; de Oliveira, T.H. Temporal Space Analysis of the Vegetation Cover of the Terra Nova Hydrographic Basin—Pernambuco. In Cartography in the Digital Age; de Listo, F.R., da Listo, D.G.S., de Oliveira, I.G.F., da Freitas, L.C.S., Eds.; MapGeo Jr: Recife, Brazil, 2022; pp. 71–80. [Google Scholar]
  8. BRAZIL. Law No. 9433, of January 8, 1997. Establishes the National Water Resources Policy, Creates the National Water Resources Management System, Regulates Item XIX of Article 21 of the Federal Constitution, and Amends Article 1 of Law No. 8001, of March 13, 1990, Which Modified Law No. 7990, of December 28, 1989. Brasília, DF. Available online: http://www.planalto.gov.br/ccivil_03/leis/l9433.htm (accessed on 25 October 2021).
  9. CONAMA—National Council for the Environment. Resolution n° 357, March 17, 2005. It Provides for the Classification of Water Bodies and Environmental Guidelines for Their Framing, as Well as Establishes the Conditions and Patterns of Effluent Release, and Provides Other Measures; Official Gazette of the Union: Brasilia, Brazil, 2005; pp. 58–63. [Google Scholar]
  10. Santos, S.; Gastaldini, M.C.C.; Pivetta, G.G.; Schmidt Filho, O. Water quality in the urban watershed Cancela Tamandaí, Santa Maria/RS. Soc. Nat. 2018, 30, 23–44. [Google Scholar] [CrossRef]
  11. CETESB—Environmental Company of the State of São Paulo. Appendix and Environmental and Sanitary Significance of Water and Sediment Quality Variables and Analytical and Sampling Methodologies; CETESB: São Paulo, Brazil, 2016. Available online: https://cetesb.sp.gov.br/aguas-interiores/wp-content/uploads/sites/12/2020/09/Apendice-E-Significado-Ambiental-e-Sanitario-das-variaveis.pdf (accessed on 16 May 2022).
  12. WHO—World Health Organization. Guidelines for Drinking-Water Quality: Fourth Edition Incorporating the First Addendum; WHO: Geneva, Switzerland, 2017. [Google Scholar]
  13. MDR—Ministry of Integration and Reginal Development. Diagnóstico Socioambiental: Sub-Bacia Terra Nova, Reservatórios Terra Nova, Serra do Livramento, Mangueira, Negreiros, Milagres; MDR: Brasília, Brazil, 2016; p. 475. [Google Scholar]
  14. Soares, R.D.B.; Cruz, R.W.L.; Silva, C.E. The influence of precipitation on the variability of water quality of the Parnaíba River. Braz. J. Dev. 2019, 5, 16645–16674. [Google Scholar] [CrossRef] [Green Version]
  15. Silva, A.M.C.; Cunha, M.C.C.; Lopes, D.V. Water quality as a reflection of anthropic activities in hydrographic basins in the Northeast, Brazil. Geosul 2019, 34, 102–123. [Google Scholar] [CrossRef] [Green Version]
  16. Tôrres Silveira, N.; Silveira, H.T.; Tibúrcio, I.M.; Galvíncio, J.D. Evaluation of water quality of the Nilo Coelho reservoir, Terra Nova, Pernambuco, Brazil. Braz. J. Phys. Geogr. 2022, 15, 2866–2877. [Google Scholar]
  17. de Farias, C.W.L.A.; Miranda, R.Q.; de Viana, J.F.S.; Lins, F.A.C.; Galvíncio, J.D. Partial Calibrations of the Swat Model as Support to the Hydrological Response Unit System for Pernambuco. In Proceedings of the XV Northeast Water Resources Symposium, Online Event, 26 November 2020. [Google Scholar]
  18. ANA—National Water and Sanitation Agency. Water Resources Conjuncture in Brazil. 2021. Brasília, Brazil. Available online: http://www.ana.gov.br (accessed on 22 February 2022).
  19. INMET—National Institute of Meteorology. Historical Data. 2022. Available online: https://portal.inmet.gov.br/dadoshistoricos. (accessed on 26 March 2022).
  20. dos Santos, H.G.; Jacomine, P.K.T.; dos Anjos, L.H.C.; Oliveira, V.A.; Lumbreras, J.F.; Coelho, M.R.; Almeida, J.A.; Araújo Filho, J.C.; Oliveira, J.B.; Cunha, T.J.F. Brazilian Soil Classification System, 5th ed.; Embrapa: Brasília, Brazil, 2018; p. 356. [Google Scholar]
  21. APAC—Pernambuco Water and Climate Agency. Water Resources Situation Report of the State of Pernambuco 2011/2012; APAC: Recife, Brazil, 2013; p. 166. [Google Scholar]
  22. IBGE—Brazilian Institute of Geography and Statistics. Terra Nova. Available online: https://www.ibge.gov.br/cidades-e-estados/pe/salgueiro.html (accessed on 21 April 2022).
  23. Ide, A.K.; Andrade, M.C.K. Impacts of the perenization of the new land stream on irrigated agriculture in the municipality of Cabrobó/PE. Environ. Sustain. Noteb. 2017, 10, 1–21. [Google Scholar]
  24. Galvíncio, J.D. Impact of CO2 increase in precipitations in the state of Pernambuco. Braz. J. Phys. Geogr. 2021, 14, 1828–1839. [Google Scholar]
  25. Galvíncio, J.D.; da Luz, G.G. Development of A Model that Estimates the Impact of Atmospheric CO2 on rainfall in the State of Pernambuco, using ARIMA. Braz. J. Phys. Geogr. 2021, 8, 1840–1851. [Google Scholar]
  26. Santos, W.O.; Silva, K.B.; Coelho, D.C.L.; Silva, K.M.P.; Espíndola Sobrinho, J.; Silva, P.C.M.; Batista, R.O. Spatial and temporal variability of precipitations for the Pau dos Ferros-RN Microregion. Braz. J. Phys. Geogr. 2014, 7, 434–441. [Google Scholar]
  27. Meneses, P.R.; de Almeida, T. Introduction to Remote Sensing Image Processing; UnB-CNPq: Brasília, Brazil, 2012; p. 276. [Google Scholar]
  28. PROBIO—Project for the Conservation and Sustainable Use of Brazilian Biological Diversity. Activity Report—PROBIO 1996–2002; PROBIO: Brasília, Brazil, 2002. [Google Scholar]
  29. Almeida, A.; Amaris, M.; Merlin, B.; Veras, A. Modeling and Temporal Prediction of Water Quality Parameters using Deep Neural Networks. In Proceedings of the Computer Workshop Applied to The Management of the Environment and Natural Resources, Online Event, 30 June 2020. [Google Scholar]
  30. Almagro, A.; Oliveira, P.T.S.; Brocca, L. Assessment of bottom-up satellite rainfall products on estimating river discharge and hydrologic signatures in Brazilian catchments. J. Hydrol. 2021, 603, 126897. [Google Scholar] [CrossRef]
  31. Chen, Y.; Marek, G.W.; Marek, T.H.; Brauer, D.K.; Srinivasan, R. Improving SWAT auto-irrigation functions for simulating agricultural irrigation management using long-term lysimeter field data. Environ. Model. Softw. 2018, 99, 25–38. [Google Scholar] [CrossRef]
  32. de Esteves, F.A. Limnology Fundamentals, 2nd ed.; Interciência: Rio de Janeiro, Brazil, 1998; p. 602. [Google Scholar]
  33. Sperling, M.V. Introduction to Water Quality and Sewage Treatment, 2nd ed.; UFMG: Belo Horizonte, Brazil, 1996; p. 243. [Google Scholar]
  34. APAC—Pernambuco Water and Climate Agency. Weather data—Terra Nova. Available online: http://old.apac.pe.gov.br/meteorologia/monitoramento-pluvio.php (accessed on 20 April 2022).
  35. Freire, L.L.; Costa, A.C.; Lima Neto, I.E. Spatio-temporal Patterns of River Water Quality in the Semiarid Northeastern Brazil. Water Air Soil Pollut. 2021, 232, 452. [Google Scholar] [CrossRef]
  36. Okumura, A.R.; Silva, A.G.; Silva, A.G.; Lopes, E.R.N.; Bifano, R.B.A.; Quinelato, R.V. Determination of the water quality of a tropical river from the perspective of use. Braz. J. Phys. Geogr. 2020, 13, 1835–1850. [Google Scholar]
  37. Government of the State of Pernambuco; Department of Infrastructure and Water Resources. Pernambuco State Water Resources Plan (PERH-PE): Integrated Diagnosis; Secretaria de Infraestrutura e Recursos Hídricos: Recife, Brazil, 2022; p. 299. [Google Scholar]
  38. Tôrres Silveira, N.; Silveira, H.T.; Tiburcio, I.M.; Galvíncio, J.D. Water Quality and Hydrological Modeling: Applicability of the Sistema de Unidades de Respostas Hidrológicas para Pernambuco (SUPer). Rev. Bras. Sensoriamento Remoto 2022, 3, 30–40. [Google Scholar]
  39. Medeiros, W.M.V.; Silva, C.E.; Lins, R.P.M. Seasonal and spatial evaluation of surface water quality of the Longá river basin. Ambiente E Agua—Interdiscip. J. Appl. Sci. 2018, 13, 1–17. [Google Scholar] [CrossRef]
  40. Santos, C.V.B.; Carvalho, H.F.S.; Silva, M.J.; Moura, M.S.B.; Galvíncio, J.D. Use of remote sensing in surface temperature analysis in seasonally dry tropical forest areas. Braz. J. Phys. Geogr. 2020, 13, 941–953. [Google Scholar]
  41. Américo-Pinheiro, J.H.P.; Ribeiro, L.G. Monitoring of Water Resources and Water Quality Parameters in Hydrographic Basins. In Watersheds: Fundamentals and Applications, 2nd ed.; Américo-Pinheiro, J.H.P., Benini, S.M., Eds.; ANAP: São Paulo, Brazil, 2019; pp. 89–109. [Google Scholar]
  42. Lamora-Orozco, C.; Flores-Lopez, H.; Rubio-Arias, H.; Chavez-Duran, A.; Ochoa-Rivero, J. Developing a Water Quality Index (WQI) for an Irrigation Dam. Int. J. Environ. Res. Public Health 2017, 14, 439–449. [Google Scholar] [CrossRef]
  43. Sales, J.M.J.; Aguiar Neto, A.O.; Monteiro, A.S.C.; Carvalho, C.M. Sand-temporal variability of water quality in irrigated agriculture area. Braz. J. Irrig. Agric. 2020, 14, 4071–4085. [Google Scholar] [CrossRef]
  44. Ignatius, A.R.; Rasmussen, T.C. Small reservoir effects on headwater water quality in the rural-urban fringe, Georgia Piedmont, USA. J. Hydrol. Reg. Stud. 2016, 8, 145–161. [Google Scholar] [CrossRef] [Green Version]
  45. Barroso, G.R.; Pinheiro, W.F.; Pereira, A.A. Evaluation of the water quality of the reservoir of the Nova Ponto Hydroelectric Power Plant (MG) and its relationship with the volume of water in the reservoir. Acad. Geogr. J. 2018, 12, 91–109. [Google Scholar]
  46. Tao, H.; Bobaker, A.M.; Ramal, M.M.; Yaseen, Z.M.; Hossain, M.S.; Shahid, S. Determination of biochemical oxygen demand and dissolved oxygen for semi-arid river environment: Application of soft computing models. Environ. Sci. Pollut. Res. 2018, 26, 923–937. [Google Scholar] [CrossRef]
  47. Melo, B.V.; Moraes, A.P.; Florêncio, J.M.; Bezerra, G.J.S.M.; Silva, S.V. Water Resources Management in Reservoirs served by the São Francisco River Integration Project. Sustentare 2018, 2, 80–92. [Google Scholar]
  48. Caldas, H.F.M. Analysis of the Spatial-Temporal Evolution of Water Quality in the East Axis of the São Francisco River Integration Project. Master’s Thesis, Federal University of Pernambuco, Recife, Brazil, 2021. [Google Scholar]
  49. Gloria, L.P.; Horn, B.C.; Hilgemann, M. Water Quality Assessment of Hydrographic Basins Through Water Quality Index Tool—IQA. Pedagog. Noteb. Mag. 2017, 14, 103–119. [Google Scholar]
  50. Morais, M.A.; Gomes, F.B.M.; Lemos Filho, L.C.A.; Freire, G.S.S.; Silva, G.F.; Facundo, A.L. Water quality as an instrument for water management of the Piranhas-Açu Hydrographic Basin (Rio Grande do Norte, Brazil). Braz. J. Environ. Manag. Sustain. 2020, 7, 1563–1573. [Google Scholar]
  51. Santos, A.G.B.; Bezerra, A.C.; Nascimento, A.H.C.; Souza, L.S.B.; Silva, J.L.B.; Moura, G.B.A. Morphometric Characterization and Land Use and Occupation in the Pernambuco Semiarid Basin. Braz. J. Phys. Geogr. 2021, 14, 1036–1043. [Google Scholar]
  52. Coelho, V.H.R.; Montenegro, S.M.G.L.; Almeida, C.N.; Lima, E.R.V.; Ribeiro Neto, A.; Moura, G.S.S. Dynamics of land use and occupation in a hydrographic basin of the Brazilian semi-arid region. Braz. J. Agric. Environ. Eng. 2014, 18, 64–72. [Google Scholar]
  53. Assis, J.M.O.; Calado, L.O.; Souza, W.M.; Sobral, M.C. Mapping of land use and occupation in the municipality of Belém de São Francisco—PE in the years 1985 and 2010. Braz. J. Phys. Geogr. 2014, 7, 949–959. [Google Scholar]
  54. França, L.M.A.; Diaz, C.C.F.; Reis, J.V.; Costa, V.S.O.; Galvíncio, J.D. Effects of precipitation on the flow of the Pajeú-PE river basin. Braz. J. Phys. Geogr. 2019, 12, 2377–2391. [Google Scholar]
  55. Silva, I.R.; Brovini, E.M.; Pereira, R.O.; Gomes, M.H.R. Influence of precipitation and land use and occupation on water quality of the Ribeirão Espírito Santo basin—Juiz de Fora/MG. J. Environ. Stud. 2020, 22, 35–51. [Google Scholar]
  56. Rodrigues, B.M.; Osco, L.P.; Antunes, P.A.; Ramos, A.P.M. Evaluation of the influence of land use and land cover on surface water quality of the Pirapozinho river basin (SP). Braz. J. Phys. Geogr. 2018, 12, 738–753. [Google Scholar]
  57. Leite, L.C.O.F.; Martins, Y.T.; da Menezes, S.J.M.C.; Cortines, E. Analysis of Land Use and Occupation in the Cantagalo Stream Hydrographic Basin, Três Rios—RJ. In Proceedings of the Symposium on Environmental Management and Biodiversity, Rio de Janeiro, Brazil, 21 June 2018. [Google Scholar]
Figure 1. Location of the Nilo Coelho reservoir, municipality of Terra Nova, state of Pernambuco, Brazil.
Water 15 02899 g001
Figure 2. Location of the Nilo Coelho reservoir in sub-basin 18, according to the SUPer classification.
Water 15 02899 g002
Figure 3. Temporal analysis of dissolved oxygen (January 1963–March 2021), for the Nilo Coelho Reservoir, Terra Nova, Pernambuco, Brazil.
Water 15 02899 g003
Figure 4. Temporal analysis of nitrate (January 1963–March 2021), for the Nilo Coelho Reservoir, Terra Nova, Pernambuco, Brazil.
Water 15 02899 g004
Figure 5. Temporal analysis of total phosphorus (January 1963–March 2021), for the Nilo Coelho Reservoir, Terra Nova, Pernambuco, Brazil.
Water 15 02899 g005
Figure 6. Map of land uses for the Terra Nova watershed for the years 1998 (A), 2008 (B), and 2018 (C).
Water 15 02899 g006
Table 1. Observed water quality data obtained from the HidroWeb online platform and the Ministry of Regional Development of Brazil (MDR) (all values in mg L−1).
ANA and MDR Data
Collection DateDissolved OxygenNitrateTotal Phosphorus
12 December 20197.10.080.06
11 April 20197.80.10.1
18 September 20195.90.080.2
18 June 20197.30.080.07
26 March 20196.00.090.1
19 June 20186.90 10.1
21 March 20185.10 10.3
21 March 20179.10.30.3
20 July 20168.50 10.1
27 April 20158.80.50.4
8 October 20147.51.10.6
Note: There is no data available on the portal, so the value zero was assigned 1.
Table 2. Limits established by the National Council for the Environment (CONAMA) Resolution 357 for dissolved oxygen, nitrate, and phosphorus.
VariableLimit Set 1
Dissolved Oxygen5 mg L−1
Nitrate 10 mg L−1
Total Phosphorus (for lentic environments)0.03 mg L−1
Note: Source: CONAMA (2005) [9] 1.
Table 3. Images used for the elaboration of the land use and occupation maps.
Image Date 1Sensor 1Orbit and Point 1
19 September 1998Landsat 5216-066
26 September 1998Landsat 5217-065
26 September 1998Landsat 5217-066
14 September 2008Landsat 5216-066
21 September 2008Landsat 5217-065
21 September 2008Landsat 5217-066
25 August 2018Landsat 8216-066
17 September 2018Landsat 8217-065
17 September 2018Landsat 8217-066
Note: Source: USGS 1.
Table 4. Mean, standard deviation, and root mean square Error (RMSE) values for the observed HidroWeb online platform (ANA) and the Ministry of Regional Development of Brazil (MDR) data and estimated SUPer data (Values are in mg L−1).
VARIABLES
Collection DateOD (ANA/MDR) 2OD (SUPer) 3N (ANA/MDR) 2N (SUPer) 3P (ANA/MDR) 2P (SUPer) 3
12 December 20197.16.90.081.10.060.24
11 April 20197.86.90.140.50.10.37
18 September 20195.98.10.080.20.20.0
18 June 20197.38.10.080.30.070.0
26 March 20196.06.00.091.40.10.3
19 June 20186.98.10 ¹0.10.10.01
21 March 20185.16.60 ¹4.60.30.9
21 March 20179.17.30.321.60.30.08
20 July 20168.58.40 ¹0.40.10.01
27 April 20158.87.50.50.70.40.06
8 October 20147.58.21.11.30.60.002
Average7.37.50.31.10.20.2
Standard Deviation1.20.70.31.20.20.3
RMSE1.10.80.2
Note: There is no data available on the portal, so the value zero was assigned ¹. Source: HidroWeb (ANA) and MDR 2 and SUPer 3.
Table 5. Data for mean, standard deviation, minimum, and maximum value for the variables of dissolved oxygen, nitrate, and total phosphorus between the years 1963–2021, for the Nilo Coelho Reservoir, Terra Nova, Pernambuco, Brazil.
VariableAnalyses
AverageStandard DeviationMinimum ValueMaximum Value
Dissolved oxygen (mg L−1)6.42.50.08.8
Nitrate (mg L−1)1.62.50.019.1
Total Phosphorus (mg L−1)0.40.80.05.8
Table 6. Classification and land use for the Terra Nova Watershed, Pernambuco, Brazil, for the years 1998, 2008, and 2018.
YearLand Use and Occupancy Classes
WaterCaatingaExposed Soil/Urban AreasAgriculture/Pastureland
(km2)%(km2)%(km2)%(km2)%
1998140.3369975.75371163213
2008380.8366375217493219.2
20186313005622465156832
Total Area (km2)4882
Disclaimer/Publisher’s Note: The statements, opinions and data contained in all publications are solely those of the individual author(s) and contributor(s) and not of MDPI and/or the editor(s). MDPI and/or the editor(s) disclaim responsibility for any injury to people or property resulting from any ideas, methods, instructions or products referred to in the content.

