Article

Comparative Application of Rain Gauge, Ground- and Space-Borne Radar Precipitation Products for Flood Simulations in a Dam Watershed in South Korea

K-water Research Institute, K-water (Korea Water Resources Corporation), Daejeon 34045, Republic of Korea
Water 2023, 15(16), 2898; https://doi.org/10.3390/w15162898
Submission received: 18 July 2023 / Revised: 3 August 2023 / Accepted: 8 August 2023 / Published: 11 August 2023
(This article belongs to the Section Hydrology)

Abstract

:
This study presents a comparative analysis of flood simulations using rain gauge, ground- and space-borne radar precipitation products. The objectives are to assess the effectiveness of two radar-based data sources, namely the Radar-AWS Rainrates (RAR) and Integrated Multi-satellite Retrievals for GPM (IMERG), in a dam watershed with gauge observations, and explore the modeling feasibility of integrating the half-hourly IMERG satellite precipitation in regions with ungauged or limited observational area. Two types of HEC-HMS models were developed, considering areal-averaged and spatially distributed gridded data simulations utilizing eight selected storm events. The findings indicate that the RAR data, although slightly underestimate precipitation compared to the gauge measurements, accurately reproduce hydrographs without requiring parameter adjustments (Nash–Sutcliffe efficiency, ENS, 0.863; coefficient of determination, R2, 0.873; and percent bias, PBIAS, 7.49%). On the other hand, flood simulations using the IMERG data exhibit lower model efficiency and correlation, suggesting potential limitations in ungauged watersheds. Nevertheless, with available discharge data, the calibrated model using IMERG shows prospects for utilization (ENS 0.776, R2 0.787, and PBIAS 7.15%). Overall, this research offers insights into flood simulations using various precipitation products, emphasizing the significance of reliable discharge data for accurate hydrological modeling and the need for further evaluation of the IMERG product.

1. Introduction

Precipitation is a key meteorological forcing variable in hydrologic modeling for flood simulation. Conventionally, areal precipitation data from rain gauges, estimated using an averaged method, have been adopted as an adequate input for simulating the rainfall-runoff process in watersheds due to its relatively simple application [1]. Recently, remotely sensed precipitation data obtained from ground- and space-borne radar systems have become available, offering high spatiotemporal resolution and wide coverage, particularly in data-scarce or ungauged regions [2,3,4]. These advancements contribute to improved accuracy and provide insights into hydrologic modeling for flood simulation and forecasting. In particular, the utilization of satellite-based (i.e., space-borne radar) precipitation data has shown significant potential, especially in ungauged regions and developing countries where ground-based measurements are limited. Notably, the Global Precipitation Measurement (GPM) mission, developed as a specialized observation satellite, has played a crucial role in providing valuable scientific progress and data for areas lacking comprehensive in situ measurements [5,6,7].
The Global Precipitation Measurement (GPM) Core Observatory was launched in February 2014 to provide next-generation global rain and snow observations in near real-time. With many years’ worth of calibrated and validated precipitation estimates, GPM’s data are being used for scientific studies [5,6]. The Integrated Multi-satellitE Retrievals for GPM (IMERG) precipitation products were released in early 2015 [8]. This high-resolution precipitation product is available at 0.1° latitude/longitude spatial and half-hourly temporal resolutions in three modes: early, late, and final runs based on latency and accuracy, covering the region between 65° S and 65° N latitudes. The IMERG is currently accessible from June 2000 to present, with a long-duration archive for scientific research and near real-time applications such as disaster monitoring [7,9]. The GPM mission has opened new horizons for precipitation observations in ungauged regions through a constellation of satellites and ground systems from partner agencies located in the United States, Japan, Europe, and India, providing the IMERG products on a global scale [5,7]. The utilization of these products for hydrological modeling and prediction aligns with one of the primary scientific objectives of the GPM mission. However, uncertainties remain regarding the accuracy and suitability of applying these products to ungauged regions.
Research efforts to investigate the hydrological utility of these IMERG products have been conducted [10,11,12,13,14,15,16], in addition to the previously performed initial studies on rainfall calibration and validation across various regions worldwide for assessing their applicability. Li et al. [10], Yuan et al. [11], Wang et al. [12], Lu et al. [13], Su et al. [14], Ji et al. [15], and Li [16] evaluated the applicability of the IMERG precipitation estimates for hydrologic modeling at the hourly, sub-daily, and daily scales using the CREST [10], GXAJ [11], VIC [12,13,14,15], and SWAT [16] models, respectively. The findings from these studies showed evidence of the significant potential of the IMERG final run products in hydrological modeling. However, they exhibited poor correlation with gauge observations, particularly at the hourly and sub-daily scales. Thus, they can be utilized as the sole available source of precipitation in regions where ground observations are unavailable. Furthermore, prominent studies have utilized the daily IMERG product, focusing on its direct application to hydrologic models: Tang et al. [17] evaluated its streamflow prediction utility using the CREST hydrologic model in the Ganjiang River basin, China. Xubieta et al. [18] performed MGB-IPH model simulations for obtaining streamflow over the Amazon Basin of Peru and Ecuador. He et al. [19] and Jiang et al. [20], respectively, applied the semi-distributed XAJ model in the upstream region of Lancang River and the Mishui basin, a tributary of the Xiangjiang River, in China. Mohammed et al. [21] employed SWAT in the Mekong Basin region to explore hydrologic flows for water availability study. Jiang and Bauer-Gottwein [22] assessed the performance of the HBV model in hydrological simulations across the climatically and topographically diverse mainland of China. Li et al. [23] and Zhang et al. [24] explored hydrologic evaluations of GPM data using a VIC model in a tropical monsoon basin of Thailand and a humid basin of China, respectively. These studies collectively demonstrate the various applications of the daily IMERG precipitation data in hydrologic modeling.
Similarly, hydrologic modeling applications have also been conducted for significant global river basins using the hourly products of IMERG precipitation for flood analysis: Sharif et al. [25] used a physically based distributed hydrologic model, GSSHA, to study a flood event in the city of Hafr Al Batin, Saudi Arabia. Tam et al. [26] assessed the performance of IMERG in the RRI model for runoff simulation and flood inundation mapping for the Kelantan River basin, Malaysia. Zhou et al. [27] investigated the accuracy of flood discharge simulation with the BTOP model in the Fuji River basin, Japan. Llauca et al. [28] and Chancay and Espitia-Sarmiento [29] adopted GR4H for evaluating the suitability of satellite precipitation for monitoring and forecasting floods in the Vilcanota River basin in the Cusco Region of Peru and the Andean-Amazon basins, respectively. Yuan et al. [30] and Jiang et al. [31] presented the comprehensive studies on the feasibility and hydrologic utility of GPM IMERG for flood simulations over the Chindwin River and Mishui basins in China using XAJ, respectively. Gilewski and Nawalany [32], Saouable et al. [33], Benkirane et al. [34], Min et al. [35], Tang et al. [36], Soo et al. [37], and Patel et al. [38] applied the HEC-HMS model to the river basins in Poland (Upper Skawa River), Morocco (Ghdat River and Tensift River), China (Xin’an River and Shouxi River), Malaysia (Langat River), and India (Upper Ganga River) for flood modeling, respectively. Nonetheless, these IMERG-used flood analyses lack sufficient evaluation of the modeling accuracy compared to traditional methods that rely on gauge observations or precipitation estimates from weather radars, such as those conducted by Li et al. [10] and Gilewski and Nawalany [32]. Therefore, in order to expand the application of GPM precipitation data to ungauged watersheds, particularly in flood analysis, it is essential to conduct more comparative studies that assess the level of accuracy in the IMERG product-based flood simulation modeling by comparing it with those of well-established precipitation estimates (i.e., rain gauge observation and ground-borne radar precipitation).
In South Korea, the availability of a robust in situ data infrastructure for rainfall observation, which includes numerous rain gauges and a ground-based radar system for precipitation estimation, provides significant advantages for evaluating the precision of GPM IMERG space-borne radar precipitation products [39,40]. Moreover, South Korea’s mountainous topography, covering approximately 65% of the land, introduces an additional dimension to the assessment; the spatial distribution of precipitation during rainfall storm events exhibits high variability, especially in dam watersheds that represent typical mountainous terrain. This intricate pattern of rainfall and the resulting changes in the runoff outflow show complicated characteristics, enabling a comprehensive evaluation that captures the influence of the unique characteristics (i.e., amount and spatial variability) from different types of precipitation products in flood simulation. However, there have been only a few precipitation validation studies conducted in South Korea using GPM IMERG data [39,40,41,42], and none of them have directly applied it to flood hydrological analysis. Kim et al. [39] and Nguyen et al. [40] demonstrated the proof of GPM ground validation studies using the radar network and gauge observations, respectively. Kim et al. [41] assessed precipitation products from GPM using gauge-based precipitation data of Far East Asia during the pre-monsoon and monsoon seasons. Lee et al. [42] implemented a validation of GPM IMERG by comparing it to multiple gauge-based analysis products (e.g., HRPPs and CMORPH) over East Asia. Therefore, it is necessary to conduct a study that explores the application of GPM IMERG precipitation data in hydrologic flood simulation, compares the modeling results with rain gauge observations and ground-based radar precipitation estimates in data-rich regions. With that, the suitability of space-borne satellite radar precipitation data in flood simulations also can be investigated.
Hence, this study aims to perform a comparative application of rain gauge, ground- and space-borne radar precipitation products for flood simulations, specifically focusing on evaluating the effectiveness of the half-hourly GPM IMERG final run product using the HEC-HMS model in the Yongdam dam watershed—a representative dam area characterized by mountainous terrain and an abundance of monitoring stations (water level, discharge, etc.) and data in South Korea. By addressing the existing research gaps, this study endeavors to implement a rigorous scientific investigation and analyze the comparative modeling results in regions where observational data are relatively abundant. Furthermore, this study seeks to evaluate the effectiveness of incorporating satellite precipitation data (i.e., GPM IMERG; space-borne radar product) into flood hydrological modeling simulations in regions with limited observational data.

2. Materials and Methods

2.1. Study Area

The target watershed of this study is the Yongdam Dam, located in the upper reaches of the Geum River in South Korea, between 35°35′ N to 36°00′ N and 127°20′ E to 127°45′ E. It encompasses Chuncheongnam-do, Jeollabuk-do, and Gyeongsangnam-do, including the counties of Muju, Jinan, and Jangsu. The study area exhibits a temperate climate, and its precipitation patterns are significantly influenced by the East Asian monsoon system, with notable rainfall during the summer months. The watershed area covers 930 km2, which accounts for approximately 9.5% of the total Geum River basin. The Yongdam Dam watershed mainly consists of eight sub-watersheds, five inflowing streams, and the Yongdam Dam, which has a height of 70 m, a length of 498 m, and a total storage capacity of 815 million m3. Also, it has a total of 22 operational observation stations for the production of hydro-meteorological data, including water level/flow, precipitation, soil moisture, and evapotranspiration (Figure 1).

2.2. Data

2.2.1. Land Surface Data

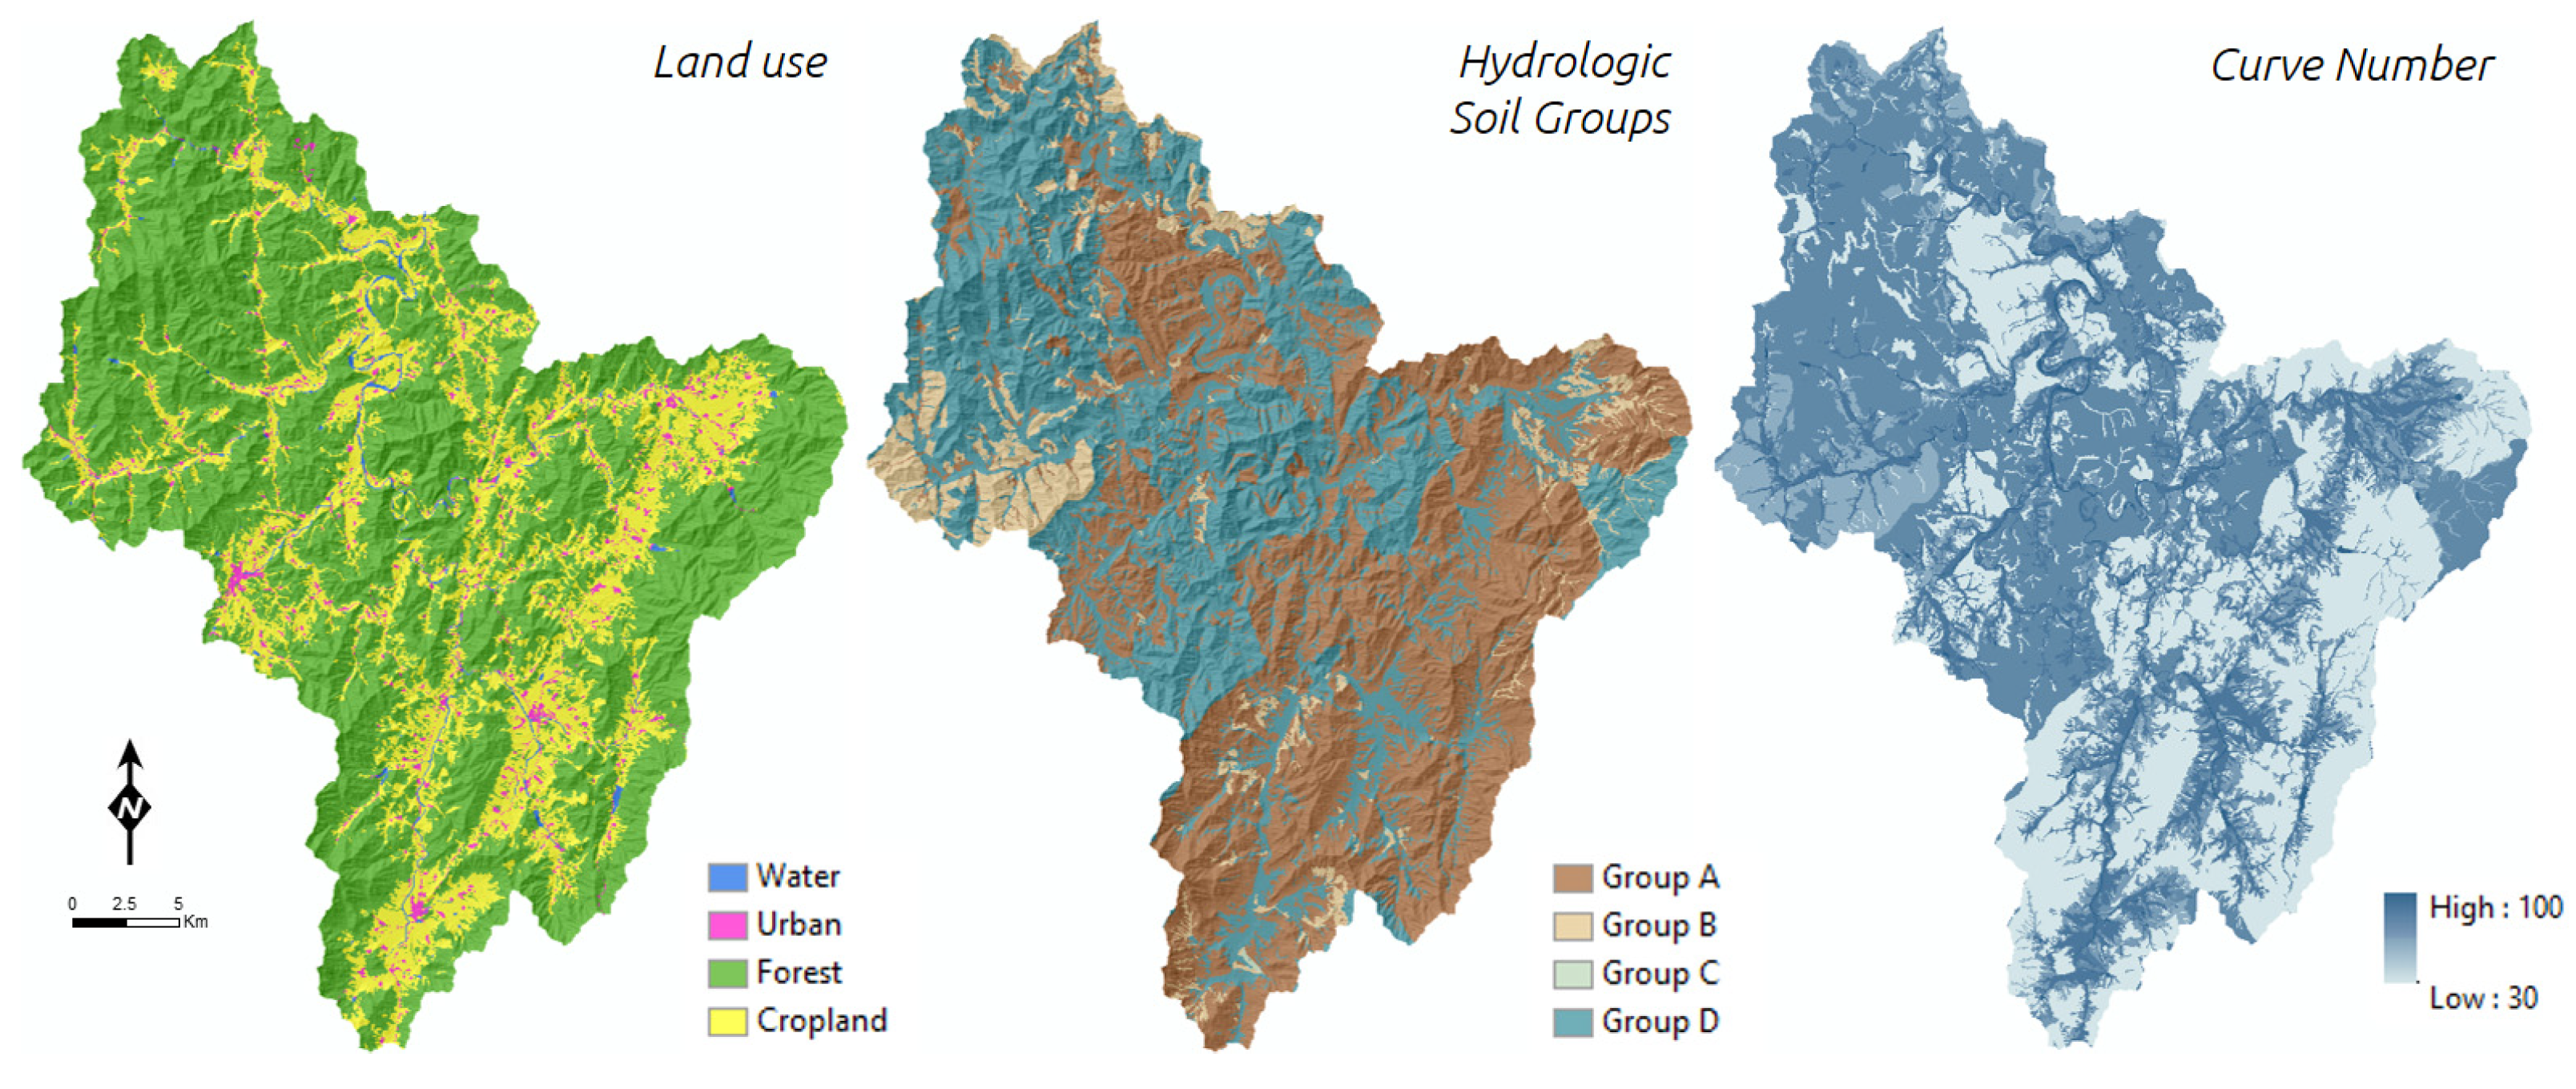
The hydrologic model, which is necessary for flood simulations, is typically constructed based on land surface data (geo-spatial information) such as a Digital Elevation Model (DEM), land cover, and soil data. In this study, a 1-arcsecond DEM with a resolution of approximately 30 m was obtained from the National Geographic Information Institute’s Land Information Platform [43]. For land cover and soil data, the 1:25,000 scale subdivision land cover map and the detailed soil map provided by the Ministry of Environment’s Environmental Geographic Information Service [44] and the National Institute of Agricultural Sciences’ Korean Soil Information System [45] were utilized, respectively. Figure 2 illustrates the secondary datasets of land cover classification, Hydrologic Soil Groups (HSGs), and Curve Numbers processed from the original land surface data for the hydrologic model development. It can be observed that the Yongdam Dam watershed is predominantly composed of mountainous areas and agricultural areas, accounting for 70.6% and 25.9%, respectively.

2.2.2. Gauged Data

Hourly precipitation and discharge observations were obtained from seven rain gauges and six water level/flow stations, respectively, over the Youngdam Dam watershed, provided by the Ministry of Environment’s Water Resources Management Information System [46]. The rainfall amounts measured with these gauges were utilized as input data in hydrological modeling to enable a comparison study with other precipitation products. Specifically, the Thiessen polygon method was employed to calculate the basin average precipitation. Discharge data were collected to facilitate the calibration and validation of the constructed hydrological model by comparing them with the simulated flow outputs. Table 1 provides the location information for each observation station.

2.2.3. Ground-Borne Radar Precipitation Product (RAR)

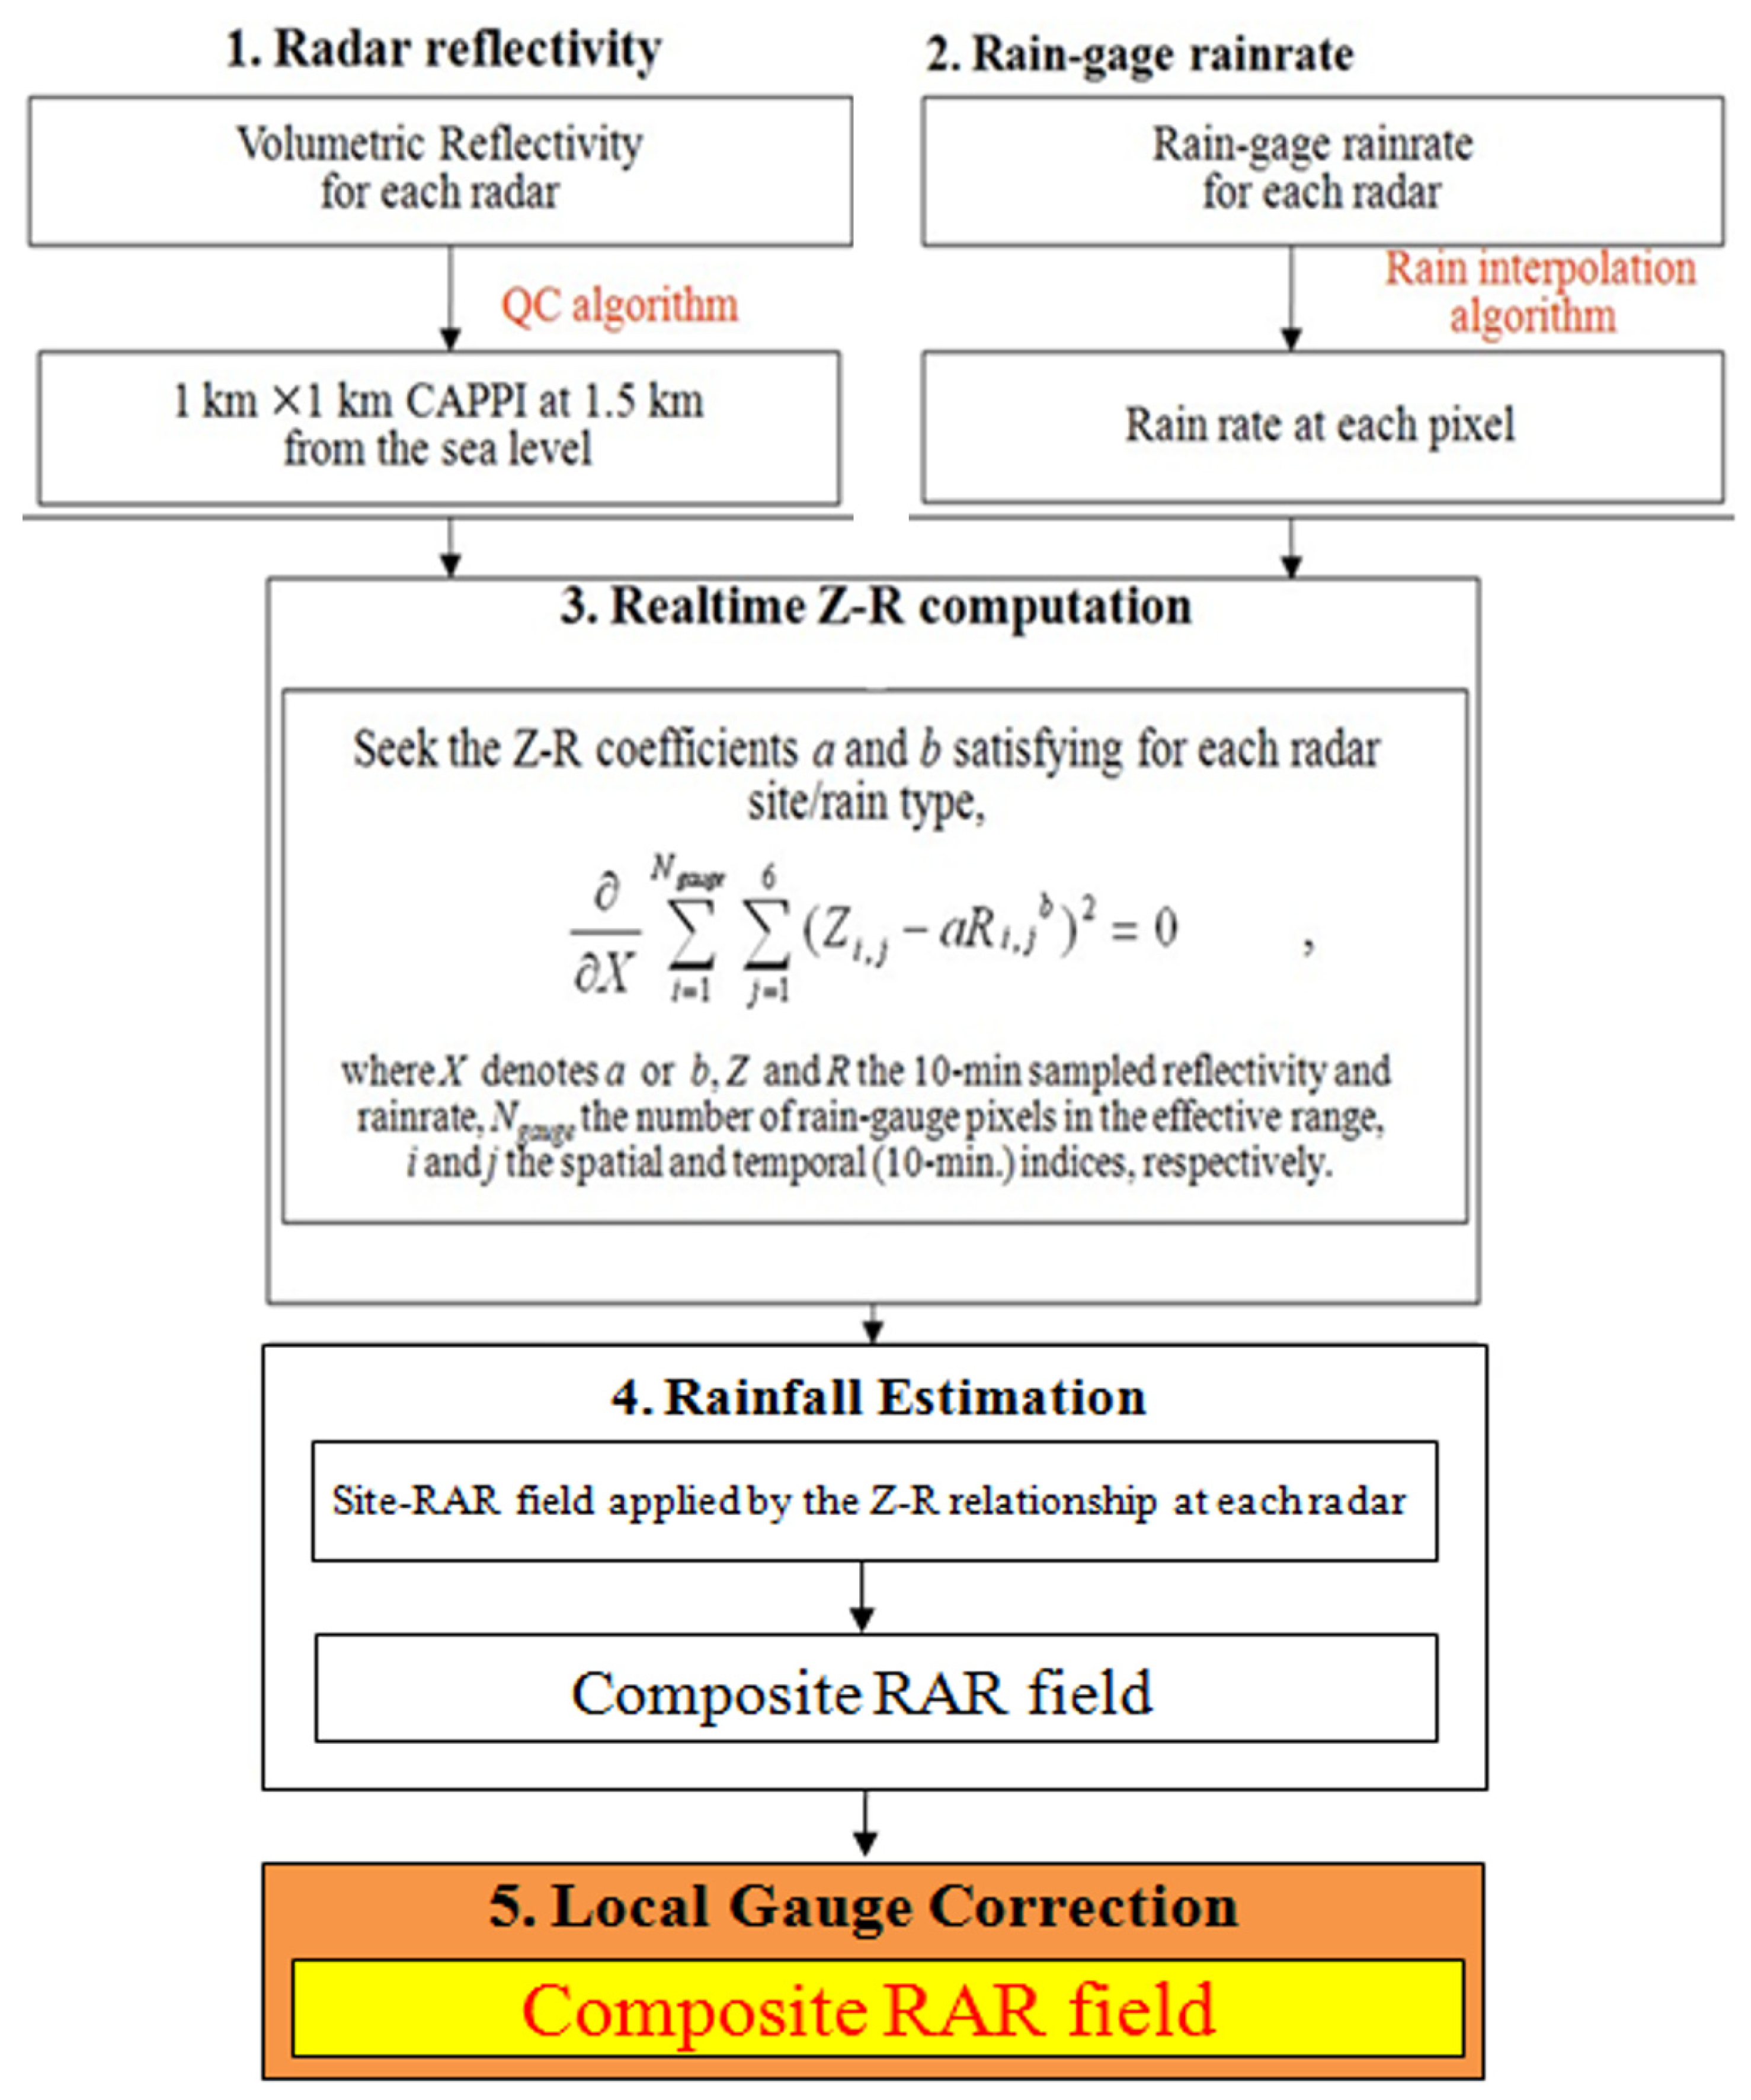
The Radar-AWS Rainrates (RAR) is a data product developed by the Korea Meteorological Administration (KMA) with the objective of utilizing precipitation forecasts. It provides quantitative estimates of real-time rainfall by applying the Z-R relationship, which is derived from radar reflectivity (Z) and rain gauge measurements (R). The RAR synthesis used in this study incorporates the algorithm of RAR version 2.0, which was enhanced and implemented from October 2015 onwards [47]. This version includes the Local Gauge Correction (LGC) technique, which is an enhancement of the Inverse Distance Weighting (IDW) method. The LGC approach applies weights that account for discrepancies between measurements from Automated Weather Stations (AWSs) and values derived from radar, allowing for the correction of ground radar-based gridded precipitation [48]. Detailed methodology regarding this technique can be found in Lee et al. [49], and Figure 3 illustrates the comprehensive process of the RAR algorithm, incorporating the Local Gauge Correction method [47,50].
Additionally, Table 2 presents specific details regarding the RAR data, including file names, resolution, data structure, and storage format. As indicated in the table, RAR data is primarily provided in a binary format, which requires conversion into a human-readable format (e.g., ASCII) for applications such as flood analysis and hydrological modeling. The RAR data are produced at 10 min intervals and represent a grid-based precipitation synthesis with a spatial resolution of 1 km. For reference, the “Lambert Conformal Conic projection” is adopted as a Projected Coordinate System (PCS) for RAR, which minimizes distortion when representing areas, and it finds extensive usage in hydrological modeling and watershed studies.

2.2.4. Space-Borne Radar Precipitation Product (IMERG)

The space-borne radar precipitation data utilized in this study is derived from the Integrated Multi-satellitE Retrievals for GPM (IMERG) product, which is produced globally by the NASA Goddard Space Flight Center. IMERG combines data from the core Global Precipitation Measurement (GPM) satellite and a constellation of around 10 supporting satellites equipped with Microwave Imagers [5]. This dataset provides gridded precipitation estimates with a resolution of approximately 10 km (a grid size of 0.1° × 0.1°) within the latitude range of 60° N to 60° S in the WGS84 coordinate system. The temporal resolution ranges from as frequent as every 30 min to daily and monthly intervals, with options available for 3 h, 3 days, and 7 days aggregations to meet various research requirements.
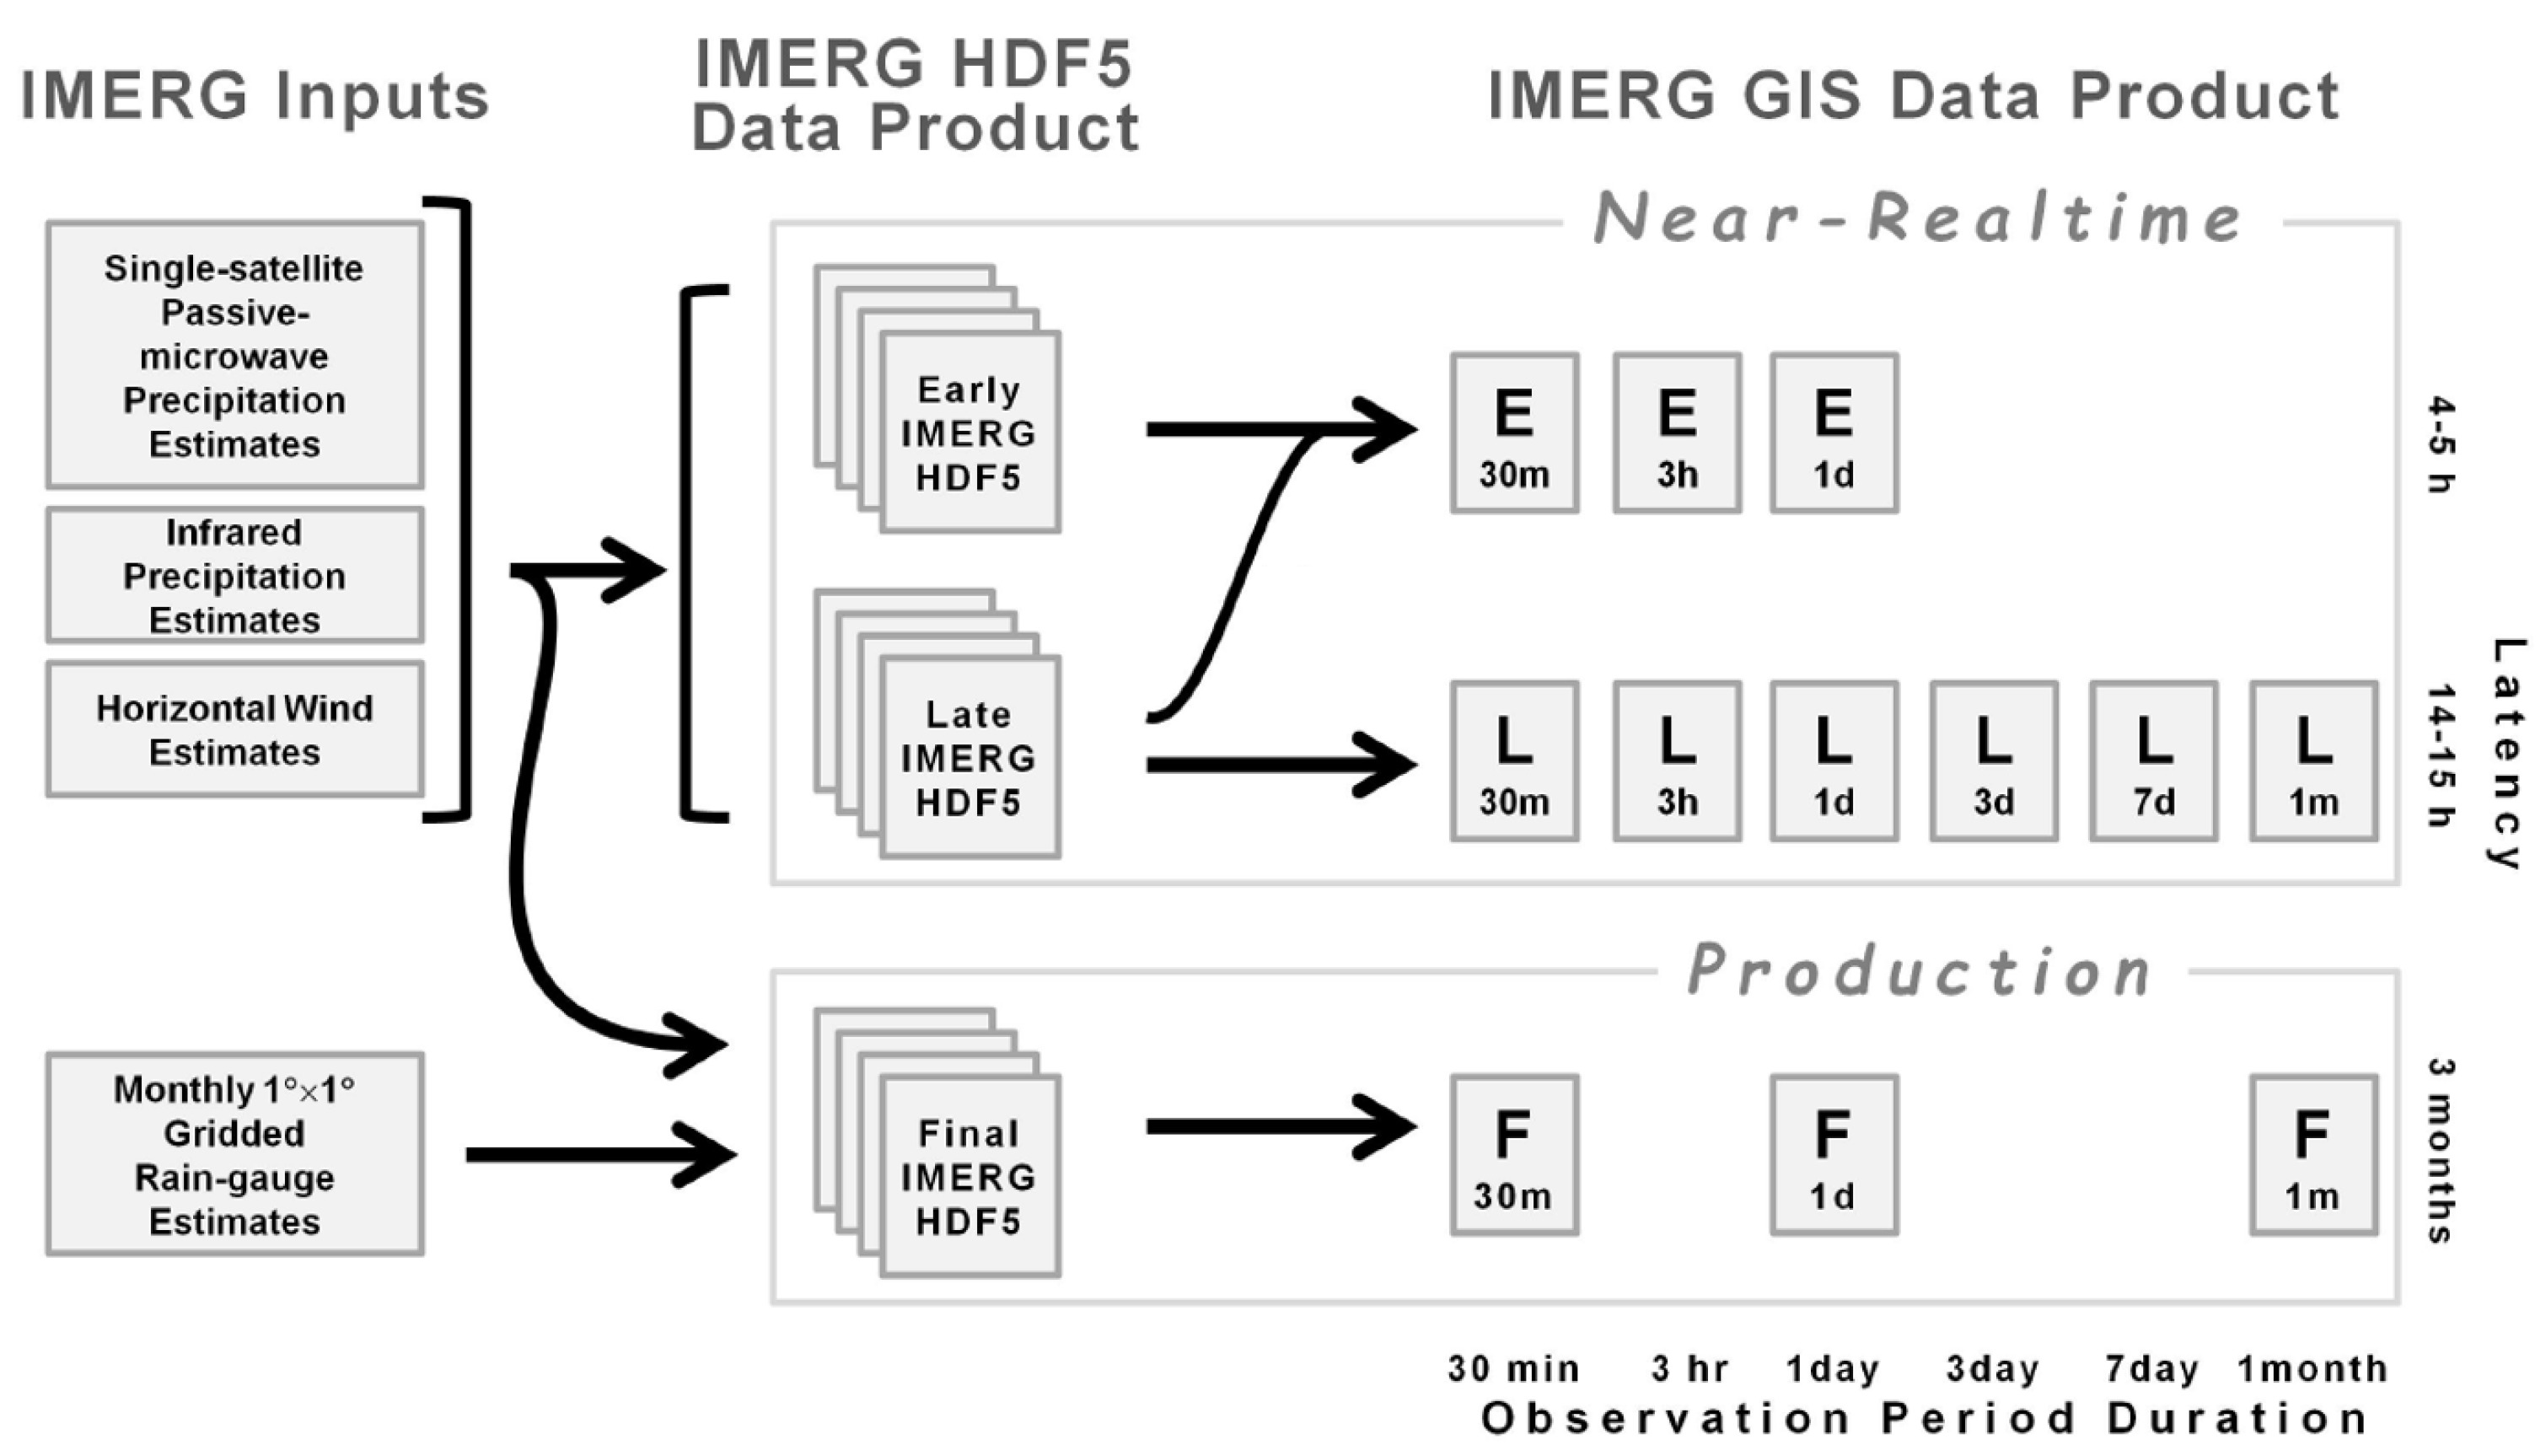
IMERG offers data in different stages, namely “Early”, “Late”, and “Final” runs, catering to various application needs. Each run has a distinct latency period, with durations ranging from a few hours for rapid response applications like flash flood observations to several months for research purposes; approximately 4–5 h (suitable for flash flood observations), 14–15 h (agricultural applications), and around 3 months (research data) [9]. These runs facilitate the timely availability of precipitation information for diverse user requirements. The data production system is depicted in Figure 4, providing insights into the data and runs involved.
The IMERG product continually evolves, with version 06 being the most recent iteration. It incorporates advancements and updates to improve the accuracy and reliability of the precipitation estimates. Notably, the integration of the Tropical Rainfall Measuring Mission (TRMM) satellite-based TMPA with IMERG has further enhanced the dataset, offering a comprehensive satellite-based precipitation record from 2000 to present [8]. This integration enables the analysis of long-term precipitation patterns and trends for a wide range of research applications, including hydrological modeling. The specifics of the IMERG data can be found in Table 3. The data are primarily provided in “.HDF5” or “.nc4” file formats, and the grid images are recorded in the WGS84 geographic coordinate system, allowing for seamless integration with other geospatial data and enabling various geoprocessing tasks such as coordinate projection. These characteristics make the IMERG dataset suitable for hydrological modeling studies and watershed analyses.

2.3. Hydrologic Model

HEC-HMS (Hydrologic Engineering Center’s Hydrologic Modeling System) is a widely used hydrological model developed by the US Army Corps of Engineers (USACE) for applications such as flood analysis and simulation [51]. It is primarily classified as a lumped hydrologic model as it predominantly utilizes relatively simple methods such as the SCS Curve Number, unit hydrograph, and Muskingum routing for estimating effective rainfall, watershed transformation, and river routing calculations, respectively. Although it mainly employs point-based data (i.e., rain gauge observation), it is possible to construct a model that incorporates gridded radar-based rainfall data by utilizing the tools of HEC-GeoHMS (Geospatial Hydrologic Modeling Extension) [52] and the ModClark (modified Clark) method [1,53,54]. Figure 5 depicts the schematic diagram of the ModClark watershed transformation method, which is a modification of Clark’s unit hydrograph method [55] to enable the simulation of spatially distributed grid-based rainfall data.
In this approach, individual unit hydrographs are computed for each grid cell, taking into account the transitions between cells. The determination of the unit hydrograph for each grid cell involves the consideration of the time of concentration, which relates to the travel time of water through the watershed, as described in Equation (1). These unit hydrographs undergo storage attenuation processes across the entire watershed, as indicated with Equation (2), resulting in the generation of individual cell hydrographs at the watershed outlet. The storage attenuation can be attributed to the overall retention characteristics of the watershed. By convolving these individual cell hydrographs with excess rainfall for each grid cell, the direct rainfall-runoff hydrograph for the entire watershed can be obtained.
t r a v e l   t i m e c e l l = T c t r a v e l   l e n g t h c e l l t r a v e l   l e n g t h m a x
O i = t R + 0.5 × t I a v g + 1 t R + 0.5 × t O i 1
where Tc refers to the time of concentration for the entire watershed [T], Oi represents the unit discharge at time i [L3T−1], R denotes the storage coefficient [T], Iavg represents the average inflow between time i − 1 and i [L3T−1], and ΔT signifies the time interval [T].

2.4. Methods

2.4.1. Flood Events Selection

For the flood simulations in this study, one or two relatively independent flood events per year from 2014 to 2018 that occurred in the Youngdam Dam watershed were selected. The selection of independent events is necessary due to the adoption of the event-based SCS Curve Number method in the HEC-HMS model for estimating effective rainfall and avoiding inaccurate results that can arise from the use of continuous flood events [4]. Table 4 presents the observed rainfall amounts from seven rain gauges and provides areal average precipitation of the watershed, peak discharge, and total runoff for a total of eight selected flood events. In the years 2015–2017, the selection of relatively smaller-scale floods was inevitable because of prolonged drought conditions. The largest flood event among the selected cases occurred in August 2018, with a total precipitation of approximately 300 mm and a discharge of 2200 m3/s. It is important to note that the rainfall and streamflow data used in this study were obtained at an hourly time resolution and were utilized for performing the HEC-HMS model simulation and calibration.

2.4.2. Radar Precipitation Products Processing

Generally, spatially distributed grid-based rainfall data are represented as images in a specific coordinate system and file format. The RAR data utilize the Lambert Conformal Conic projection as its projected coordinate system, while the IMERG data use the WGS84 geographic coordinate system. Therefore, for the purpose of HEC-HMS hydrological modeling, several processing steps are required, including (1) data format conversion, (2) geo-referencing for coordinate system transformation, and (3) DSS file generation. In this study, a total of 2 or 3 data processing steps were performed for each image file. NCL (NCAR Command Language) and Python-based script programs were developed and employed for this purpose.
Table 5 outlines the overall data processing steps for spatially distributed grid-based rainfall data, specifically focusing on the procedures for RAR and IMERG datasets. The RAR dataset adopts the “Albers Equal-Area” map projection, while the IMERG dataset utilizes the “ITRF2000” coordinate system, both as the Standard Hydrologic Grid (SHG) for the HEC-HMS model. In the final stage of data processing, the “asc2dssGrid.exe” file provided by the USACE’s HEC-GridUtil is utilized to extract “.dss” files, which are directly used as precipitation input data for the HEC-HMS model.

2.4.3. HEC-HMS Model Development

To perform flood simulations using ground- and space-borne radar-based spatially distributed gridded precipitation products, the HEC-HMS model needs to be constructed using ArcGIS applications such as Arc Hydro [56] and HEC-GeoHMS [52]. This allows the incorporation of the ModClark method, which is a grid-based rainfall-runoff analysis approach, into the HEC-HMS model. In this study, in addition to the ModClark model, a model based on Clark’s watershed routing method, which has traditionally been applied as one of the lumped hydrologic modeling approaches, was also developed simultaneously. This enables the comparison of the flood simulations using the areal-averaged precipitation through spatial interpolation with Thiessen polygons with point data. For the construction of each model, the delineation of stream network and subbasins from the DEM was performed in Arc Hydro by setting a threshold of 3% of the total watershed area of the Youngdam Dam watershed. The specific calculations for runoff depth, watershed transformation, baseflow, and river reach routing in each hydrologic modeling process were configured using the methods described in Table 6 within the HEC-GeoHMS options.

2.4.4. Flood Simulation and Evaluation

The flood simulations of the constructed models were performed using the hourly gauged and radar-based rainfall data for the selected eight flood events. For each model, the model parameters were adjusted to derive simulated hydrographs that closely matched with the discharges at the six flow measurement stations within the Youngdam Dam watershed. In this study, unlike the typical calibration process of using a single parameter set for rainfall-runoff prediction models, each parameter was individually adjusted for model verification. By implementing this, the approach aimed to assess the effectiveness and accuracy of the spatially distributed gridded rainfall data and the ModClark method in analyzing the flood characteristics of the mountainous dam watershed, compared to the conventional method that uses gauge points for deriving the areal average rainfall. Equations (3)–(5) introduced in the study are statistical indicators used to compare and evaluate the simulated hydrographs against the observed discharge values. These indicators include Nash–Sutcliffe efficiency (ENS), coefficient of determination (R2), and percent bias (PBIAS (%)) to assess the agreement between the observed and simulated discharge values.
E N S = 1 i = 1 n ( O i S i ) 2 i = 1 n ( O i O ¯ ) 2
R 2 = i = 1 n ( O i O ¯ ) ( S i S ¯ ) i = 1 n ( O i O ¯ ) 2 i = 1 n ( S i S ¯ ) 2 2
P B I A S % = i = 1 n ( O i S i ) i = 1 n O i × 100
where Oi and Si represent the observed and simulated discharge, and O ¯ and S ¯ represent the mean values of the observed and simulated discharge, respectively.

3. Results and Discussion

3.1. Precipitation Estimates

3.1.1. Amounts

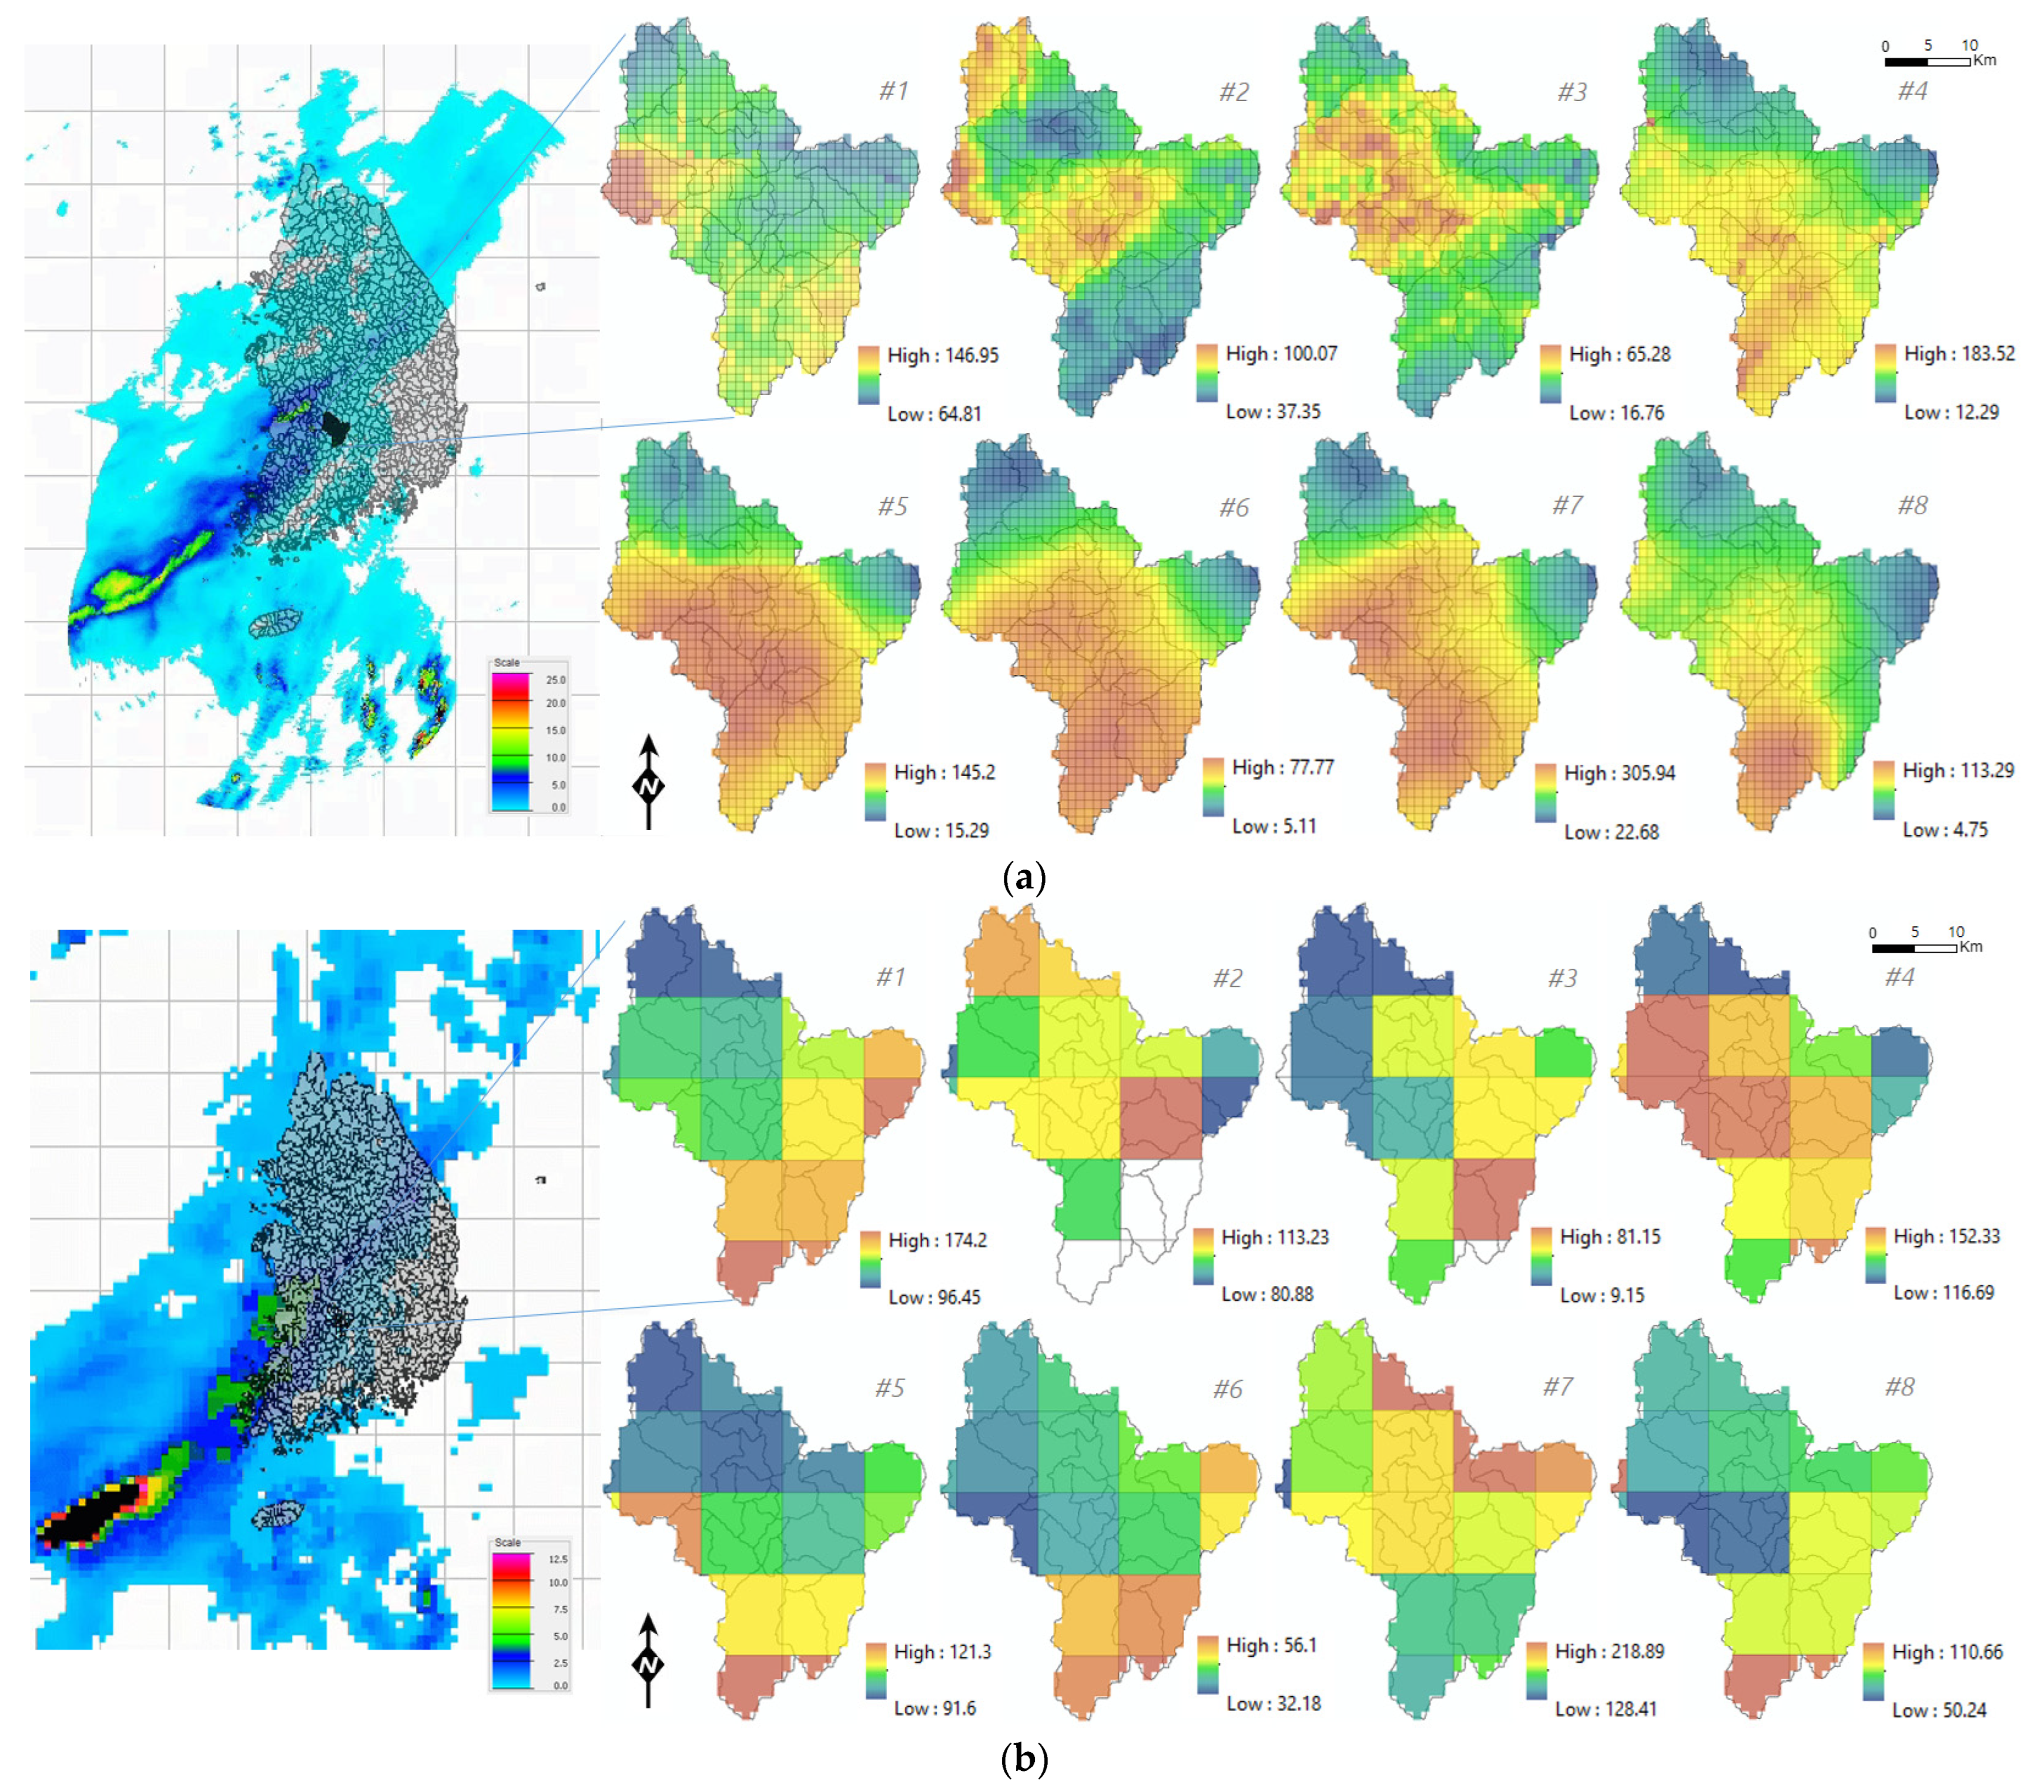
Table 7 compares the amounts of areal average precipitation total derived from seven rain gauges in the Yongdam Dam watershed with ground- and space-borne radar data. The areal-averaged values were calculated using Thiessen polygons for the gauged data, while the radar-based gridded data utilized the arithmetic mean over the grids. The table also presents the maximum and minimum values of the radar grid for each flood event.
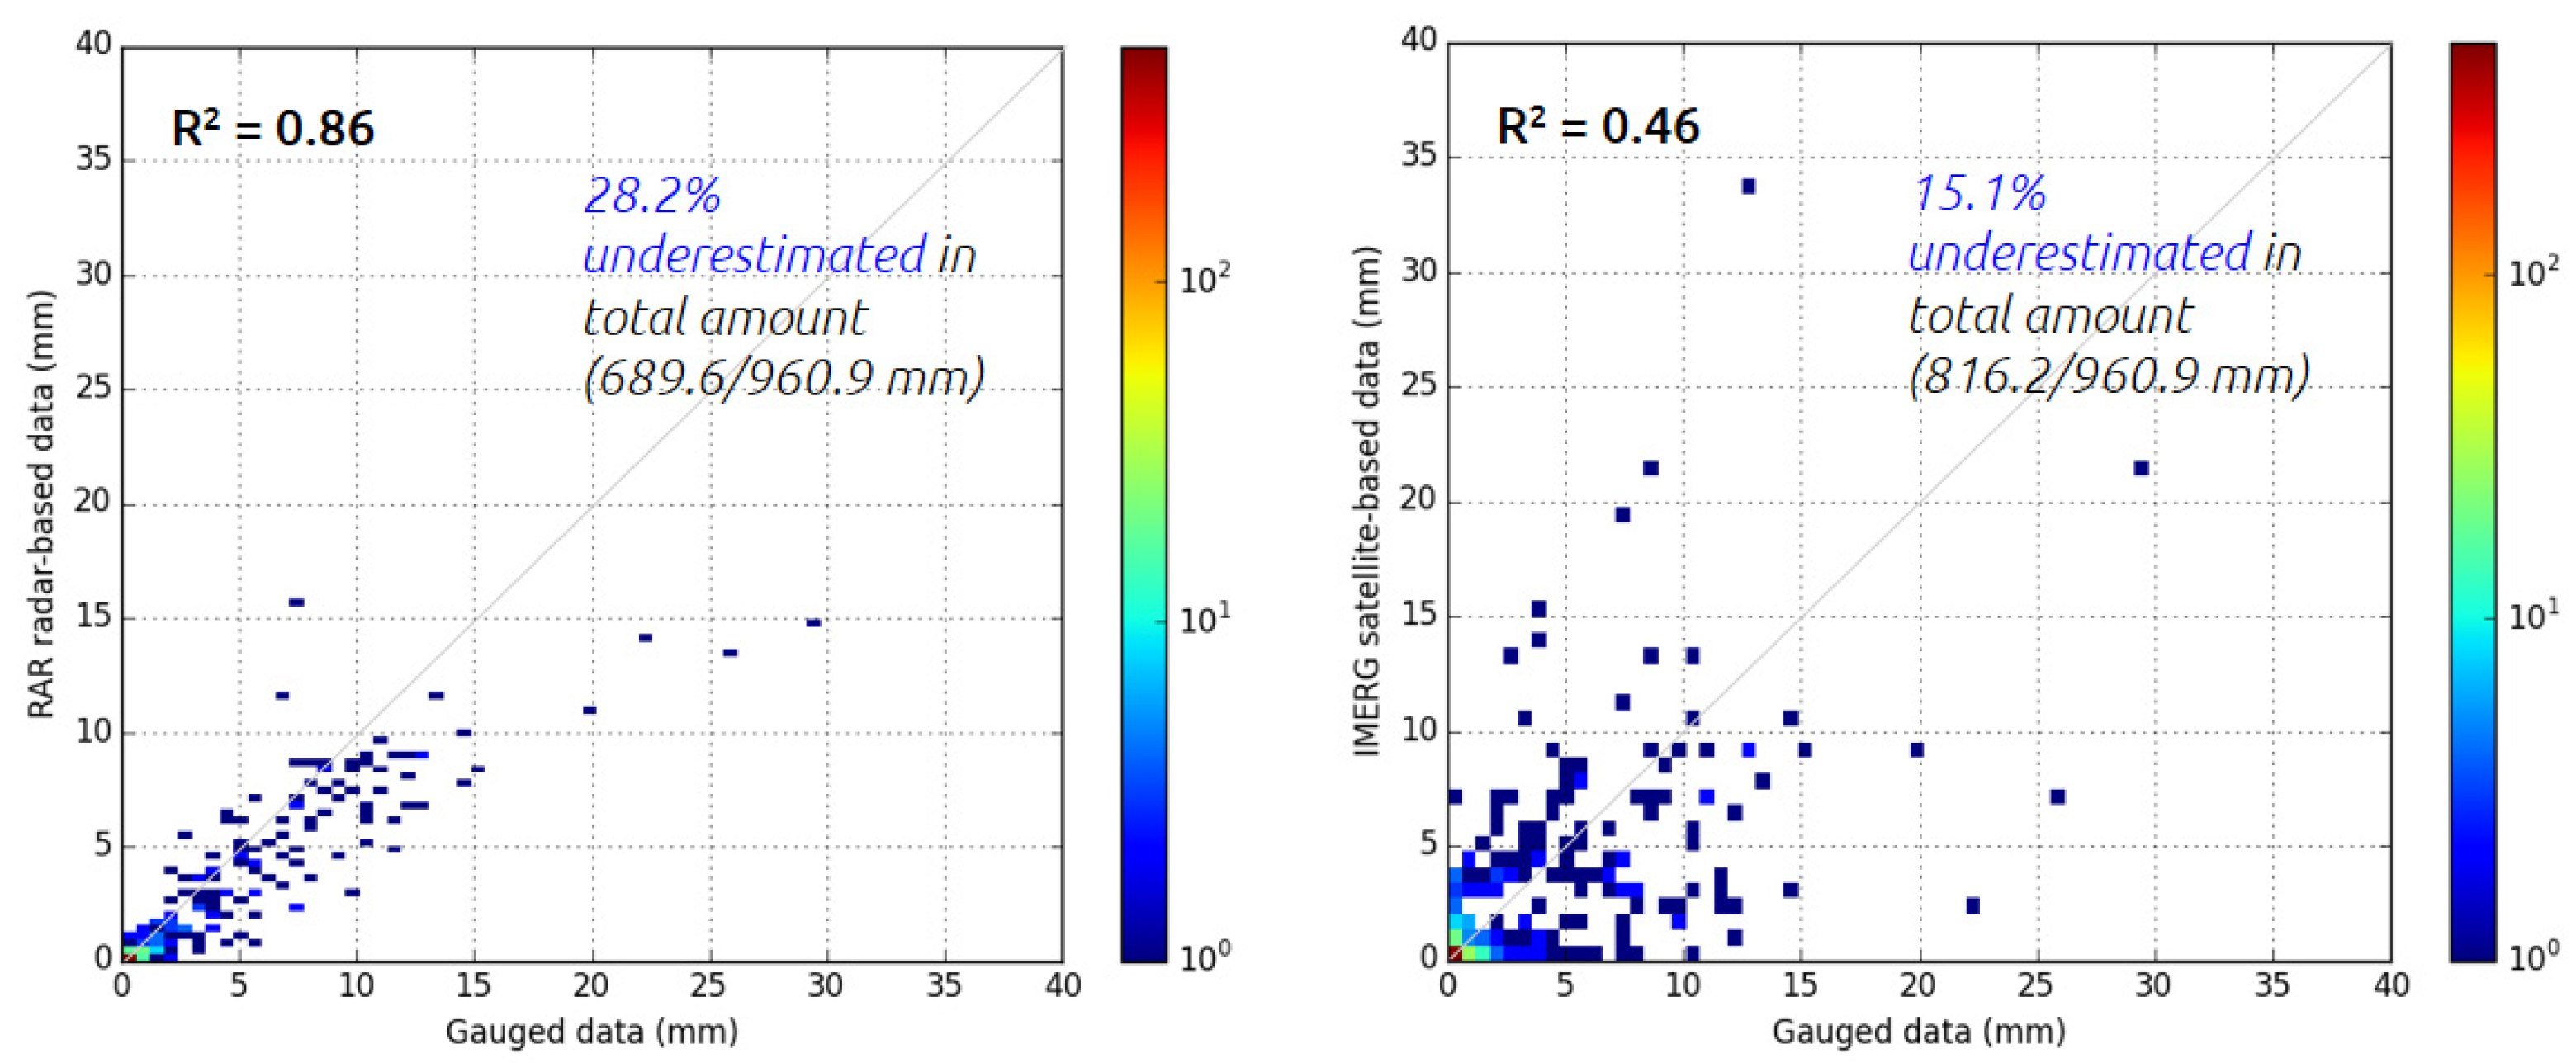
As evident from the comparison of total amounts in the table, precipitation based on ground-borne radar tends to slightly underestimate compared to the gauged values. On the other hand, space-borne radar precipitation includes some instances of overestimation in relation to the gauge observations. This trend is also apparent in Figure 6, which shows all hourly data for the flood events used in this study. For RAR, the total sum is 689.6 mm, and for IMERG, it is 816.2 mm, resulting in underestimations of 28.2% and 15.1%, respectively, in comparison with the gauged total of 960.9 mm. The correlation coefficients (R2) further provide insight into the relationship between the datasets. RAR illustrates a high correlation with the observations, with values of 0.86, while IMERG exhibits a significant difference in correlation, with a value of 0.46. Therefore, the relevant model parameter values were adjusted during the flood simulations to reduce the discrepancies between the IMERG outputs and the actual observations, and to incorporate them into the analysis.

3.1.2. Spatial Variability

The spatial distributions of the total cumulative gridded precipitation from ground- and space-borne radar for eight flood events, extracted using the aforementioned data processing methods, are depicted in Figure 7.
Figure 7a displays the 1 km × 1 km grid-based RAR precipitation total for each individual flood event. The varying precipitation values across different grids indicate that even within the same watershed, there can be regional differences in the rainfall amounts for the same event. While several factors may contribute to this, the similarity in distribution among six out of the eight events suggests that it is primarily influenced by the topographic characteristics of mountainous areas. Therefore, if the areal average precipitation data from rain gauges are used for flood simulations, the lack of deliberation for this spatial distribution may lead to inaccurate analysis results or difficulties in model calibration. On the other hand, Figure 7b represents the spatial distribution of IMERG precipitation data at an approximate resolution of 10 km (0.1° × 0.1° grid). Although there are differences in the total precipitation across grids, the spatial resolution of this IMERG dataset is less dense compared to the RAR data, which may pose some limitations for related analyses. Nevertheless, it is deemed to be highly useful for flood analysis in ungauged or global river basins where rainfall data are unavailable.

3.2. Model Development

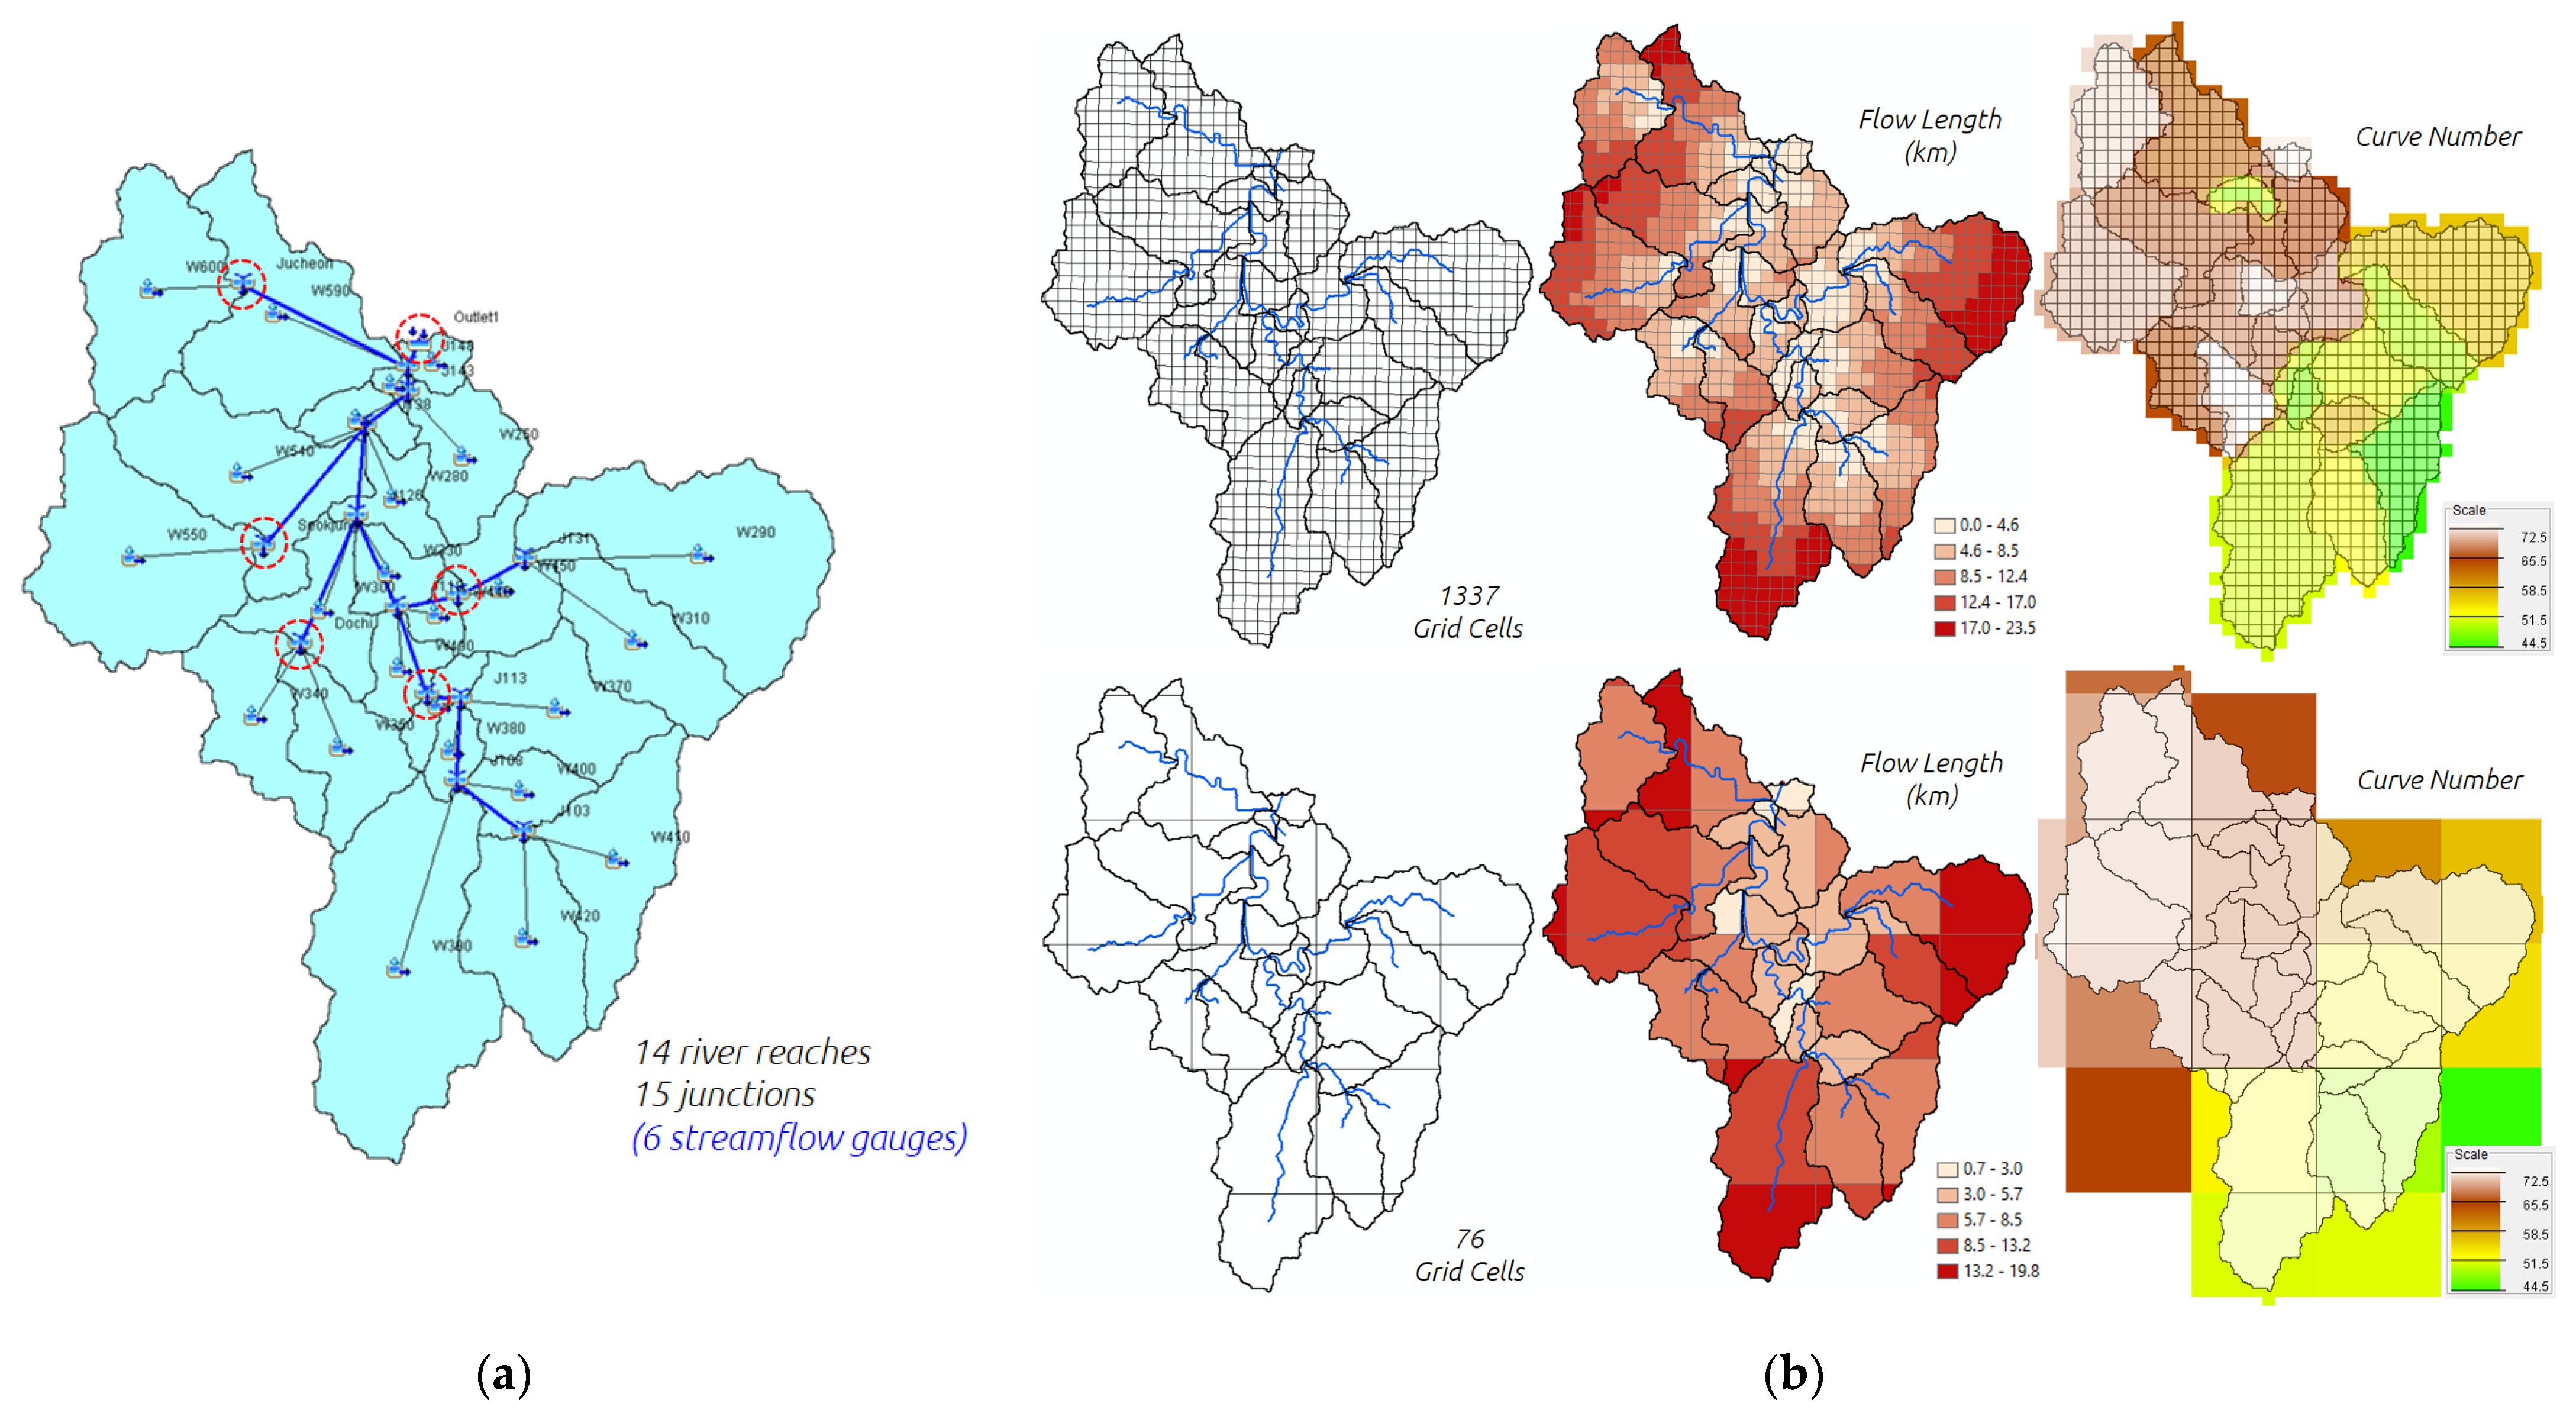
Two types of HEC-HMS models were constructed with different hydrological modeling approaches as presented in Figure 8. The first model, which applies Clark’s method, can simulate areal-averaged precipitation based on rain gauge observations, and it consisted of a total of 25 subbasins. The ModClark model, designed to utilize grid-based RAR and IMERG precipitation, includes 1337 and 76 analysis units of 1 and 10 km grid cells, respectively. In the ModClark model, the calculated flow lengths and the gridded Curve Number for each grid were incorporated as essential information for model development. In addition, discharge data from the gauging points of six upstream rivers and watershed outlet were also inputted to assess and verify the flood analysis results against the model simulated outputs.

3.3. Flood Simulations

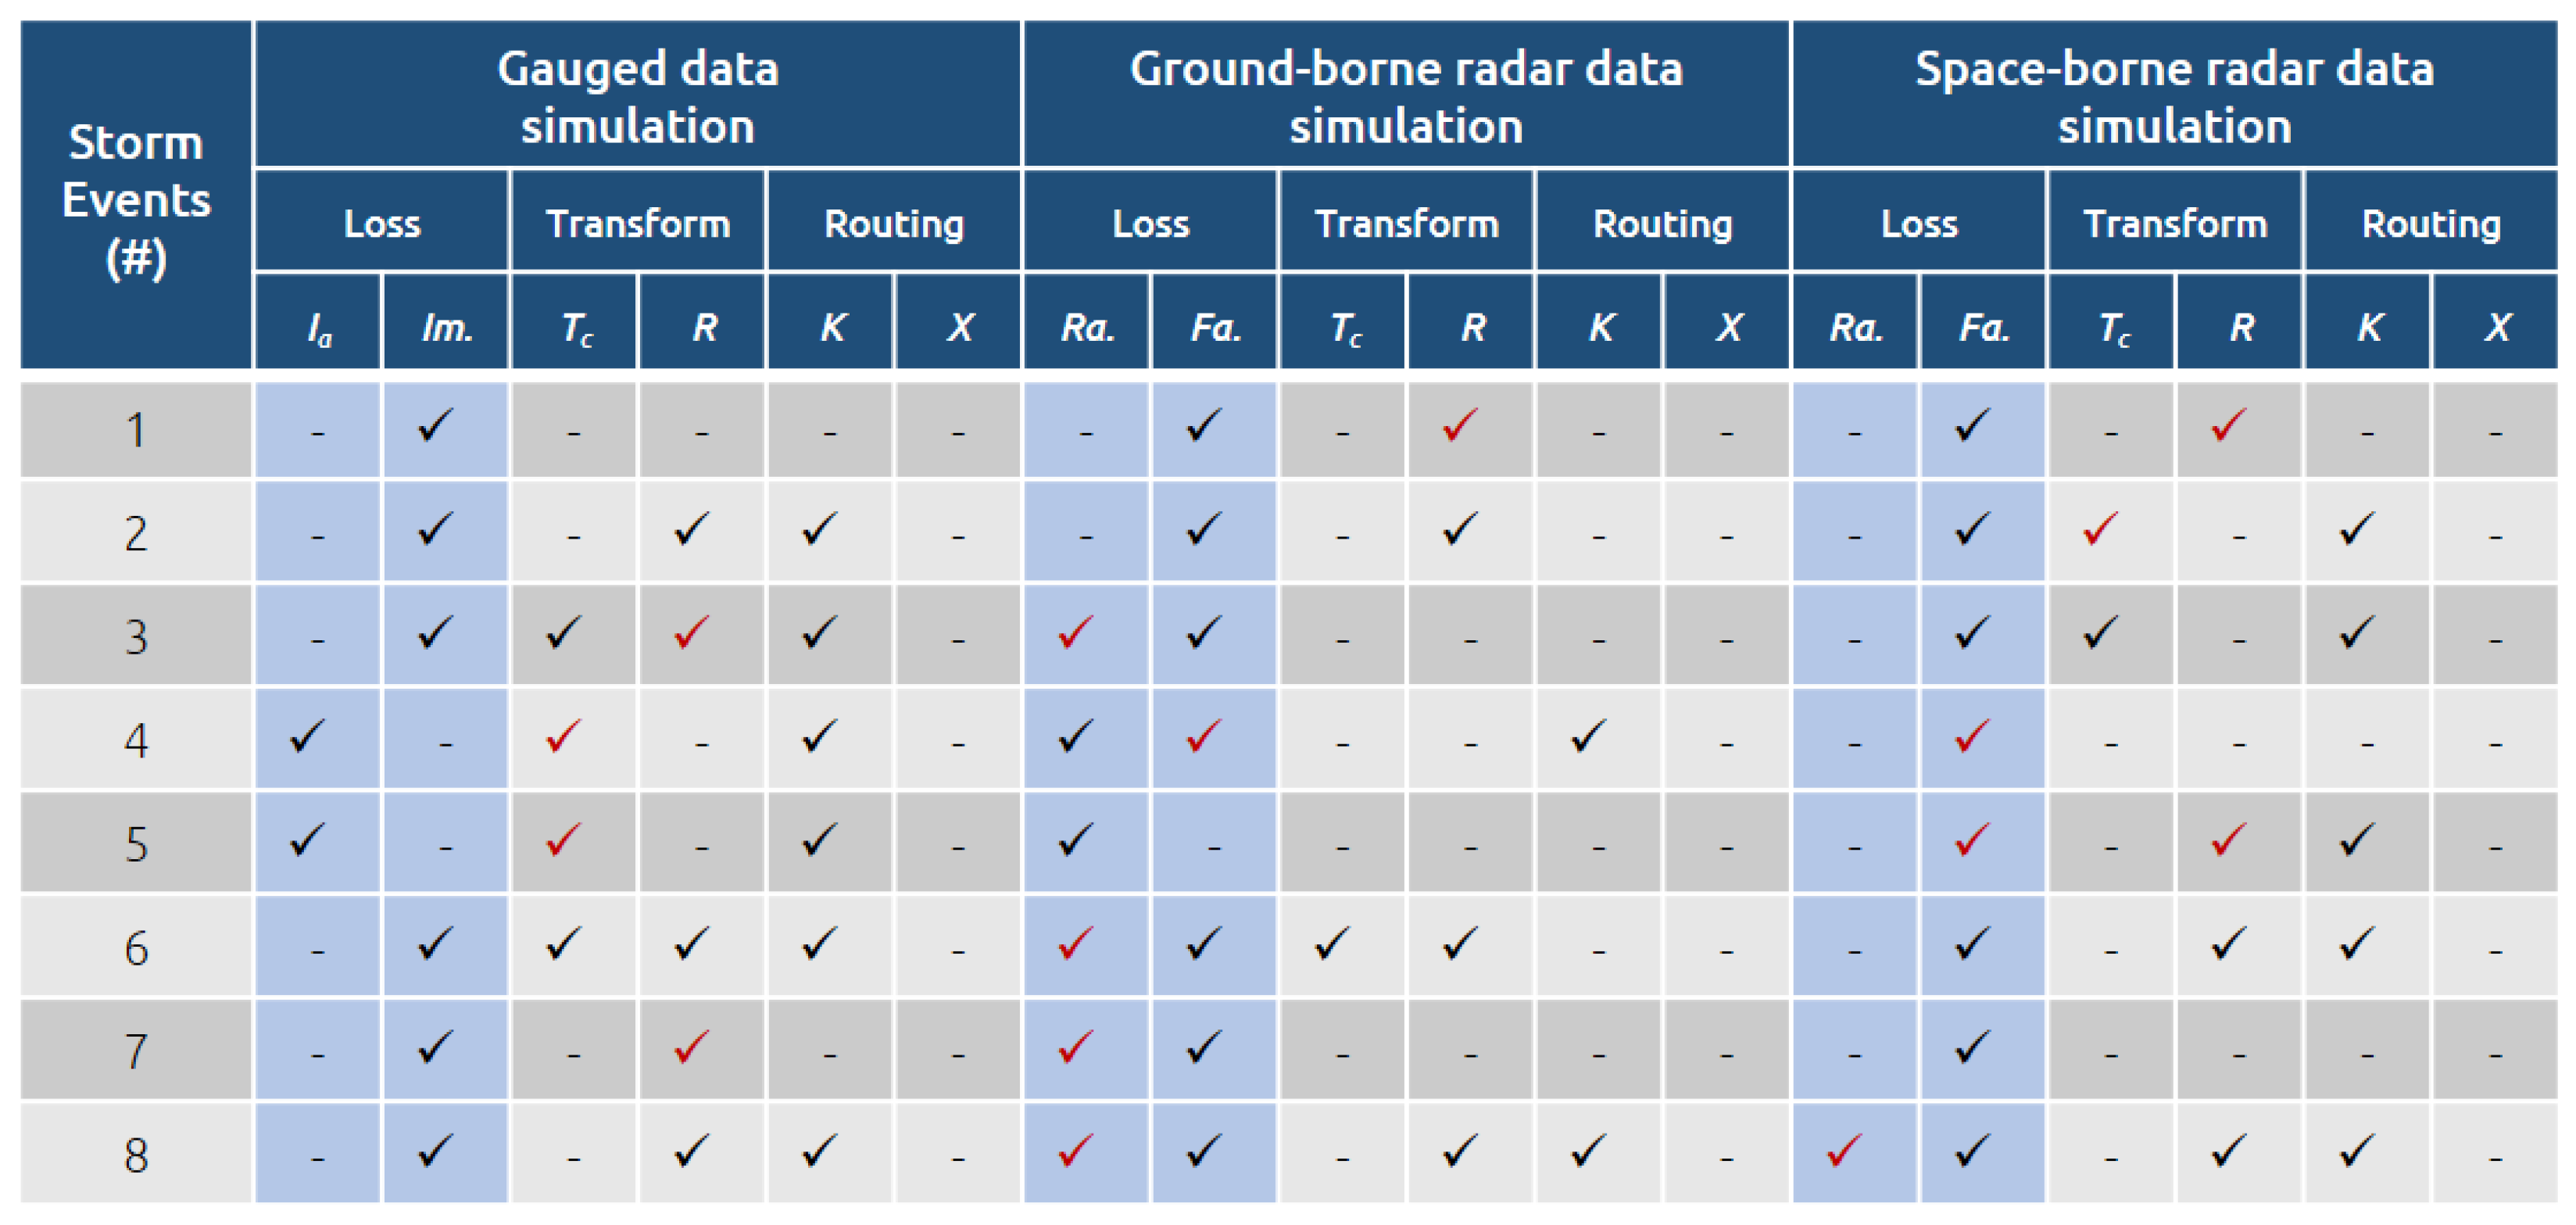
In order to investigate the results of flood simulations in relation to model calibration, the initial values of key parameters for each HEC-HMS model are provided in Table 8. Based on these values, flood simulations were performed using hourly areal-averaged rain gauges and gridded precipitation data (two radar products). Figure 9 represents whether or not the initial parameter values were adjusted for each model after the required calibrations using the eight selected storm events.
Upon examining the results, it is evident that the models utilizing gridded precipitation, particularly RAR data, required relatively less adjustment of parameters compared to simulations using areal-averaged precipitation. This can be attributed to the fact that in the processes of rainfall-runoff transformation (time of concentration, Tc, and storage coefficient, R, parameters used) and river routing (Muskingum K and X parameters used), which are associated with flow travel times, simulations were achieved without the need for adjustments of parameter values, yielding results similar to the observed hydrographs. In contrast, simulations using rain gauge observations and IMERG gridded precipitation, where the spatial distribution of precipitation across the entire watershed was not sufficiently considered, necessitated adjustments of parameter values related to travel times in almost all cases.
This indicates the increased efficiency of flood discharge analysis when utilizing the detailed grid resolution of spatially distributed precipitation, which allows for the incorporation of localized rainfall patterns and amounts into model simulations. Particularly, in watersheds dominated by mountainous terrains, such as dam watersheds, where there are significant variations in rainfall across different regions, the introduction of data that considers spatial distribution, such as radar precipitation, is crucial. However, it should be noted that gridded precipitation data at the grid-cell level still tends to underestimate or overestimate the actual observed values. Therefore, simulations using such data require adjustments of parameter values associated with precipitation quantities, and the IMERG product exhibited relatively larger differences in this aspect.
Figure 10 shows the simulated hydrographs, which provide an overall flood analysis simulation result for this study. With a few exceptions, the majority of the simulated hydrographs closely resemble the observed hydrographs. In terms of the statistical comparison of the simulation results (Table 9), the model simulations using gauged data exhibit an average Nash–Sutcliffe efficiency (ENS) of 0.895, a coefficient of determination (R2) of 0.906, and a percent bias (PBIAS) of 7.42%. For the ground-borne radar precipitation used model, the ENS is 0.863, R2 is 0.873, and PBIAS is 7.49%. Although there are some differences, as mentioned earlier, the simulations of RAR precipitation data perform well without the need for parameter adjustment, reaffirming the utility of detailed grid-based precipitation data for flood discharge simulations. Additionally, the space-borne radar data simulations also demonstrate relatively satisfactory results with an ENS of 0.776, an R2 of 0.787, and a PBIAS of 7.15%, despite the lower correlation with the observed values.
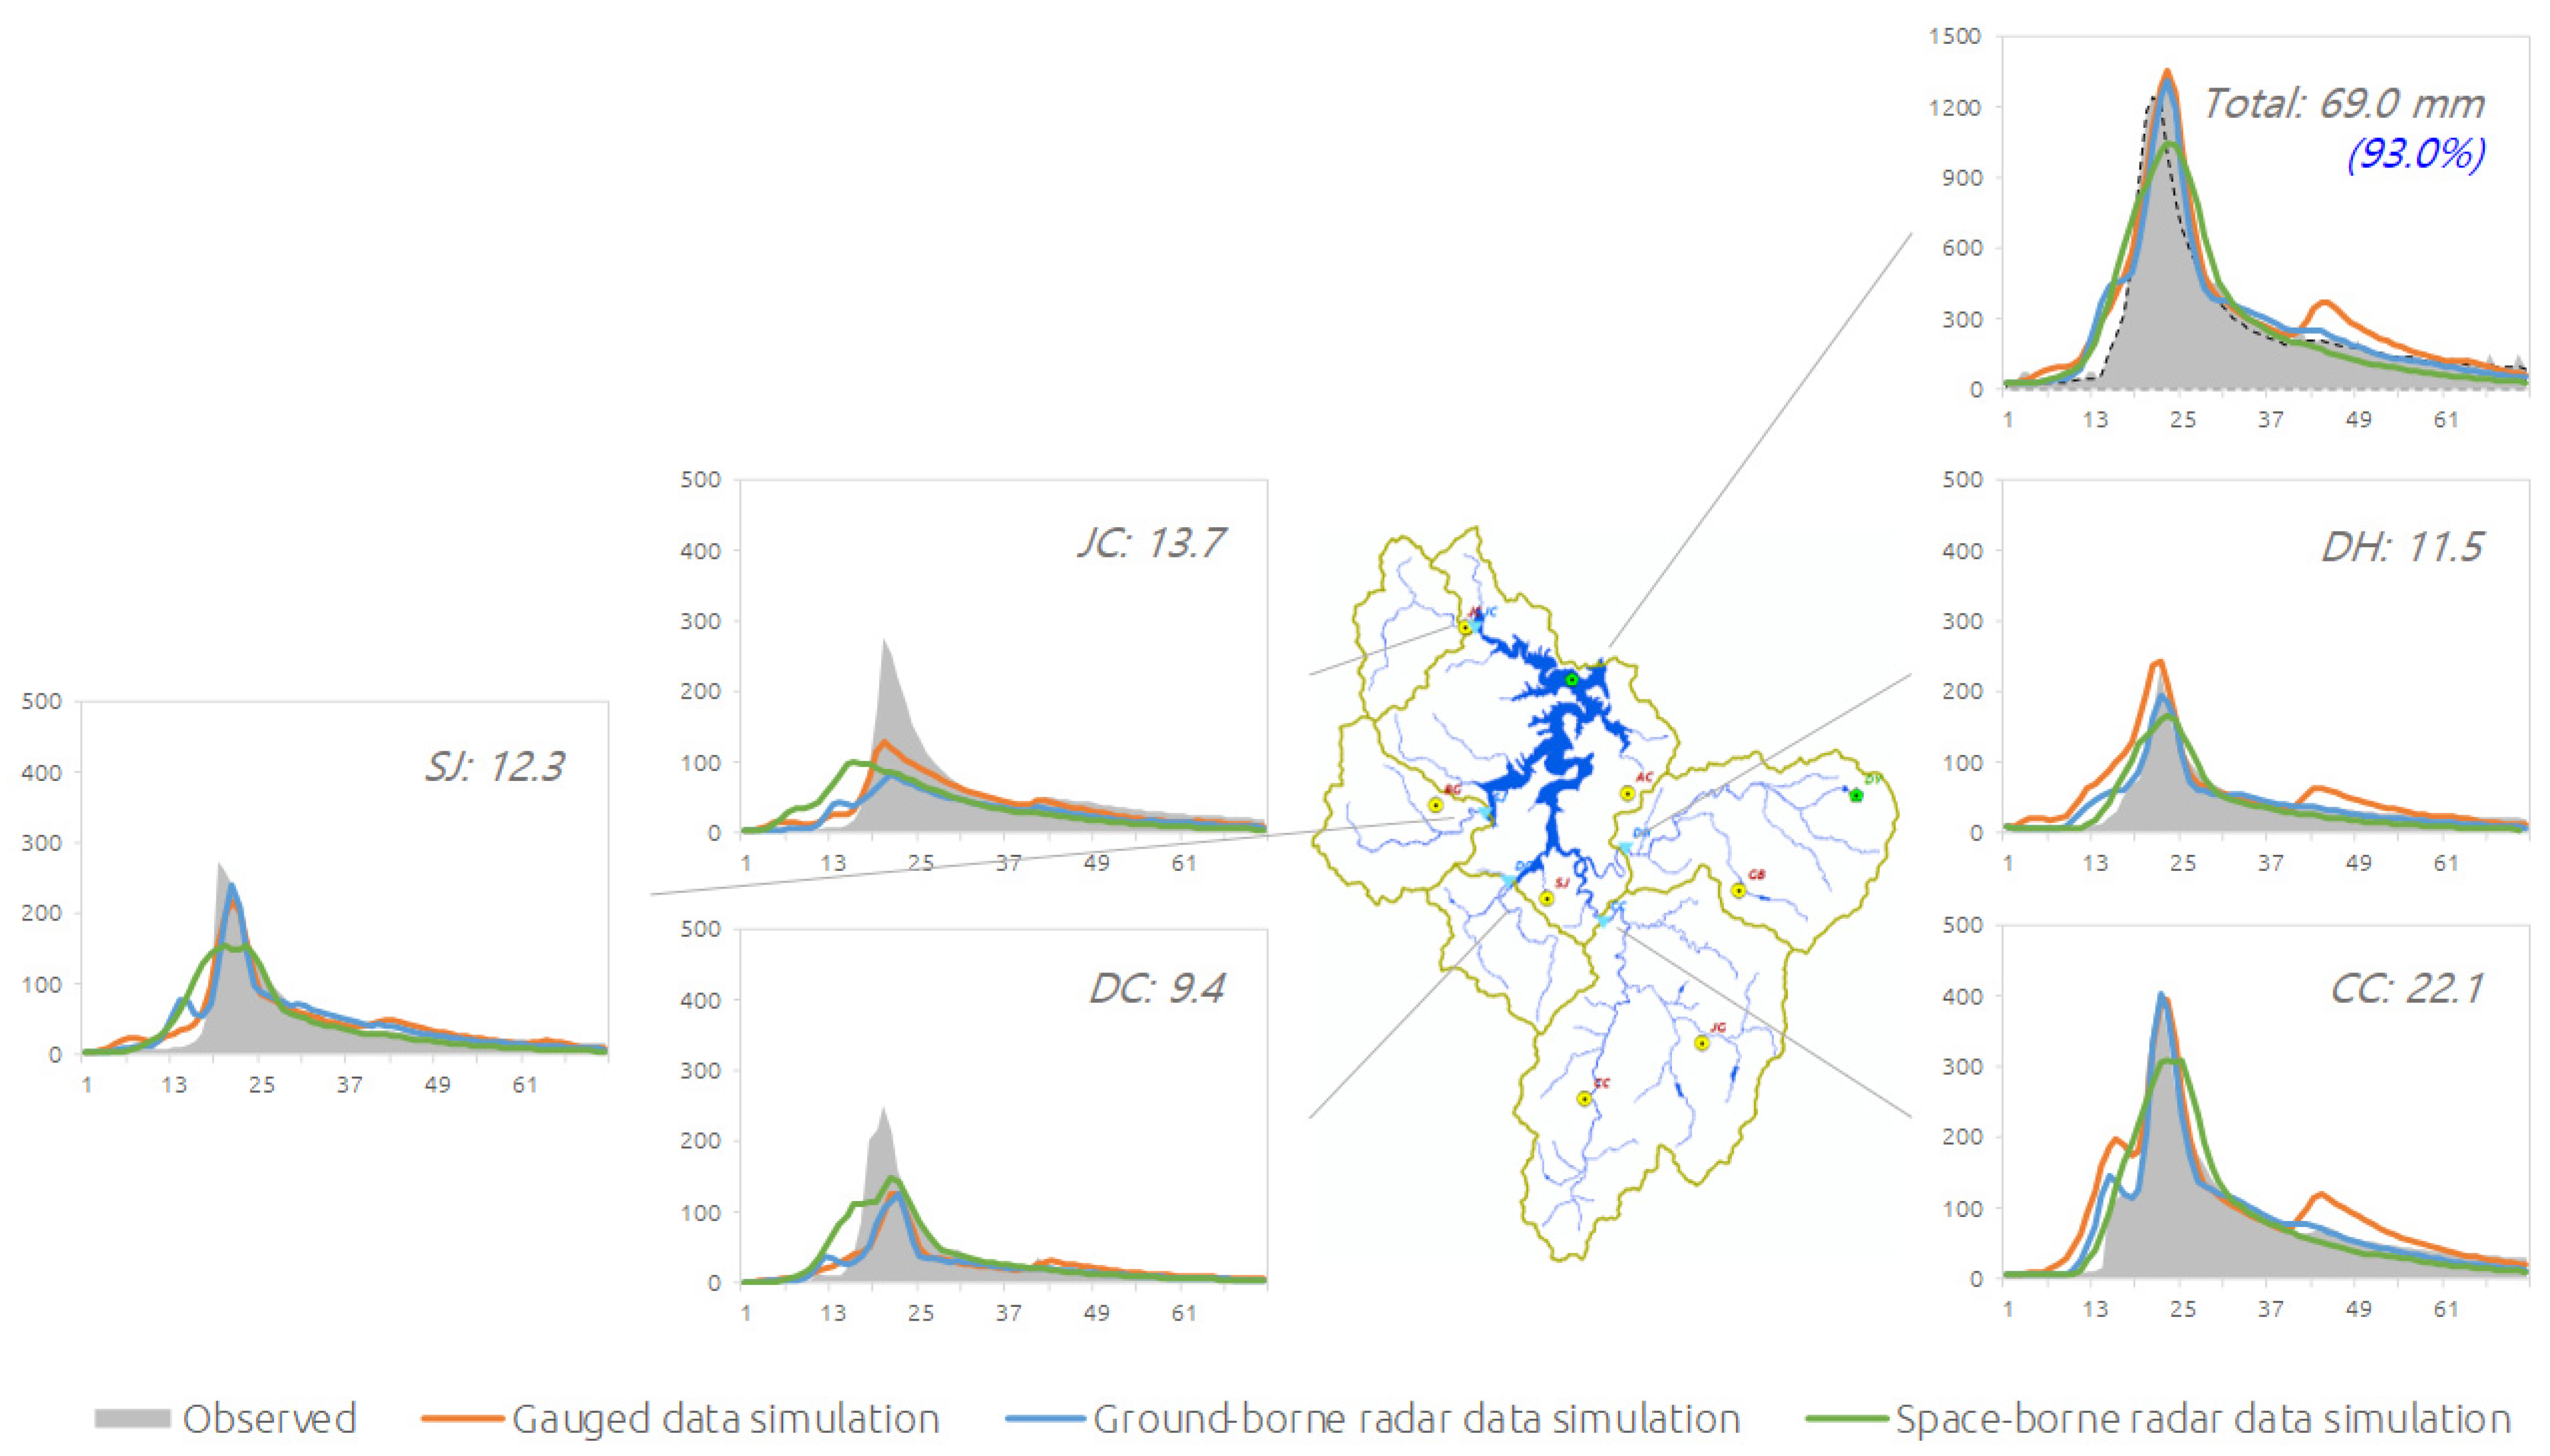
In addition, Figure 11 and Table 10 compare the hydrographs and evaluation statistics of the simulated results for each water level/flow gauge location. In the comparison with individual flow discharge observations, the models using RAR ground-borne radar-based gridded precipitation exhibit good agreement with the observed values, with an average ENS ranging from 0.53 to 0.92, without the need for adjustment of parameter values related to travel times. However, for the models using areal mean of the gauged data and IMERG space-borne gridded radar precipitation, the average ENS ranges from 0.66 to 0.87 and 0.43 to 0.84, respectively. In the case of IMERG, the precipitation grid is relatively larger compared to RAR, which indicates that the spatial information of the applied precipitation in each watershed is not sufficiently reflected, leading to unsatisfactory results. For reference, Figure 11 illustrates only the hydrographs for storm event #1 adopted in this study, while the hydrograph results for the remaining seven events (Figure A1, Figure A2, Figure A3, Figure A4, Figure A5, Figure A6 and Figure A7) have been included in Appendix A.
Additionally, from Table 9, it can be inferred that relatively small catchments may experience a greater incidence of missing or inaccurate discharge data compared to the measured data at the outlet point, which poses challenges in calibrating the models. However, it is crucial to acknowledge that the same occurrence can also arise due to errors in the precipitation data used in this study.
Consequently, the flood analysis utilizing various precipitation datasets with diverse production sources in this study revealed simulation results that are not significantly different from the major findings of previously discussed studies in the introduction; notably less accurate for the satellite-based data (i.e., space-borne radar precipitation). However, considering the primary objective of this research, which is to evaluate the usability of satellite-based precipitation products for flood applications, the anticipation of suboptimal simulation results was intrinsic. Nonetheless, for watersheds with available observed discharge data, this study performed an investigation to improve the usability of satellite precipitation data. This was achieved through hydrological model calibration, with the aim of determining the extent to which it can be effectively employed for accurate flood analysis.

4. Conclusions

The present study conducted a comparative analysis of flood simulations by utilizing rain gauge, ground- and space-borne radar precipitation products. The primary objective was to assess the efficacy of incorporating two radar-based gridded data sources, namely RAR and GPM IMERG, in a dam watershed where gauge observations are relatively abundant. Additionally, this study aims to seek the feasibility of utilizing the half-hourly IMERG product in regions characterized by ungauged or limited availability of observed data. To achieve these objectives, data processing programs and two types of HEC-HMS models were developed for areal-averaged and spatially distributed gridded data based on flood simulations, focusing on the selected eight rainfall storm events. The key findings are as follows:
(1)
Overall, the Korea Meteorological Administration’s ground-borne weather radar data (RAR) exhibited a slight underestimation of precipitation values compared to gauge point observations, with a difference of 28.2% across all eight flood events (R2 0.86). Consequently, adjustments to related model parameter values were necessary for flood analysis using the RAR data. However, due to the spatial distribution advantages of radar rainfall, aspects related to rainfall-runoff transformation and river channel routing, such as travel time, could be simulated to generate hydrographs that closely resembled the observed discharge without the need to adjust the related parameter values;
(2)
For space-borne (i.e., satellite-based) IMERG precipitation data, the total observed amount was underestimated by 15.1% across the eight flood events. However, the correlation coefficient (R2) was 0.46, indicating significant differences from the gauged data. Even with adjustments to parameter values, flood simulations using the IMERG product demonstrated relatively lower correlation and model efficiency compared to the observations. This indicates a significant limitation in using the half-hourly IMERG data for flood modeling in ungauged watersheds. Despite this constraint, it is still inferred that in locations where some discharge data are available, the utilization of the model through verification and calibration is feasible;
(3)
When comparing the flood simulation results using the conventional method based on rain gauge observations with those using weather radar and satellite-based precipitation data, the models utilizing both radar data sources exhibited an average Nash–Sutcliffe efficiency (ENS) of 0.863 and 0.776, an R2 of 0.873 and 0.787, and a percent bias (PBIAS) of 7.49% and 7.15%, respectively. The model using the areal-averaged values showed an ENS of 0.895, an R2 of 0.906, and a PBIAS of 7.42%. Although there were some differences, simulations using the RAR data demonstrated relatively satisfactory performance without adjusting parameter values, confirming their utility and efficiency;
(4)
Despite varying ratios ranging from 26.0% to 82.2% depending on antecedent rainfall conditions, the analysis of the eight selected flood events revealed the characteristic of watershed flood discharge with an average runoff ratio of 52.5%.
Finally, the aforementioned research results could be compared due to the availability of reliable discharge data obtained through extensive measurements in the upstream reaches of the watershed. Most of all, the presence of observational data is crucial in assessing the effectiveness of any hydrological model. Consequently, the utilization of hourly discharge data from multiple gauge observation points in this simulation of flood discharge can be considered as a noteworthy case study in the modeling of watershed flood management. In addition, although the GPM IMERG half-hourly product has not yet been established as a reliable dataset for hydrological modeling through this research, it is essential to apply it in diverse regions to evaluate its performance with additional case studies. However, as stated earlier, if discharge measurement data are accessible for the rivers within the specific watershed of interest, it is feasible to calibrate the model using this data, allowing for the integration of the IMERG dataset into flood discharge forecasting with sufficient reliability.
The hydrological modeling using the radar-based gridded rainfall data developed in this study is planned to be implemented in an ongoing research project for estimating inflow to ungauged dam reservoirs. Through this application, further research aims to facilitate the integration of hydrological models into ungauged and data-limited dam reservoir waterbody monitoring studies, utilizing other satellite data (optical or SAR; Synthetic Aperture Radar imageries). This mutual integration will be used as a framework to complement the current research efforts and establish linkages with hydrological modeling for inflow estimation in ungauged watersheds. The integration will also involve analyzing and estimating water levels, surface areas, and storage capacities obtained from satellite imagery data, thereby enhancing the accuracy and completeness of the analyses and estimations.

Funding

This work is supported by the Korea Agency for Infrastructure Technology Advancement (KAIA) grant funded by the Ministry of Land, Infrastructure and Transport (Grant RS-2022-00155763).

Data Availability Statement

The data that support the findings of this study are available from the corresponding author upon reasonable request.

Acknowledgments

Hydrometeorological data support from the Korea Water Resources Corporation (K-water) for this work is gratefully acknowledged.

Conflicts of Interest

The author declares no conflict of interest.

Appendix A

Figure A1. Hydrographs of flood simulation for the developed models at each flow gauge. The dashed line represents the aggregated values of individually measured discharges, accounting for 96.2% of the observed discharge at the outlet point (storm event #2).
Water 15 02898 g0a1
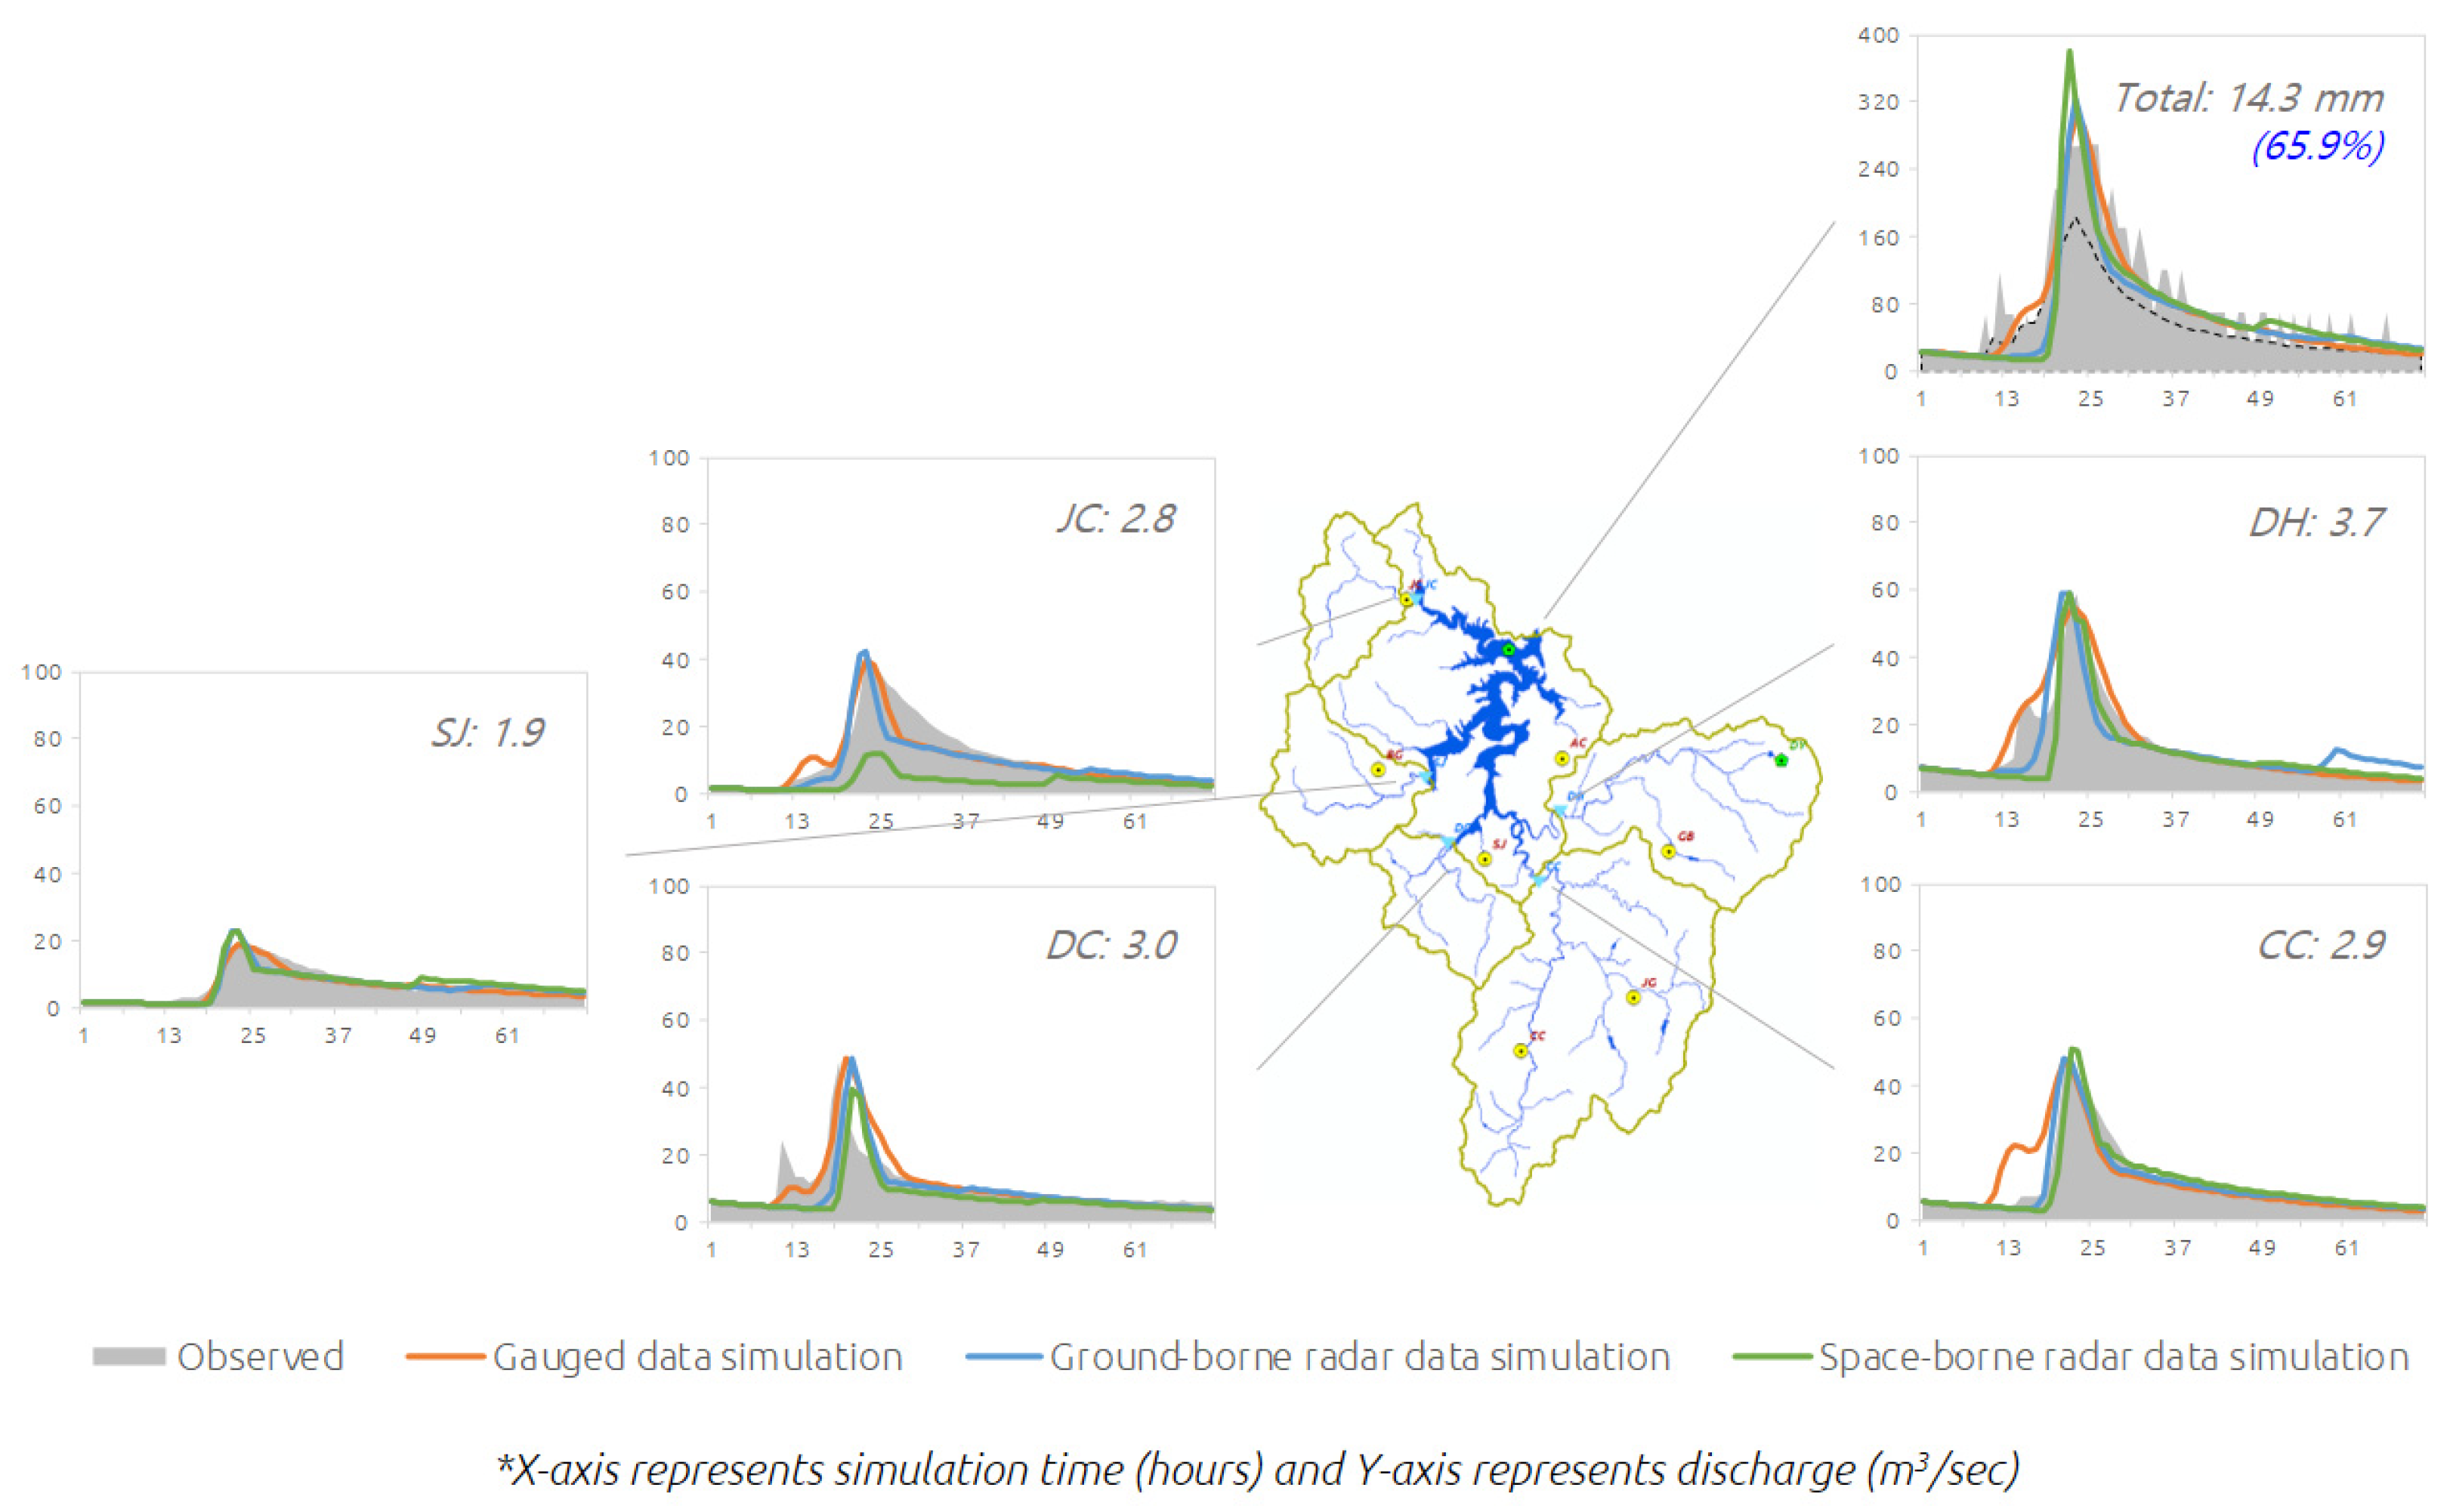
Figure A2. Hydrographs of flood simulation for the developed models at each flow gauge. The dashed line represents the aggregated values of individually measured discharges, accounting for 65.9% of the observed discharge at the outlet point (storm event #3).
Water 15 02898 g0a2
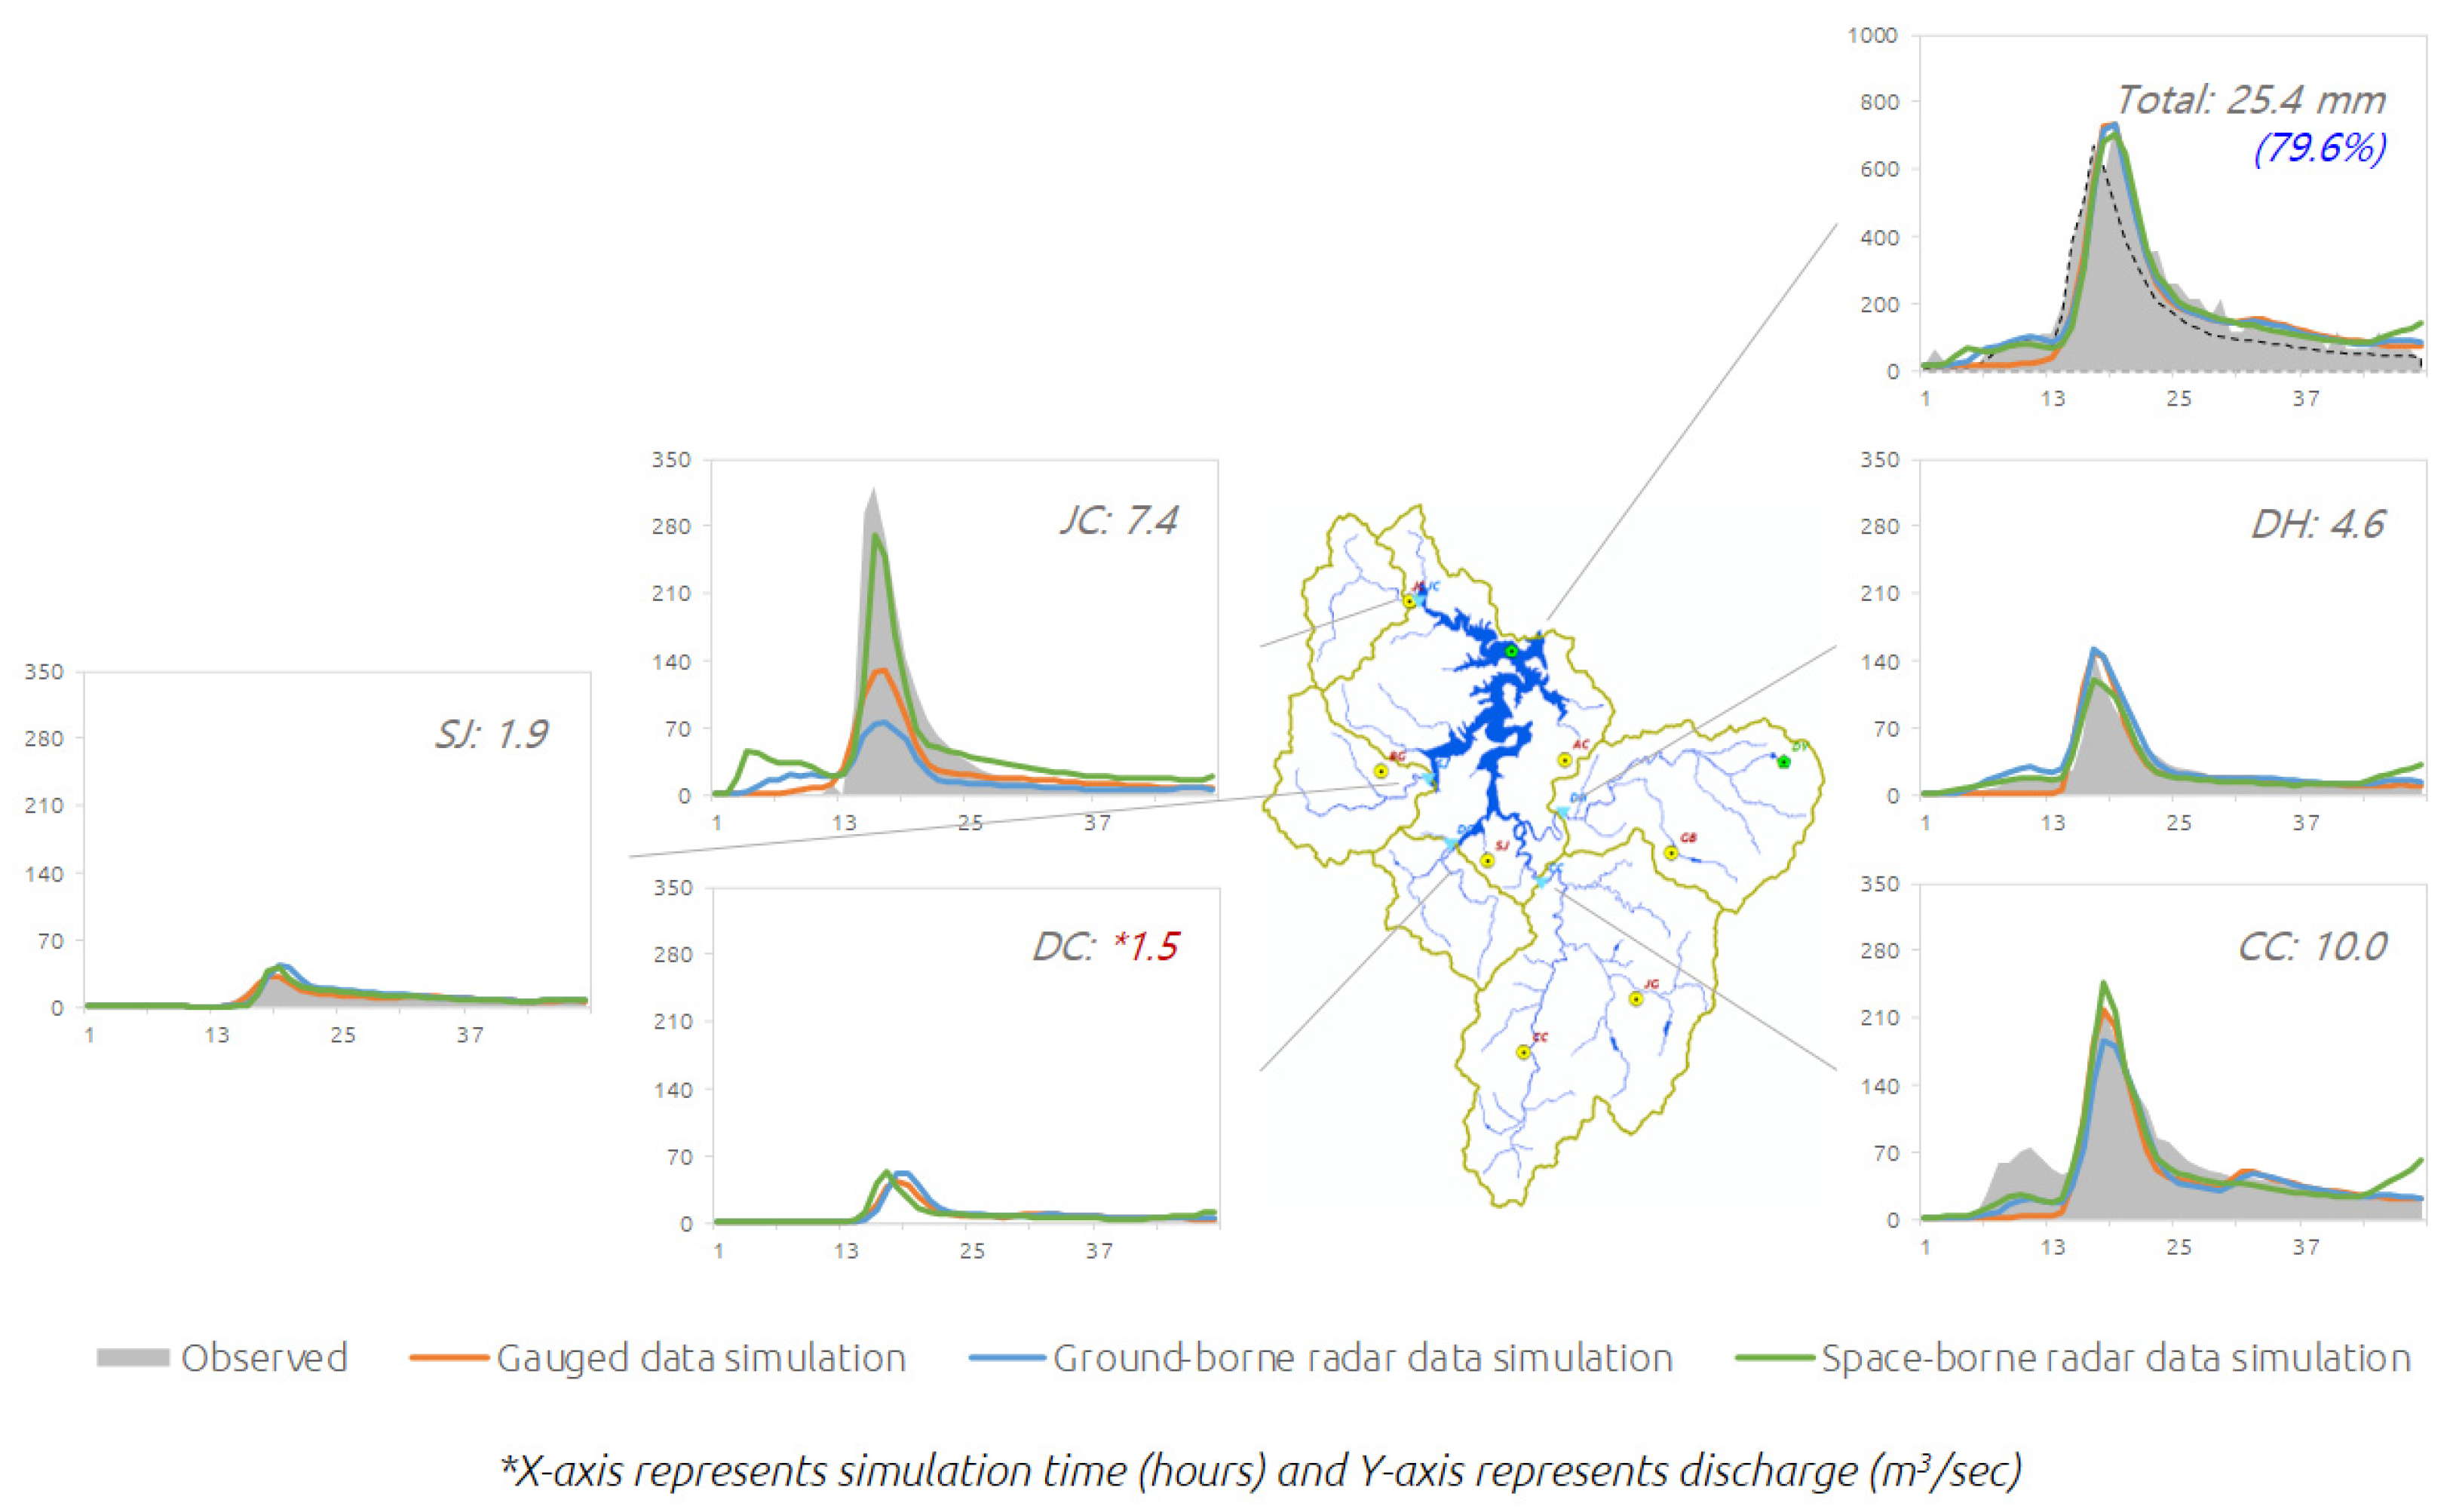
Figure A3. Hydrographs of flood simulation for the developed models at each flow gauge. The dashed line represents the aggregated values of individually measured discharges, accounting for 79.6% of the observed discharge at the outlet point (storm event #4).
Water 15 02898 g0a3
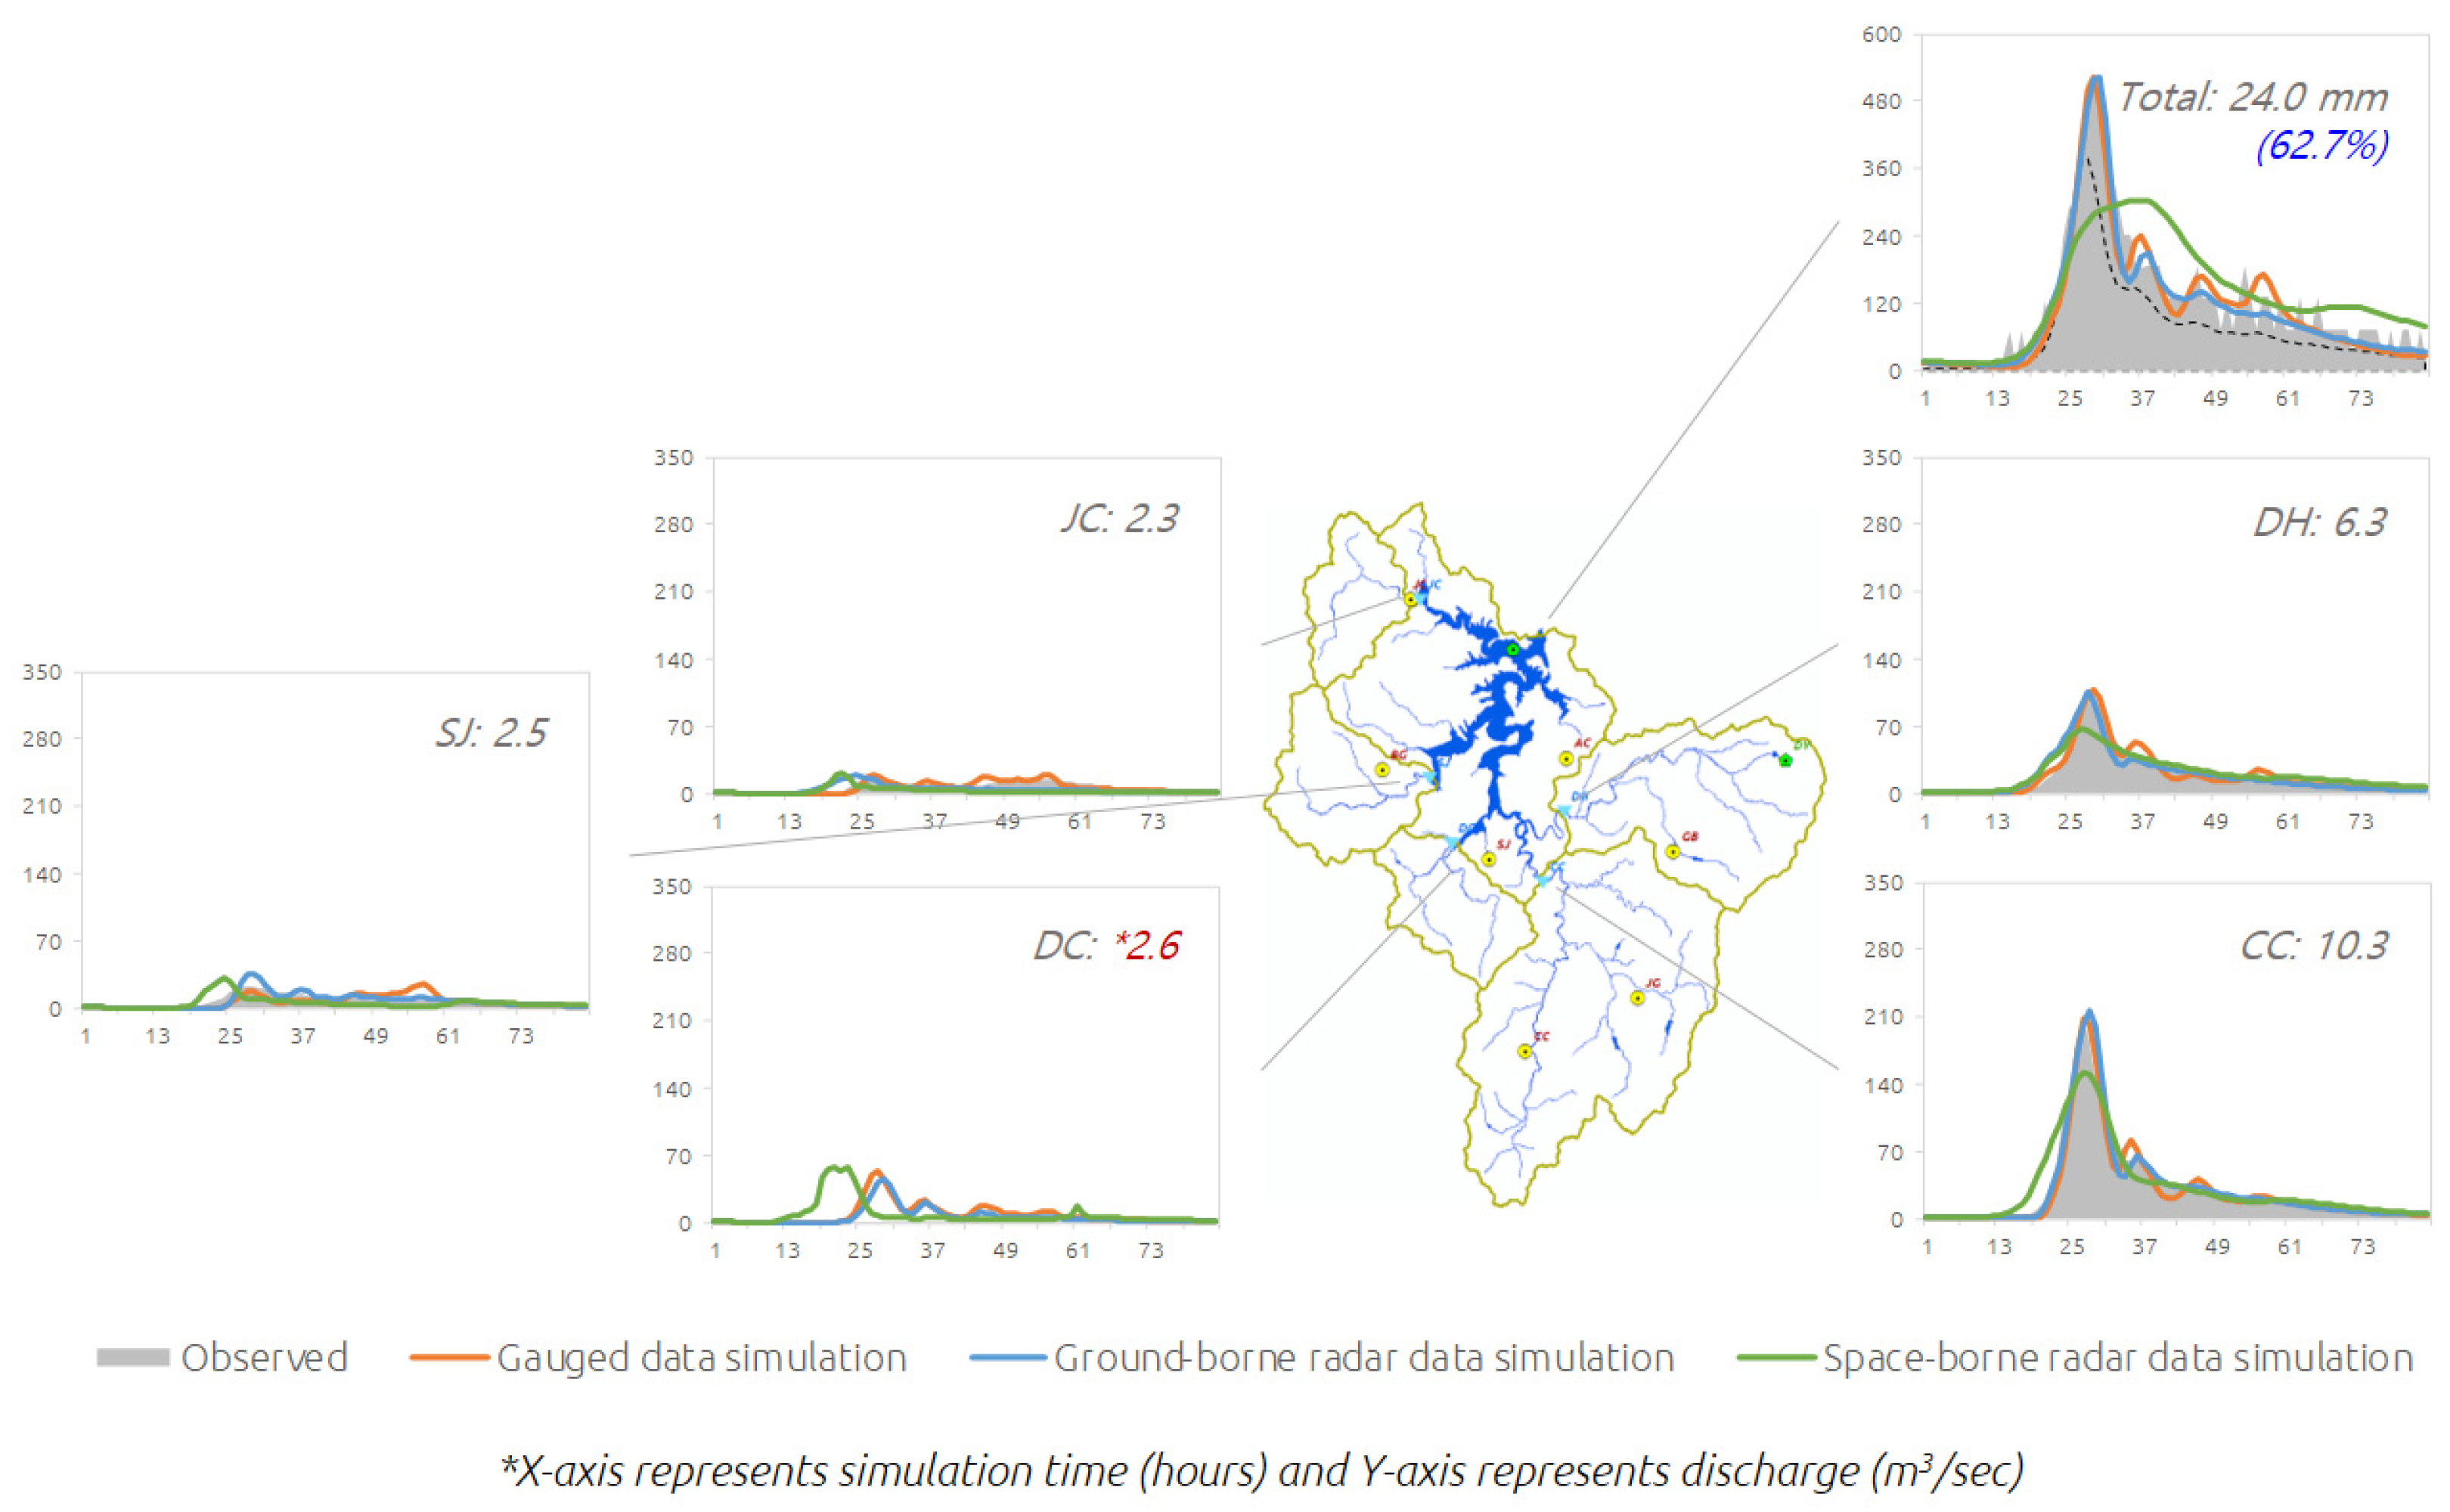
Figure A4. Hydrographs of flood simulation for the developed models at each flow gauge. The dashed line represents the aggregated values of individually measured discharges, accounting for 62.7% of the observed discharge at the outlet point (storm event #5).
Water 15 02898 g0a4
Figure A5. Hydrographs of flood simulation for the developed models at each flow gauge. The dashed line represents the aggregated values of individually measured discharges, accounting for 91.2% of the observed discharge at the outlet point (storm event #6).
Water 15 02898 g0a5
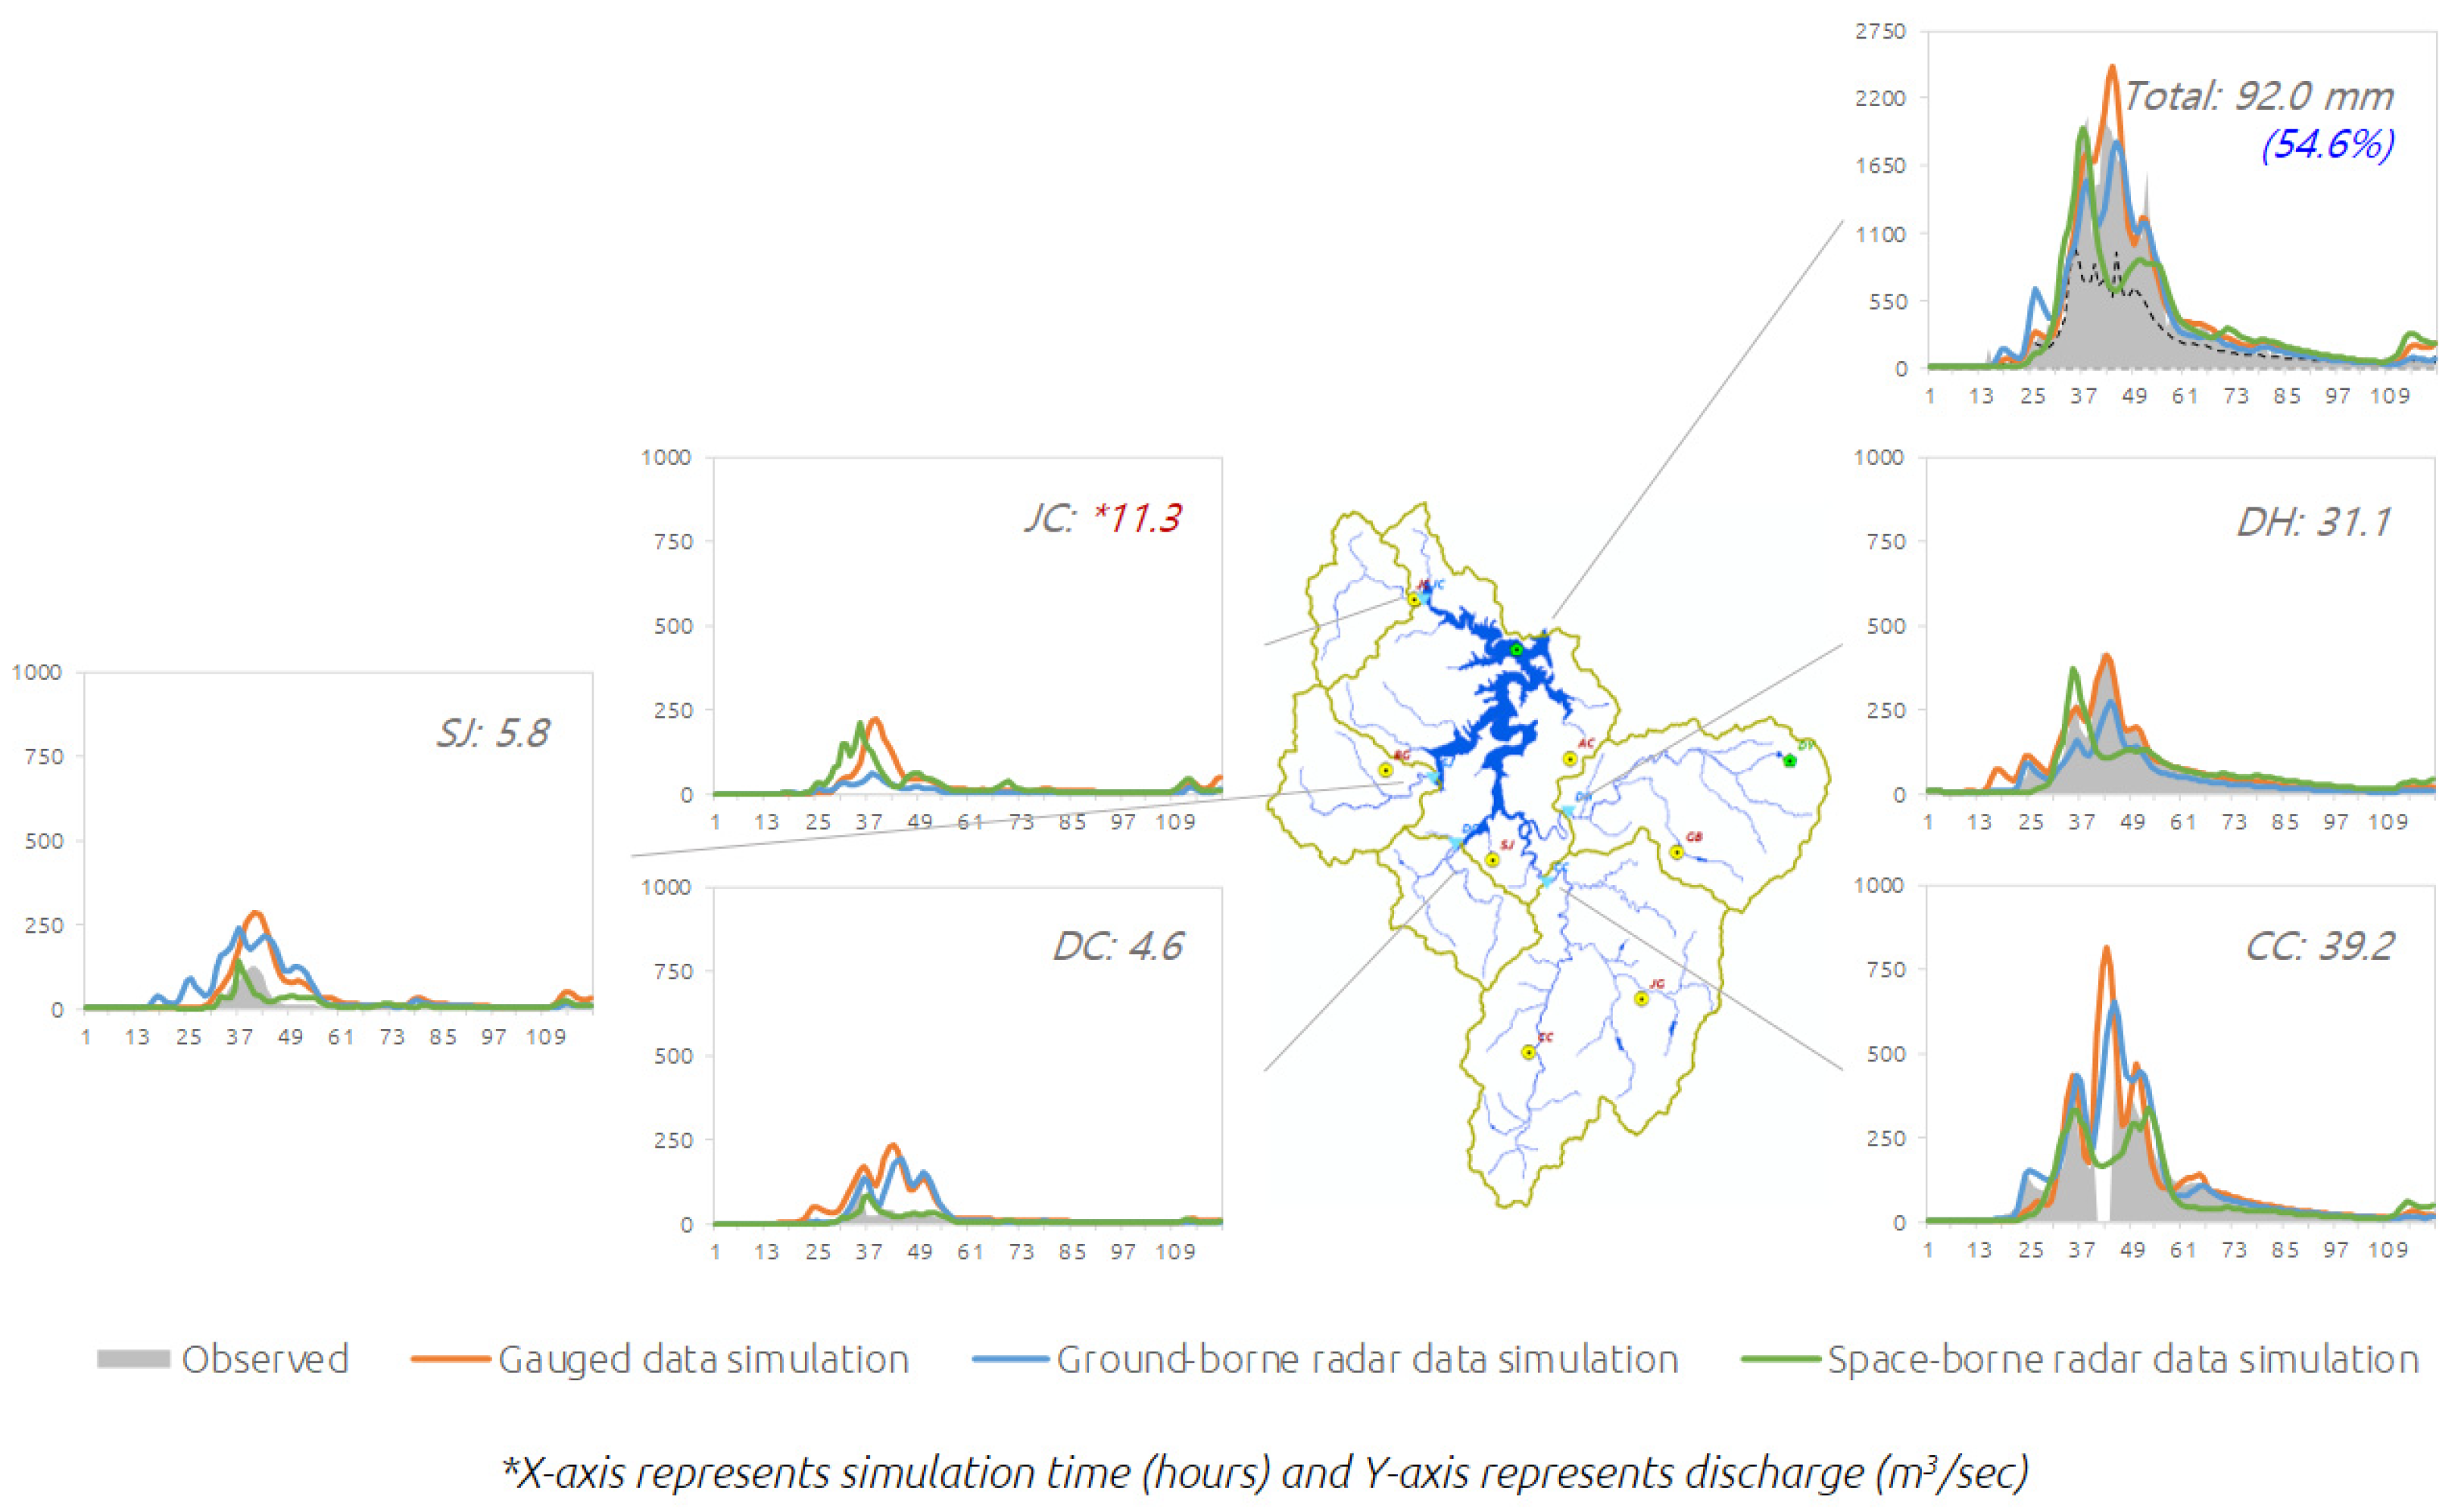
Figure A6. Hydrographs of flood simulation for the developed models at each flow gauge. The dashed line represents the aggregated values of individually measured discharges, accounting for 54.6% of the observed discharge at the outlet point (storm event #7).
Water 15 02898 g0a6
Figure A7. Hydrographs of flood simulation for the developed models at each flow gauge. The dashed line represents the aggregated values of individually measured discharges, accounting for 68.9% of the observed discharge at the outlet point (storm event #8).
Water 15 02898 g0a7

References

  1. Cho, Y. Application of NEXRAD Radar-Based Quantitative Precipitation Estimations for Hydrologic Simulation Using ArcPy and HEC Software. Water 2020, 12, 273. [Google Scholar] [CrossRef] [Green Version]
  2. Michaelides, S. Editorial for special issue “remote sensing of precipitation”. Remote Sens. 2019, 11, 389. [Google Scholar] [CrossRef] [Green Version]
  3. Cho, Y.; Engel, B.A. NEXRAD quantitative precipitation estimations for hydrologic simulation using a hybrid hydrologic model. J. Hydrometeorol. 2017, 18, 25–47. [Google Scholar] [CrossRef]
  4. Cho, Y.; Engel, B.A. Spatially distributed long-term hydrologic simulation using a continuous SCS CN method-based hybrid hydrologic model. Hydrol. Process. 2018, 32, 904–922. [Google Scholar] [CrossRef]
  5. Hou, A.Y.; Kakar, R.K.; Neeck, S.; Azarbarzin, A.A.; Kummerow, C.D.; Kojima, M.; Oki, R.; Nakamura, K.; Iguchi, T. The Global Precipitation Measurement Mission. Bull. Amer. Meteor. Soc. 2014, 95, 701–722. [Google Scholar] [CrossRef]
  6. Skofronick-Jackson, G.; Petersen, W.A.; Berg, W.; Kidd, C.; Stocker, E.F.; Kirschbaum, D.B.; Karar, R.; Braun, S.A.; Huffman, G.J.; Iguchi, T.; et al. The Global Precipitation Measurement (GPM) Mission for Science and Society. Bull. Amer. Meteor. Soc. 2017, 98, 1679–1695. [Google Scholar] [CrossRef]
  7. Kirschbaum, D.B.; Huffman, G.J.; Adler, R.F.; Braun, S.; Garrett, K.; Jones, E.; McNally, A.; Skofronick-Jackson, G.; Stocker, E.; Wu, H.; et al. NASA’s Remotely Sensed Precipitation, A Reservoir for Applications Users. Bull. Amer. Meteor. Soc. 2017, 98, 1169–1184. [Google Scholar] [CrossRef]
  8. Huffman, G.J.; Bolvin, D.T.; Braithwaite, D.; Hsu, K.; Joyce, R.; Kidd, C.; Nelkin, E.J.; Sorooshian, S.; Tan, J.; Xie, P. NASA Global Precipitation Measurement (GPM) Integrated Multi-satellitE Retrievals for GPM (IMERG), Algorithm Theoretical Basis Document (ATBD) Version 06. Available online: https://gpm.nasa.gov/sites/default/files/2020-05/IMERG_ATBD_V06.3.pdf (accessed on 3 January 2020).
  9. Kelley, O. The IMERG Multi-Satellite Precipitation Estimates Reformatted as 2-byte GeoTIFF Files for Display in a Geographic Information System (GIS). Available online: https://pps.gsfc.nasa.gov/Documents/README.GIS.pdf (accessed on 16 March 2022).
  10. Li, N.; Tang, G.; Zhao, P.; Hong, Y.; Gou, Y.; Yang, K. Statistical assessment and hydrological utility of the latest multi-satellite precipitation analysis IMERG in Ganjiang River basin. Atmos. Res. 2017, 183, 212–223. [Google Scholar] [CrossRef]
  11. Yuan, F.; Wang, B.; Shi, C.; Cui, W.; Zhao, C.; Liu, Y.; Ren, L.; Zhang, L.; Zhu, Y.; Chen, T.; et al. Evaluation of hydrological utility of IMERG Final run V05 and TMPA 3B42V7 satellite precipitation products in the Yellow River source region, China. J. Hydrol. 2018, 567, 696–711. [Google Scholar] [CrossRef]
  12. Wang, Z.; Zhong, R.; Lai, C.; Chen, J. Evaluation of the GPM IMERG satellite-based precipitation products and the hydrological utility. Atmos. Res. 2017, 196, 151–163. [Google Scholar] [CrossRef]
  13. Lu, D.; Yong, B. Evaluation and Hydrological Utility of the Latest GPM IMERG V5 and GSMaP V7 Precipitation Products over the Tibetan Plateau. Remote Sens. 2018, 10, 2022. [Google Scholar] [CrossRef] [Green Version]
  14. Su, J.; Lu, H.; Zhu, Y.; Cui, Y.; Wang, X. Evaluating the hydrological utility of latest IMERG products over the Upper Huaihe River Basin, China. Atmos. Res. 2019, 225, 17–29. [Google Scholar] [CrossRef]
  15. Ji, H.; Peng, D.; Gu, Y.; Liang, Y.; Luo, X. Evaluation of multiple satellite precipitation products and their potential utilities in the Yarlung Zangbo River Basin. Sci. Rep. 2022, 12, 13334. [Google Scholar] [CrossRef] [PubMed]
  16. Li, X.; Chen, Y.; Deng, X.; Zhang, Y.; Chen, L. Evaluation and Hydrological Utility of the GPM IMERG Precipitation Products over the Xinfengjiang River Reservoir Basin, China. Remote Sens. 2021, 13, 866. [Google Scholar] [CrossRef]
  17. Tang, G.; Zeng, Z.; Long, D.; Guo, X.; Yong, B.; Zhang, W.; Hong, Y. Statistical and Hydrological Comparisons between TRMM and GPM Level-3 Products over a Midlatitude Basin: Is Day-1 IMERG a Good Successor for TMPA 3B42V7? J. Hydrometeor. 2016, 17, 121–137. [Google Scholar] [CrossRef]
  18. Zubieta, R.; Getirana, A.; Espinoza, J.C.; Lavado-Casimiro, W.; Aragon, L. Hydrological modeling of the Peruvian-Ecuadorian Amazon Basin using GPM-IMERG satellite-based precipitation dataset. Hydrol. Earth Syst. Sci. 2017, 21, 3543–3555. [Google Scholar] [CrossRef] [Green Version]
  19. He, Z.; Yang, L.; Tian, F.; Ni, G.; Hou, A.; Lu, H. Intercomparisons of Rainfall Estimates from TRMM and GPM Multisatellite Products over the Upper Mekong River Basin. J. Hydrometeor. 2017, 18, 413–430. [Google Scholar] [CrossRef] [Green Version]
  20. Jiang, S.; Ren, L.; Xu, C.-Y.; Yong, B.; Yuan, F.; Liu, Y.; Yang, X.; Zeng, X. Statistical and hydrological evaluation of the latest Integrated Multi-satellitE Retrievals for GPM (IMERG) over a midlatitude humid basin in South China. Atmos. Res. 2018, 214, 418–429. [Google Scholar] [CrossRef]
  21. Mohammed, I.N.; Boten, J.D.; Srinivasan, R.; Lakshmi, V. Satellite observations and modeling to understand the Lower Mekong River Basin streamflow variability. J. Hydrol. 2018, 564, 559–573. [Google Scholar] [CrossRef]
  22. Jiang, L.; Bauer-Gottwein, P. How do GPM IMERG precipitation estimates perform as hydrological model forcing? Evaluation for 300 catchments across Mainland China. J. Hydrol. 2019, 572, 486–500. [Google Scholar] [CrossRef]
  23. Li, R.; Shi, J.; Ji, D.; Zhao, T.; Plermkamon, V.; Moukomla, S.; Kuntiyawichai, K.; Kruasilp, J. Evaluation and Hydrological Application of TRMM and GPM Precipitation Products in a Tropical Monsoon Basin of Thailand. Water 2019, 11, 818. [Google Scholar] [CrossRef] [Green Version]
  24. Zhang, Z.; Tian, J.; Huang, Y.; Chen, X.; Chen, S.; Duan, Z. Hydrologic Evaluation of TRMM and GPM IMERG Satellite-Based Precipitation in a Humid Basin of China. Remote Sens. 2019, 11, 431. [Google Scholar] [CrossRef] [Green Version]
  25. Sharif, H.O.; Al-Zahrani, M.; Hassan, A.E. Physically, Fully-Distributed Hydrologic Simulations Driven by GPM Satellite Rainfall over an Urbanizing Arid Catchment in Saudi Arabia. Water 2017, 9, 163. [Google Scholar] [CrossRef]
  26. Tam, T.H.; Rahman, M.Z.A.; Harun, S.; Hanapi, M.N.; Kaoje, I.U. Application of Satellite Rainfall Products for Flood Inundation Modelling in Kelantan River Basin, Malaysia. Hydrology 2019, 6, 95. [Google Scholar] [CrossRef] [Green Version]
  27. Zhou, L.; Rasmy, M.; Takeuchi, K.; Koike, T.; Selvarajah, H. Adequacy of Near Real-Time Satellite Precipitation Products in Driving Flood Discharge Simulation in the Fuji River Basin, Japan. Appl. Sci. 2021, 11, 1087. [Google Scholar] [CrossRef]
  28. Llauca, H.; Lavado-Casimiro, W.; León, K.; Jimenez, J.; Traverso, K.; Rau, P. Assessing Near Real-Time Satellite Precipitation Products for Flood Simulations at Sub-Daily Scales in a Sparsely Gauged Watershed in Peruvian Andes. Remote Sens. 2021, 13, 826. [Google Scholar] [CrossRef]
  29. Chancay, J.; Espitia-Sarmiento, E.F. Improving Hourly Precipitation Estimates for Flash Flood Modeling in Data-Scarce Andean-Amazon Basins: An Integrative Framework Based on Machine Learning and Multiple Remotely Sensed Data. Remote Sens. 2021, 13, 4446. [Google Scholar] [CrossRef]
  30. Yuan, F.; Zhang, L.; Soe, K.M.W.; Ren, L.; Zhao, C.; Zhu, Y.; Jiang, S.; Liu, Y. Applications of TRMM- and GPM-Era Multiple-Satellite Precipitation Products for Flood Simulations at Sub-Daily Scales in a Sparsely Gauged Watershed in Myanmar. Remote Sens. 2019, 11, 140. [Google Scholar] [CrossRef] [Green Version]
  31. Jiang, S.; Ding, Y.; Liu, R.; Wei, L.; Liu, Y.; Ren, M.; Ren, L. Assessing the Potential of IMERG and TMPA Satellite Precipitation Products for Flood Simulations and Frequency Analyses over a Typical Humid Basin in South China. Remote Sens. 2022, 14, 4406. [Google Scholar] [CrossRef]
  32. Gilewski, P.; Nawalany, M. Inter-Comparison of Rain-Gauge, Radar, and Satellite (IMERG GPM) Precipitation Estimates Performance for Rainfall-Runoff Modeling in a Mountainous Catchment in Poland. Water 2018, 10, 1665. [Google Scholar] [CrossRef] [Green Version]
  33. Saouabe, T.; Khaliki, E.M.E.; Saidi, M.E.M.; Najmi, A.; Hadri, A.; Rachidi, S.; Jadoud, M.; Tramblay, Y. Evaluation of the GPM-IMERG Precipitation Product for Flood Modeling in a Semi-Arid Mountainous Basin in Morocco. Water 2020, 12, 2516. [Google Scholar] [CrossRef]
  34. Benkirane, M.; Amazirh, A.; Laftouhi, N.-E.; Khabba, S.; Chehbouni, A. Assessment of GPM Satellite Precipitation Performance after Bias Correction, for Hydrological Modeling in a Semi-Arid Watershed (High Atlas Mountain, Morocco). Atmosphere 2023, 14, 794. [Google Scholar] [CrossRef]
  35. Min, X.; Yang, C.; Dong, N. Merging Satellite and Gauge Rainfalls for Flood Forecasting of two Catchments under Different Climate Conditions. Water 2020, 12, 802. [Google Scholar] [CrossRef] [Green Version]
  36. Tang, X.; Yin, Z.; Qin, G.; Guo, L.; Li, H. Integration of Satellite Precipitation Data and Deep Learning for Improving Flash Flood Simulation in a Poor-Gauged Mountainous Catchment. Remote Sens. 2021, 13, 5083. [Google Scholar] [CrossRef]
  37. Soo, E.Z.X.; Jaafar, W.Z.W.; Lai, S.H.; Othman, F.; Elshafie, A. Enhancement of Satellite Precipitation Estimations with Bias Correction and Data-Merging Schemes for Flood Forecasting. J. Hydrol. Eng. 2022, 27, 05022009. [Google Scholar] [CrossRef]
  38. Patel, P.; Thakur, P.K.; Aggarwal, S.P.; Garg, V.; Dhote, P.R.; Nikam, B.R.; Swain, S.; Al-Ansari, N. Revisiting 2013 Uttarakhand flash floods through hydrological evaluation of precipitation data sources and morphometric prioritization. Geomat. Nat. Hazards Risk 2022, 13, 646–666. [Google Scholar] [CrossRef]
  39. Kim, J.-H.; Ou, M.-L.; Park, J.-D.; Morris, K.R.; Schwaller, M.R.; Wolff, D.B. Global Precipitation Measurement (GPM) Ground Validation (GV) Prototype in the Korean Peninsula. J. Atmos. Ocean. Technol. 2014, 31, 1902–1921. [Google Scholar] [CrossRef]
  40. Nguyen, G.V.; Le, X.-H.; Van, L.N.; Jung, S.; Yeon, M.; Lee, G. Application of Random Forest Algorithm for Merging Multiple Satellite Precipitation Products across South Korea. Remote Sens. 2021, 13, 4033. [Google Scholar] [CrossRef]
  41. Kim, K.; Park, J.; Baik, J.; Choi, M. Evaluation of topographical and seasonal feature using GPM IMERG and TRMM 3B42 over Far-East Asia. Atmos. Res. 2017, 187, 95–105. [Google Scholar] [CrossRef]
  42. Lee, J.; Lee, E.-H.; Seol, K.-H. Validation of Integrated MultisatellitE Retrievals for GPM (IMERG) by using gauge-based analysis products of daily precipitation over East Asia. Theor. Appl. Climatol. 2019, 225, 2497–2512. [Google Scholar] [CrossRef]
  43. Land Information Platform. Available online: https://map.ngii.go.kr (accessed on 21 July 2023).
  44. Environmental Geographic Information Service. Available online: https://egis.me.go.kr (accessed on 21 July 2023).
  45. Korean Soil Information System. Available online: http://soil.rda.go.kr (accessed on 21 July 2023).
  46. Water Resources Management Information System. Available online: https://wamis.go.kr (accessed on 21 July 2023).
  47. Korea Meteorological Administration. Improvement of Post-Processing Correction Method for Radar Quantitative Precipitation Estimations and Reproduction of Historical Data; WRC2014-05; KMA Weather Radar Center: Seoul, Republic of Korea, 2014; pp. 1–69. [Google Scholar]
  48. Zhange, J.; Howard, K.; Langston, C.; Vasiloff, S.; Kaney, B.; Arthur, A.; Cooten, S.V.; Kelleher, K.; Kitzmller, D.; Ding, F.; et al. National mosiaic and multi-sensor QPE (NMQ) system. Bull. Amer. Meteor. Soc. 2011, 92, 1321–1338. [Google Scholar] [CrossRef] [Green Version]
  49. Lee, J.-K.; Kim, J.-H.; Park, J.-S.; Kim, K.-H. Application of Radar Rainfall Estimates Using the Local Gauge Correction Method to Hydrolgic Model. J. Korean Soc. Hazard Mitig. 2014, 14, 67–78. [Google Scholar] [CrossRef] [Green Version]
  50. Lee, J.-K.; Lee, M.-H.; Suk, M.-K.; Park, H.-S. Application of the Radar Rainfall Estimates Using the Hybrid Scan Reflectivity Technique to the Hydrologic Model. J. Korea Water Res. Assoc. 2014, 47, 867–878. [Google Scholar] [CrossRef] [Green Version]
  51. Scharenberg, B.; Bartles, M.; Braurer, T.; Fleming, M.; Karlovits, G. Hydrologic Modeling System HEC-HMS User’s Manual; Version 4.3; U.S. Army Corps of Engineers Institute for Water Resources Hydrologic Engineering Center (CEIWR-HEC): Davis, CA, USA, 2018; pp. 1–624. [Google Scholar]
  52. Fleming, M.J.; Doan, J.H. HEC-GeoHMS Geospatial Hydrologic Modeling Extension User’s Manual; Version 10.1; U.S. Army Corps of Engineers Institute for Water Resources Hydrologic Engineering Center (HEC): Davis, CA, USA, 2013; pp. 1–193. [Google Scholar]
  53. Peters, J.C.; Easton, D.J. Runoff simulation using radar rainfall data. Water Resour. Bull. 1996, 32, 753–760. [Google Scholar] [CrossRef]
  54. Kull, D.W.; Feldman, A.D. Evolution of Clark’s unit graph method to spatially distributed runoff. J. Hydrol. Eng. 1998, 3, 9–19. [Google Scholar] [CrossRef]
  55. Clark, C.O. Storage and the unit hydrograph. Trans. Am. Soc. Civ. Eng. 1945, 110, 1419–1446. [Google Scholar] [CrossRef]
  56. Arc Hydro. Available online: https://www.esri.com/en-us/industires/water-resources/arc-hydro (accessed on 21 July 2023).
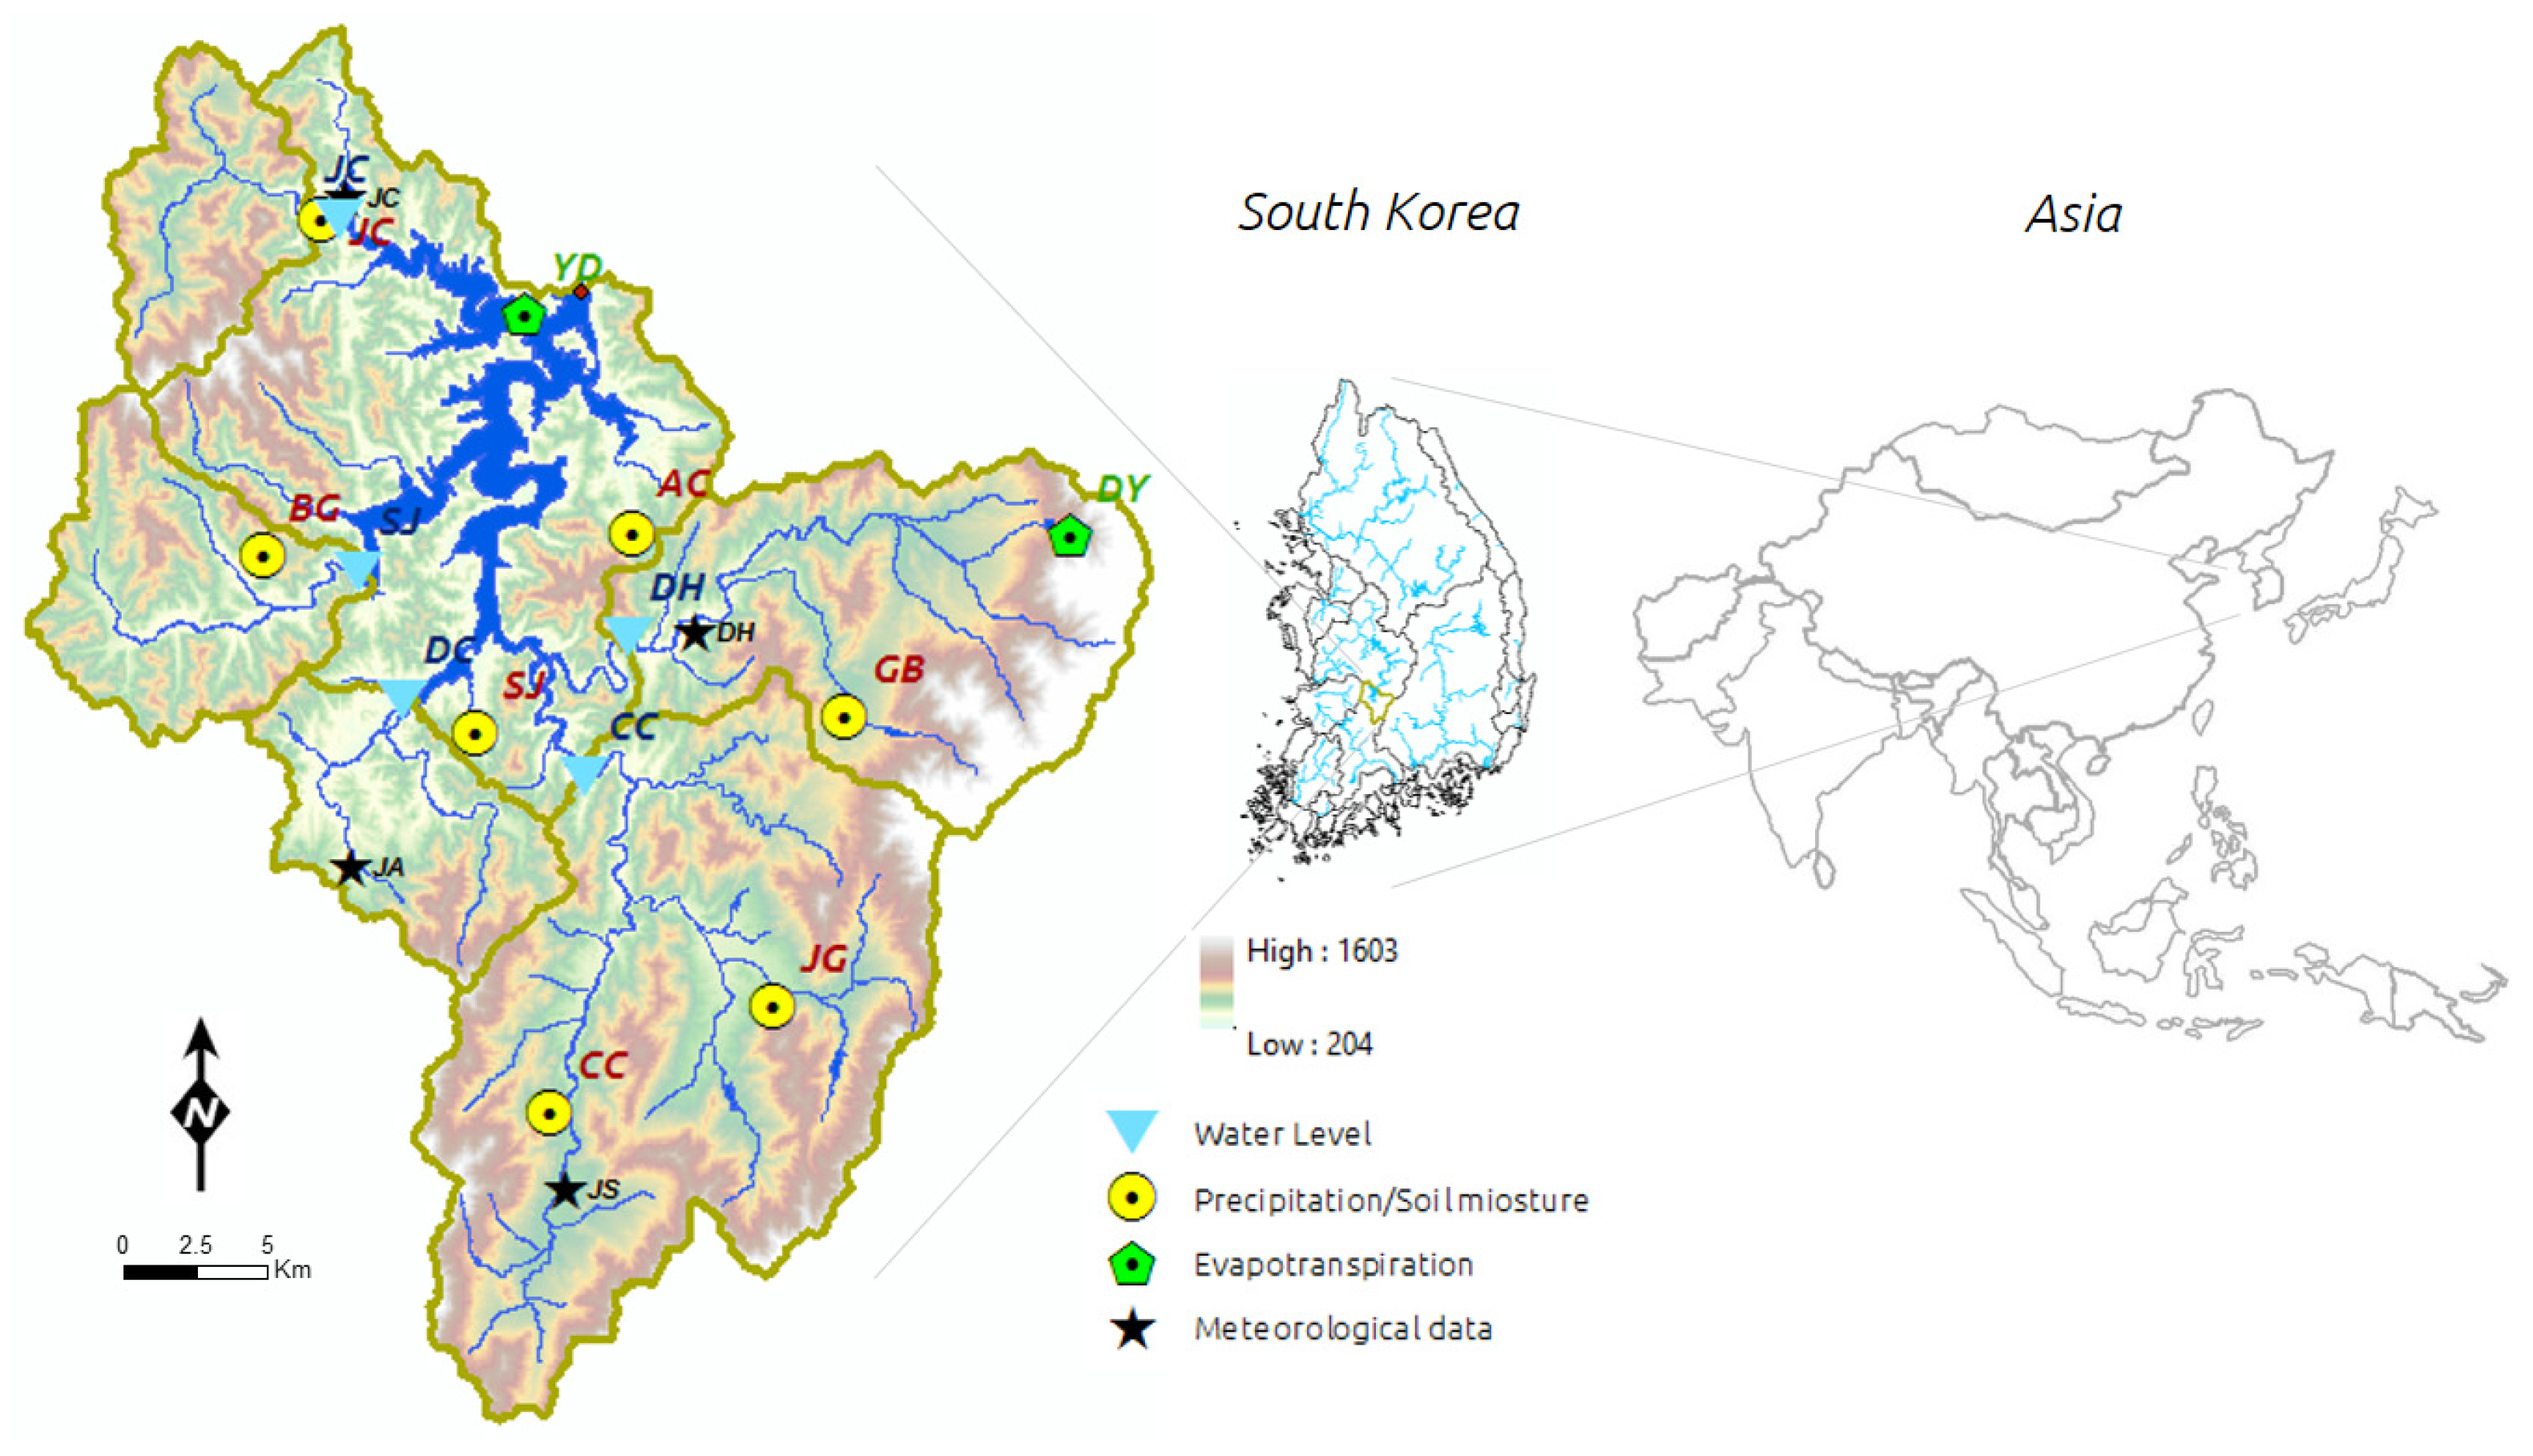
Figure 1. Location of the study area (Yongdam Dam watershed).
Water 15 02898 g001
Figure 2. Land use, hydrological soil groups, and Curve Number of the study area.
Water 15 02898 g002
Figure 3. Schematic diagram of RAR data estimation algorithm (version 2.0), taken from [47].
Water 15 02898 g003
Figure 4. Schematic diagram of the IMERG inputs that go into the IMERG HDF5 and IMERG GIS data products, taken from [9].
Water 15 02898 g004
Figure 5. ModClark conceptual model, taken from [54].
Water 15 02898 g005
Figure 6. Scatter plots comparing the areal-averaged hourly RAR and IMERG products with gauged data, respectively.
Water 15 02898 g006
Figure 7. Spatial distributions of the total cumulative precipitation depth (mm) for eight flood events selected (# stands for event number): (a) RAR by KMA; (b) IMERG by NASA.
Water 15 02898 g007
Figure 8. Developed two HEC-HMS models: (a) Clark model, red circles indicate the points where discharge data are inputted; (b) ModClark model for RAR (upper three figures) and IMERG (lower three figures), which represent the developed grid cells, the calculated flow lengths, and the gridded Curve Number for each grid, respectively.
Water 15 02898 g008
Figure 9. Calibrated parameters from the initial values of each model: black checkmarks represent parameters that require model calibration in all three data simulations, while red checkmarks do not; No changes for CN & number of subreaches; Baseflow parameter values are the same for both model simulations.
Water 15 02898 g009
Figure 10. Hydrographs of flood simulation for the developed models (# stands for event number); X-axis represents simulation time (hours) and Y-axis represents discharge (m3/sec).
Water 15 02898 g010
Figure 11. Hydrographs of flood simulation for the developed models at each flow gauge; X-axis represents simulation time (hours) and Y-axis represents discharge (m3/sec). The dashed line represents the aggregated values of individually measured discharges, accounting for 93% of the observed discharge at the outlet point (storm event #1).
Water 15 02898 g011
Table 1. Locations of rain gauges and water level/flow stations.
TypeStation
(Abrev.)
LongitudeLatitudeElevation
[MASL 1]
PrecipitationGyebuk (GB)127°37′46″ E35°48′27″ N453.00
Janggye (JG)127°36′03″ E35°42′54″ N422.00
Cheoncheon (CC)127°30′49″ E35°40′54″ N409.00
Sangjeon (SJ)127°29′10″ E35°48′11″ N334.00
Bugwi (BG)127°24′12″ E35°51′36″ N396.00
Jucheon (JC)127°25′34″ E35°58′04″ N303.00
Ancheon (AC)127°32′48″ E35°52′01″ N313.00
DischargeYongdam Dam (YD)127°31′40″ E35°56′36″ N268.50
Cheoncheon (CC)127°31′38″ E35°47′19″ N273.50
Donghyang (DH)127°32′41″ E35°49′59″ N291.50
Dochi (DC)127°27′27″ E35°48′43″ N261.10
Seokjeong (SJ)127°26′24″ E35°51′16″ N266.48
Jucheon (JC)127°25′58″ E35°58′03″ N270.86
Note: 1 Meters Above Sea Level.
Table 2. RAR data (version 2.0) specifications.
RAR Specifications
File Name: RDR_ROQCZ_CP15AA_$YYYY$MM$DD$HH$NN.bin.gz
Resolution Description
Temporal10 min
Spatial1 km
Data structure Description
Map systemLambert Conformal Conic projection
Grid cell size1 km
X and Y dimension1241 and 1761
Longitude of central meridian126.0° E (cell number 460)
Latitude of the projection origin38.0° N (cell number 925)
Data table structure
Record Item Description
1Precipitationfloatmm/h
2Radar coverageunsigned char0: inner/1: outer
3Map informationunsigned char-
Table 3. IMERG data (version 06) specifications.
IMERG Specifications
File Name: 3B-HHR.MS.MRG.3IMERG.$YYYY$MM$DD-S$HH$MM$NN-E$HH$MM$NN.$MMMM.V06B.HDF5.nc4
Resolution Description
Temporal30 min (final run, 3.5 months latency)
Spatialabout 10 km (from 90° N–90° S)
60° N–60° S full
Data structure Description
Map systemWGS84
Table 4. Storm events (eight independent events) selected for study area, showing total precipitation and discharge (historical hourly maximum flow; 5519.2 m3/s) amounts.
Storm EventsRain Gauge Precipitation Total (mm)Discharge
#PeriodGBJGCCSJBGJCACAreal AveragePeak
(m3/s)
Total
(mm)
117 August 2014 13:00~2014.08.20 12:0097114128100121100101108.31339.974.2
224 August 2014 01:00~2014.08.28 24:00907164106578710182.2906.067.6
38 August 2015 13:00~2015.07.11 12:005137477759616957.3269.721.7
41 July 2016 13:00~2016.07.03 12:00119128153125101124115122.9729.731.9
516 September 2016 13:00~2016.09.19 24:00147129158148134145162146.1517.338.3
610 September 2017 01:00~2017.09.12 24:006977787373577871.8341.429.7
725 August 2018 13:00~2018.08.30 12:00245286331316288269285286.32192.9168.5
830 August 2018 13:00~2018.09.02 12:00841109884691006186.01127.868.1
Table 5. Procedures of data processing for RAR and IMERGE radar-based precipitation.
DatasetData Processing and Program
ConversionGeo-ReferencingDSS File Generation
RARBinary to ASCII
<NCL script>
Lambert Conformal Conic to SHG grid
(Albers Equal-Area)
<Python script>
HEC-GridUtil
<asc2dssGrid.exe>
IMERGnetCDF4 to ASCII 1WGS84 to SHG grid
(ITRF2000) 1
Note: 1 The same Python script in ArcGIS (ArcPy) is utilized for both processing steps.
Table 6. Calculation methods for the developed HEC-HMS models.
Hydrologic
Element
Calculation
Type
Methods
Gauged Data
Simulation
Radar-Based Data
Simulation
PrecipitationGauge Weights
(Thiessen polygon)
Gridded data
(RAR, IMERG)
SubbasinRunoff-depthSCS Curve Number (CN)Gridded SCS CN
Direct-runoff
(Transform)
Clark Unit Hydrograph
(Clark)
Modified Clark Method
(ModClark)
BaseflowRecession
ReachRoutingMuskingum
Table 7. Amounts of areal average precipitation total for gauged and radar-based data.
Storm EventsPrecipitation Total (mm)
#PeriodGauged DataGround-Borne Radar DataSpace-Borne Radar Data
Areal AverageMinMaxAreal AverageMinMaxAreal Average
117 August 2014 13:00~2014.08.20 12:00108.364.8146.988.796.5174.2134.4
224 August 2014 01:00~2014.08.28 24:0082.237.4100.158.980.9113.299.5
38 August 2015 13:00~2015.07.11 12:0057.316.865.338.19.281.239.0
41 July 2016 13:00~2016.07.03 12:00122.912.3183.596.9116.7152.3138.9
516 September 2016 13:00~2016.09.19 24:00146.115.3145.2101.191.6121.3102.0
610 September 2017 01:00~2017.09.12 24:0071.85.177.850.632.256.142.1
725 August 2018 13:00~2018.08.30 12:00286.322.7305.9198.6128.4218.9189.4
830 August 2018 13:00~2018.09.02 12:0086.04.8113.356.750.2110.771.0
Table 8. Initial parameter values for the developed HEC-HMS models.
Hydrologic
Element
ProcessInitial Parameter Values
Gauged Data
Simulation
Radar-based Data
Simulation
SubbasinLossSCS Curve Number (CN)
- CN: determined
- Initial abstraction (mm): 0
- Impervious (%): 0
Gridded SCS CN
- CN: determined
- Ratio: 0.05
- Factor: 1.0
TransformClark Unit Hydrograph and ModClark
- Time of concentration (HR): determined
- Storage coefficient (HR): 2.0
BaseflowRecession
- Initial discharge (m3/s): observed
- Recession constant: 0.2
- Ratio to peak: 0.4
ReachRoutingMuskingum
- Muskingum K (HR): 0.25
- Muskingum X: 0.25
- Number of subreaches: 1
Table 9. Statistical results of flood simulation for the developed models.
Storm Events #Gauged Data
Simulation
Ground-Borne Radar Data
Simulation
Space-Borne Radar Data
Simulation
ENSR2PBIAS (%)ENSR2PBIAS (%)ENSR2PBIAS (%)
10.9140.93716.970.9140.9144.010.8780.878−1.20
20.9410.945−5.610.9190.9259.540.8420.843−3.14
30.8440.853−9.050.7160.752−18.060.6630.697−13.90
40.9200.928−7.350.9210.920−2.570.9060.905−0.99
50.8930.902−6.690.9120.921−7.280.6110.62914.35
60.8000.8120.380.7630.765−0.630.7730.7909.05
70.9300.94811.870.8950.896−0.180.6700.673−7.34
80.9210.9251.430.8650.891−17.640.8610.878−7.19
Avg. *0.8950.9067.420.8630.8737.490.7760.7877.15
Note: * Average: ENS and R2 arithmetic mean; PBIAS arithmetic mean of absolute value.
Table 10. Model efficiency (ENS) of flood simulation results at each water level/flow gauges.
Storm Events #Gauged Data
Simulation
Ground-Borne Radar Data
Simulation
Space-Borne Radar Data
Simulation
CCDHDCSJJCCCDHDCSJJCCCDHDCSJJC
10.810.550.610.880.680.930.900.600.800.350.880.820.730.690.27
20.920.920.710.880.380.930.920.660.480.400.710.700.650.890.44
30.660.930.510.920.850.930.730.150.800.740.890.75−0.10.74−0.14
40.740.81N/A *0.860.600.810.85N/A *0.760.310.830.89N/A *0.770.79
50.950.95N/A *0.080.65 *0.960.90N/A *0.61−0.42 *0.910.85N/A *−0.28−1.18 *
60.860.910.82N/A *0.940.960.950.86N/A *0.860.950.900.61N/A *0.79
7−0.74 *0.95−4.58 *−2.02 *N/A *−0.08 *0.79−2.89 *−3.09 *N/A *0.64 *0.490.40 *0.57 *N/A *
80.850.94−1.19 *0.97N/A *0.940.83−1.46 *0.96N/A *0.740.940.60 *0.86N/A *
Avg.0.830.870.660.770.690.920.860.570.740.530.830.790.470.610.43
Note: * Observation (streamflow discharge) error.
Disclaimer/Publisher’s Note: The statements, opinions and data contained in all publications are solely those of the individual author(s) and contributor(s) and not of MDPI and/or the editor(s). MDPI and/or the editor(s) disclaim responsibility for any injury to people or property resulting from any ideas, methods, instructions or products referred to in the content.