1. Introduction
With the rapid progress of industrialization, urbanization, and global climate change, the increased discharge of industrial wastewater and domestic sewage alongside intensified lake development activities may cause urgent water security issues, such as water shortage, water pollution, flooding, and ecosystem degradation in cities [
1]. Lakes are a vital component of urban ecosystems, serving as an essential water feature that contributes to flood protection, runoff regulation, pollution control, climate adjustment, and overall ecosystem balance maintenance. With the continuous impact of human activity on the development of the natural environment, significant changes have occurred in the lake system of the middle and lower reaches of the Yangtze River, epitomized by the cluster of lakes in Wuhan. The gates and dams during the urban expansion have blockaded the rivers from their connected lakes [
2], resulting in weakened urban lake regulation and storage functions, which can decrease the lake’s self-purifying abilities, increase its eutrophication, and damage its ecological functions [
3,
4]. The number of lakes has been significantly reduced in Wuhan during the last 30 years. The ecosystem of rivers, lakes, and wetlands has suffered severe degradation. Despite its reputation as the “city of 100 lakes,” many lakes in Wuhan have been heavily polluted due to the independent nature of these water bodies and significant discharge, creating a pressing issue of water safety. These pressing issues act as key bottlenecks, hindering the sustainable economic and social development of Wuhan. Consequently, it is imperative to conduct a systematic analysis and research on urban lakes in Wuhan, in order to assess the trends in water quality and the water demand of the ecological environment. The findings should be duly considered when allocating and managing water resources.
A lake water quality model was developed based on the advancement of river water quality models. In 1925, H. W. Streeter and Earle B. Phelps were the first to propose the oxygen balance model as a water quality model. Phelps summarized it as the Streeter–Phelps model in 1944. Over the course of more than 40 years, the lake water quality model has undergone gradual improvement. Currently, numerous scholars have conducted extensive research on hydrodynamic power and water quality. For example, in an earlier work, Zhao et al. [
5] reported a numerical coupled model of lake–river network hydrodynamics and water quality, which was applied to the Taihu basin. Lai et al. [
6] developed a two-dimensional hydrodynamic and water quality coupled simulation model of Poyang Lake, using the finite volume method on unstructured grids for discretization. The water volume, momentum, and material transport fluxes at the unit interface were calculated using the HLLC algorithm. Very recently, Li et al. [
7] and Hu and Zhou conducted two-dimensional water quality and quantity simulations of Shahe Reservoir and Shifosi Reservoir [
7,
8]. The lake ecological water demand model was built by Wang et al. [
9]. The Dianchi Lake Basin was used as an example of linking river and lake ecosystems and studying the law of lake ecological water use. He et al. analyzed Baiyangdian’s ecology to assess the uncertainty of its ecological water demand [
10].
Determining the water demand in shallow lakes has emerged as a new research focus. A majority of the current research has concentrated on the ecological water demand of single rivers and lakes [
11,
12,
13,
14,
15]. In contrast, few studies have been conducted on the effects of ecological water diversion on water quality in urban rivers and lakes in the water network area. Moreover, the inefficient utilization of water resources can result in a lack of coordination between upstream and downstream areas and the implementation of independent water replenishment plans.
MIKE21, developed by the Danish Hydraulic Institute (DHI), was used to establish a 2D model and water quality model. In this work, the MIKE water quality model was set up, coupled with the hydrodynamics needed to improve the water environment. An analysis was carried out to examine the changes in water quality in Lake Hou before and after pollution interception and control measures, followed by a study on the enhancements in the lake’s water quality at various diversion levels. The study evaluates the impact of different diversion flows on water quality improvement. This research holds great significance for the rational utilization of water resources, water quality management, and ecological protection of lake water.
2. Materials and Methods
2.1. Description of the Study Area
Lake Hou, situated in the middle and lower reaches of the Yangtze River, is a prototypical urban lake in Wuhan, Hubei Province. It is located between longitudes 30°45′ and 30°44′ E and latitudes 114°14′ and 114°19′ N (
Figure 1), with an area of about 16.3 km
2 and a watershed area of 157 km
2. The lake’s shape is rectangular and elongated, with 9.06 km in length, average 2.11 km in width, and 2.2 m in average depth, with a reservoir capacity of 42.437 million m
3.
The studied catchment is situated in a subtropical monsoon climate zone characterized by warm and humid temperatures, ample rainfall, abundant sunlight, and distinct four seasons. The average annual sunshine hours are about 1540–2180 h and average temperature is 15.7 °C–16.4 °C. Precipitation varies greatly within the year, with May to October being the main flood season. High seasonal rainfall (63.9% of the annual precipitation) and a high evaporation rate are further characteristics of the main flood season.
Lake Hou acts as a natural reservoir for a variety of effluents, including household, industrial waste, agricultural, and sewage. Its primary functions include flood control and storage, aquaculture, agricultural irrigation, and environmental beautification. The rapid pace of the urban development of the basin in the recent years deteriorated the water quality. By incorporating the findings from the ongoing water-quality-monitoring program, a two-dimensional numerical simulation was executed to ascertain the ecological water demand of representative lakes. According to the hydrological drainage frequency, 1986 was chosen as the typical representative year to simulate the situation of Lake Hou. The underwater topography of Lake Hou, annual rainfall data, and wind field conditions in 1986 were collected as boundary conditions to construct the hydrodynamic model. The initial water quality, supplement water quality, and the pollutants’ load were also collected as boundary conditions to establish the hydrodynamic model.
2.2. Numerical Modeling of Hydrodynamics and Water Quality
2.2.1. Hydrodynamic Model
Numerous research findings on the mechanism indicate that wind serves as the primary driving force for water dynamics, especially in shallow lakes. Another significant factor is the throughput flow generated by the inflow and outflow of water through the peripheral rivers. Hence, the water movement in shallow lakes exhibits a combined flow pattern, primarily driven by wind-generated flow with supplementary contribution from throughput flow [
16,
17,
18]. The basic equation is given by:
where,
stands for average lake level;
stands for actual water depth;
stands for gravitational acceleration;
and
stand for the flow velocity components along
and
axes;
stands for the Coriolis force coefficient;
and
stand for the frictional components;
stands for water density;
stands for the flow rate in and out of the lake per unit area; and
and
stand for the component of wind stress.
Coriolis force coefficient’s equation is given by:
In the equation, φ stands for the latitude; ω stands for the angular velocity of the Earth’s rotation.
Wind stress fraction of the lake’s surface is given as:
where,
and
stand for the wind speed in the direction of
;
stands for the wind stress;
stands for the wind speed at 10 m from the lake’s surface; and
stands for the air density.
The friction component of the lake’s bottom:
, where n stands for the roughness of the lake’s bottom.
2.2.2. Water Quality Model
Water quality basic equation is:
where
stands for the width flow of horizontal single;
stands for the water depth of the lake;
stands for width flow of the vertical single;
stands for the concentration of pollutant index;
stands for horizontal diffusion coefficient;
S stands for the source/sink term, the number of pollutants carried by water entering and exiting the lagoon;
stands for the complex biochemical reaction process of pollutants;
stands for vertical diffusion coefficient [
19,
20].
2.3. Data Processing
2.3.1. Underwater Topography and Computational Grid
Using the Beijing 1954 3 Degree GK CM 114E projection, Lake Hou’s underwater topography and triangular mesh were measured and generated. The study region was divided into 3019 grids with 1706 nodes.
2.3.2. Simulations
The following four scenarios were used to analyze the water quality changing trends in Lake Hou under hydrological conditions in 1986.
Table 1 provides a list of simulated scenarios’ objectives.
2.3.3. Boundary Conditions
Rainfall and Evaporation
To determine the rainfall and evaporation amounts for Lake Hou, the Huangpi rainfall station and Wuhan evaporation station were selected as references. The annual rainfall of Lake Hou in 1986 was 913.5 mm, and the annual evaporation was 1567.7 mm.
Runoff
Runoff data of the representing year (1 January to 31 December 1986) were utilized for this simulation. Specifically, the runoff of Lake Hou was estimated using the measured rainfall data from the Wujiashan station.
Table 2 presents the monthly runoff values for the target lake.
Wind Field Conditions
The monthly average wind direction and speed are shown in
Table 3.
The Initial Water Quality
The initial water quality in the different calculation scenarios is presented as follows.
Water samples were obtained from Wuhan Ecological Environment Monitoring Center in November 2021 during the dry season. We collected samples at 114°16′49″ E and 30°43′59″ N (UTM coordinates).
Scenario 1 and Scenario 2: The initial COD, TN, and TP were measured, and the concentrations were 15.60 mg/L, 4.03 mg/L, and 0.276 mg/L, respectively.
Scenario 3 and Scenario 4: The average water quality of the entire lake on December 31, obtained from the simulation of Scenario 2, was employed as the initial water quality for the study. COD, TN, and TP initial conditions were determined to be 4.03 mg/L, 1.24 mg/L, and 0.088 mg/L, respectively.
Quality of the Supplementary Water
Lake Hou can receive additional water supply from Fuhuan River. Based on the simulation results of the river, the TP concentration is recorded at 0.16 mg/L and the COD concentration stands at 7.4 mg/L during the recharge period. Meanwhile, through a thorough analysis of the water quality monitoring data for the Han River, it has been ascertained that the TN concentration of the Han River during the recharge period is 1 mg/L.
In order to decrease the TP concentration, a settling tank was set up after the diversion gate. Considering the effect of coagulative precipitation and economic factors, the TP content of the purified water is 0.05 mg/L, and the COD and TN can be removed at the same time by the flocculation and sedimentation with the removal rates of the approximate 30% and 25%, respectively. Consequently, the supplementary water quality of Lake Hou should contain 0.05 mg/L of TP, 0.75 mg/L of TN, and 5.18 mg/L of COD.
The Pollution Load
Scenario 1 covers the amount of pollution found in the lake in the current year (2015). Scenario 2, Scenario 3, and Scenario 4 cover the amount of pollution expected to be found in the lake in the planning year (2030) after a series of pollution interception and control measures.
Table 4 shows the amount of pollution load in both the current year and planning year. The pollution entering the lake primarily arises from point-source pollution, non-point-source pollution, and internal-source pollution. Among these, point source pollution mainly comprises industrial waste water, effluent from sewage treatment plants, urban domestic sewage, and waste water from large-scale livestock and poultry farms. These pollutants are continuously released into the lake through a multitude of discharge points. Non-point-source pollution encompasses rural domestic sewage, rural domestic waste, decentralized pollutants from livestock and poultry farming, agricultural runoff from planting activities, and urban surface runoff, among others. Non-point-source pollution is characterized by its origins within the lake catchment, and subsequently enters the lake through various catchments in response to rainfall events. The internal source pollution primarily stems from aquaculture activities and the release of sediments within the lake.
Model Parameters
Combined with the results of “Analysis of Pollution Capacity of Important Lakes in Hubei Province”, the value of
M is 35, and the TN, TP, and COD attenuation coefficients are 0.025 (1/d), 0.02 (1/d), and 0.02 (1/d), respectively [
1].
Initial Water Level and Flow Rate
The initial water level and flow rate were set at a constant elevation of 17.05 m and zero, respectively.
3. Results and Discussion
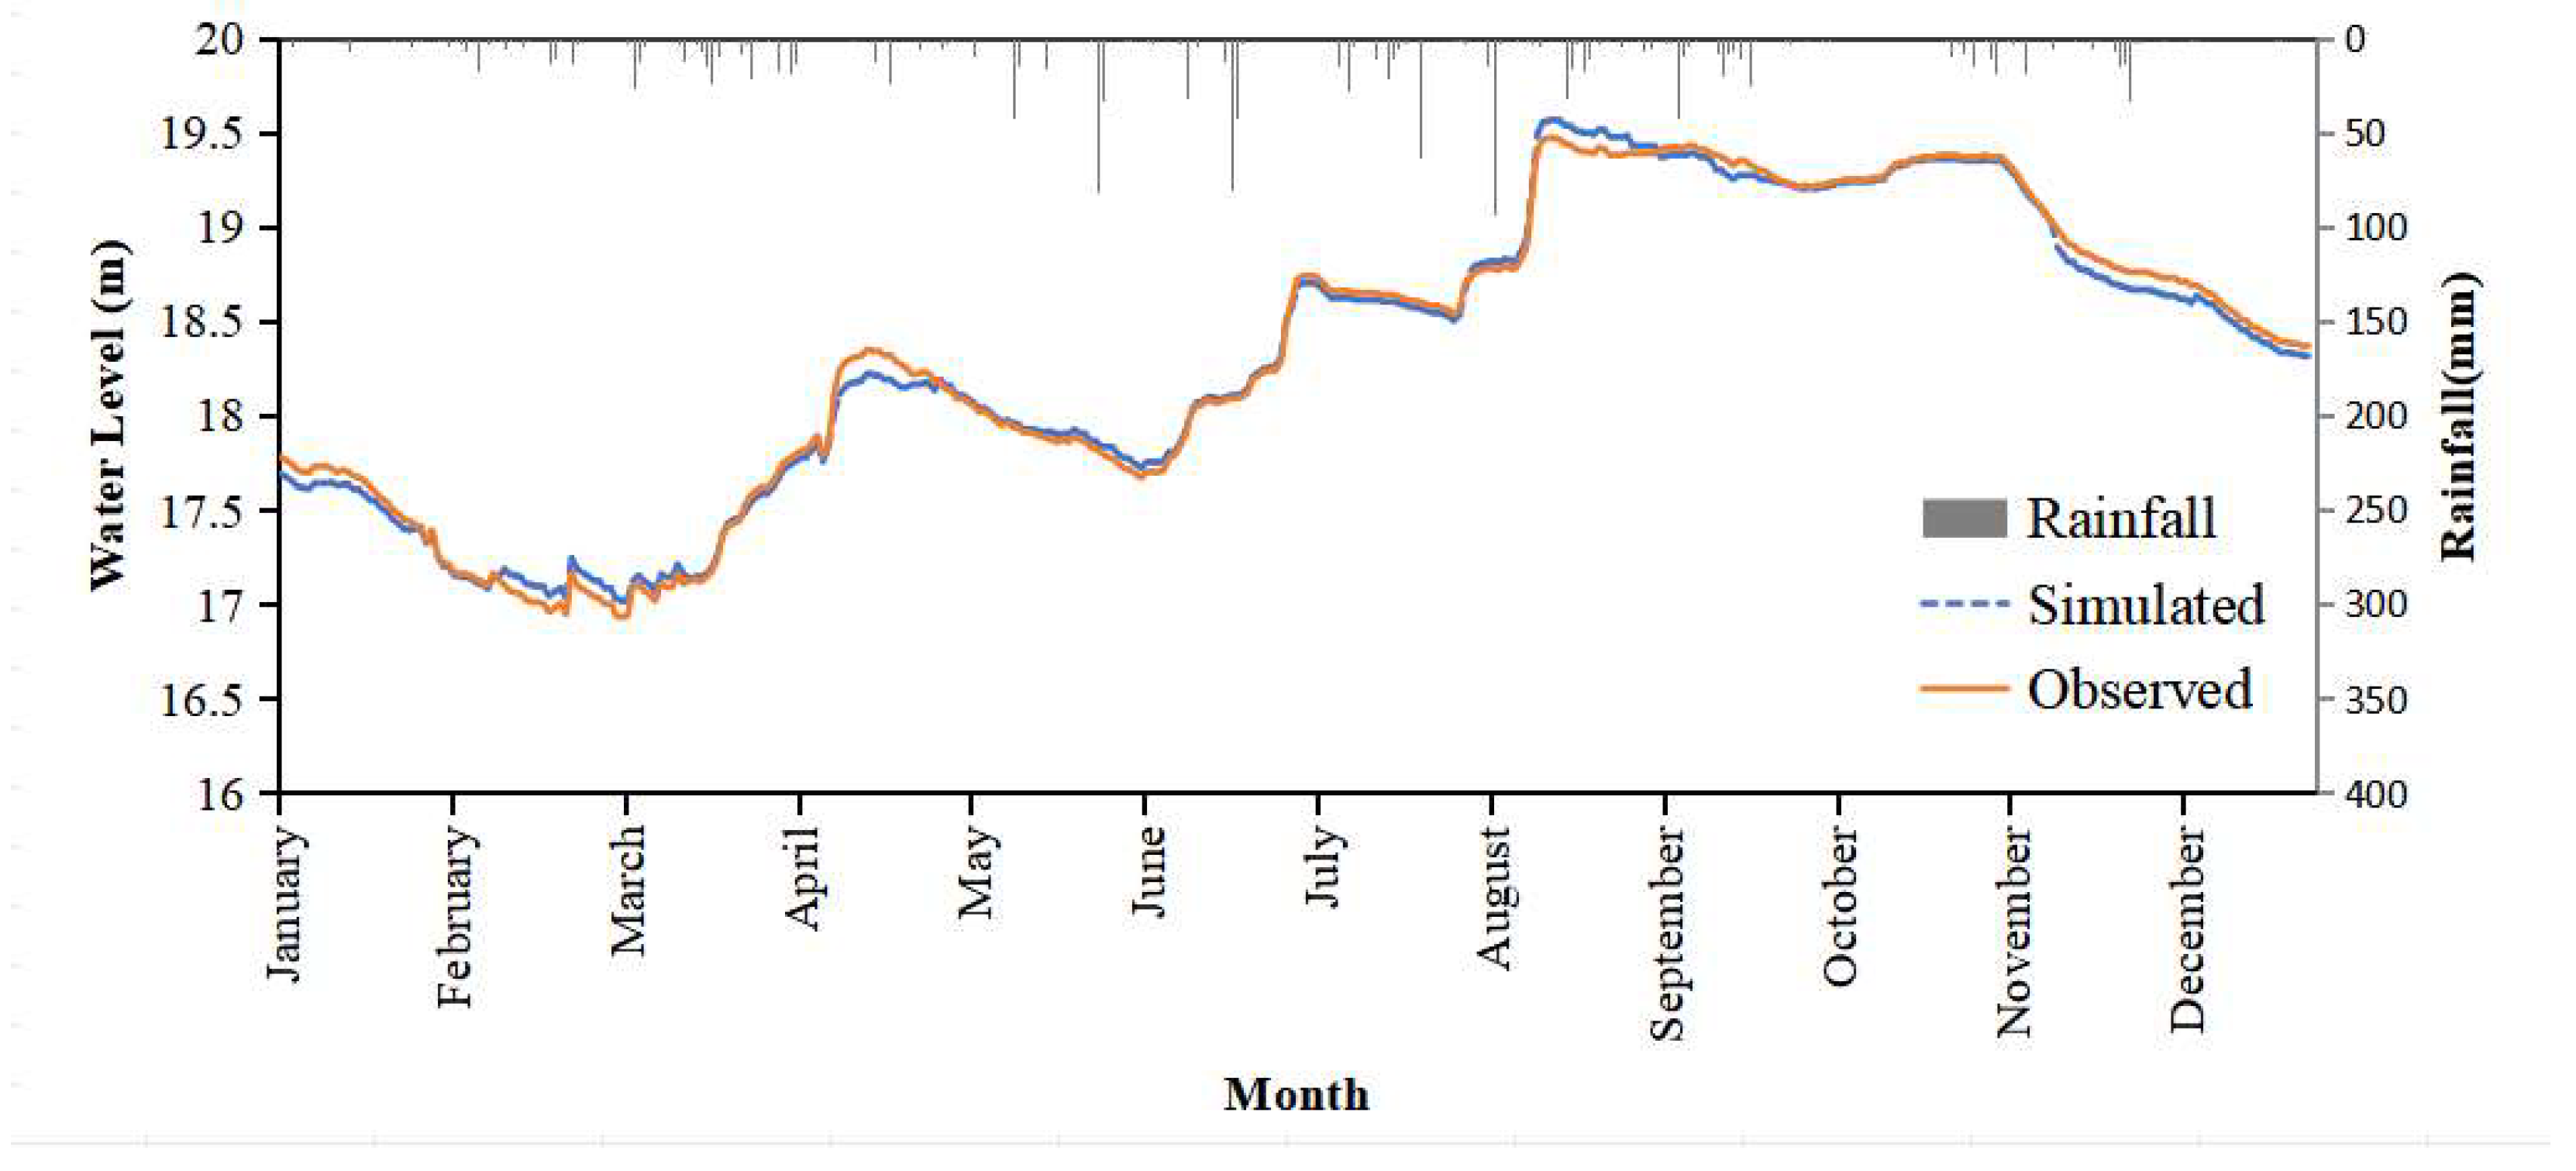
3.1. Hydrodynamic Model Verification
The simulations of water levels showed a strong consistent trend with the observed data (
Figure 2), with a mean relative error (MRE) of 0.27% and a correlation coefficient (R2) of 0.99, which indicate that the performance was good. It is clearly shown that the average MRE was less than 10%, which indicates that the model can effectively simulate the changes in the lake’s water level [
21,
22].
There were strong correlations between the simulated temporal TN, TP, and COD values and the surveyed data (
Figure 3). The correlation coefficients for TN, TP, and COD simulations are 0.77, 0.86, and 0.80, respectively. The MRE values for TN, TP, and COD are 14.4%, 11.7%, and 22.9%, respectively. Based on the references [
21,
22,
23], water quality modeling with relative errors less than 50% can be considered as acceptable performance. Therefore, the model established this time is sufficient to scientifically and reliably reflect the hydrological and water environment changes of Lake Hou.
3.2. Scenarios 1–3
Under the current level of annual pollution load, the measured water quality in the current drought period was used as the initial condition.
The used pollution amount is set to be the amount after the pollution control in the planning year. The initial water quality is the measured one in the current drought period in Scenario 2.
In accordance with the planned annual pollution amount after implementing pollution reduction, the year-end water quality in Scenario 2 was adopted as the initial water quality for Scenario 3.
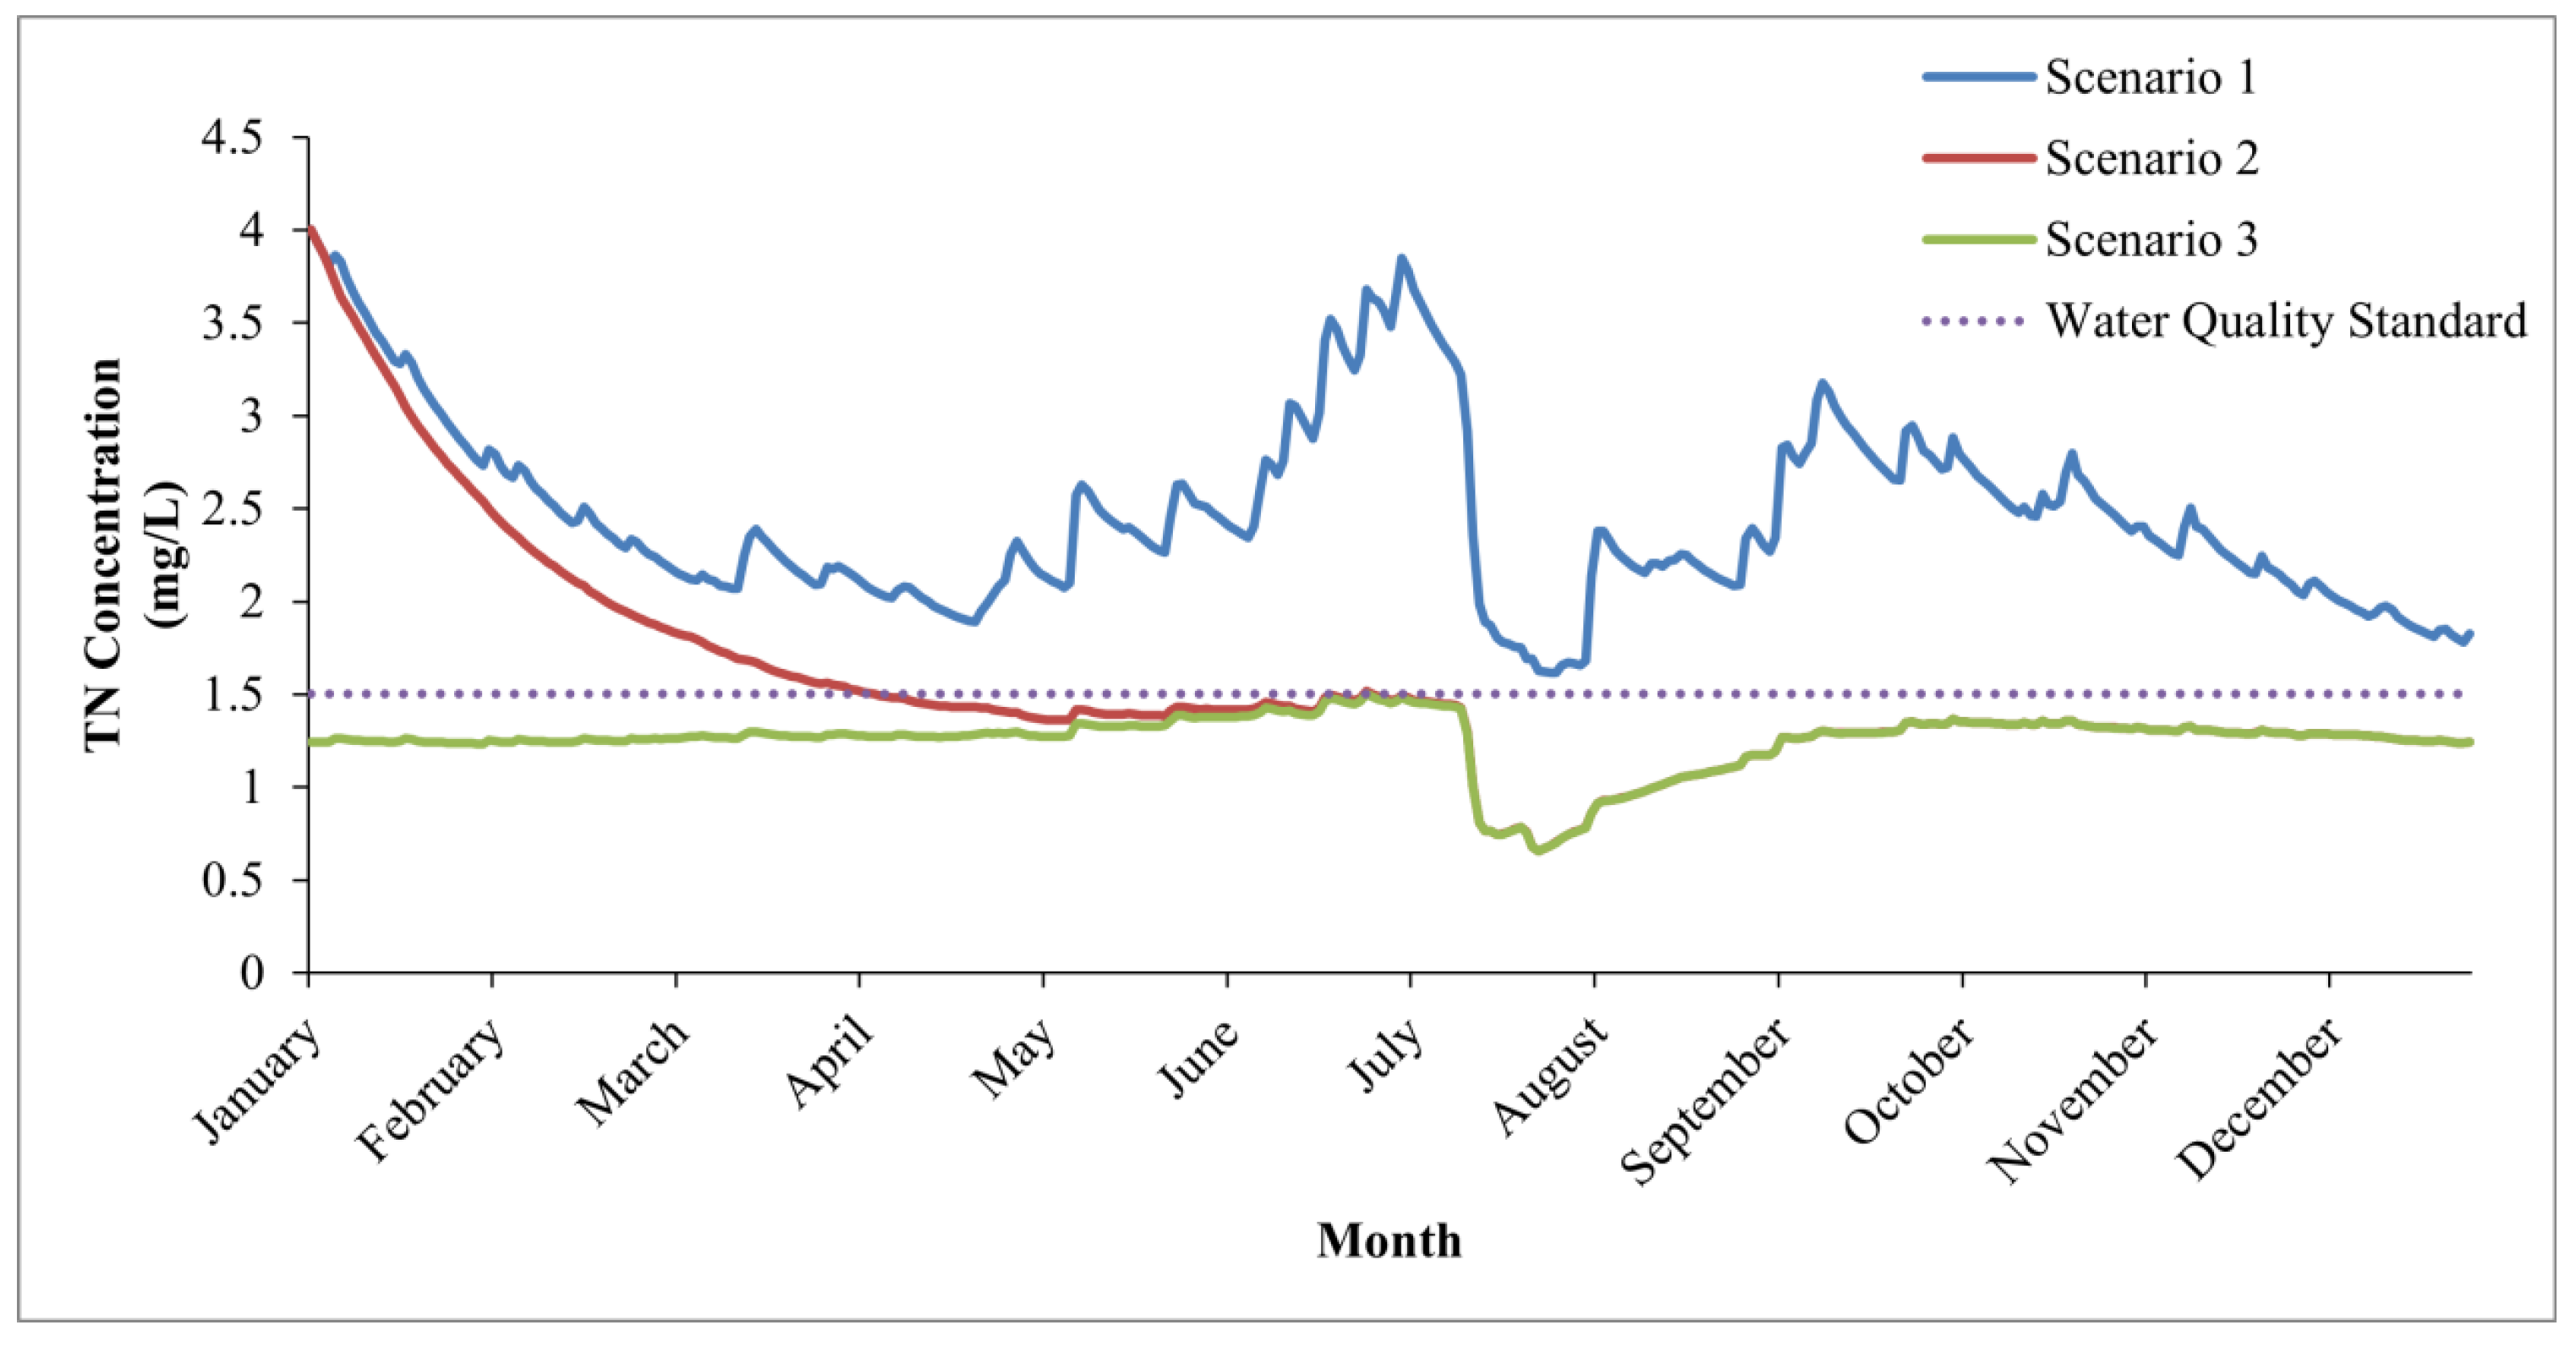
The changes of COD, TN, and TP concentrations throughout the year in Lake Hou in three different scenarios showed an essentially consistent trend (
Figure 4,
Figure 5 and
Figure 6).
The water quality of Lake Hou was poor in 90% of the dry-water year under Scenario 1. The max concentrations of COD, TN, and TP were 40.9 mg/L, 15.5 mg/L, and 12.3 mg/L, respectively, all of which exceeded the Class Ⅳ standard (Environmental Quality Standard for Surface Water (GB3838-2002)) [
24]. COD exceeds the standard around the half-year point, especially in June, July, and September. The concentrations of both TN and TP consistently fail to meet the prescribed standards throughout the year. In certain periods, the water quality even falls below the classification of Class V. Therefore, the primary task of lake management is to cut down the amount of pollutants entering into the lake. For the sake of analyzing after taking effective measures (Scenario 3), it is key to use the value of Scenario 2 through the simulation, which serves as the baseline water quality for Scenario 3.
The simulation analysis of Scenario 2 clarifies the water quality value in the drought period after one year of implementing the pollution control measures at the planning level. It is more appropriate to consider the last day’s value in this simulation as the initial water quality in Scenario 3, rather than relying on the currently measured water quality.
Based on the calculation results in Scenario 3, COD and TN basically meet the Class IV standard, while the concentration of TP still exceeds the Class IV standard throughout the year and reaches Class V level in summer, especially from June to July, even after the implementation of pollution control measures. Thus, it can be concluded that relying solely on pollution reduction measures will not necessarily lead to the further improvement of the environment. This result is consistent with that of many lake studies [
1]. It is necessary to connect rivers and lakes to build a circulating and unobstructed water channel for lakes to afford enough water supply.
3.3. Scenario 4
3.3.1. Ecological Water Replenishment Scheme
Three preliminary recharge scenarios were developed for simulation, as demonstrated in
Table 5.
3.3.2. Analysis on the Effect of Water Replenishment
The simulation modeled the change patterns of each water quality index, including TP, TN, and COD, in Lake Hou under three replenishment conditions: 10 m
3/s, 15 m
3/s, and 20 m
3/s, respectively. The change processes of water quality under the above three recharge flows versus with time were obtained as shown in
Figure 7,
Figure 8,
Figure 9,
Figure 10,
Figure 11 and
Figure 12. As shown in the figures, the coupling pollution control with water replenishment can accelerate water circulation and further improve the water environment. Moreover, the improved effect of different recharge flows on the lake gradually increases with the increment of the recharge flow.
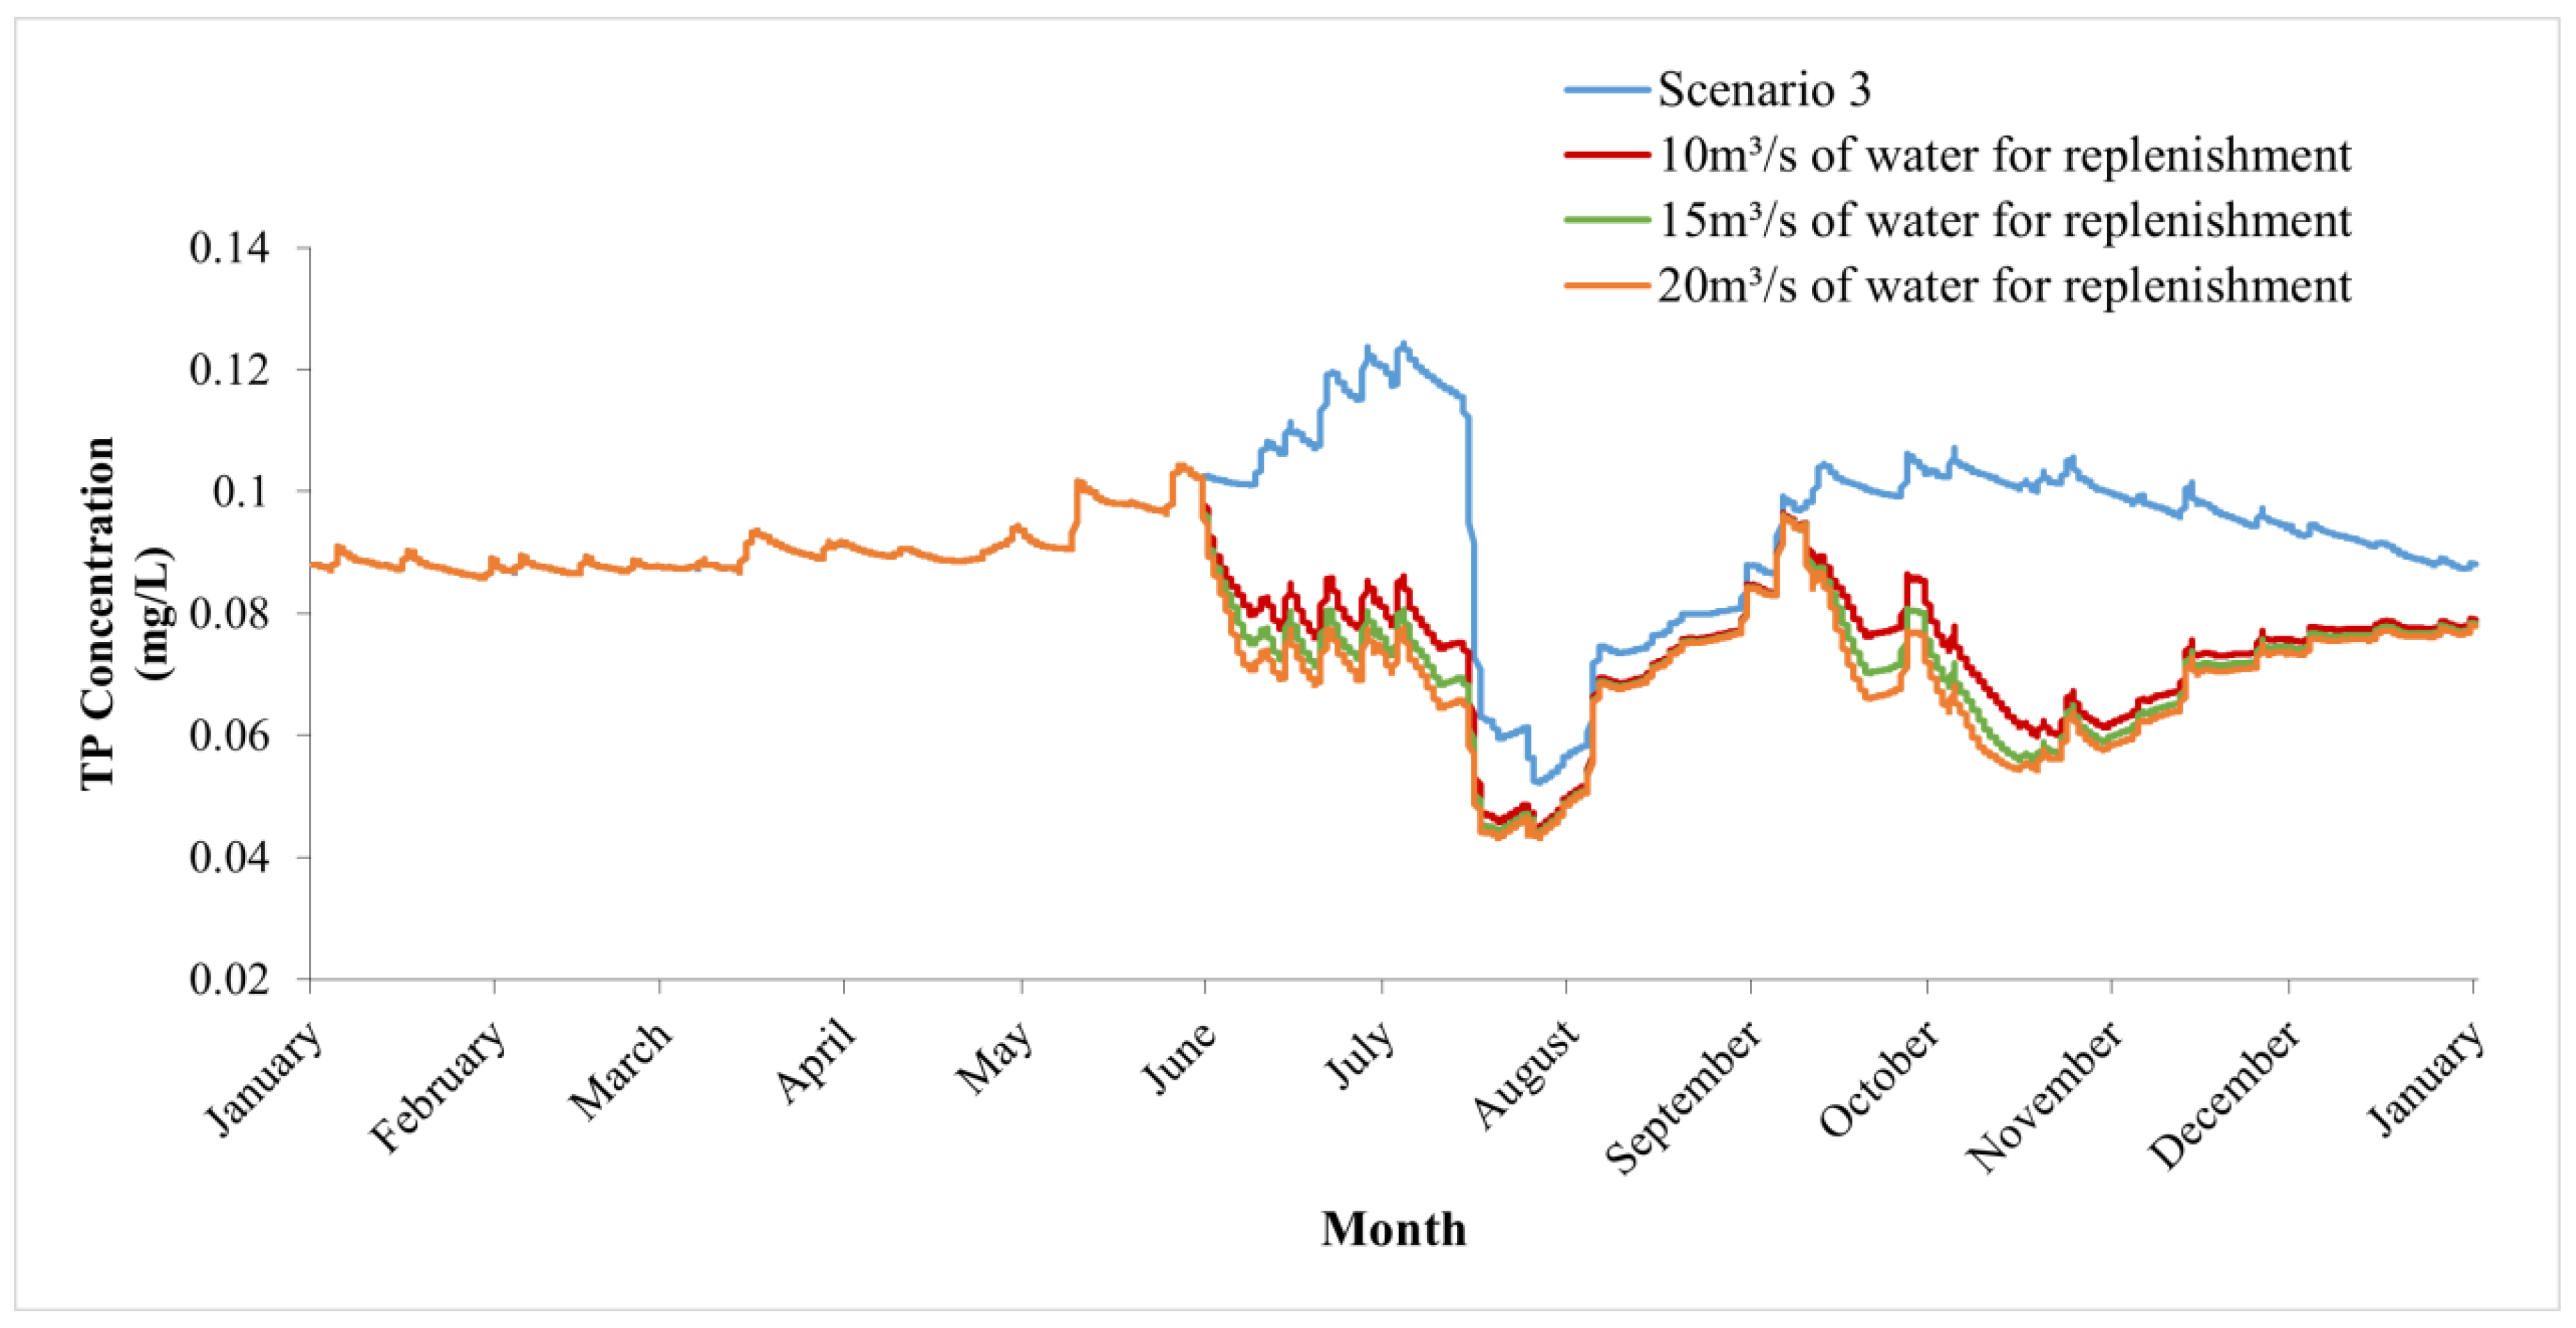
The day-to-day mean concentrations of TP, TN, and COD in Lake Hou were evaluated, and the improvement effect relative to Scenario 2 is presented in
Table 6. As the water recharge flow increases, the degree of improvement of all indicators increase, while the rate of water quality improvement demonstrates a declining trend.
Figure 7,
Figure 9 and
Figure 11 reveal that the TP, TN, and COD of Lake Hou could show a standard better than that of Class IV for the whole year when the above recharge flow is applied. The maximum increase rate of water quality improvement can be obtained when the recharge flow is 15 m
3/s. Through the above analysis, it can be confirmed that the replenishment period of Lake Hou is from 1 June to 10 July, 11 September to 20 September, and 1 October to 31 October, with a recharge flow of 15 m
3/s.
The increased rate of water quality improvements after water diversion has been subjected to statistical analysis. The p value is 0.018, which is less than 0.05. It has been proven that there is a significant difference when the recharge flow increases from 10 to 15 m3/s than when the recharge flow increases from 15 to 20 m3/s.
Based on our current understanding, despite the implementation of numerous pollution interception and control measures, the water quality of lakes cannot be effectively improved without the introduction of water diversion due to their limited fluidity. In recent times, the hydrodynamic water quality model has gained widespread usage in assessing the improvements in lake water quality, following water diversion. The model offers valuable insights into the magnitude and spatial distribution of improvements in the lake following water diversion, thereby providing essential data support for future lake protection endeavors.
Through a comprehensive consideration of hydrodynamic and water quality results, we can conclude the following: with the growth of the diversion flow, the water environment has improved significantly, but the efficiency of improving diversion flow does not show a linear increase. Instead, there is a certain threshold beyond which the additional benefit of increasing the diversion flow diminishes. Considering the economy of water diversion, 15 m3/s is thought to be the best solution rate to achieve the goal of water quality improvement.
4. Conclusions
The model effectively captured water environment improvement under different conditions, following the implementation of pollution interception and control measures. The results showcased the model’s remarkable accuracy and its suitability for a wide range of scenario analyses.
The overall water quality in Lake Hou fails to meet the required standards and falls below satisfactory levels. Moreover, the water body is already strained with a limited capacity to accommodate additional pollution inputs. In order to comply with the standards, the pollution load entering the lake has been reduced in accordance with the water’s environmental capacity. Comprehensive measures are being implemented to enhance the environmental capacity, which include improving the quality and efficiency of the urban sewage system, controlling pollution from urban surface sources, preventing and regulating internal sources of pollution, constructing water networks, and implementing water diversion strategies.
Based on the simulation results, it is evident that the increase in water volume has a significant impact on improving the hydrodynamics of Lake Hou. Based on this finding, it is evident that relying solely on pollutant reduction measures will not be sufficient to meet environment improvement requirements for the lake. By constructing river–lake connectivity channels, the increasing water volume can enhance the hydrodynamics of the lake, facilitate the diffusion of and reduction in pollutants, and ensure that the water environment of the lake meets the required standards.
The results indicate that as water diversion increases from 10 to 20, there are respective improvements in TP of 28.94%, 33.14%, and 35.74%. Similarly, there are improvements in TN of 24.14%, 27.77%, and 30.10%, respectively. Furthermore, there are corresponding improvements in COD of 14.30%, 15.57%, and 16.29%, respectively. This is a strong correlation between the flow rate of diversion and the improvement in water quality of the lake. Nevertheless, it is clearly shown that, as the amount of water diversion increases, the rate of improvement in water quality demonstrates a decreasing trend. The rate of improvement for TP, TN, and COD decreases from 4.2% to 2.6%, 3.56% to 2.4%, and 1.27% to 0.72%, respectively, as the flow rate of water diversion continues to increase. This indicates that further increasing the water flow does not cause a significant benefit to water environment improvement.
In light of these, the economics of the diversion should be fully justified in terms of cost, implementation difficulty, and water environment improvement when considering the diversion of water for the ecological replenishment of the lake. The study serves as a foundation for guiding future conservation and development activities in urban lakes.
Author Contributions
Methodology, Z.W.; Software, C.Z.; Data curation, Y.C.; Writing—original draft, J.L.; Writing—review & editing, Z.W.; Supervision, Y.L. All authors have read and agreed to the published version of the manuscript.
Funding
This study was funded by the Key Supported Project of Regional Innovation Development Joint Fund by National Natural Science Foundation of China (U21A2002).
Data Availability Statement
Due to confidentiality requirements, the original data is not conveniently available.
Conflicts of Interest
The authors declare no conflict of interest.
References
- Li, J.; Chen, Y.; Wang, Z. Effect of pollution load reduction on water quality in rural lakes in the shallow hill water network area. Water Supply 2022, 22, 6213–6229. [Google Scholar] [CrossRef]
- Wang, Y.; Zhang, W.; Zhao, Y.; Peng, H.; Shi, Y. Modelling water quality and quantity with the influence of inter-basin water diversion projects and cascade reservoirs in the Middle-lower Hanjiang River. J. Hydrol. 2016, 514, 1348–1362. [Google Scholar] [CrossRef]
- Tan, F.; Wang, H.; Xiao, W.; Li, Y.; He, P. Talk about Lakes Present Situation and Existing Problems and Countermeasure Thought in China. Water Conserv. Sci. Technol. Econ. 2012, 18, 57–60. [Google Scholar]
- Chen, X. Eutrophication status and monitoring of urban lakes in China. Sci. Technol. Inf. 2010, 5, 416–465. [Google Scholar]
- Zhao, Y.; Zhang, W.; Tang, Y.; Wu, J. Numerical study of coupled one-dimensional and two-dimensionalhydrodynamic and water quality model for complex lake and river networks regions. J. China Inst. Water Resour. Hydropower Res. 2011, 9, 53–58. [Google Scholar]
- Lai, X.; Jiang, J.; Huang, Q.; Xu, L. Two-dimensional numerical simulation of hydrodynamic and pollutant transport for Lake Poyang. J. Lake Sci. 2011, 23, 893–902. [Google Scholar]
- Li, T.; Li, Z.; Huang, B.; Zhao, H.; Xu, C.; Liu, X. Simulation on water quantity and quality of Shahe Reservoir by MIKE21 model. Acta Sci. Circumstantiae 2021, 41, 293–300. [Google Scholar]
- Hu, Y.; Zhou, L. Numerical simulation analysis on two-dimensional hydrodynamics and water quality of Shifosi Reservoir based on MIKE21. Yangtze River 2021, 52, 31–38. [Google Scholar]
- Wang, M.; Du, Z.; Duan, Z.; Yan, C.; Gao, W.; Liu, C. Estimating the eco-environmental water demand of a river and lake coupled ecosystem: A case study of Lake Dianchi Basin. Acta Ecol. Sin. 2021, 41, 1341–1348. [Google Scholar]
- He, S.; Yin, X.; Li, H.; Zhang, E. Estimating the ecological water demand in lakes and the degree of certainty based on the Markov process. J. Hydroecol. 2020, 41, 13–20. [Google Scholar]
- Zhang, X.; Zou, R.; Wang, Y.; Yong, L.; Guo, H. Is water age a reliable indicator for evaluating water quality effectiveness of water diversion projects in eutrophic lakes? J. Hydrol. 2016, 542, 281–291. [Google Scholar] [CrossRef]
- Liu, B.; Cai, S.; Wang, H.; Cui, H.; Cao, X. Hydrodynamics and water quality of the Hongze Lake in response to human activities. Environ. Sci. Pollut. Res. 2021, 28, 46215–46232. [Google Scholar] [CrossRef]
- Song, W.; Xu, Q.; Fu, X.; Zhang, P.; Pang, Y.; Song, D. Research on the Relationship between Water Diversion and Water Quality of Xuanwu Lake, China. Int. J. Environ. Res. Public Health 2018, 15, 1262. [Google Scholar] [CrossRef] [Green Version]
- Zhang, M.; Dolatshah, A.; Zhu, W.; Yu, G. Case Study on Water Quality Improvement in Xihu Lake through Diversion and Water Distribution. Water 2018, 10, 333. [Google Scholar] [CrossRef] [Green Version]
- He, J.; Yang, Y.; Wu, X.; Zhi, G.; Zhang, Y.; Sun, X.; Jiao, L.; Deng, W.; Zhou, H.; Shao, Z.; et al. Responses of dissolved organic matter (DOM) characteristics in eutrophic lake to water diversion from external watershed. Environ. Pollut. 2022, 312, 119992. [Google Scholar] [CrossRef]
- Kim, S.; Cerco, C.; Johnson, B. Three-dimensional management model for Lake Washington, part I: Introduction and hydrodynamic modeling. Lake Reserv. Manag. 2006, 22, 103–114. [Google Scholar] [CrossRef] [Green Version]
- Anderson, E.; Schwab, D.; Lang, G. Real-time hydraulic and hydrodynamic model of the St. Clair River, Lake St. Clair, Detroit River system. J. Hydraul. Eng. 2010, 136, 507–518. [Google Scholar] [CrossRef] [Green Version]
- Missaghi, S.; Hondzo, M. Evaluation and application of a three-dimensional water quality model in a shallow lake with complex morphometry. Ecol. Model. 2010, 221, 1512–1525. [Google Scholar] [CrossRef]
- Rao, Y.; Huang, A.; Schertzer, W.; Rouse, W. Modelling of physical processes and assessment of climate change impacts inGreat Bear Lake. Atmosphere-Ocean 2012, 50, 317–333. [Google Scholar] [CrossRef] [Green Version]
- Sharip, Z.; Yanagawa, R.; Terasawa, T. Eco-hydrodynamic modelling of Chini Lake: Model description. Environ. Model. Assess. 2016, 21, 193–210. [Google Scholar] [CrossRef]
- Zhao, Y.; Xia, X.; Yang, Z.; Wang, F. Assessment of water quality in Baiyangdian Lake using multivariate statistical techniques. Procedia Environ. Sci. 2012, 13, 1213–1226. [Google Scholar] [CrossRef] [Green Version]
- Tang, C.; Yi, Y.; Yang, Z.; Zhang, S.; Liu, H. Effects of ecological flow release patterns on water quality and ecological restoration of a large shallow lake. J. Clean. Prod. 2018, 174, 577–590. [Google Scholar] [CrossRef]
- Gad, M.; Abou El-Safa, M.M.; Farouk, M.; Hussein, H.; Alnemari, A.M.; Elsayed, S.; Khalifa, M.M.; Moghanm, F.S.; Eid, E.M.; Saleh, A.H. Integration of Water Quality Indices and Multivariate Modeling for Assessing Surface Water Quality in Qaroun Lake, Egypt. Water 2021, 13, 2258. [Google Scholar] [CrossRef]
- GB/T 3838-2002; Environmental Quality Standard for Surface Water. Standardization Administration of the People’s Republic of China: Beijing, China, 2002.
Figure 1.
The map of study area showing Lake Hou in Wuhan.
Figure 1.
The map of study area showing Lake Hou in Wuhan.
Figure 2.
Observed and simulated water levels of Lake Hou.
Figure 2.
Observed and simulated water levels of Lake Hou.
Figure 3.
Observed and simulated TN, TP, and COD concentration variations of Lake Hou.
Figure 3.
Observed and simulated TN, TP, and COD concentration variations of Lake Hou.
Figure 4.
Simulation of the annual concentration change process of COD in Scenarios 1–3.
Figure 4.
Simulation of the annual concentration change process of COD in Scenarios 1–3.
Figure 5.
Simulation of the annual concentration change process of TN in Scenarios 1–3.
Figure 5.
Simulation of the annual concentration change process of TN in Scenarios 1–3.
Figure 6.
Simulation of the annual concentration change process of TP in Scenarios 1–3.
Figure 6.
Simulation of the annual concentration change process of TP in Scenarios 1–3.
Figure 7.
Changes of TP concentration for different recharge flows in Lake Hou.
Figure 7.
Changes of TP concentration for different recharge flows in Lake Hou.
Figure 8.
Spatial distribution of TP concentrations for different recharge flows in Lake Hou. (a) No diversion; (b) diversion of 10 m3/s; (c) diversion of 15 m3/s; (d) diversion of 20 m3/s.
Figure 8.
Spatial distribution of TP concentrations for different recharge flows in Lake Hou. (a) No diversion; (b) diversion of 10 m3/s; (c) diversion of 15 m3/s; (d) diversion of 20 m3/s.
Figure 9.
Changing of TN concentration for different recharge flows in Lake Hou.
Figure 9.
Changing of TN concentration for different recharge flows in Lake Hou.
Figure 10.
Spatial distribution of TN concentrations for different recharge flows in Lake Hou. (a) No diversion; (b) diversion of 10 m3/s; (c) diversion of 15 m3/s; (d) diversion of 20 m3/s.
Figure 10.
Spatial distribution of TN concentrations for different recharge flows in Lake Hou. (a) No diversion; (b) diversion of 10 m3/s; (c) diversion of 15 m3/s; (d) diversion of 20 m3/s.
Figure 11.
Changing process of COD concentration for different recharge flows in Lake Hou.
Figure 11.
Changing process of COD concentration for different recharge flows in Lake Hou.
Figure 12.
Spatial distribution of COD concentrations for different recharge flows in Lake Hou. (a) No diversion; (b) diversion of 10 m3/s; (c) diversion of 15 m3/s; (d) diversion of 20 m3/s.
Figure 12.
Spatial distribution of COD concentrations for different recharge flows in Lake Hou. (a) No diversion; (b) diversion of 10 m3/s; (c) diversion of 15 m3/s; (d) diversion of 20 m3/s.
Table 1.
Simulated scenarios.
Table 1.
Simulated scenarios.
| | Purpose | Initial Water Quality | Pollutants’ Load |
|---|
| Scenario 1 | For analysis of water quality during the year under the current situation | Water quality measured during the current low-water season of Lake Hou | Current annual quantity of pollutants |
| Scenario 2 | For analysis of water quality in lakes during the low-water season after pollution interception and control | Water quality measured during the current low-water season of Lake Hou | Annual quantity of pollutants at the planning level |
| Scenario 3 | For analysis of water quality during the year after pollution interception and control | Water quality calculated by Scenario 2 | Annual quantity of pollutants at the planning level |
| Scenario 4 | For analysis of the quantity of complementing water needed after pollution interception and control | Water quality calculated by Scenario 2 | Annual quantity of pollutants at the planning level, calculated for three scenarios of 10 m3/s, 15 m3/s, and 20 m3/s of supplementary water capacity |
Table 2.
The monthly runoff of Lake Hou (in million cubic meters).
Table 2.
The monthly runoff of Lake Hou (in million cubic meters).
| | January | February | March | April | May | June | July | August | September | October | November | December |
|---|
| Runoff | 96.79 | 66.68 | 143.43 | 141.35 | 237.51 | 631.88 | 2464.07 | 358.33 | 399.51 | 155.98 | 92.87 | 74.28 |
Table 3.
Monthly average wind direction and speed.
Table 3.
Monthly average wind direction and speed.
| | January | February | March | April | May | June | July | August | September | October | November | December |
|---|
| Wind Speed(m/s) | 2 | 2.9 | 2.5 | 2.4 | 2.8 | 2.3 | 3.1 | 2.2 | 2.3 | 1.8 | 1.5 | 1.6 |
| Wind Direction | North–East | North–East | North–West | East–South–East | East–South–East | South–East | South–East | South–East | South–East | North
–Nort–West | North
–North–West | North–East |
Table 4.
Total pollutant inputs for the current situation within Lake Hou.
Table 4.
Total pollutant inputs for the current situation within Lake Hou.
| No. | Name of Pollutant | COD (Ton per Year) | TN (Ton per Year) | TP (Ton per Year) |
|---|
| 1 | Pollutants in current level year | 4205.53 | 537.49 | 43.01 |
| 2 | Pollutants in planning level year | 1729.19 | 446.12 | 23.56 |
Table 5.
Ecological Replenishment Program For Lake Hou.
Table 5.
Ecological Replenishment Program For Lake Hou.
| Program | Program Description | Representative Year | Water Diversion Time | Quality of the Supplementary Water |
|---|
| 1 | 10 m3/s of water for replenishment | 1986 (dry year) | 11 July to 25 November | TP: 0.05 mg/L
TN: 0.75 mg/L
COD: 5.18 mg/L |
| 2 | 15 m3/s of water for replenishment |
| 3 | 20 m3/s of water for replenishment |
Table 6.
Water quality improvement for the three recharge flows.
Table 6.
Water quality improvement for the three recharge flows.
| Recharge Flow (m3/s) | TP Improvements (%) | TN Improvements (%) | COD Improvements (%) | Increased Rate of TP Improvements of Each
Replenishment (%) | Increased Rate of TN Improvements of Each
Replenishment (%) | Increased Rate of COD Improvements of Each
Replenishment (%) |
|---|
| 10 | 28.94 | 24.14 | 14.30 | / | / | / |
| 15 | 33.14 | 27.77 | 15.57 | 4.2 | 3.56 | 1.27 |
| 20 | 35.74 | 30.10 | 16.29 | 2.6 | 2.4 | 0.72 |
| Disclaimer/Publisher’s Note: The statements, opinions and data contained in all publications are solely those of the individual author(s) and contributor(s) and not of MDPI and/or the editor(s). MDPI and/or the editor(s) disclaim responsibility for any injury to people or property resulting from any ideas, methods, instructions or products referred to in the content. |
© 2023 by the authors. Licensee MDPI, Basel, Switzerland. This article is an open access article distributed under the terms and conditions of the Creative Commons Attribution (CC BY) license (https://creativecommons.org/licenses/by/4.0/).


