Article

Eco-Engineering Technologies and Achievements of Projects for Reconstructing Landscape Water from Aquaculture Ponds in Shanghai

1
Shanghai Chenshan Botanical Garden, Shanghai 201062, China
2
Institute for Interdisciplinary and Innovate Research, Xi’an University of Architecture and Technology, Xi’an 710055, China
*
Author to whom correspondence should be addressed.
Water 2023, 15(16), 2881; https://doi.org/10.3390/w15162881
Submission received: 24 June 2023 / Revised: 18 July 2023 / Accepted: 4 August 2023 / Published: 9 August 2023
(This article belongs to the Special Issue Aquaculture Water Safety)

Abstract

:
The post-evaluation of ecological redevelopment is a good way of describing its achievements. In this paper, eco-engineering techniques, including hydrodynamic circulation reconstruction, water purification treatment, and aquatic ecosystem restoration, along with plant harvesting management, have been applied to reconstruct landscape water from aquaculture ponds. Both sediments and water quality were sampled and tested for basic physicochemical parameters and heavy metals. The ecological redevelopment of landscape water reconstructed from aquaculture ponds was evaluated using the single and Nemero comprehensive pollution index methods. The results demonstrate that nutrients, including organic matter and organic nitrogen and their ratio to sediments, were confirmed to be in a state of moderate pollution, while the ecological risk of heavy metal pollution was relatively low. Although the concentrations of total nitrogen and total phosphorus were significantly higher than those of other indexes, ammonia nitrogen, total nitrogen and total phosphorus, all presented obvious downward trends over time, and a majority of the water samples exhibited mild-to-moderate pollution levels. In general, this study provides a set of reference values for redeveloping water ecosystems from aquaculture ponds using eco-engineering technologies.

1. Introduction

In recent years, the aquaculture industry has experienced rapid growth, leading to an expansion in the size of aquaculture ponds. In 2021, within China, the cumulative area of aquaculture ponds reached 26,450 m3, constituting 51.7% of the nation’s overall freshwater aquaculture region [1]. Notably, the aggregate territory of aquaculture ponds within the Yangtze River Basin encompasses an extensive area of 14,567 m3 [1]. However, aquaculture ponds are currently confronted with water degradation issues, primarily including water pollution, eutrophication and sediment contamination [2,3]. The aquaculture industry has faced challenges in terms of ecological benefits and the sustainable development of the environment.
To improve the water quality, eco-engineering measures encompassing ecosystem reconstruction and population control techniques for aquatic plants, benthic organisms and microorganisms have been implemented in the reconstruction of water ecosystems [4,5]. These methods have not only been applied in the ecological restoration of large lakes and wetlands, including Taihu Lake, Chaohu Lake, Dianchi Lake and West Lake, but are also used to control and maintain the water quality of large artificial lakes, streams and pools in urban open spaces [6]. The effect of ecological redevelopment on water ecosystems is mainly evident in eutrophic lakes and constructed wetlands [7,8]. In aquaculture ponds, terrain modification has been carried out through the dismantlement of pond dikes, drainage treatment, sediment replacement, and sun exposure at the bottom of Yilong Lake in Yunnan [5]. In addition, the implementation of vegetative buffer zones, including the reintroduction of aquatic plants and the construction of ecological floating islands, has been achieved in Qiachuan within the Yellow River Nature Reserve [4]. Indeed, there are a few reports on the reconstruction of water ecosystems from aquaculture ponds [9,10,11].
The post-evaluation of ecological redevelopment is a practical and effective method for evaluating recent achievements in this area [12,13]. Two aspects required for water environmental quality evaluation need to be mentioned, namely, using the water quality index to evaluate ecosystem redevelopment and conducting a comprehensive evaluation considering both water quality and sediment index [14]. However, the existing assessment studies were carried out immediately after engineering completion with few indicators and a short cycle [15,16]. For example, chemical indicators of water quality, such as transparency, total nitrogen, total phosphorus, permanganate index, suspended solids and chlorophyll A, were selected to evaluate the effectiveness of the water environmental pollution control project in Xuanwu Lake, Nanjing [17]. Related indicators, such as total nitrogen, total phosphorus, nitrate nitrogen, nitrite nitrogen and chlorophyll A, were chosen to evaluate the water quality changes 6 months after the initiation of the water ecological restoration project in Dalian Lake, Shanghai [18]. A comprehensive evaluation of 12 physical and chemical indicators of water quality, including pH, dissolved oxygen, conductivity, total dissolved solids, salinity, COD, BOD5, ammonia nitrogen, total nitrogen, total phosphorus, chloride and total suspended solids, was conducted for the ecological restoration demonstration project in the Dagupai River in Tianjin [19]. Additionally, long-term and stable biological restoration measures have been predominantly qualitative, lacking quantitative data [20,21,22].
The quality of sediments is also an important aspect of water environmental quality evaluation. The runoff inflow into water bodies is full of nutrients and heavy metals, which become the primary source of pollution [23,24]. Specifically, nitrogen and phosphorus represent the primary load of water body nutrients and participate in the circulation of water ecosystems undergoing physical, chemical and biological processes. Heavy metals are deposited into sediments [25]. The assessment of sediments not only facilitates the recognition of water quality status and its evolutionary characteristics but also enables the identification of key pollution factors and the implementation of effective preventive and control measures; it also provides a scientific basis for the formulation of water pollution control and water environment restoration plans [26,27].
In this study, both eco-engineering technologies and achievements in projects reconstructing landscape water from aquaculture ponds in Shanghai Chenshan Botanical Garden were investigated. The objectives of this study were: (1) to introduce a comprehensive restoration approach that combines fast-acting, short-term engineering measures with long-term, stable biological restoration measures for transforming aquaculture ponds into landscape water; (2) to establish a scientific and effective long-term evaluation method for assessing the ecological outcomes of ecosystem reconstruction; (3) to provide a valuable reference for the redevelopment of water ecosystems from aquacultural bonds using ecological engineering technologies.

2. Materials and Methods

2.1. Study Area

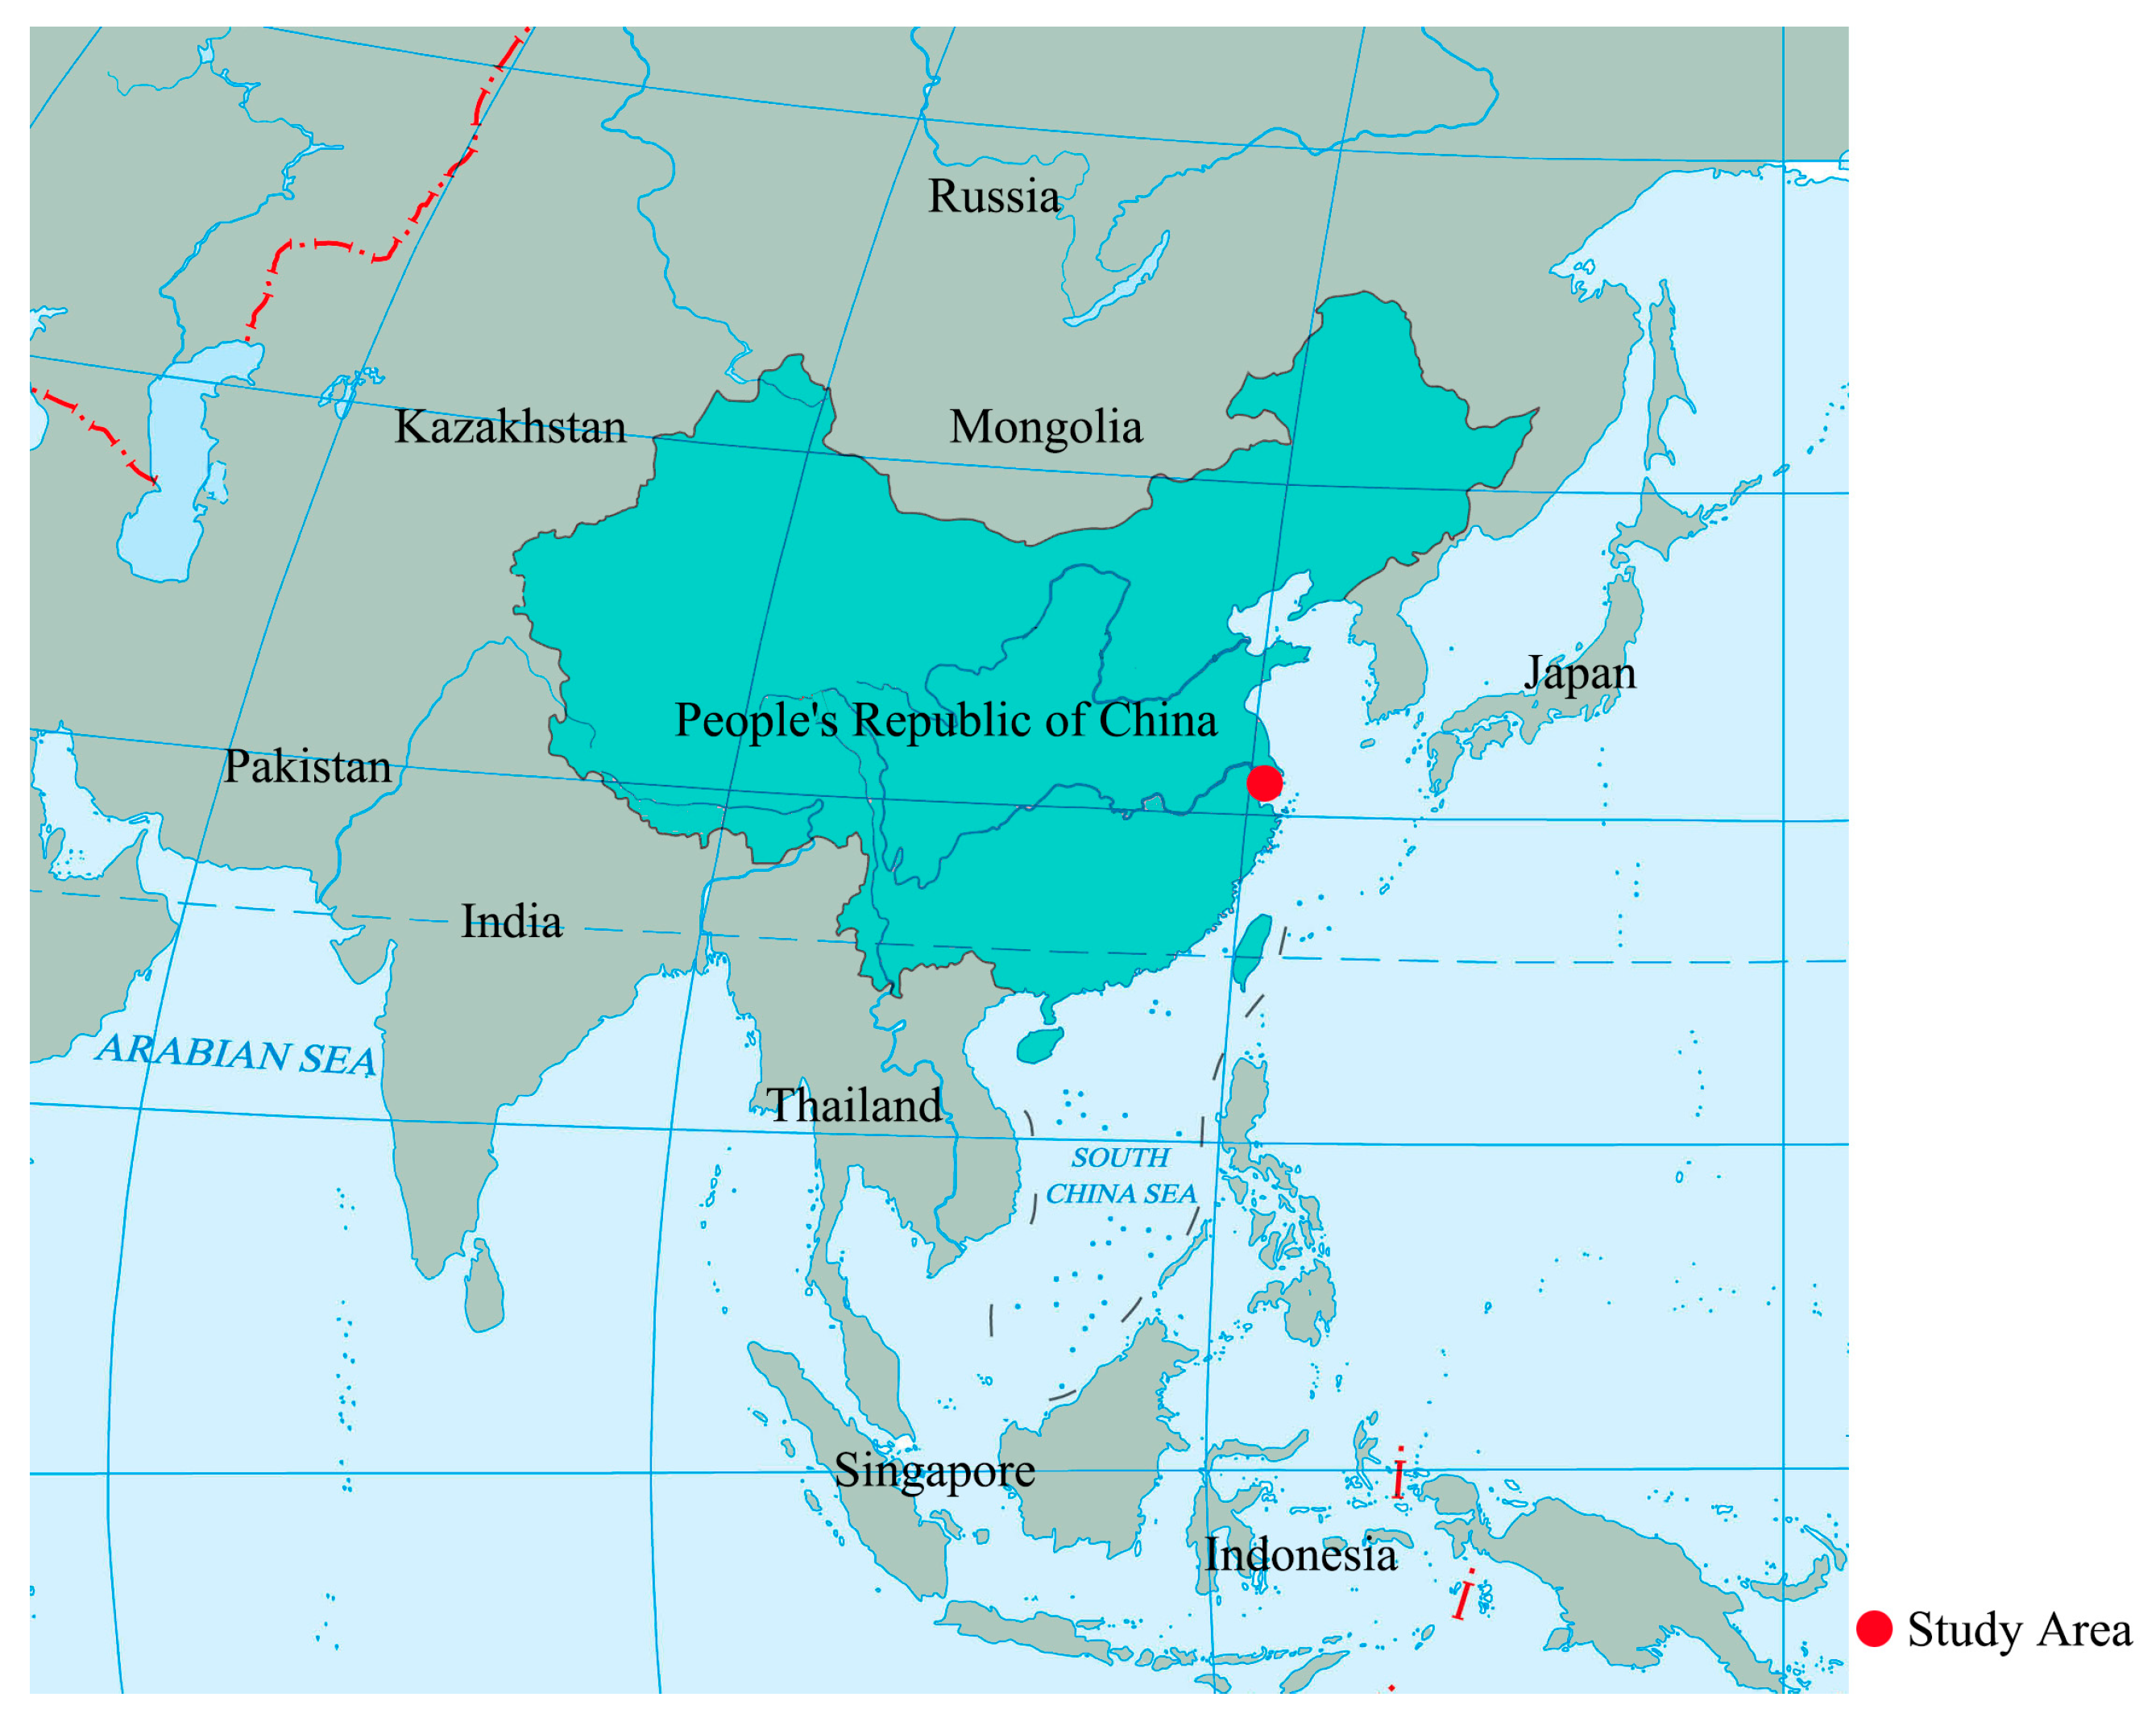
The research site, the central position of which had the geographical coordinates (31°04′48.10″ N, 121°11′5.76″ E), was located in Songjiang District in Shanghai, China (Figure 1). Shanghai has a subtropical monsoon climate, with an annual temperature of 15.4 °C and an annual rainfall of 1103.2 mm. Of the total rainfall, 60% is concentrated in the rainy season from May to September. The soil in Shanghai has previously been described as a silty clay loam with an elevated pH of 8.
The total area was 207,000 m2, covering Chenshan Hill, village, rivers, farmlands and aquaculture ponds. The surface water area in this region was 90,774 m2, of which aquaculture ponds accounted for 34.5% [28] (Figure 2). The maximum nitrogen content of surface water in aquaculture ponds was 13.54 mg/L, leading to frequent eutrophication outbreaks and fertile sediments. Moreover, the ponds had excessive heavy metals, such as As, Cd and Zn [29].

2.2. Eco-Engineering Treatments

2.2.1. Hydrodynamic Reconstruction

The research site was designed within the Shanghai Chenshan Botanical Garden, composed of hills, water and plants. Its surface water area has expanded to 200,000 m2 due to terrain consolidation and reshaping from rice farmlands and aquaculture ponds (Figure 3). During the initial construction phase, the removal and replacement of heavily contaminated sediments in rice fields and aquaculture ponds were accomplished, effectively reducing the levels of nutrients and heavy metals in existing sediments. The landscape water system was divided into four subareas following a water flow direction. These subareas were sequenced by Shenjing River (19,041 m2), West Lake (104,296 m2), Aquatic Garden (25,823 m2) and East Lake (49,684 m2). To improve water quality, a water treatment plant with a total area of 10,000 m2, including a semi-buried sewage treatment plant, surface flow and subsurface flow constructed wetlands, was constructed in the western part of the garden.
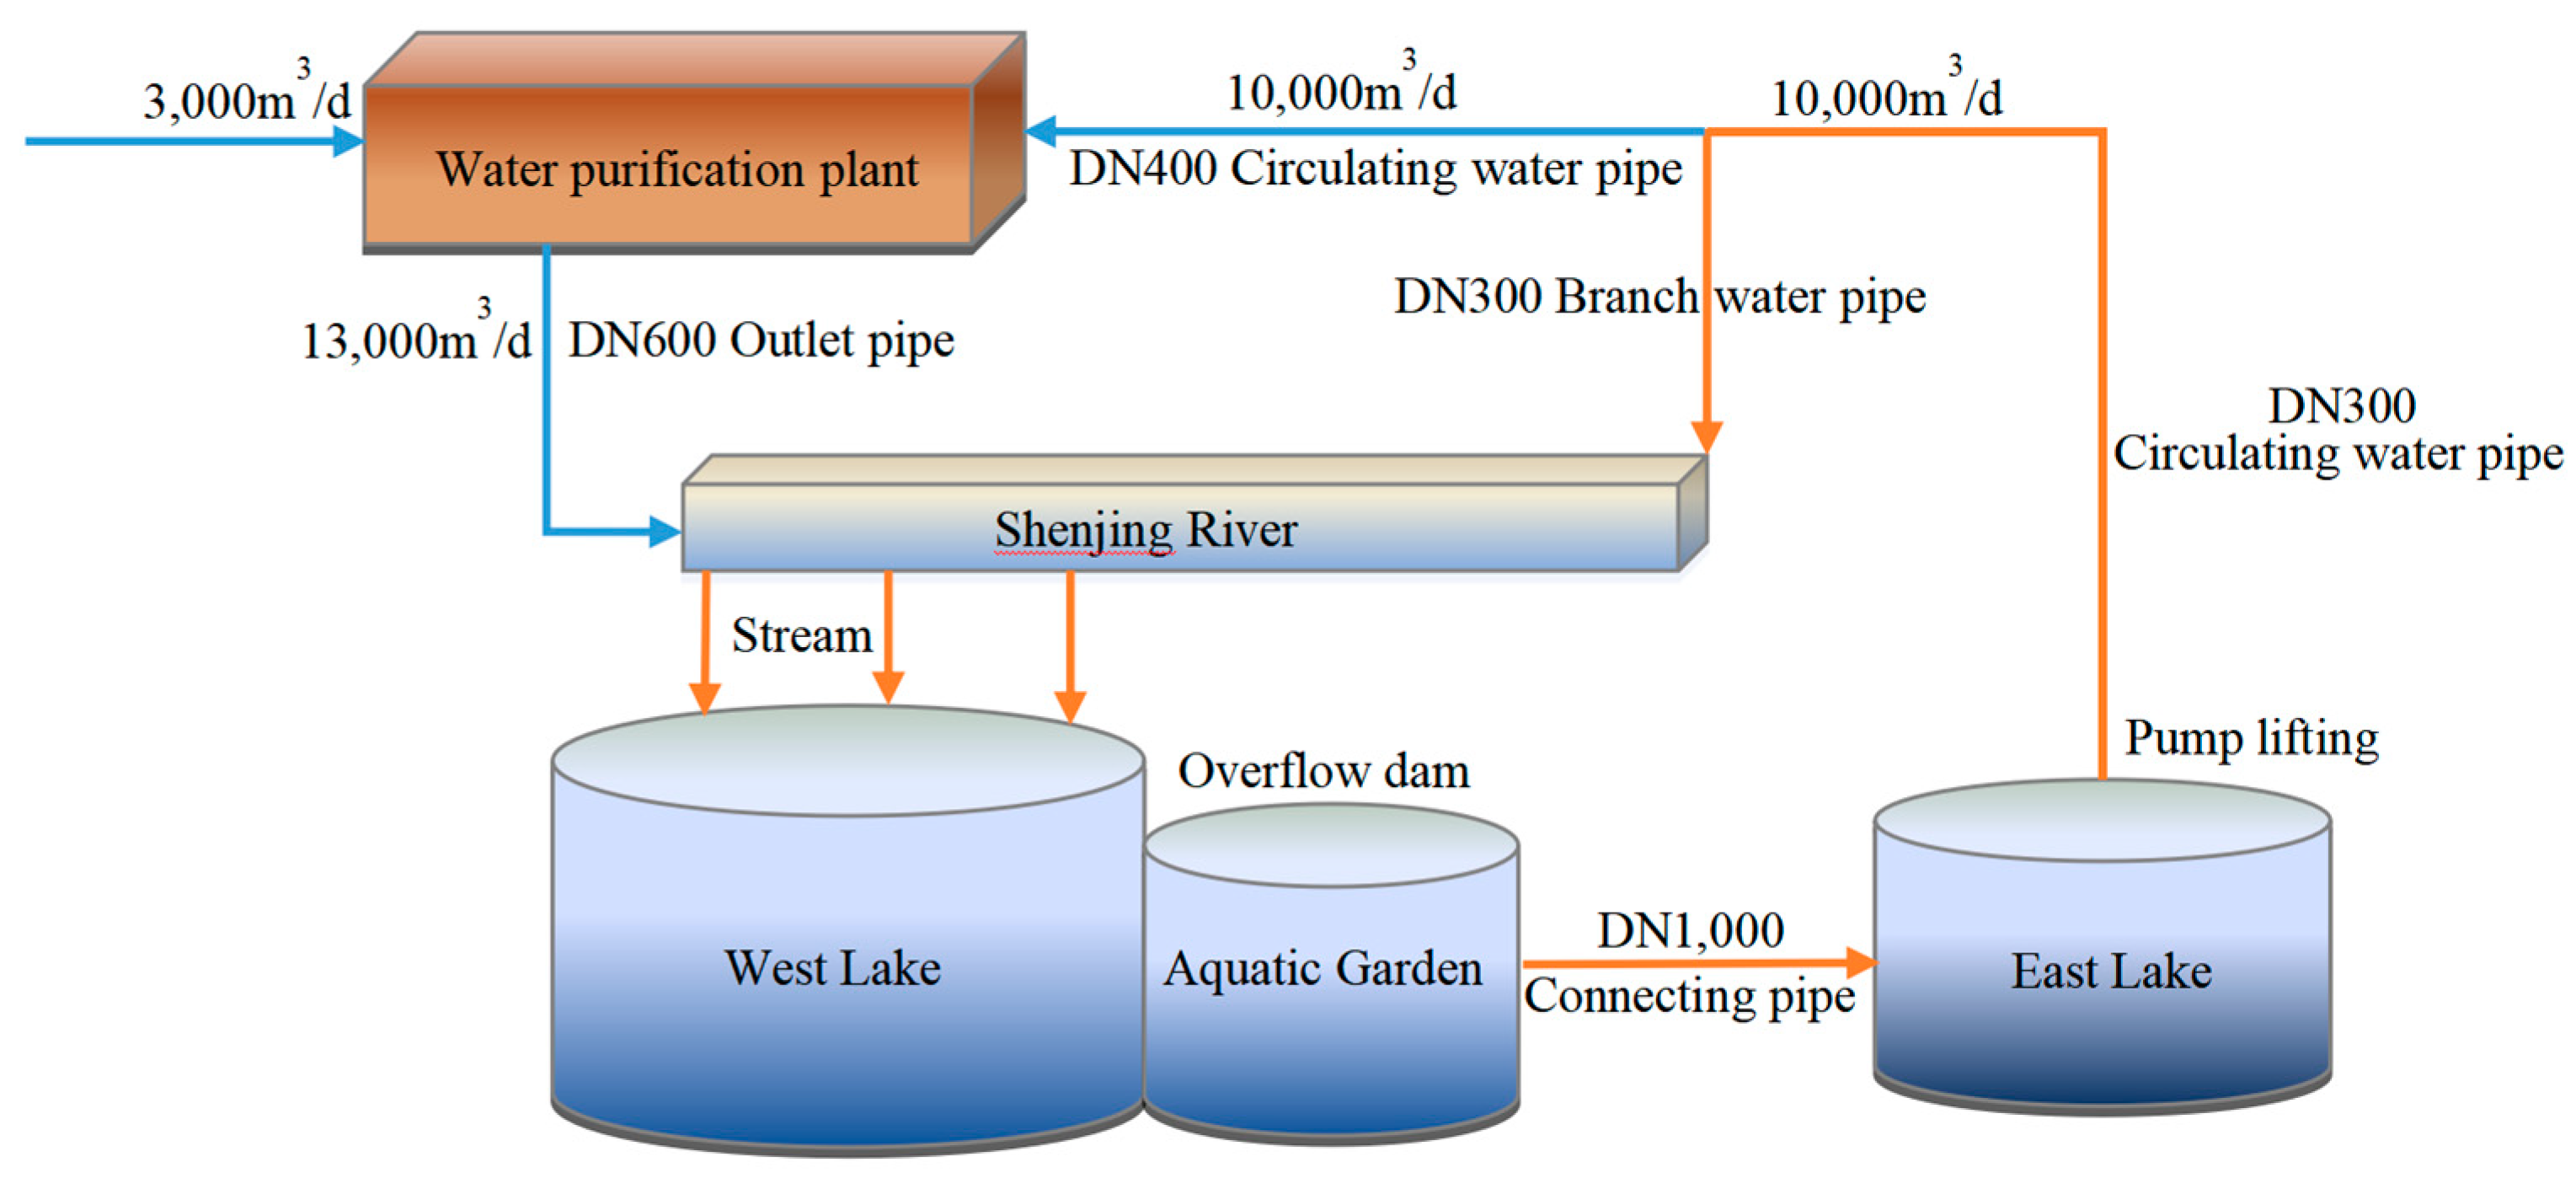
A landscape water cycle purification system was designed and established (Figure 4). Landscape water mainly relies on natural precipitation replenishment and circulates through groundwater replenishment and outside river supplementation. A total of 40,000 m3 volumes of all surface water was estimated at the designed mean depth of 2 m. It took almost a month to complete the hydrodynamic cycle. A total of 10,000 m3 of water was pumped from East Lake to the water treatment plant through a pipeline each day, with a maximum daily supplement amount of 3000 m3 from the river outside.

2.2.2. Water Purification Treatment

In order to avoid directly polluting the water in the landscape, rainwater storage and infiltration systems were implemented at the terminus of the drainage channels. The rainwater required filtration and percolation through the soil before entering landscape water.
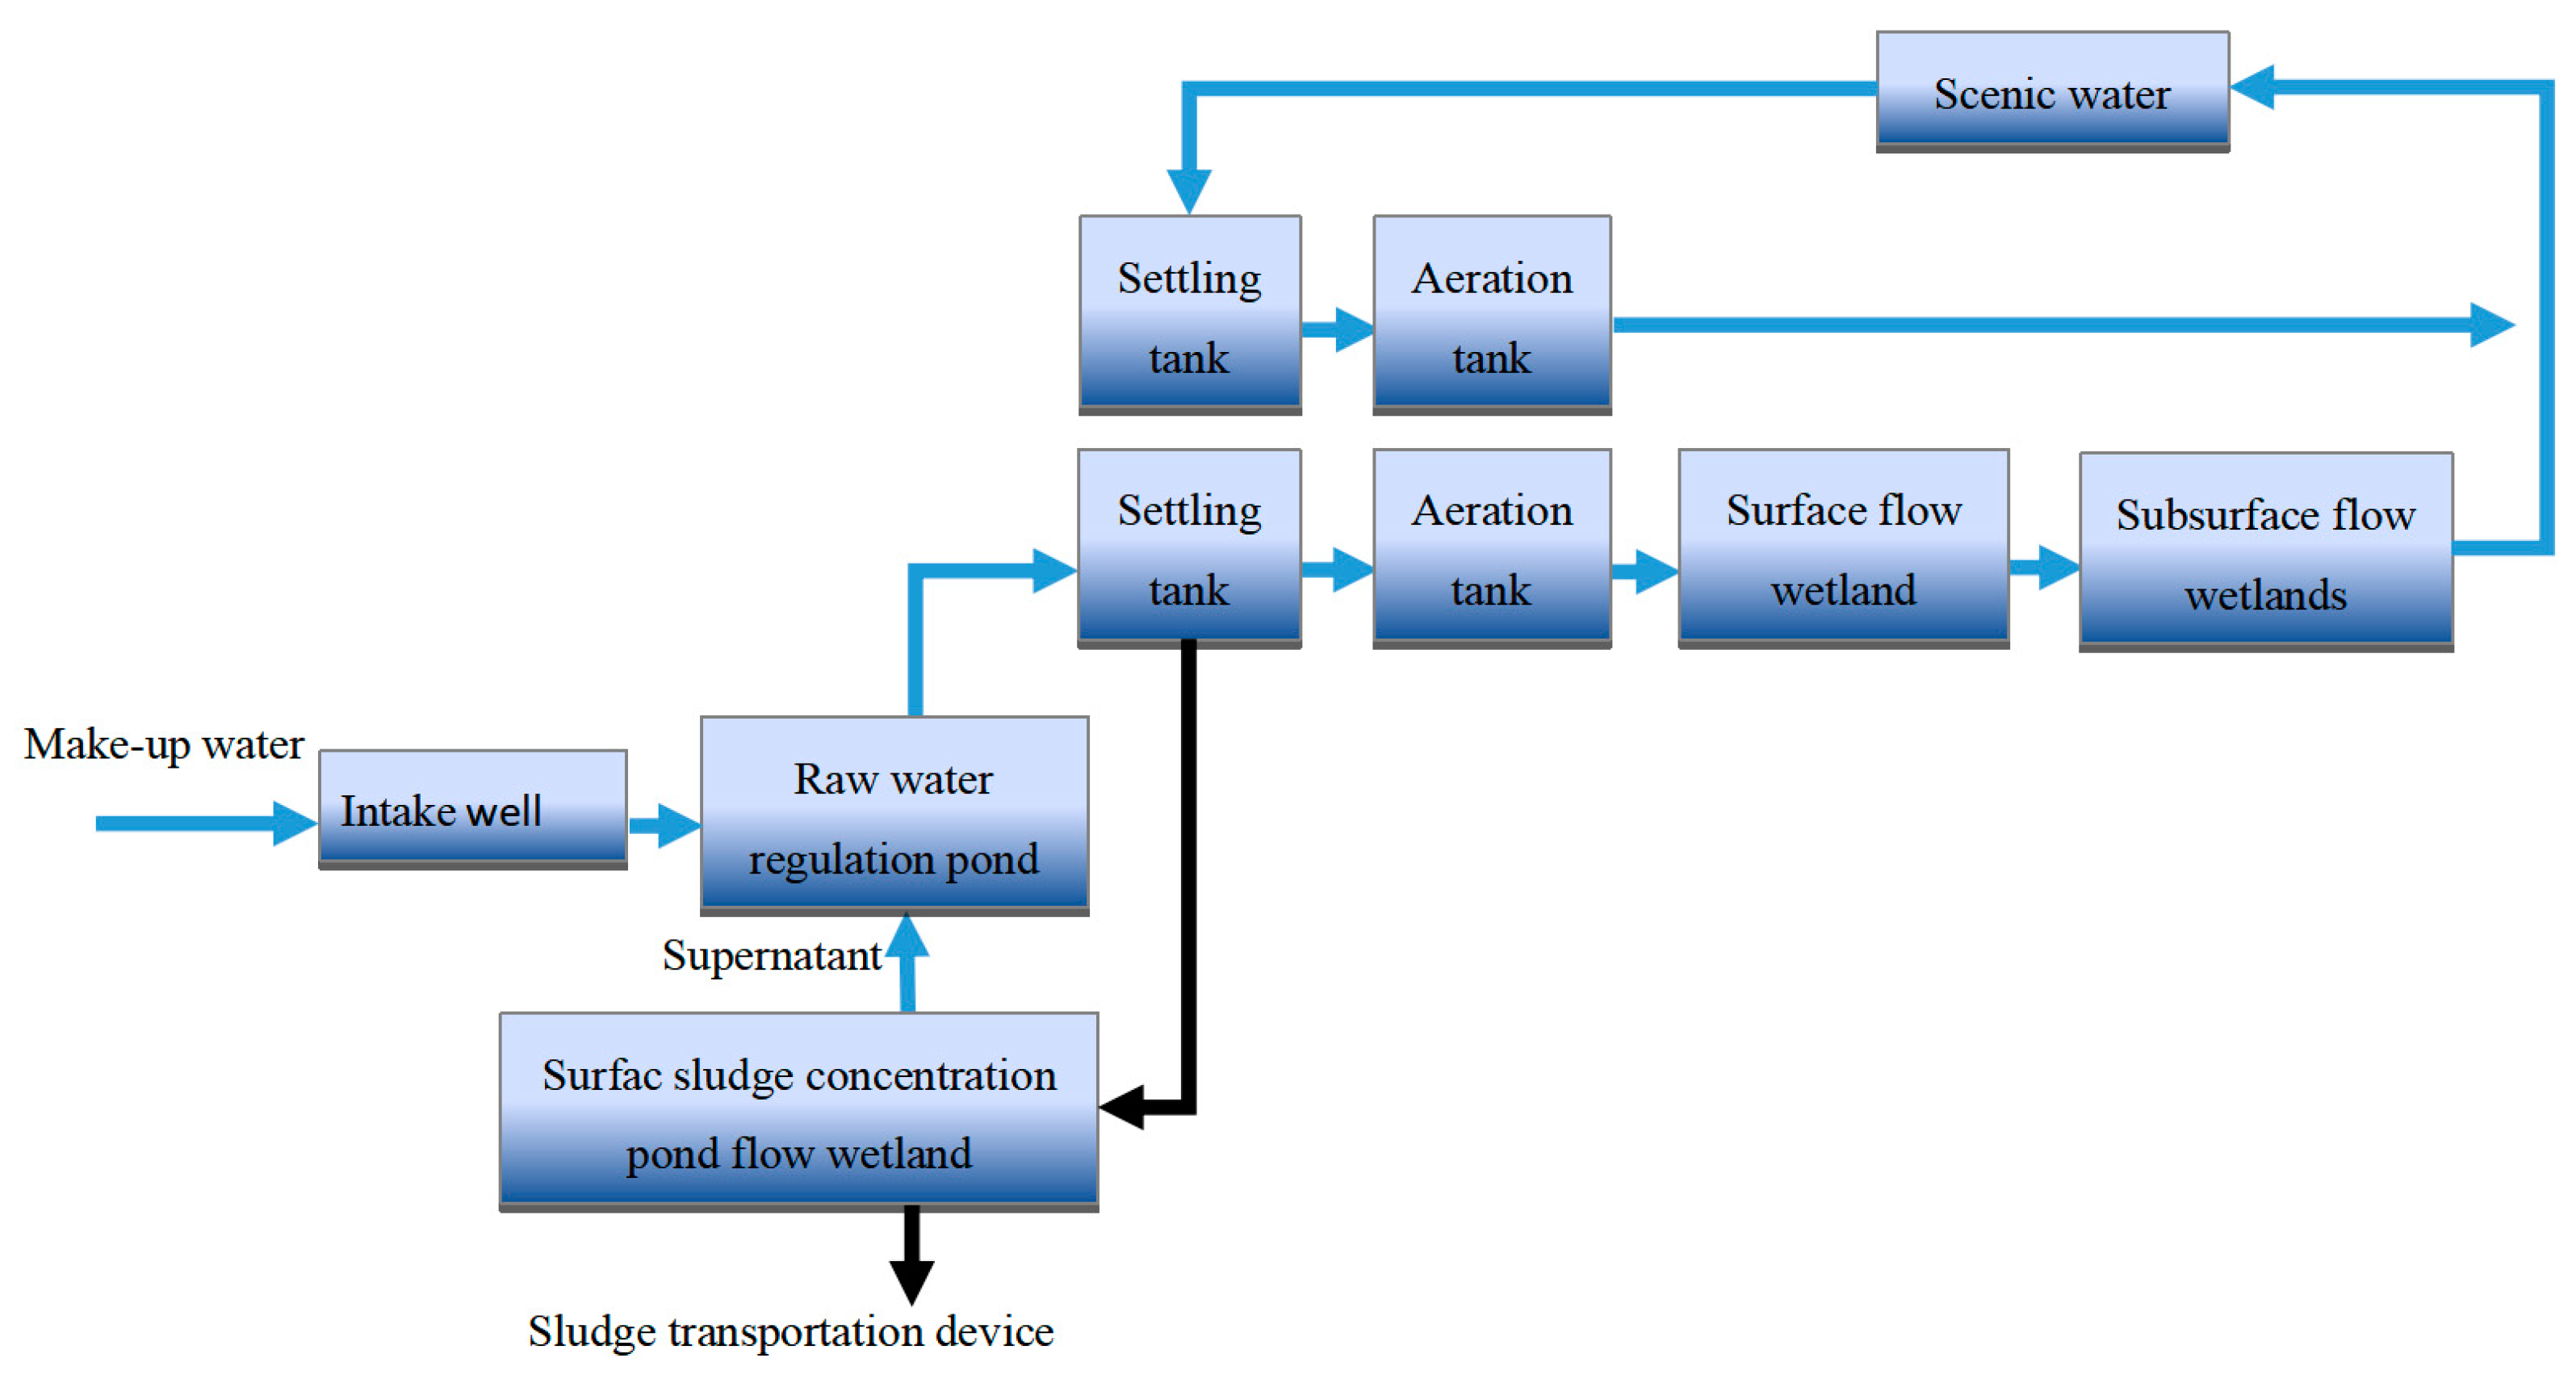
The circulation and supplement water of the river outside were first subjected to artificial reinforcement treatment such as coagulation and sedimentation in the semi-buried sewage treatment plant. This aimed to remove most of the suspended substances, total phosphorus and organic matter. Only 3000 m3 water flowed into 3000 m2 surface flow constructed wetlands and 56 parallel independent 65 m2 subsurface flow constructed wetlands to remove organic matter, ammonia nitrogen, and total phosphorus [30,31] (Figure 5).

2.2.3. Aquatic Ecosystem Restoration

The sediments of aquaculture ponds were replaced with river sands and absorbent substrates such as vermiculite. The waterfront space was reconstructed into natural, near-natural and erect revetments. The length of natural revetments accounted for 74.4% of the entire waterfront space, while erect revetments were only 12.3% [32].
Water purification abilities and ecological functions should be prioritized when selecting aquatic species, especially native species. In natural and near-natural waterfront spaces, vegetation zones with hygrophytes, emergent plants, floating-leaf plants or submerged plants were gradually replanted. In waterfront spaces above normal water level, water-tolerant hygrophytes such as Taxodium mucronatum, Salix babylonica, Pterocarya stenoptera, Metasequoia glyptostroboides, Glyptostrobus pensilis, Triadica sebifera, and Cephalanthus tetrandrus were replanted. Around normal water levels, emergent aquatic plants such as Sagittaria trifolia subsp. leucopetala, Juncus effusus, Cyperus involucratus, and Typha orientalis were replanted. Floating-leaf aquatic plants such as Nymphaea tetragona and Nymphoides peltata and submerged plants such as Ceratophyllum demersum, Vallisneria natans, and Hydrilla verticillata were replanted (Table 1). The planting area of different types of aquatic plants follows the order submerged plants > emergent plants > floating-leaf plants. The planting area of floating-leaf plants is 2.67 times larger than that of other types of aquatic plants.
Aquatic animals should be selected based on their ability to effectively remove suspended particles, such as algae and debris, with a focus on short food chains. A certain number and variety of filter-feeding fish, carnivorous fish, and benthic animals was reintroduced to improve the purification ability and stability of the aquatic ecosystem (Table 2).

2.3. Sampling and Testing

A total of 12 sampling points were set up for water quality monitoring and sediment testing. According to the surface water area, points 1~3 were located in Shenjing River, 4~7 in West Lake, 8~9 in Aquatic Garden and 10~12 in East Lake. During 2015–2017, samples were collected once every month to detect the dissolved oxygen (DO), pH, conductivity (EC), BOD5, CODcr, total nitrogen, ammonia nitrogen, and total phosphorus. In August 2016, 0–10 cm top sediments were collected with a grab-type sampler and placed in a clean polyethylene self-sealing bag.
The following parameters of water quality were measured in the laboratory immediately after sampling: dissolved oxygen and temperature (Hach HQ30d, USA), pH (Hach HQ411d, USA), turbidity (Hach 2100Q, USA), and electrical conductivity (Leici Company, China). Samples of COD, TN and TP were kept frozen and analyzed the day after sampling. Moreover, parameters of CODcr, NH3-N, TN and TP were measured according to APHA (2005). BOD5 was determined by measuring the dissolved oxygen value immediately. These samples were then incubated for 5 days at 20 °C and measured again. The D-value (mg/L) was calculated as the 5-day biochemical oxygen demand.
The sediment samples were air-dried naturally in a cool and ventilated environment and then processed by removing gravel, shells, and weeds before being sieved through a 100-mesh (0.154 mm) nylon sieve. TN of sediments was determined using the Kjeldahl method (Sinopharm Chemical Reagent Co., Ltd., Shanghai, China), TP was determined using the HClO4-H2SO4 method (Sinopharm Chemical Reagent Co., Ltd., Shanghai, China), and organic matter was determined by virtue of the potassium dichromate volumetric method (Sinopharm Chemical Reagent Co., Ltd., Shanghai, China). Heavy metals were determined using the HNO3-H2O2-HCl digestion method (Sinopharm Chemical Reagent Co., Ltd., Shanghai, China). The digested solutions of samples were analyzed using inductively coupled plasma atomic absorption spectrometry (Agilent ICPMS 7700® USA).

2.4. Data Analysis

2.4.1. Organic Matter and Nitrogen

The classification standards for sediment organic nitrogen and organic indexes are displayed in Table 3. The organic matter consisting of organic nitrogen and organic carbon was an important indicator of the environmental status of the sediment.
Their calculation formulas were as follows [34,35]:
Organic nitrogen (%) = total nitrogen (%) × 0.95
Organic carbon (%) = organic matter (%)/1.724
Organic index = organic carbon (%) × organic nitrogen (%)

2.4.2. Nemero Comprehensive Pollution Index

The Nemero comprehensive pollution index is an evaluation method based on the single-factor pollution index, which was required to establish environmental indicator quantity standards. The calculation method was as follows:
P i = C i S i
P Z = ( P i ) 2 + ( P m a x ) 2 2    
In the formula, P i represents the single-factor evaluation index; C i represents the measured content of the i-th environmental indicator quantity; S i represents the evaluation standard of the environmental indicator quantity. P Z represents the Nemero comprehensive index; P i   represents the number of evaluation indexes; P m a x represents the maximum value of the single-factor evaluation index [36,37,38].
The grade standards for the comprehensive pollution index are shown in Table 4. When evaluating the comprehensive pollution of sediment nutrients, the background values of TN and TP in the Taihu Basin sediment were selected as regional background values [39], i.e., Cs = 0.67 g/kg for TN and Cs = 0.44 g/kg for TP.
When evaluating the comprehensive pollution of heavy metals in sediments, the soil background values of Shanghai were used as regional background values [40], i.e., As 9.1 mg/kg, Cr 75 mg/kg, Zn 86.1 mg/kg, Pb 25.47 mg/kg, Cd 0.132 mg/kg, Ni 31.9 mg/kg, Cu 28.59 mg/kg, and Hg 0.101 mg/kg.
When evaluating the comprehensive pollution of water quality, the Class III water standard in the Surface Water Environmental Quality Standards (GB 3838-2002) was used as the background value in this region, i.e., DO 5 mg/L, CODcr 20 mg/L, TN 1 mg/L, ammonia nitrogen 1 mg/L, TP 0.05 mg/L, and BOD5 4 mg/L.

3. Results

3.1. Water Quality

Dissolved oxygen, CODcr, TN, ammonia nitrogen, TP and BOD5 were evaluated by the Nemero comprehensive pollution index method and level classification in spring (March–May), summer (June–August), autumn (September–November), and winter (December–February) (Table 5). The Nemero comprehensive pollution index values of Shenjing River, West Lake, Aquatic Garden, and East Lake ranged from 0.83 to 1.62. It was shown that there was a moderate level of pollution. The level of water quality presented as autumn > winter > spring > summer.
In addition to dissolved oxygen, CODcr, ammonia nitrogen, and BOD5, the individual pollution index values of TN and TP were also relatively higher in redevelopment landscape water (Table 6). The Nemero pollution index values for TN ranged from 1.58 to 1.86, with relatively lower values in the East Lake and West Lake, suggesting a state of moderate pollution. The Nemero pollution index values for TP ranged from 0.89 to 1.22, with relatively lower values in Aquatic Garden and West Lake, which indicated a moderate or slight pollution state.

3.2. Nutrients in Sediments

Table 7 summarizes the results of nutrient determination in sediments. The organic matter value of top sediments in landscape waters ranged from 0.06 to 0.45, revealing relatively clean conditions. The range of organic nitrogen was between 0.07% and 0.16%, which implied that the overall state was still relatively clean. For sampling points, the organic matter in the Shenjing River was still clean despite its organic pollution. All fairly clean conditions were determined in West Lake, the Aquatic Garden and East Lake.
The pollution degree of the Shenjing River was heavy, while the other three water bodies were moderately polluted according to TN, TP and comprehensive pollution evaluation standards (Table 8). This indicates that the endogenous load of nutrients, especially nitrogen sources, should not be ignored in these waters.
The C/N ratio in sediments reflects the source of nutrients. The C/N ratio of fiber-bundle plant debris is greater than 20, while that of non-fiber-bundle plants ranges from 4 to 12. The C/N ratio of planktonic animals is less than 7, while that of planktonic plants ranges from 6 to 14 and that of algae from 4 to 10. In general, organic matter is mainly from land when the C/N ratio is greater than 10, while it mainly comes from within the water body when the C/N ratio is less than 10. When the C/N ratio is approximately 10, the organic matter from within and outside the water body is balanced. Clearly, the C/P ratio can reflect the decomposition rate of organic carbon and phosphorus compounds in sediments, as well as the form of phosphorus. A higher C/P ratio indicates that the material source primarily derives from terrestrial biomass, with phosphorus being rapidly released after biological death and organic matter being released more slowly.
In the sediments of the Chenshan Botanical Garden, the C/N ratio was mostly between 10 and 15, with an average value of 11.98 (Table 9). It indicated that organic matter and nutrients in water mostly came from external sources, except for a small amount from higher plants and planktonic organisms. The average C/P ratio was 22.82, with the highest value in the Shenjing River and the lowest in West Lake. Therefore, continuous efforts should be made to strengthen external nutrient pollution control.

3.3. Heavy Metal in Sediments

Based on the single pollution index and the Nemero comprehensive pollution index for heavy metals in sediments, it was indicated that Hg pollution was moderate in West Lake and Aquatic Garden, while Cu pollution was moderate in East Lake (Table 10). However, clean or slightly contaminated conditions were observed with other heavy metals. The range of As was 0.52 to 0.76, with an average of 0.67. The range of Cr was 0.70 to 0.84, with an average of 0.78. The range of Zn was 0.70 to 0.86, with an average of 0.78. The range of Pb was 0.81 to 0.97, with an average of 0.88. The range of Cd was 0.39 to 0.97, with an average of 0.68. The range of Ni was 0.78 to 0.99, with an average of 0.88. The range of Cu was 0.79 to 1.06, with an average of 0.95. The range of Hg was 0.81 to 1.07, with an average of 0.95. The Nemero comprehensive pollution index range was 0.81 to 1.07, suggesting that heavy metal pollution in this region was within the cautionary range. However, sediments in the Aquatic Garden should be monitored as a priority due to heavy metal pollution.

4. Discussions

Since 1950, more than 1.3 million hm2 of lakes have been lost in China due to land reclamation for agriculture, aquaculture and infrastructure development [41,42]. Many cases of ecological restoration engineering have been implemented in degraded or disturbed lake wetlands and have achieved some success [6]. Notable changes in water and sediment composition were observed in this study. Ammonia nitrogen, TN, and TP levels in the water have consistently decreased over time [43]. Continuous quantitative assessments were conducted over a two-year period, and the majority of water exhibited mild to moderate pollution levels. The high input of fertilizers required for plant maintenance in the Aquatic Garden would result in non-point source pollution pressure, consistent with the findings of Vadas et al. [44]. According to the assessment results of the single pollution index and Nemero comprehensive pollution index for sediments, the TN content in this study was lower than Poyang Lake [45], Chaohu Lake [46], Dongting Lake [47], and Dalian Lake [48]. TP content was also lower than that of Dalian Lake [48], Dianshan Lake [49] and Chaohu Lake [46]. The Cu, Zn, Cd, and Pb content in sediment in this study was significantly lower than that in Dalian Lake [48], Dianshan Lake [50], Dishui Lake [51] and other public park water in Shanghai [52], while Hg, As, Ni, and Cr showed differences. These results can be attributed to eco-engineering techniques in hydrodynamic circulation reconstruction, water purification treatment, aquatic ecosystem restoration, and plant harvesting management.
A few common approaches to shallow lake restoration at presnet are the reduction of total nutrient loads by controlling pollution sources [53,54] and increasing hydrodynamic circulation [55]. Organic matter and nutrients in the water primarily originate from surface runoff, with only a minimal contribution from higher plants and planktonic organisms. This was indicated by the C/N ratio of sediments, with an average value of 11.98. The improvement in hydraulic conditions increases the oxygenation capacity of the water, promoting the dilution capacity and self-purification ability of water ecosystems [56,57], as was demonstrated by the evaluation of DO, CODCr and BOD5 of water in this study. This closed landscape water could achieve a better performance in comparison with outside rivers [6]. Moreover, the operation of hydrodynamic circulation systems with ecological measures over 30 days is more cost-effective than tap water replenishment planned every 10 days [58]. Therefore, closed hydrodynamic circulation systems with a period of around 30 days are beneficial for ensuring the health and efficiency of water quality in regional areas.
Secondly, approximately 10,000 m3 of water was pumped into the water purification treatment per day; sometimes, 3000 m3/day was pumped from the river outside when the landscape water needed to be replenished. Coagulation–sedimentation is a considerable technique for pretreating wastewater. The total suspended solids are effectively reduced or eradicated in raw water regulation ponds and coagulation sedimentation tanks. These solids are subsequently eliminated through the sludge removal system. Other pollutions such as CODCr, BOD5, TN, NH4-N, and TP were reduced by surface and subsurface flow treatment wetlands [59,60]. Surface flow treatment wetlands are the favored option for stormwater wetlands as well as tertiary treatment wetlands designed to polish minimally polluted effluents [61,62]. Subsurface flow treatment wetlands may be more efficient at removing nutrients because the media contribute to phosphorus absorption or serve as a substrate for microbial development [30,63]. Meanwhile, wetland plants not only directly assimilate heavy metals from wastewater through their own growth, they also eliminate heavy metals through the secretion of metabolites and their influence on the rhizosphere microorganisms. For instance, plant roots secrete metal-binding proteins that can form complexes or chelate heavy metals in wastewater, rendering them less reactive [64]. In this case study, combined coagulation–sedimentation, surface and subsurface flow treatment wetlands contributed to the comprehensive treatment of different levels of pollution in circulation or replenishment waters.
Thirdly, aquatic ecosystem restoration and its effective management plays a crucial role in ensuring water quality and ecosystem health. During the process of aquatic ecosystem restoration, plants are chosen based on their ecological functionality and water purification capabilities. Studies have shown that submerged aquatic plants have significantly higher nitrogen and phosphorus content and heavy metal accumulation compared to floating and emergent plants [65,66]. The nitrogen- and phosphorus-removal efficiency of submerged plants such as Hydrilla verticillata and Vallisneria natans is more efficient than that of emergent plants such as Typha orientalis and Phragmites australis [67,68]. By introducing appropriate filter-feeding fish species, the eutrophication of the water body can be suppressed, and snails and mussels can also contribute to the purification of water quality [69,70]. In this case study, the plantation area of submerged plants is 2.67 times larger than that of other aquatic plants. This includes filter-feeding fish species such as Hypophthalmichthys molitrix, Ctenopharyngodon idellus, and Cristaria plicata, as well as benthic organisms, which effectively decrease the concentration of nutrients in the water. It has been reported that submerged plants typically require around 10 days for phosphorus release and 28–30 days for total nitrogen release. As a result, submerged plants should be harvested within one week after death [71]. The optimal harvesting time for Canna indica and Juncus effusus, based on nitrogen and phosphorus uptake, is April, May, and June, respectively [72]. In this case study, submerged plants were harvested every month from April to November, while emergent plants and floating plants were harvested at the end of the growth season as part of a management strategy to efficiently remove nitrogen and phosphorus. The presence of aquatic organisms in the aquatic ecosystem can effectively reduce nutrient levels in the water environment.

5. Conclusions

It is practical and effective to perform a post-evaluation of ecological redevelopment on its achievements. In this paper, these eco-engineering techniques, including hydrodynamic circulation reconstruction, water purification treatment, and aquatic ecosystem restoration, along with plant harvesting management, have demonstrated water quality maintenance achievements. The ecological redevelopment of landscape water reconstructed from aquaculture ponds was evaluated using the single and Nemero comprehensive pollution index methods. The nutrients, including organic matter, organic nitrogen and their ratio to sediments, were confirmed to be in a state of moderate pollution, while the ecological risks of heavy metals were relatively low. Although the concentrations of total nitrogen and total phosphorus in water were higher than those of other indexes, ammonia nitrogen, total nitrogen and total phosphorus all presented obvious downward trends over time, and the majority of water exhibited mild to moderate pollution levels. In general, this study provides a set of reference values for redeveloping water ecosystems from aquaculture ponds using eco-engineering technologies.

Author Contributions

Conceptualization, G.Z., K.S. and Q.Z.; data curation, G.Z. and K.S.; funding acquisition, K.S.; methodology, G.Z. and K.S.; supervision, K.S. and Q.Z.; visualization, G.Z.; writing—original draft, G.Z. and K.S.; writing—review and editing, K.S. All authors have read and agreed to the published version of the manuscript.

Funding

This research was supported by the Project of Shanghai Municipal Commission of Science and Technology (22dz1209603); Shanghai Talent Development Fund Project (2021050).

Data Availability Statement

The data presented in this study are available on request from the corresponding author. The data are not publicly available due to the restriction policy of the co-authors’ affiliations.

Acknowledgments

The authors would like to thank Jingsha Zhang for their technical assistance.

Conflicts of Interest

The authors declare no conflict of interest.

References

  1. Fishery Administration of the Ministry of Agriculture and Rural Affairs. Chinese Fisheries Society. 2021 China Fisheries Statistical Yearbook; China Agriculture Press: Beijing, China, 2021; pp. 50–61. [Google Scholar]
  2. Degefu, F.; Mengistu, S.; Schagerl, M. Influence of fish cage farming on water quality and plankton in fish ponds: A case study in the Rift Valley and North Shoa reservoirs. Ethiopia. Aquac. 2011, 316, 129–135. [Google Scholar] [CrossRef]
  3. Li, X.X. Research on Aquaculture and Agricultural Non-point Source Pollution. Anhui Agric. Sci. Bull. 2007, 13, 61–67. [Google Scholar]
  4. Lu, J.L. Ecological Restoration Design of Fish Pond Constructed Wetland in Northwest Arid Area-Take the Yellow River Nature Reserve in Qiachuan Town as an Example. Master’s Thesis, Chinese Academy of Forestry, Beijing, China, 2020. [Google Scholar]
  5. Chen, J.; Liu, M.; Qin, X.Y.; Wang, Y.K.; Kong, D.P.; Fan, Y.N.; Li, J.; Zhou, Q.C. Technological research on substratum restoration for digging and heaping island in the region of returning pond to lake in Yilong lake. Environ. Sci. Technol. 2014, 37 (Suppl. S2), 432–436. [Google Scholar]
  6. Si, Y.J. Study on the Maintenance and Optimal Operation of Landscape Water. Master’s Thesis, Tianjin University, Tianjin, China, 2007. [Google Scholar]
  7. Li, Z.F. Investigation of Environmental Status and the Countermeasure for Ecological Restoration of the West Section of Xixi Wetland. Master’s Thesis, Zhejiang University, Hangzhou, China, 2007. [Google Scholar]
  8. Li, Y.X.; Hu, Y.H.; Wang, Y.H.; Qi, Y.K.; Tang, F.; Liu, J.; Yang, L. Wetland restoration and its purification efficiency in estuary of Dajie River, Lake Xingyun, Yunnan Province. Lake Sci. 2007, 19, 283–288. [Google Scholar]
  9. Duan, H.B.; Li, X.D.; Hong, J.M. Restoration in the demonstration area of Jinniu Lake wetland. J. Cap. Norm. Univ. (Nat. Sci. Ed.) 2011, 32, 41–45. [Google Scholar]
  10. Wang, Y.J.; Xu, H.L.; Zhan, Q.J. The bird monitor and evaluation of reform area of Shenzhen Futian ponds. Ecol. Sci. 2004, 2, 147–153. [Google Scholar]
  11. Liu, X.G.; Liu, Z.P.; Pei, E.L.; Xia, S.Z.; Gu, Z.J. Biological assessment of pollution and ecological restoration of the water sources of the Dalian Lake in Shanghai. Resour. Sci. 2011, 33, 280–285. [Google Scholar]
  12. Zhang, Y.N. Theoretical Method and Applications of Post Evaluation on Ecological Construction Project. Master’s Thesis, Qinghai University, Xining, China, 2018. [Google Scholar]
  13. Chen, X.R. Advances in post evaluation of river ecological restorations. Adv. Sci. Technol. Water Resour. 2016, 14, 443–447. [Google Scholar]
  14. Zhao, Y.J.; Dong, Z.R.; Sun, D.Y.; Zhang, J. Negative feedback regulation based planning and design method for river restoration. Water Resour. Hydropower Eng. 2010, 41, 19. [Google Scholar]
  15. He, L.; Zong, W.J.; Fu, H.; Niu, D.C. Evaluation of restoration effect in degraded alpine meadow under different regulation measures. Trans. Chin. Soc. Agric. Eng. 2016, 32, 268–275. [Google Scholar]
  16. Hao, Y.Y. Evaluation of Ecological Restoration Effects Based on GIS/RS for Northwest Inland River Basin, China—A Case Study of Minqin Basin in the Downstream of Shiyang River. Ph.D. Thesis, Lanzou University, Lanzhou, China, 2017. [Google Scholar]
  17. Fang, D.; Xu, J.; Xu, S. Monitoring and assessment of effectiveness of water pollution control of the Xuanwu Lake by Ecological Project. Adm. Tech. Environ. Monit. 2001, 13, 36–38. [Google Scholar]
  18. Zhu, H.; Liu, X.G.; Pei, E.L.; Guo, E.L.; Xia, S.Z. Studies on effects of ecological restoration on water quality in Dalian Lake. Chin. J. Environ. Eng. 2010, 4, 1790–1794. [Google Scholar]
  19. Wang, M.; Tang, J.C.; Zhu, W.Y.; Liang, H.Y.; Wang, R.G. Evaluation of the effects of ecological remediation on the water quality and biological toxicity of Dagu Drainage River in Tianjin. Acta Ecol. Sin. 2012, 32, 4535–4543. [Google Scholar] [CrossRef] [Green Version]
  20. An, S.Q. Wetland Ecological Engineering: Optimization Model of Wetland Resources Utilization and Protection; Chemical Industry Press: Beijing, China, 2003; pp. 2–10. [Google Scholar]
  21. Li, C.H.; Zheng, X.K.; Niu, S.F.; Cai, Y.P.; Shen, N.; Pang, A.P. Research progress in protection and restoration of urban wetlands. Prog. Geogr. 2009, 28, 271–279. [Google Scholar]
  22. Yue, F. The Avian Biodiversity Conservation and Habitat Optimization in Wetlands Restoration in Dalian Iake, in Shanghai. Master’s Thesis, East China Normal University, Shanghai, China, 2011. [Google Scholar]
  23. Che, W.; Huang, Y.; Li, J.Q.; Liu, Y. Problems and suggestions in rehabilitation of urban waters in Beijing. Environ. Pollut. Control 2005, 8, 593–596. [Google Scholar]
  24. Sohoulande, C.D.D.; Szogi, A.A.; Novak, J.M.; Stone, K.C.; Martin, J.H.; Watts, D.W. Long-Term Nitrogen and Phosphorus Outflow from an Instream Constructed Wetland under Precipitation Variability. Sustainability 2022, 14, 16500. [Google Scholar] [CrossRef]
  25. Sun, X.L.; Wang, Y.; Xiong, H.Q.; Wu, F.; Lv, T.X.; Fang, Y.C.; Xiang, H. The Role of Surface Functional Groups of Iron Oxide, Organic Matter, and Clay Mineral Complexes in Sediments on the Adsorption of Copper Ions. Sustainability 2023, 15, 6711. [Google Scholar] [CrossRef]
  26. Deng, T.Y.; Zhou, G.R.; Zang, Y.L. Investigation on the current situation of landscape water pollution in urban parks of Chengdu city. Water Wastewater Eng. 2012, 48 (Suppl. S1), 172–175. [Google Scholar]
  27. Zhang, P.P. Study on the Causes of Water Pollution in Jiashan Pond and Fengjing Pond. Master’s Thesis, Shanghai Normal University, Shanghai, China, 2022. [Google Scholar]
  28. Cen, M.; Cen, W.L. Landscape Greening Construction of Shanghai Chenshan Botanical Garden; Shanghai Scientific and Technical Publishers: Shanghai, China, 2013; pp. 3–4. [Google Scholar]
  29. Peng, H.L.; Fang, H.L.; Hao, G.J.; Cui, X.Y. Soil and surface water quality in the planning area of Chenshan Botanical Garden. J. Northeast For. Univ. 2009, 37, 43–47. [Google Scholar]
  30. Vymazal, J. Removal of nutrients in various types of constructed wetlands. Sci. Total Environ. 2007, 380, 48–65. [Google Scholar] [CrossRef]
  31. Vymazal, J.; Kröpfelová, L. Wastewater Treatment in Constructed Wetlands with Horizontal Sub-Surface Flow; Alloway, B.J., Trevors, J.T., Eds.; Springer Science and Business Media: Berlin, Germany, 2008; pp. 171–200. [Google Scholar]
  32. Shang, K.K.; Gilles, V.; Hu, Y.H. Practice and Evaluation of Greening Technology Based on Sponge City; China Architecture and Building Press: Shanghai, China, 2021; pp. 95–97. [Google Scholar]
  33. Yang, Y.; Liu, Q.; Hu, Z.J.; Zhang, Y.M.; Gang, Y.X. Spatial distribution of sediment carbon, nitrogen and phosphorus and pollution evaluation of sediment in Taihu Lake Basin. Acta Sci. Circumstantiae 2014, 34, 3057–3064. [Google Scholar]
  34. Wang, P.; Lu, S.Y.; Wang, D.W.; Xu, M.S.; Gan, S.; Jin, X.C. Nitrogen phosphorous and organic matter spatial distribution characteristics and their pollution status evaluation of sediments nutrients in lakeside zones of Taihu Lake. China Environ. Sci. 2012, 32, 703–709. [Google Scholar]
  35. Bao, S.D. Soil Agricultural Chemistry Analysis, 3rd ed.; China Agriculture Press: Beijing, China, 2000; pp. 30–31. [Google Scholar]
  36. Zhong, L.Y.; Liu, L.M.; Yang, J.W. Characterization of heavy metal pollution in the paddy soils of Xiangyin County, Dongting lake drainage basin, central south China. Environ. Earth Sci. 2012, 67, 2261–2268. [Google Scholar] [CrossRef]
  37. Su, K.; Wang, Q.; Li, L.X.; Cao, R.; Xi, Y.W. Water quality assessment of Lugu Lake based on Nemerow pollution index method. Sci. Rep. 2022, 12, 13613. [Google Scholar] [CrossRef] [PubMed]
  38. Xu, B.; Lin, C.Y.; Mao, X.W. Analysis of applicability Nemerow pollution index to evaluation of water quality of Taihu Lake. Water Resour. Prot. 2014, 30, 38–40. [Google Scholar]
  39. Wang, S.M.; Dou, H.S. China Lake Gazetteer; Science Press: Beijing, China, 1998; pp. 90–91. [Google Scholar]
  40. Zhang, Y.P.; Liu, J.J.; Zhang, F. Risk assessment of nitrogen, phosphorus, organic carbon, and heavy metals in Shanghai aquaculture ponds. J. Fish. China 2020, 27, 1448–1463. [Google Scholar]
  41. Zhang, X.L.; Liu, L.J.; Li, P.Y.; Li, P. Evaluation of coastal wetland degradation in China. Mar. Sci. Bulietin 2014, 33, 112–119. [Google Scholar]
  42. Geng, G.B. The situation of wetland protection in China is not optimistic. Green China 2014, 3, 8–11. [Google Scholar]
  43. Shang, K.K. Discussion on the optimization of water quality maintenance systems in large-scale urban recreational water. Chin. Landsc. Archit. 2015, 31, 71–74. [Google Scholar]
  44. Vadas, P.A.; Owens, L.B.; Sharpley, A.N. An empirical model for dissolved phosphorus in runoff from surface-applied fertilizers. Agric. Ecosyst. Environ. 2008, 127, 59–65. [Google Scholar] [CrossRef]
  45. Wang, S.R.; Ni, D.; Jiao, L.X.; Jin, X.C.; Feng, M.L.; Liu, Z.G.; Zhang, W.H. Space-time variety of organic matter and nutrient in surface sediments from Poyang Lake. J. Environ. Eng. Technol. 2012, 2, 23–28. [Google Scholar]
  46. Liu, C.; Shao, S.G.; Fan, C.X.; Zhou, Q.L.; Chen, C.; Sen, Q.S. Distribution and release risk of nutrients in the sediments of heavily polluted confluence bay of Chaohu Lake. Res. Environ. Sci. 2014, 27, 1258–1264. [Google Scholar]
  47. Zhang, G.G. Characterization and ecological risk assessment of nutrients and heavy metal pollution in the surface sediments of Dongting lake. J. Hydroecol. 2015, 36, 25–31. [Google Scholar]
  48. Zhang, H.W.; Zhu, X.D.; Che, Y.; Zuo, Y.W.; Hu, W. Approach for ecological restoration of Dalian Lake based on regional development and water source protection. China Water Wastewater 2009, 25, 6–9+15. [Google Scholar]
  49. Kang, L.J. Characteristics and risk evaluation of carbon, nitrogen and phosphorus in sediments of the Dianshan lake. Resour. Environ. Yangtze Basin 2012, 21 (Suppl. S1), 105–110. [Google Scholar]
  50. Xu, L.L.; Ma, C.A.; Lu, W.W.; Zhao, Y.L. The distribution of heavy metals in surface sediment of Lake Dianshan and its correlations with macrozoobenthos. Acta Sci. Circumstantiae 2011, 31, 2223–2232. [Google Scholar]
  51. Tao, Z.K.; Bi, C.J.; Chen, Z.L.; Wang, X.H.; Wang, X.P.; Ni, W.Y. Pollution characteristics and assessment of heavy metals in the sediments from Dishui lake. Resour. Environ. Yangtze Basin 2014, 23, 1714–1720. [Google Scholar]
  52. Yang, J.; Liu, M.; Chen, L.; Huang, Y.P.; Zhang, Y.Z. Spatial distribution of heavy metals in lake surface sediments in Shanghai. China Environ. Sci. 2018, 38, 3941–3948. [Google Scholar]
  53. Jeppesen, E.; Søndergaard, M.; Meerhoff, M.; Lauridsen, T.L.; Jensen, J.P. Shallow lake restoration by nutrient loading reduction—Some recent findings and challenges ahead. Hydrobiologia 2007, 584, 239–252. [Google Scholar] [CrossRef]
  54. Paerl, H.W.; Hall, N.S.; Calandrino, E.S. Controlling harmful cyanobacterial blooms in a world experiencing anthropogenic and climatic-induced change. Sci. Total Environ. 2011, 409, 1739–1745. [Google Scholar] [CrossRef]
  55. Liu, S.; Ye, Q.H.; Wu, S.Q.; Stive, M.J.F. Horizontal circulation patterns in a large shallow lake: Taihu Lake, China. Water 2018, 10, 792. [Google Scholar] [CrossRef] [Green Version]
  56. Fan, K.Q.; Lv, W.Y. Preliminary study on reusing the regenerated wastewater to landscape water, ethiopia. Environ. Prot. Sci. 2005, 31, 28–31. [Google Scholar]
  57. Wang, H.X. Study and Control of Water Quality Change in Scenic River. Master’s Thesis, Tianjin University, Tianjin, China, 2004. [Google Scholar]
  58. Zhang, Z.; Zhang, Q.; Yang, J.H. Engineering design for artificial lake waters in Huxi Campus of Chongqing University. China Water Wastewater 2006, 22, 50–53. [Google Scholar]
  59. Vincent, G.; Shang, K.K.; Zhang, G.W.; Chazarenc, F.; Brisson, J. Plant growth and nutrient uptake in treatment wetlands for water with low pollutant concentration. Water Sci. Technol. 2018, 77, 1072–1078. [Google Scholar] [CrossRef] [PubMed] [Green Version]
  60. Tondera, K.; Shang, K.K.; Vincent, G.; Chazarenc, F.; Hu, Y.H.; Brisson, J. Effect of plant species and nutrient loading rates in treatment wetlands for polluted river water under a subtropical climate. Water Air Soil Pollut. 2020, 231, 480. [Google Scholar] [CrossRef]
  61. Kadlec, R.H. Comparison of free water and horizontal subsurface treatment wetlands. Ecol. Eng. 2009, 35, 159–174. [Google Scholar] [CrossRef]
  62. Wallace, S.; Parkin, G.; Cross, C. Cold climate wetlands: Design and performance. Water Sci. Technol. 2001, 44, 259–265. [Google Scholar] [CrossRef]
  63. Vymazal, J. (Ed.) Filtration Beds of Horizontal-Flow Constructed Wetlands in Wastewater Treatment, Plant Dynamics and Management; Springer: Dordrecht, The Netherlands, 2008; pp. 311–317. [Google Scholar]
  64. Xu, W.J.; Guo, J.; Zhao, M.; Wang, R.Y.; Hou, S.Z.; Yang, Y.; Zhong, B.; Guo, H.; Liu, C.; Shen, Y.; et al. Research progress of soil plant root exudates in heavy metal contaminated soil. J. Zhejiang A F Univ. 2017, 34, 1137–1148. [Google Scholar]
  65. Bai, X.H.; Jiao, J.; Cheng, Y. Accumulation characteristics of nitrogen and phosphorus in aquatic plants of different life types in Qinggeda Lake. Environ. Prot. Xinjiang 2021, 43, 38–50. [Google Scholar]
  66. Madera-Parra, C.A.; Pena, M.R.; Pena, E.J.; Lens, P.N.L. Cr(Vi) and cod removal from landfill leachate by polyculture constructed wetland at a pilot scale. Environ. Sci. Pollut. Res. 2015, 22, 12804–12815. [Google Scholar] [CrossRef]
  67. Xu, C.F.; Zhang, J.Y.; Qin, H.J.; Han, Y.P.; Wen, S.Z.; Zhang, Y.Y.; Liu, H.Q.; Zhang, J.H. The effects of different types of aquatic plants with different life forms on improving the water quality of Dianchi Lake’s submerged vegetation vary. Jiangsu J. Agric. Sci. 2015, 6, 307–310. [Google Scholar]
  68. Zheng, J.M.; Zou, R.J.; Yao, J.M.; Wu, H.P.; Li, C.T.; Guo, Y.J. On the Removal Ability of Nitrogen and Phosphorus Nutrient Salt by Mixed-planting Different Life-type Aquatic Plants. J. Zhaoqing Univ. 2019, 40, 16–21. [Google Scholar]
  69. Zhang, L.B. Inhibition of Eutrophication of Water Body by Using Filter-feeding Fish. Mod. Sci. 2008, 14, 188. [Google Scholar]
  70. Lu, X.M.; Jin, C.X.; Huang, M.S. Purification of Eutrophic River Water with Benthic Mollusks. Environ. Sci. Technol. 2007, 7, 7–8+115. [Google Scholar]
  71. Li, Y.; Wang, L.Q.; Zhang, R.L. Nutrient releasing dynamics during decomposition process for five species of submerged macrophytes. Shanghai Environ. Sci. 2008, 27, 68–72. [Google Scholar]
  72. Yu, H.B.; Yang, Z.J.; Xiao, R.L.; Zhang, S.N.; Liu, F.; Xiang, Z.X. Absorption capacity of nitrogen and phosphorus of aquatic plants and harvest management research. Acta Prat Aculturae Sin. 2013, 22, 294–299. [Google Scholar]
Figure 1. Location of the study area.
Water 15 02881 g001
Figure 2. The area and distribution of surface water and aquaculture ponds.
Water 15 02881 g002
Figure 3. The area and distribution of the landscape water system.
Water 15 02881 g003
Figure 4. Schematic diagram of water cycle purification for landscape water. The total amount of green irrigation and evaporation in West Lake, Aquatic Garden and East Lake is 3000 m3/d.
Water 15 02881 g004
Figure 5. Process flow diagram of the water treatment plant.
Water 15 02881 g005
Table 1. List of aquatic plants in the garden.
Life FormSpeciesArea
(m2)
Planting Density
(Individuals/m2)
Emergent plantCortaderia selloana ‘Pumila’2448
Sagittaria trifolia49425
Juncus effusus27048
Cyperus involucratus118825
Typha latifolia ‘Variegata’42525
Iris pseudacorus129630
Typha latifolia23225
Canna indica19525
Lythrum salicaria128320
Cyperus papyrus95230
Acorus gramineus108425
Schoenoplectus tabernaemontani65630
Pontederia cordata44316
Nelumbo nucifera13353~4
Thalia dealbata14868~12
Alisma plantago-aquatica86620
Floating-leaf plantNymphaea tetragona29401~2
Nymphoides peltata98310~20
Submerged plant Ceratophyllum demersum417760~80
Vallisneria natans12,11960~80
Hydrilla verticillata779160~80
Potamogeton wrightii700660~80
Batrachium trichophyllum380660~80
Elodea canadensis703960~80
Potamogeton crispus183560~80
Table 2. Biomass of aquatic animals released.
NoSpeciesSize (cm)Total Mass (kg)
1Hypophthalmichthys molitrix8~1216,680
2Aristichthys nobilis3~73336
3Xenocypris microlepis3~4112
4Ctenopharyngodon idellus5~828.8
5Caridina zhejiangensis2~31900
6Macrobrachium nipponense2~31300
7Cristaria plicata4~51800
8Cipangopaludina chinensis0.8~17400
Table 3. Evaluation standard for organic matter and organic nitrogen [33].
ParametersValueDescriptionLevel
Organic matter<0.05CleanI
0.05~0.20Fairly cleanII
0.20~0.05Still cleanIII
≥0.50Organic pollutionIV
Organic nitrogen (%)<0.033CleanI
0.033~0.066Fairly cleanII
0.066~0.133Still cleanIII
≥0.133Organic nitrogen pollutionIV
Table 4. Standards for single- and Nemero comprehensive pollution index.
Level Sin gle   Pollution   Index   P i Nemero   Comprehensive   P Z Index Pollution Degree
1 P i ≤ 0.7 P Z ≤ 0.7Clean (safe)
2 0.7   <   P i ≤ 1.0 0.7   <   P Z ≤ 1.0Slight pollution (cautionary level)
3 1.0   <   P i ≤ 2.0 1.0   <   P Z ≤ 2.0Moderate pollution
4 2.0   <   P i ≤ 3.0 2.0   <   P Z ≤ 3.0Heavy pollution
5 P i > 3.0 P Z > 3.0Extreme pollution
Table 5. Values and grades of the Nemero comprehensive pollution index in all seasons.
LocationSpringSummerAutumnWinterMean
Shenjing River1.511.471.591.461.46
MMMMM
West Lake1.141.331.531.201.24
MMMMM
Aquatic Garden1.541.341.571.151.40
MMMMM
East Lake0.831.261.621.451.27
SMMMM
Note: C represents clean (safe) pollution levels, S represents slight pollution (cautionary level), and M represents moderate pollution.
Table 6. Single pollution index value and water quality classification.
Location P i
DOCODcrTNNH3-NTPBOD5
Shenjing River0.640.701.860.281.220.53
CCMCMC
West Lake0.630.671.580.230.900.50
CCMCSC
Aquatic Garden0.660.691.810.260.890.50
CCMCSC
East Lake0.600.771.600.221.130.56
CS MCMC
Note: C represents clean (safe) pollution levels, S represents slight pollution (cautionary level), and M represents moderate pollution.
Table 7. Assessment of sediment pollution.
Sampling LocationOrganic MatterOrganic Nitrogen (%)
Average ValueTypeLevelAverage ValueTypeLevel
Shenjing River0.45 ± 0.38Still cleanIII0.16 ± 0.06Organic pollutionIV
West Lake0.06 ± 0.03Fairly cleanII0.07 ± 0.02Still cleanIII
Aquatic Garden0.10 ± 0.01Fairly cleanII0.10 ± 0.01Still cleanIII
East Lake0.13 ± 0.04Fairly cleanII0.11 ± 0.02Still cleanIII
Average value0.11 ± 0.05Fairly cleanII0.11 ± 0.05Still cleanIII
Table 8. Comprehensive sediment pollution evaluation.
Location P T N P T P P Z Pollution Degree
Shenjing River1.842.532.21Heavy
West Lake1.211.331.27Moderate
Aquatic Garden1.541.561.55Moderate
East Lake1.541.681.61Moderate
Average value1.511.681.60Moderate
Table 9. Ratios of C, N, and P in sediments.
LocationC/NN/PC/P
Shenjing River14.893.3349.59
West Lake10.391.2513.00
Aquatic Garden9.841.5615.32
East Lake10.281.8118.60
Average Value11.981.9122.82
Table 10. Nemero comprehensive pollution index and grades of heavy metal pollution in sediments.
Location P i P Z
AsCrZnPbCdNiCuHg
Shenjing River0.75 0.74 0.70 0.87 0.62 0.78 0.79 0.69 0.81
SSCSCSSCS
West Lake0.60 0.79 0.79 0.87 0.80 0.92 1.00 1.02 0.94
CSSSSSSMS
Aquatic Garden0.52 0.70 0.77 0.81 0.97 0.81 0.90 1.25 1.07
CCSSSSSMM
East Lake0.76 0.84 0.86 0.97 0.39 0.99 1.06 0.97 0.96
SSSSCSMSS
Mean0.67 0.78 0.78 0.88 0.68 0.88 0.95 0.96 0.95
CSSSCSSSS
Note: C represents clean (safe) pollution levels, S represents slight pollution (cautionary level), and M represents moderate pollution.
Disclaimer/Publisher’s Note: The statements, opinions and data contained in all publications are solely those of the individual author(s) and contributor(s) and not of MDPI and/or the editor(s). MDPI and/or the editor(s) disclaim responsibility for any injury to people or property resulting from any ideas, methods, instructions or products referred to in the content.

