Article

Effects of Hydrological Drought Periods on Thermal Stability of Brazilian Reservoirs

by
Jucimara Andreza Rigotti
1,*,
João Marcos Carvalho
1,
Laura M. V. Soares
2,
Carolina C. Barbosa
3,
Alice R. Pereira
4,
Barbara P. S. Duarte
5,
Michael Mannich
6,
Sergio Koide
4,
Tobias Bleninger
6 and
José R. S. Martins
5
1
Postgraduate Program in Water Resources and Environmental Engineering, Federal University of Paraná, Curitiba 80060-000, Brazil
2
Postgraduate Program in Hydraulics and Sanitation, São Carlos School of Engineering, University of São Paulo, São Carlos 13566-590, Brazil
3
Zoology and Physiology Department, University of Wyoming, Laramie, WY 82071, USA
4
Postgraduate Program in Environmental Technology and Water Resources, University of Brasilia, Brasília 70910-900, Brazil
5
Department of Civil Engineering, Polytechnic School, University of São Paulo, São Paulo 05508-010, Brazil
6
Department of Environmental Engineering, Federal University of Paraná, Curitiba 80060-000, Brazil
*
Author to whom correspondence should be addressed.
Water 2023, 15(16), 2877; https://doi.org/10.3390/w15162877
Submission received: 30 June 2023 / Revised: 25 July 2023 / Accepted: 1 August 2023 / Published: 9 August 2023
(This article belongs to the Special Issue Challenges of Hydrological Drought Monitoring and Prediction)

Abstract

:
Droughts can impact ecosystem services provided by reservoirs. Quantifying the intensity of droughts and evaluating their potential effects on the thermal stability of reservoirs are subjects that demand greater attention, due to both the importance of temperature on aquatic metabolism and the climate change scenarios that predict an increase in the frequency of extreme weather events. This study aimed to investigate drought periods in ten Brazilian reservoirs and to discuss their effects on each reservoir’s thermal stability. The Standardized Precipitation Index at a twelve month timescale (SPI-12) was applied to identify the hydrological drought periods. One-dimensional vertical hydrodynamic modeling was used to simulate the water balance and the thermal dynamics in the reservoirs. Schmidt Stability Index (St) was calculated to assess the thermal stability of the reservoirs. The drought periods identified by the SPI-12 are related to decreasing water levels of the reservoirs, but the dam operating strategies and the upstream influence of cascading reservoirs are important drivers of fluctuations. A significant difference in St between wet and dry conditions was found only during summer for all reservoirs. Thus, this study identified alterations in thermal regime during drought periods according to the seasons and the reservoirs characteristics.

1. Introduction

Thermal stability in lakes and reservoirs varies according to morphology, local weather, extreme weather conditions, and climate change projections [1,2,3,4,5]. Drought events, projected to intensify in many regions worldwide in a climate change context, can impose profound impacts on water resources, and as a result, there might be a shift in the ecosystem services they provide, e.g., agriculture irrigation, drinking water supply, hydropower generation, groundwater recharge, and ecosystem maintenance [6]. Economic and social consequences can range far beyond the immediately impacted areas [7]. Brazil is a megadiverse country, which is home to 10% to 15% of all known species estimated in the world [8]. In this context, changes in hydroclimatic conditions related to extreme weather conditions can affect fauna and flora composition and distribution. Drought consequences to Pantanal hydrology during 2019–2020 impacted the biodiversity of one of the world’s largest wetlands because of the rapid spread of fire in this very dry set of conditions [9].
Drought is usually defined as a water shortage for an extended period caused by a deficiency of rainfall [10]. It begins with a meteorological anomaly in precipitation and air temperature that leads to cascading effects on other physical variables [11], thereby assessed from different perspectives classified as meteorological, agricultural, hydrological, and socioeconomic droughts [10]. Hydrological drought occurs when the deficiency of precipitation contributes to an inadequate surface or subsurface water supply, such as lower than mean stream flow, groundwater level, and reservoir level [10]. In this regard, a hydrological drought occurred within one month after a meteorological drought started in the Gediz River Basin of Turkey [12].
The Standardized Precipitation Index (SPI) is one of the most popular indexes to characterize drought on timescales ranging from 3 to 48 months [13]. On short timescales, the SPI is closely related to agricultural drought, while at longer timescales, the SPI can be related to groundwater and reservoir storage, or hydrological drought [14]. In addition, the SPI is applied in the Early Warning Systems from the Global Drought Observatory (https://edo.jrc.ec.europa.eu, accessed on 7 October 2022), the United States National Drought Mitigation Center (https://droughtmonitor.unl.edu, accessed on 16 August 2022), and Brazil’s Center for Monitoring and Early Warning of Natural Disasters (https://monitordesecas.ana.gov.br, 14 July 2022) to drought monitoring and risk management [7].
The drought intensity was first defined for SPI values following four categories: mild, moderate, severe, and extreme drought [15]. A modification to the limits of drought categories and application of daily datasets for SPI calculation instead of monthly total precipitation was also proposed [13]. Drought monitoring systems in the United States and Brazil classify the index results into five drought categories, on which the index range defines the severity of a drought: Abnormally Dry (D0), Moderate Drought (D1), Severe Drought (D2), Extreme Drought (D3), and Exceptional Drought (D4).
The temporal and spatial characteristics of drought events are widely studied since they may be considered the most frequent, chronic, and severe natural hazard worldwide [13,14,16]. However, despite the action of the Early Warning Systems, drought impacts, such as in water security, are rarely continuously monitored [11]. Most of Brazil had the most severe and intense drought events in almost the last 60 years, in the period from 2011 to 2019 [17]. The effects were related to an increase in water conflicts (hydropower generation, irrigated agriculture, water supply, and navigation), a decrease in agricultural production, and an increase in the occurrence of forest fires. The drought impacts on the hydrodynamics of reservoirs have been evaluated by modeling [18]; however, no correlations with some of the drought indexes were applied. In this regard, the direct effects of droughts on reservoir physical characteristics remain unclear. As a disturbance in the thermal profile often mediates further changes in chemical and biological processes with repercussions on water uses, understanding how droughts change hydrodynamics is of critical importance for water management.
Moreover, the comprehension of the relationship between air temperature, water temperature, and thermal stratification is relatively well-known through the application of hydrodynamic models and processing tools such as LakeAnalyzer [19,20,21]. However, the drought effects related to long periods of higher air temperatures and lower precipitation due to drought intensity have received little attention, which is especially so for the effects on reservoirs’ thermal alterations. The aim of this study is to assess the hydrological drought effects on the thermal dynamics of tropical and subtropical reservoirs located in Brazil. This research investigates the relationship between drought severity and drought impacts on the thermal regime of reservoirs, as well as discusses some consequences for ecosystem services and water uses.

2. Materials and Methods

2.1. Study Sites

We selected ten Brazilian reservoirs (Figure 1) based on the following conditions: (i) bathymetrical, hydrological, and meteorological data available for model input; (ii) in-situ water level and water temperature measurements available for model calibration and validation; (iii) recent hydrological drought event occurrence at the study site; (iv) similar usage, like drinking water supply and/or hydropower generation; and (v) residence times higher than three months. The reservoirs are located in different climate zones in central–south Brazil, and they are characterized by varied morphometric features and thermal regimes (Table 1).

2.2. Drought Assessment

The Standardized Precipitation Index was applied to identify the occurrence of drought periods. The SPI considers monthly precipitation data (Equations (1) and (2)) [14] and was calculated using the R package SPEI [23] at a timescale of 12 months (SPI-12) with Gamma probability distribution (Equations (3) and (4)).
S P I = s · t ( 0.010328 · t + 0.802853 ) t + 2.515517 ( ( 0.001308 t + 0.189269 ) + 1.432788 ) + 1
t = l n 1 H ( X ) 2
G x ( x ) = ( x β ) γ 1 e ( x β ) β Γ ( γ )
Γ ( γ ) = 0 x γ 1 e x d x
A timescale of 12 months or longer is recommended to evaluate hydrological impacts [24]. The monthly precipitation time series were obtained from different meteorological stations situated as close as possible to the studied reservoirs (Table 2).
The severity of the hydrological drought was classified into five categories according to the U.S. and Brazil Drought Monitor: Abnormally Dry (D0), Moderate Drought (D1), Severe Drought (D2), Extreme Drought (D3), and Exceptional Drought (D4) (Table 3). One category was considered to characterize wet periods, called Normal/Wet (W), because the analysis of drought periods was emphasized in this study.

2.3. Hydrodynamic Simulations

The General Lake Model (GLM) was used for simulating water balance and thermal stratification in the reservoirs. GLM is a one-dimensional hydrodynamic process-based model that is freely available. The model computes the water temperature, salinity, and density gradients in vertical profiles for a horizontally layered lake structure, considering the effects of hydrological and meteorological forcing [26]. GLM has also been applied to simulate changes in lake temperature and stratification metrics with low bias during extreme weather events [27].
Time series of hydrological and meteorological data, bathymetry, water temperature, and salinity in the inflows and outflows were used as input data for the hydrodynamic simulations. Those data were provided by the hydropower private companies, water utility companies, and governmental agencies [25,28,29,30,31]. The reservoirs’ water levels and water temperature profiles were calibrated based on measured data. The measured data of water temperature were obtained in field monitoring by research projects, water utility companies, or governmental environmental agencies that are managers of the reservoirs. Due to a lack of available data, we did not conduct model validation for the Passaúna, Jurumirim, Chavantes, Capivara, and Paranoá reservoirs. More detailed information on the model setup and calibration for the Itupararanga, Serra Azul, Barra Bonita, Promissão, Três irmãos, Capivara, Chavantes, Jurumirim, and Passaúna reservoirs can be found in [5,18,32,33,34]. The calibration metrics of model performance for level and temperature of all reservoirs are presented in the results.

2.4. Thermal Regime

The analysis of the drought effects on the reservoirs’ thermal regimes was carried out by computing physical indices along the simulation period using the R package rLakeAnalyzer [35]. Simulation results of water temperature were post-processed in R from the file in NetCDF format at every 0.1 m of the layer thickness. The water level data of each reservoir was also taken into account to calculate the physical indices. Since GLM has a Lagrangian grid, the simulated water temperature was interpolated onto a regular data matrix. For the interpolation, we decided to fill the gaps on the new regular grid using the simulated values from the top of the layers. By doing this, we expected to better preserve the natural differences between layers and stratification.
Among the physical indices, the Schmidt Stability (St) was selected to assess the thermal stability based on simulated water temperatures. This index describes the resistance to mechanical mixing due to the potential energy inherent to the stratification of the water column, and it was calculated following [36] (Equation (5)):
S t = g A 0 0 z m ( z z g ) A ( z ) ρ ( z ) d z
where g is the acceleration due to gravity, A0 is the surface area of the reservoir, A(z) is the area of the reservoir at height z, ρ(z) is the water density at height z, z is the water depth, zm is the maximum depth, and zg is the height to the center of the volume of the lake, defined by [37]:
z g = 0 z m z A ( z ) d z 0 z m A ( z ) d z
Schmidt Stability has been extensively used in the scientific literature to characterize the thermal processes in lakes and reservoirs [38,39,40,41]. High St values represent strong thermal stratification that requires high energetic inputs to mix the vertical water column. Schmidt Stability values were compared among periods of different drought intensities to provide a quantitative assessment of changes in the reservoir’s physical dynamics.

2.5. Data Analysis

Descriptive statistics were computed based on the simulated water level, temperature, and St. A normalization of water surface temperature and St was applied based on its maximum value for each reservoir for comparison among drought intensities and a better understanding of the influence of seasonality. A 14-day moving average was applied for better characterization of seasonality and for reducing the noise level. Pair-grid diagrams [42] were built for an exploratory data analysis to understand the relationships among St, precipitation, water level, and wind.
An analysis of variance (one-way ANOVA) was performed to evaluate the seasonal and spatial correlation between thermal stratification and drought or wet periods for each studied reservoir due to the considerable influence of seasonality on St values. Twelve wet months (SPI-12 ≥ −0.5) and twelve dry months (SPI-12 < −0.5) were selected among the whole simulation period for each reservoir to obtain a balanced dataset of St values. When there were more than twelve months in dry or wet conditions, they were undersampled. The higher values of SPI-12 for wet or dry conditions were the main undersampling criterion. Another criterion was to include different months in the datasets. The one-way ANOVA was performed with a significance level of p < 0.05.

3. Results

3.1. Drought Period Identification

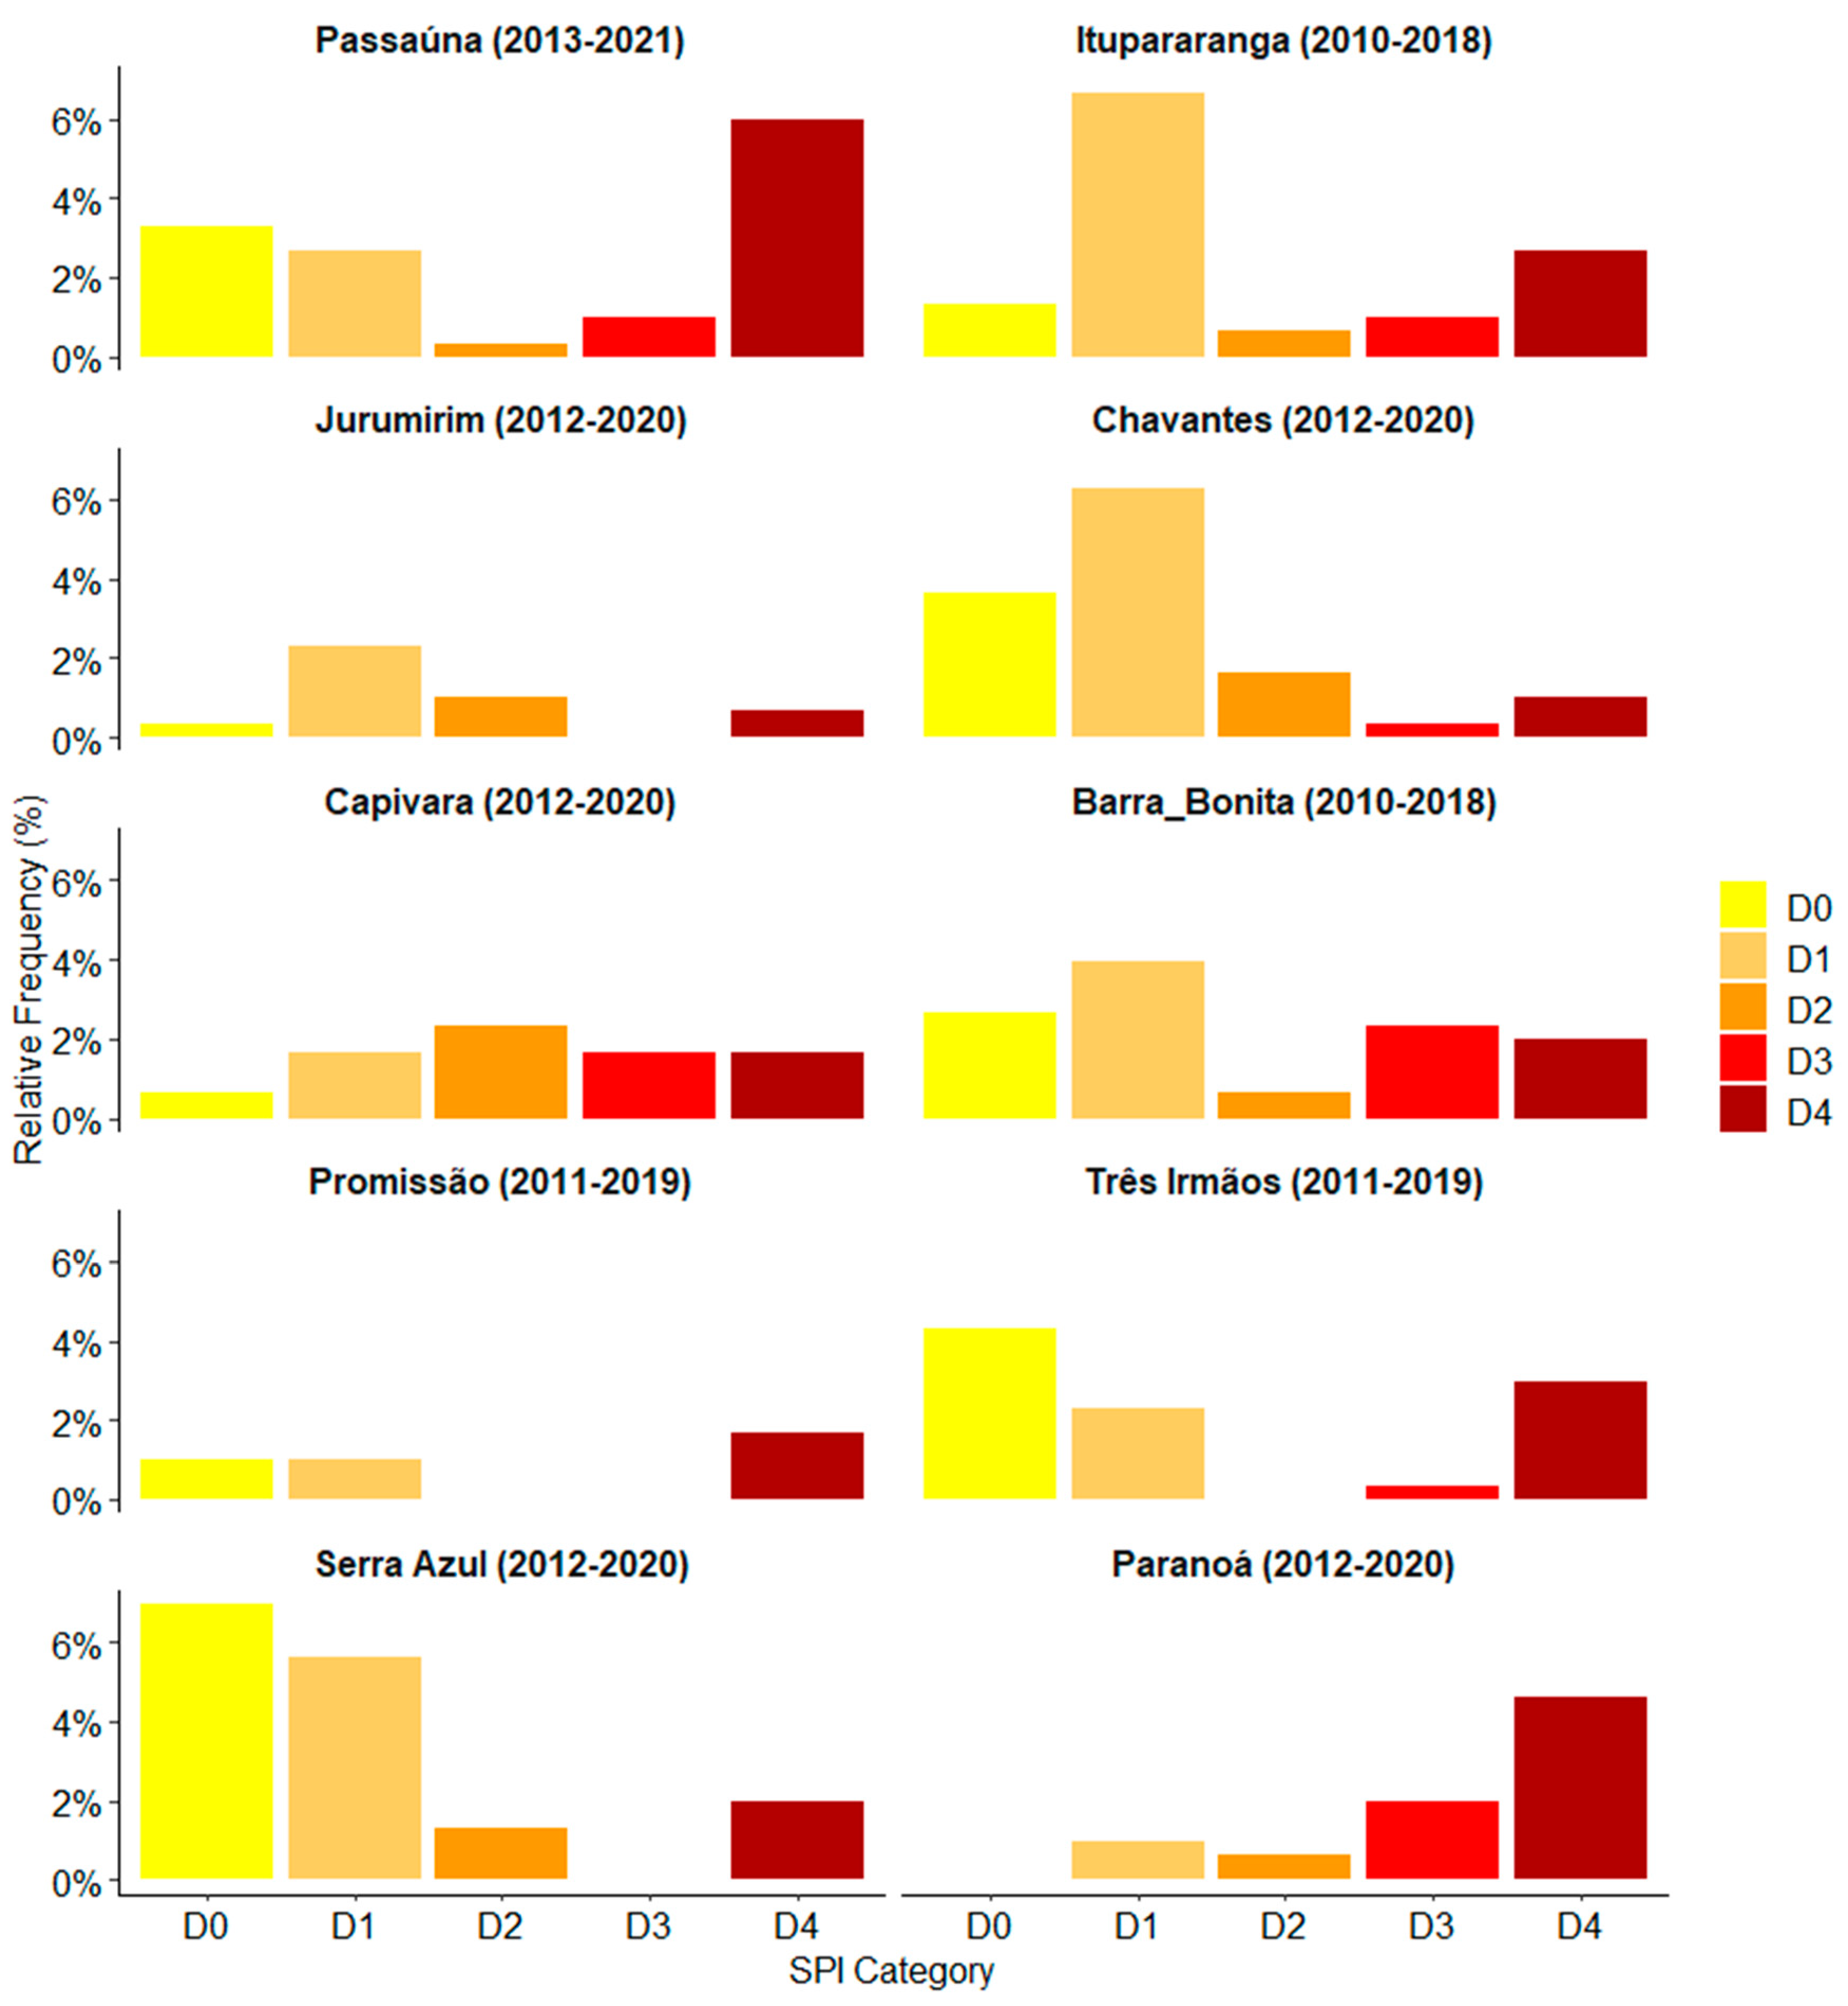
All ten reservoirs experienced exceptional droughts over the study period (Figure 2). According to Figure 2, Abnormally Dry (D0) and Moderate Drought (D1) are the most frequent categories of droughts found in the Itupararanga, Chavantes, and Serra Azul reservoirs. Extreme drought periods were identified in all of the reservoirs, with the distinctions of the Passaúna reservoir and the Paranoá reservoir, with 6.0% and 4.6% of the time experiencing D4 drought, respectively (Figure 2). These results impact water availability with potential implications for water supply since Passaúna, Itupararanga, Serra Azul, and Paranoá are drinking water supply reservoirs.

3.2. Reservoir Thermal Regime

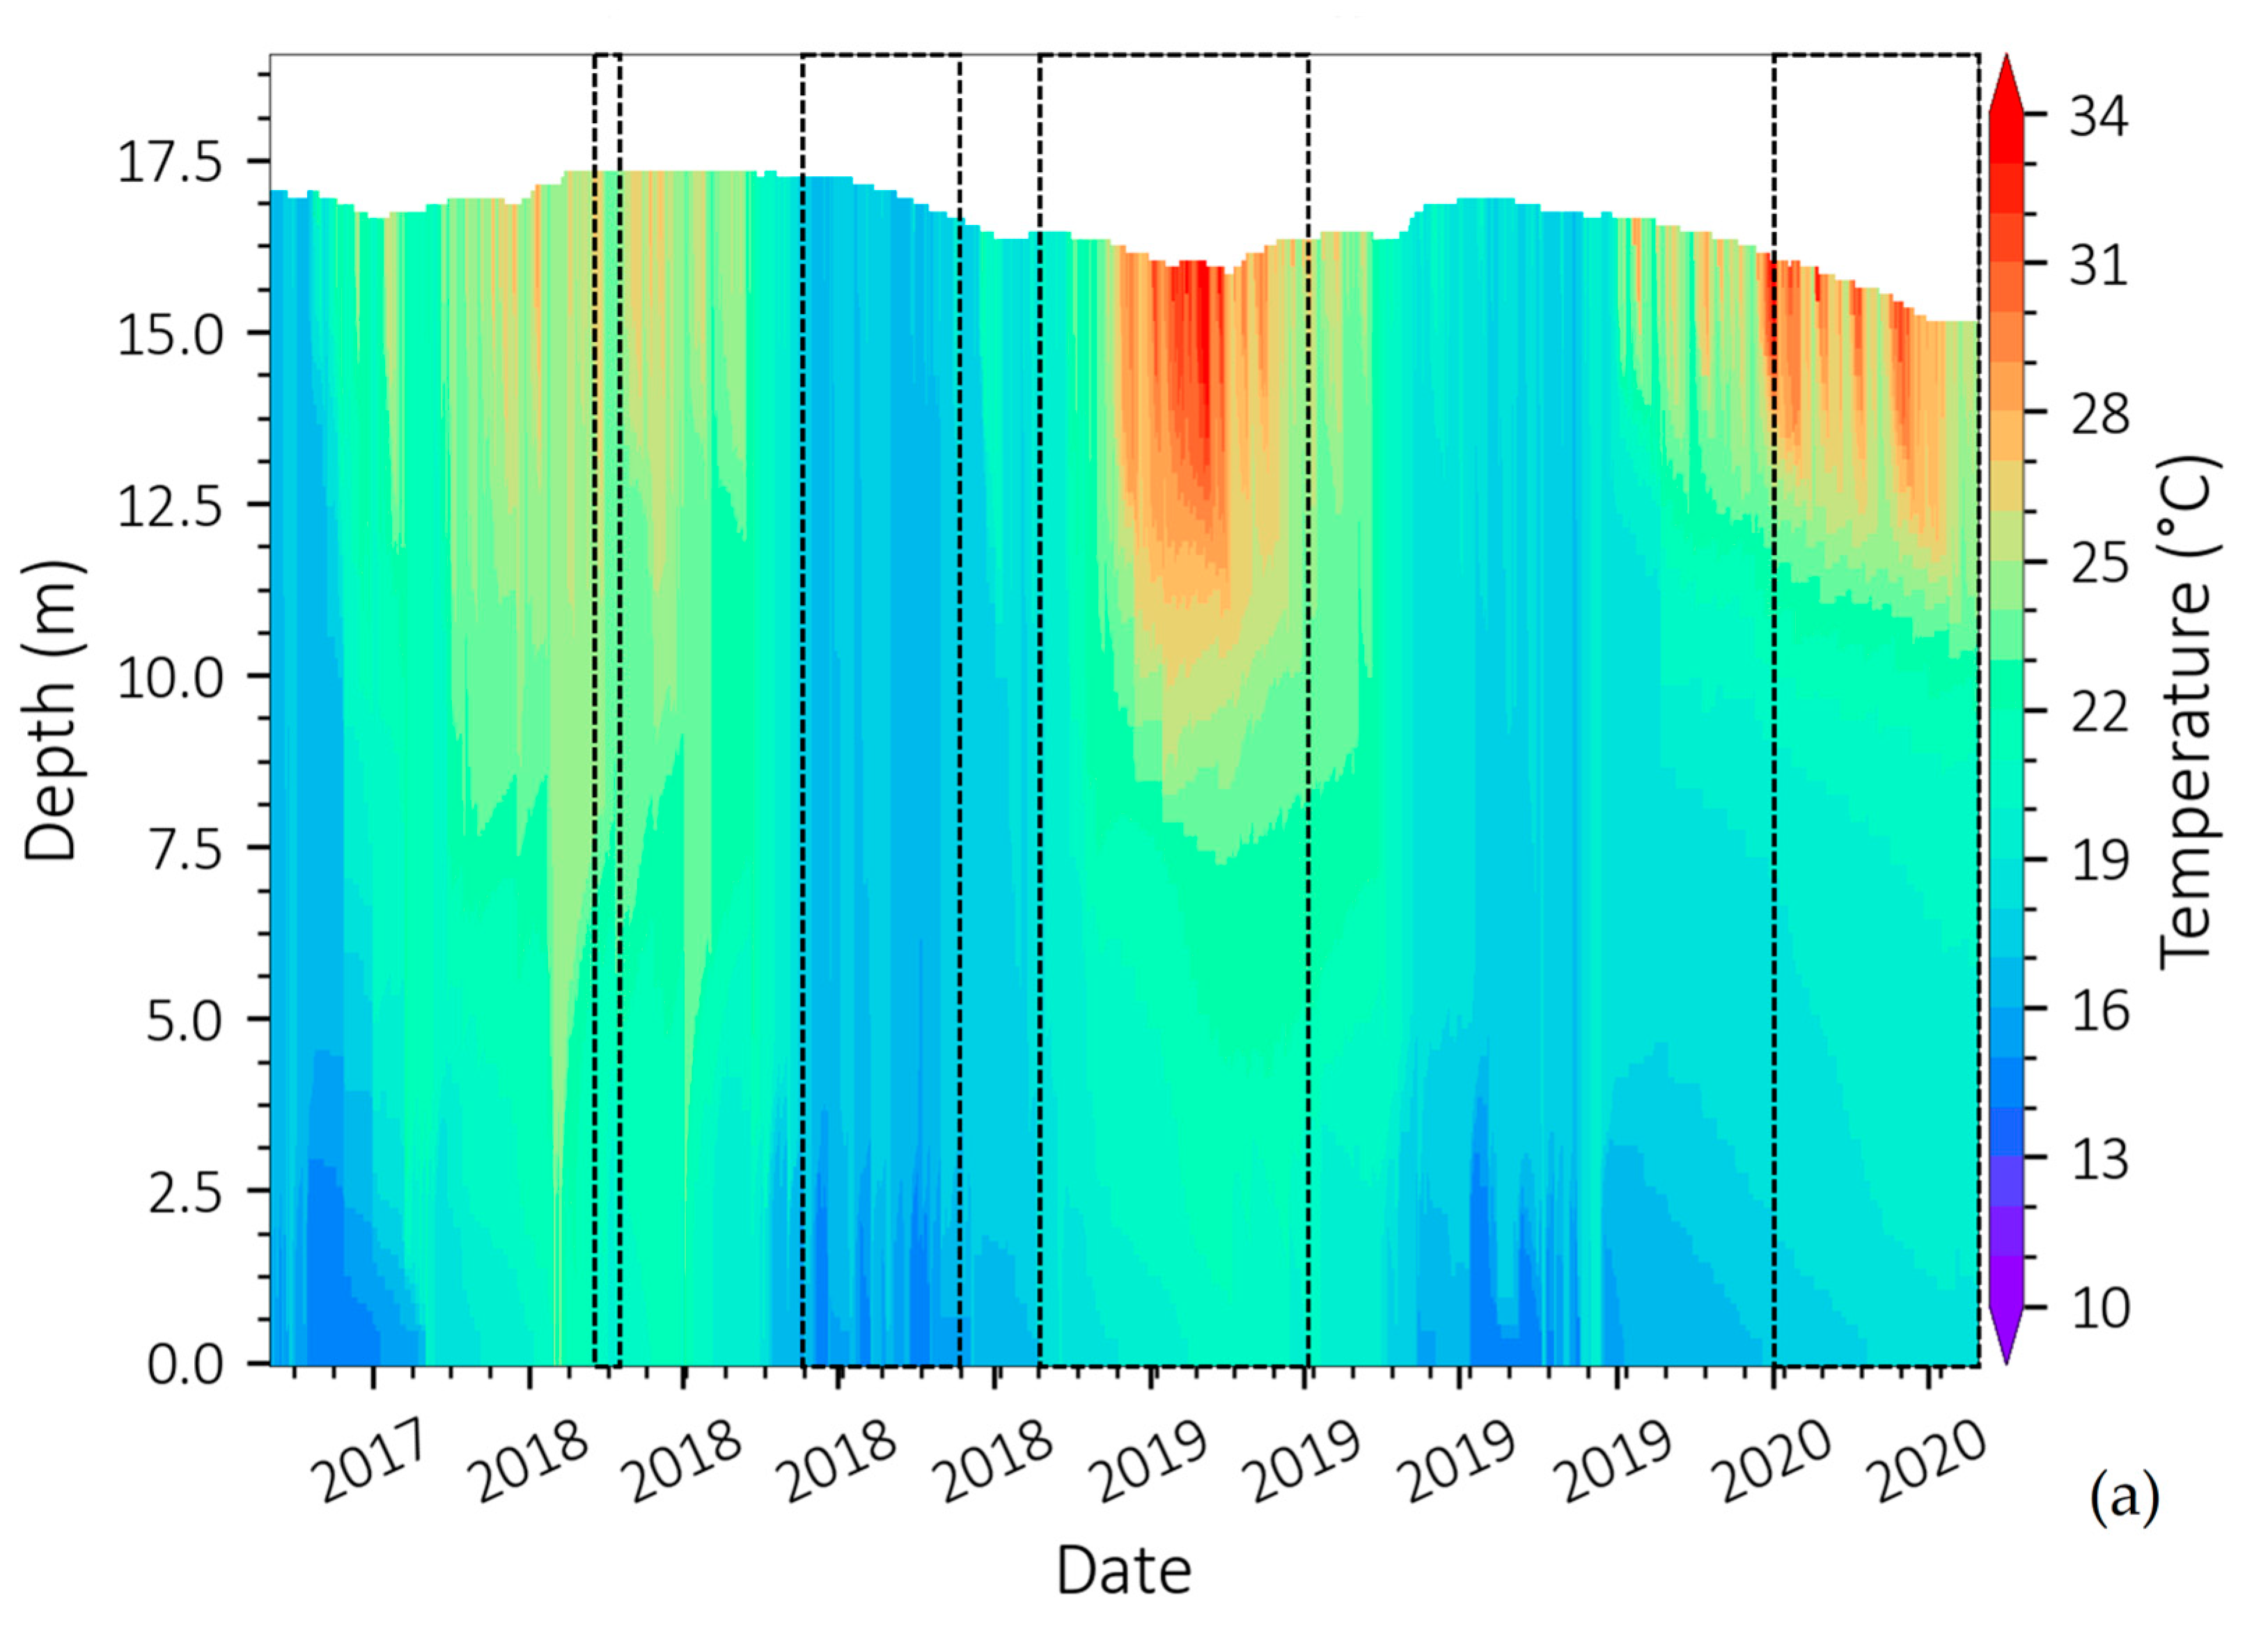
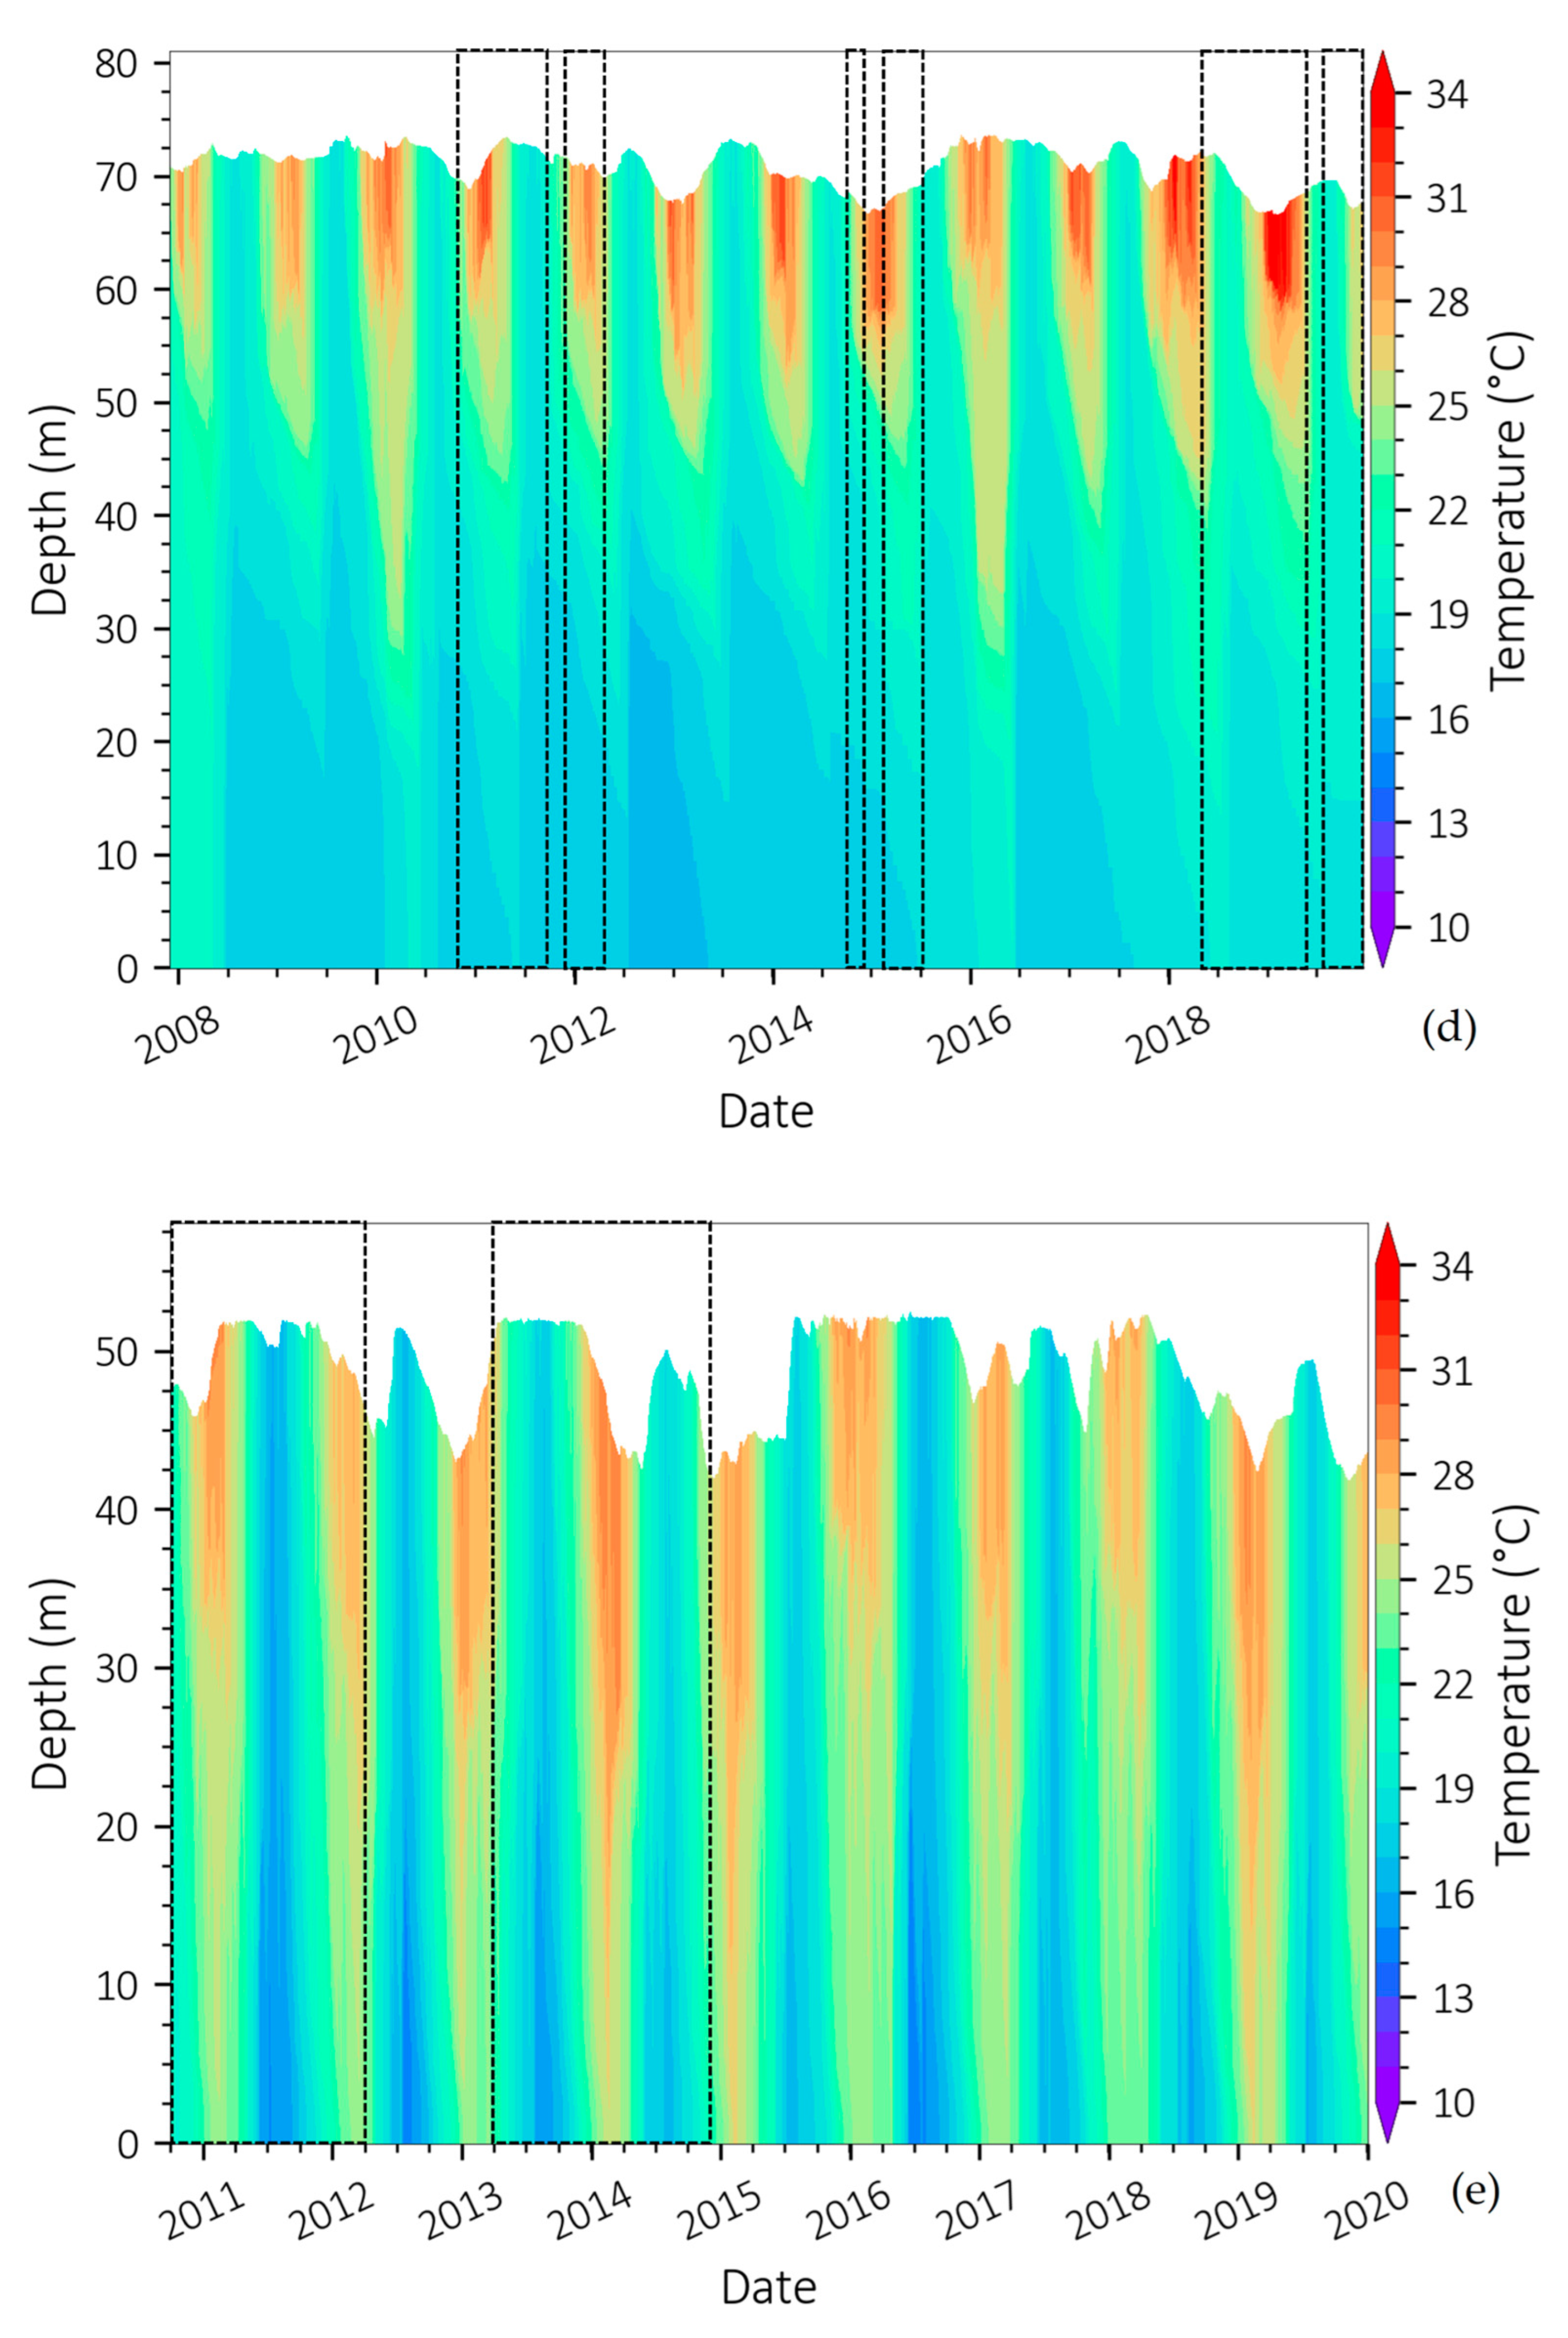
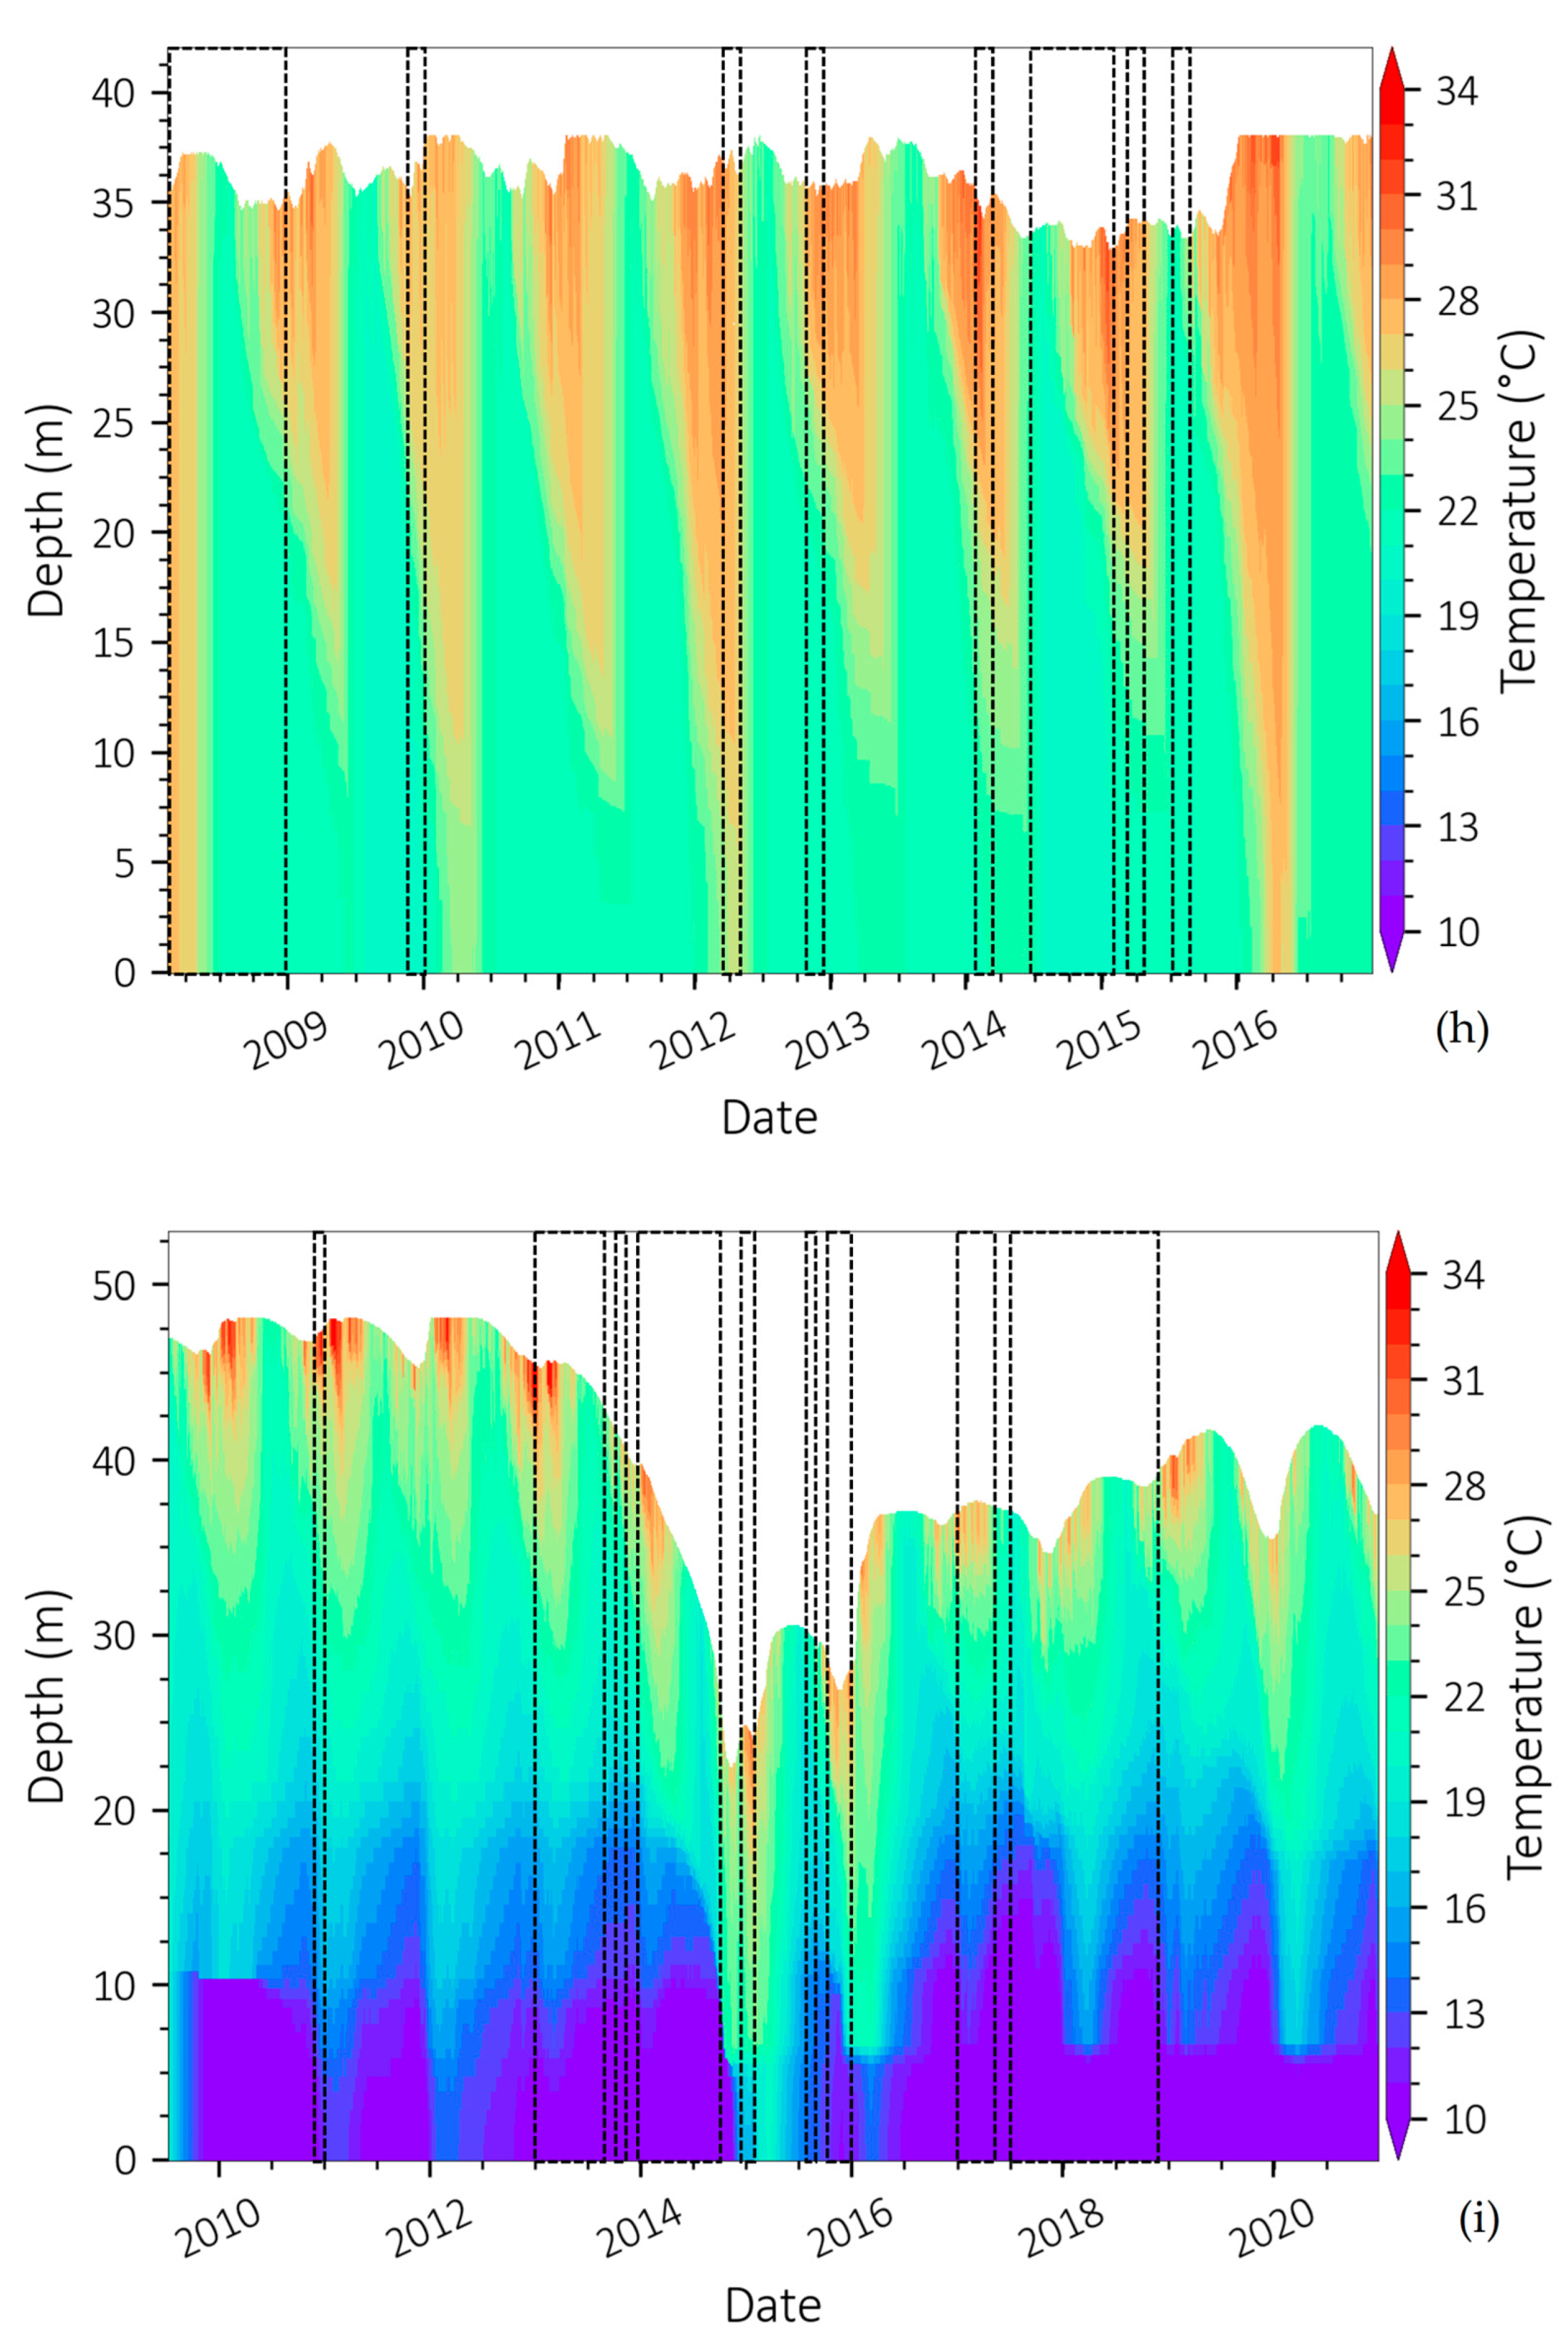
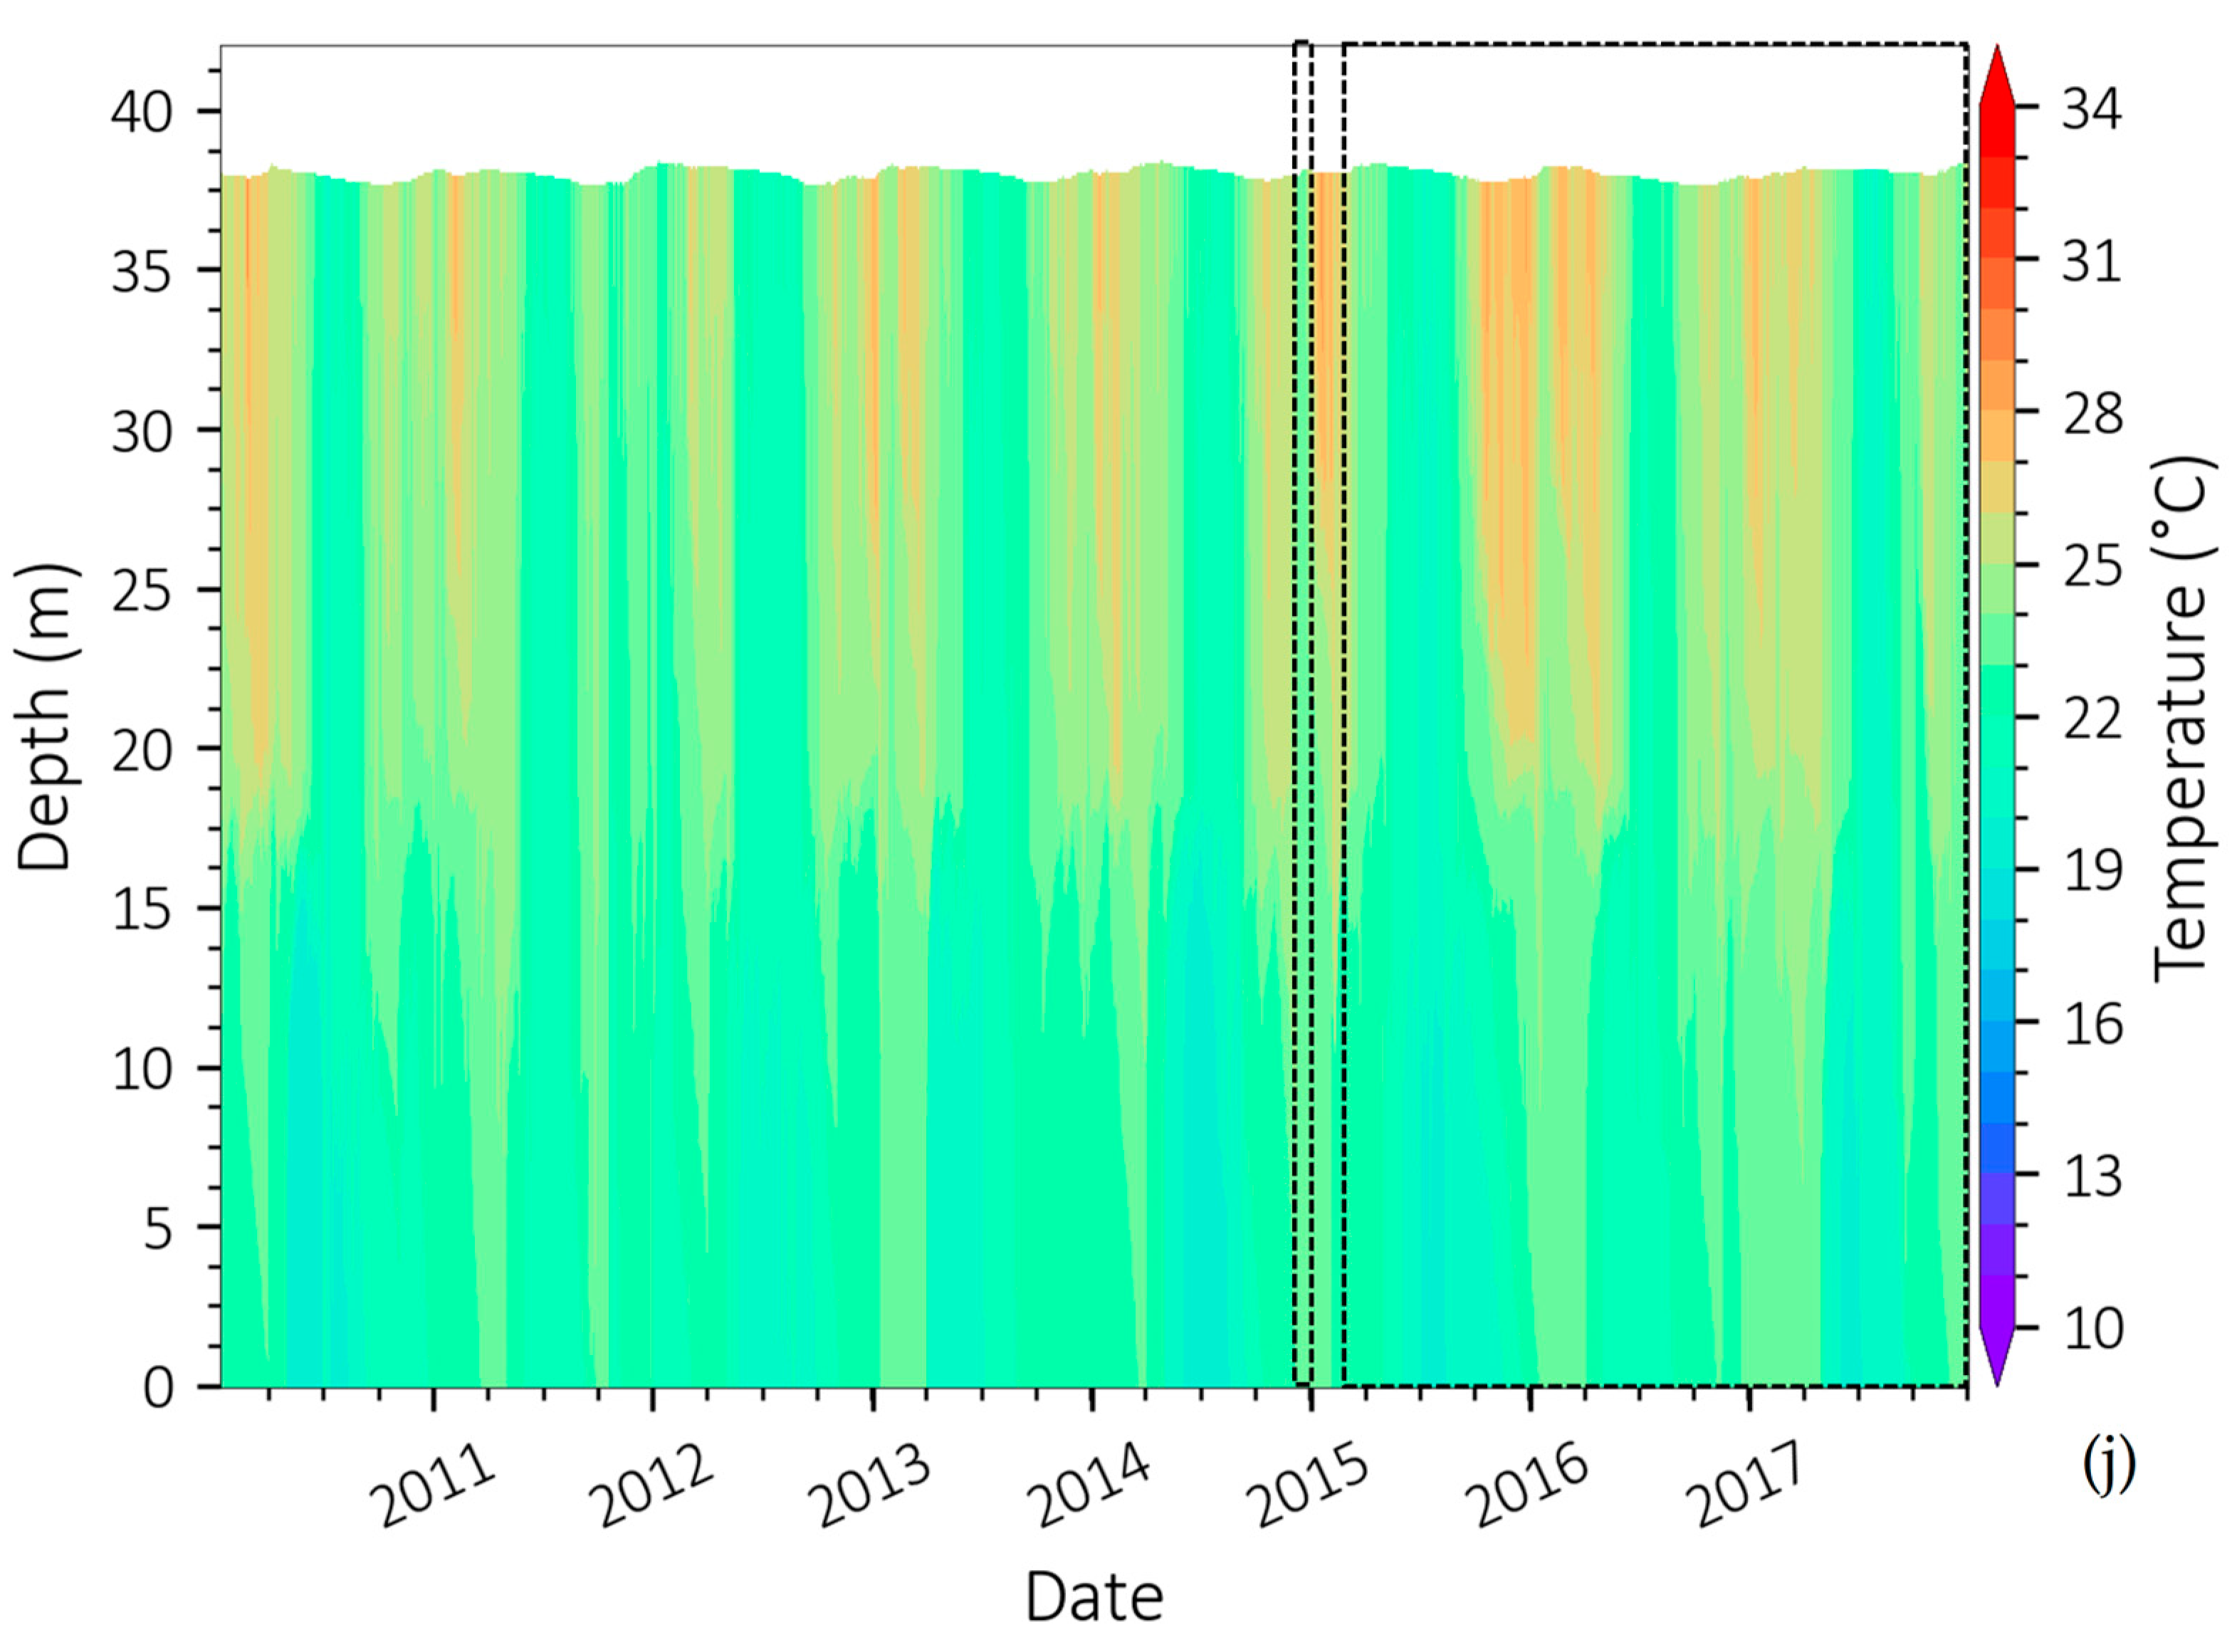
The General Lake Model successfully reproduced both the water level and the thermal regime along the simulation periods (Figure 3) with relatively good performance according to root mean square error (RMSE) for the calibration period (Table 4). Itupararanga, Barra Bonita, Promissão, Três Irmãos, and Serra Azul reservoirs had an additional dataset applied to the model validation (Table 4). Passaúna and Serra Azul reservoirs presented lower water level oscillations compared to the other eight reservoirs, which are also used for hydropower generation. In addition, GLM was able to represent water level fluctuations due to drought periods. Drought periods occurred both when the water level was low and when the water level was high in all the studied reservoirs (Figure 3). In addition, the drought was observed in both periods of stratification and mixing of reservoirs, according to the time-depth temperature contour graph of simulated temperature (Figure 3).

3.3. Schmidt Stability

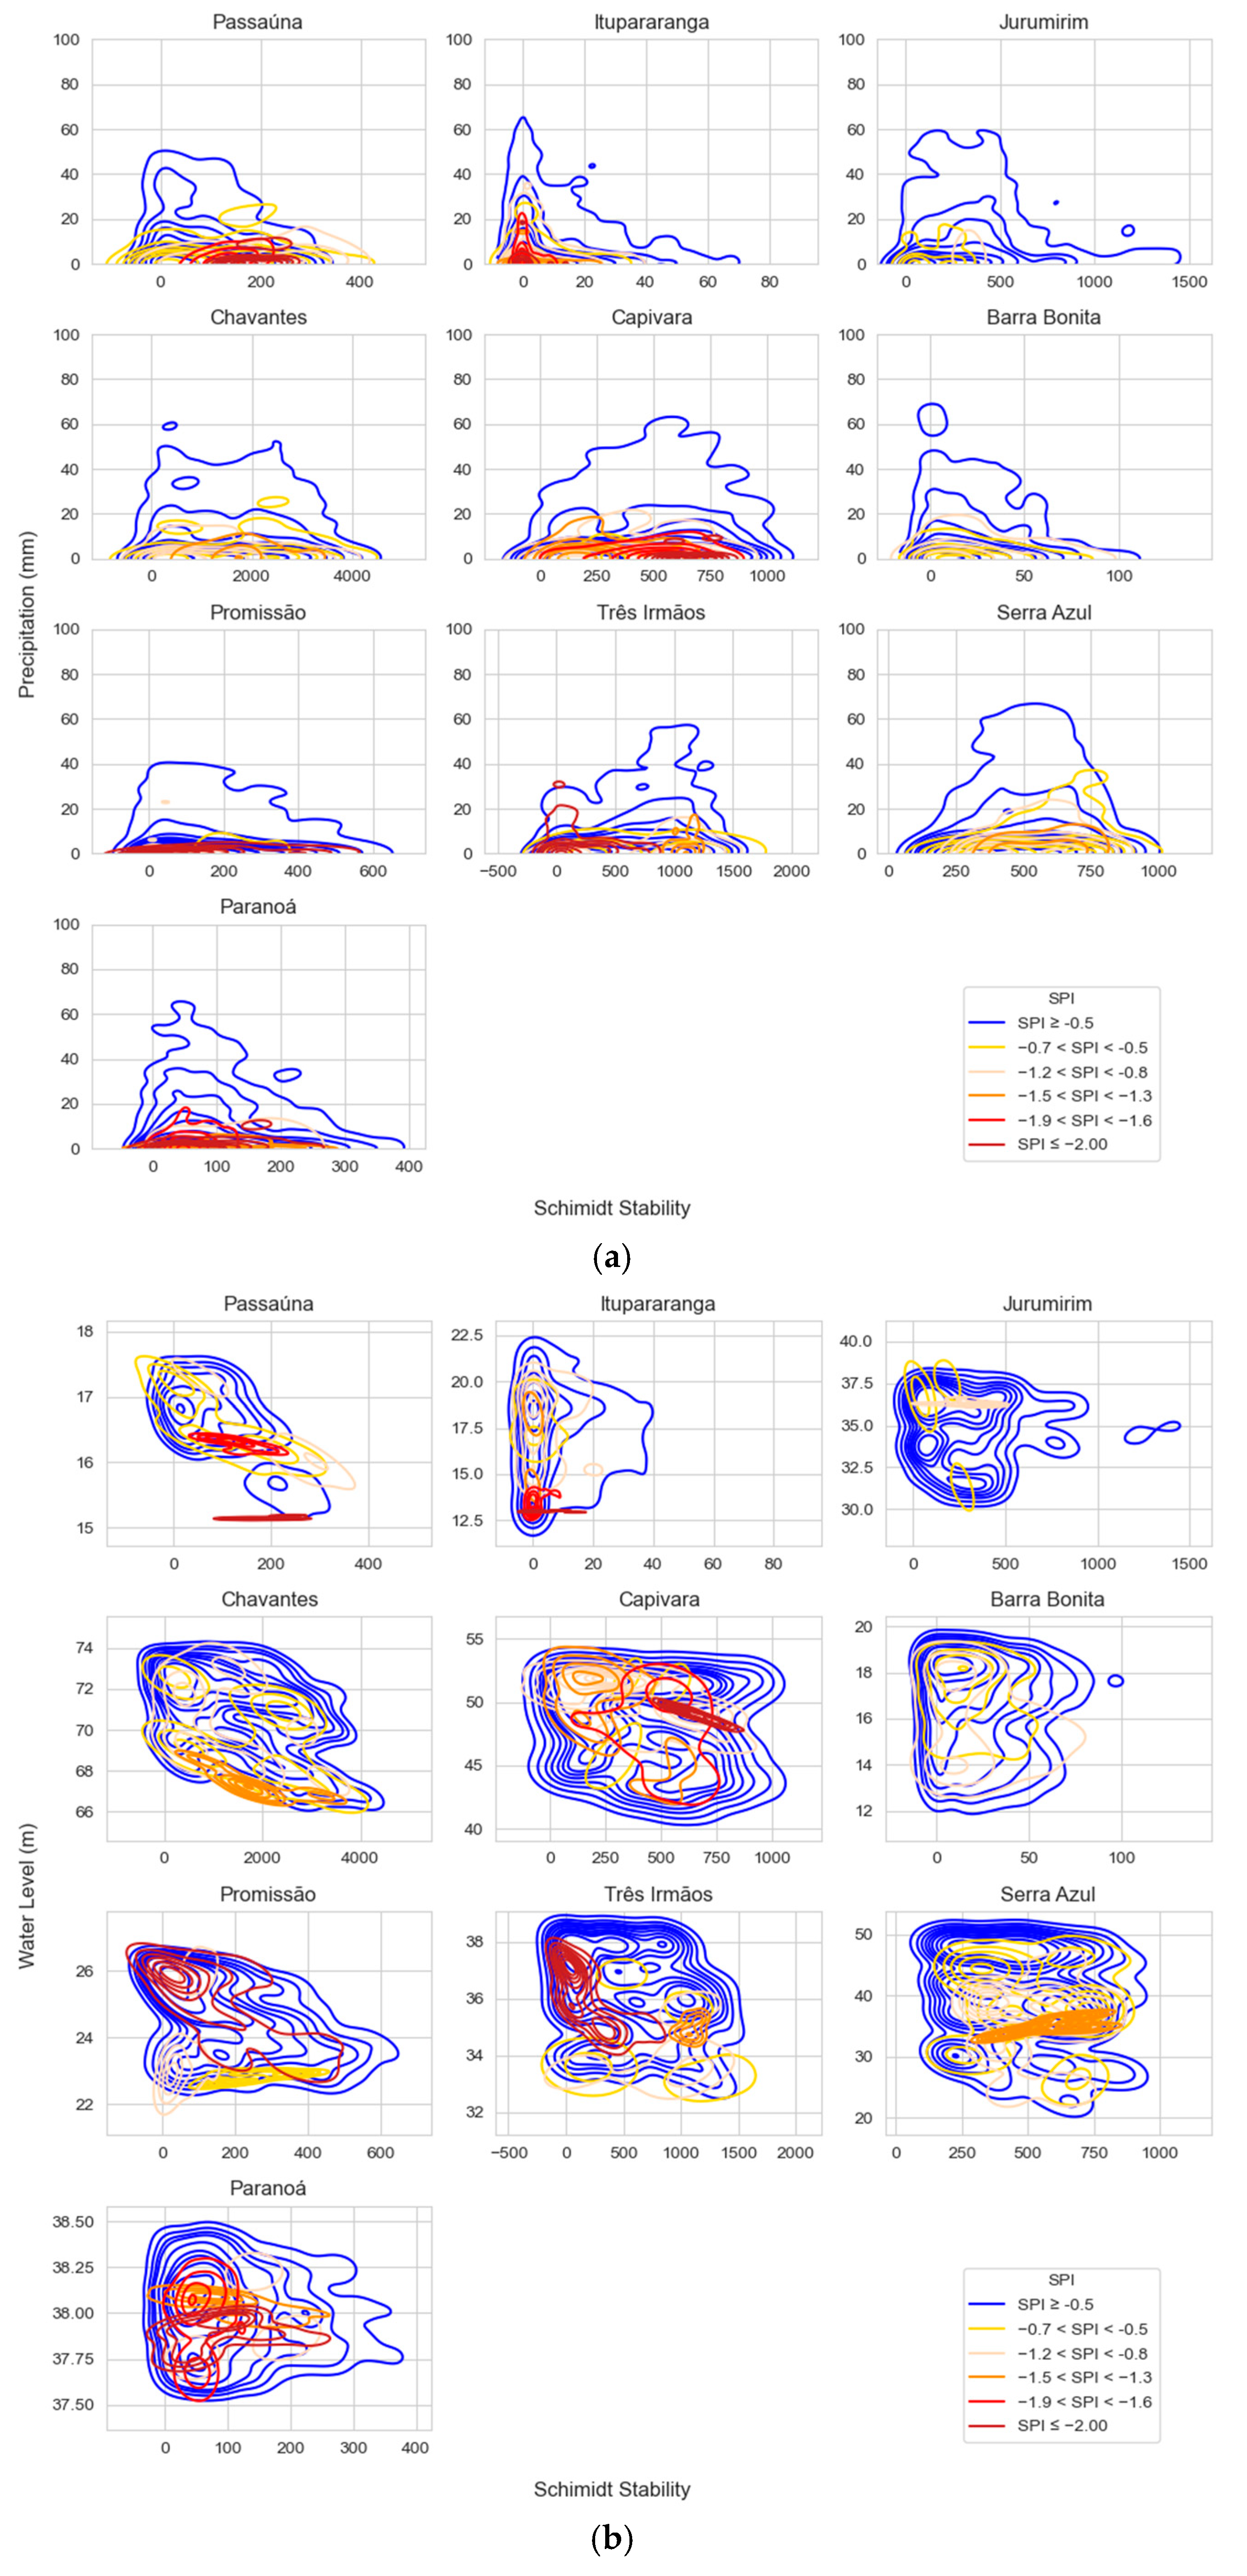
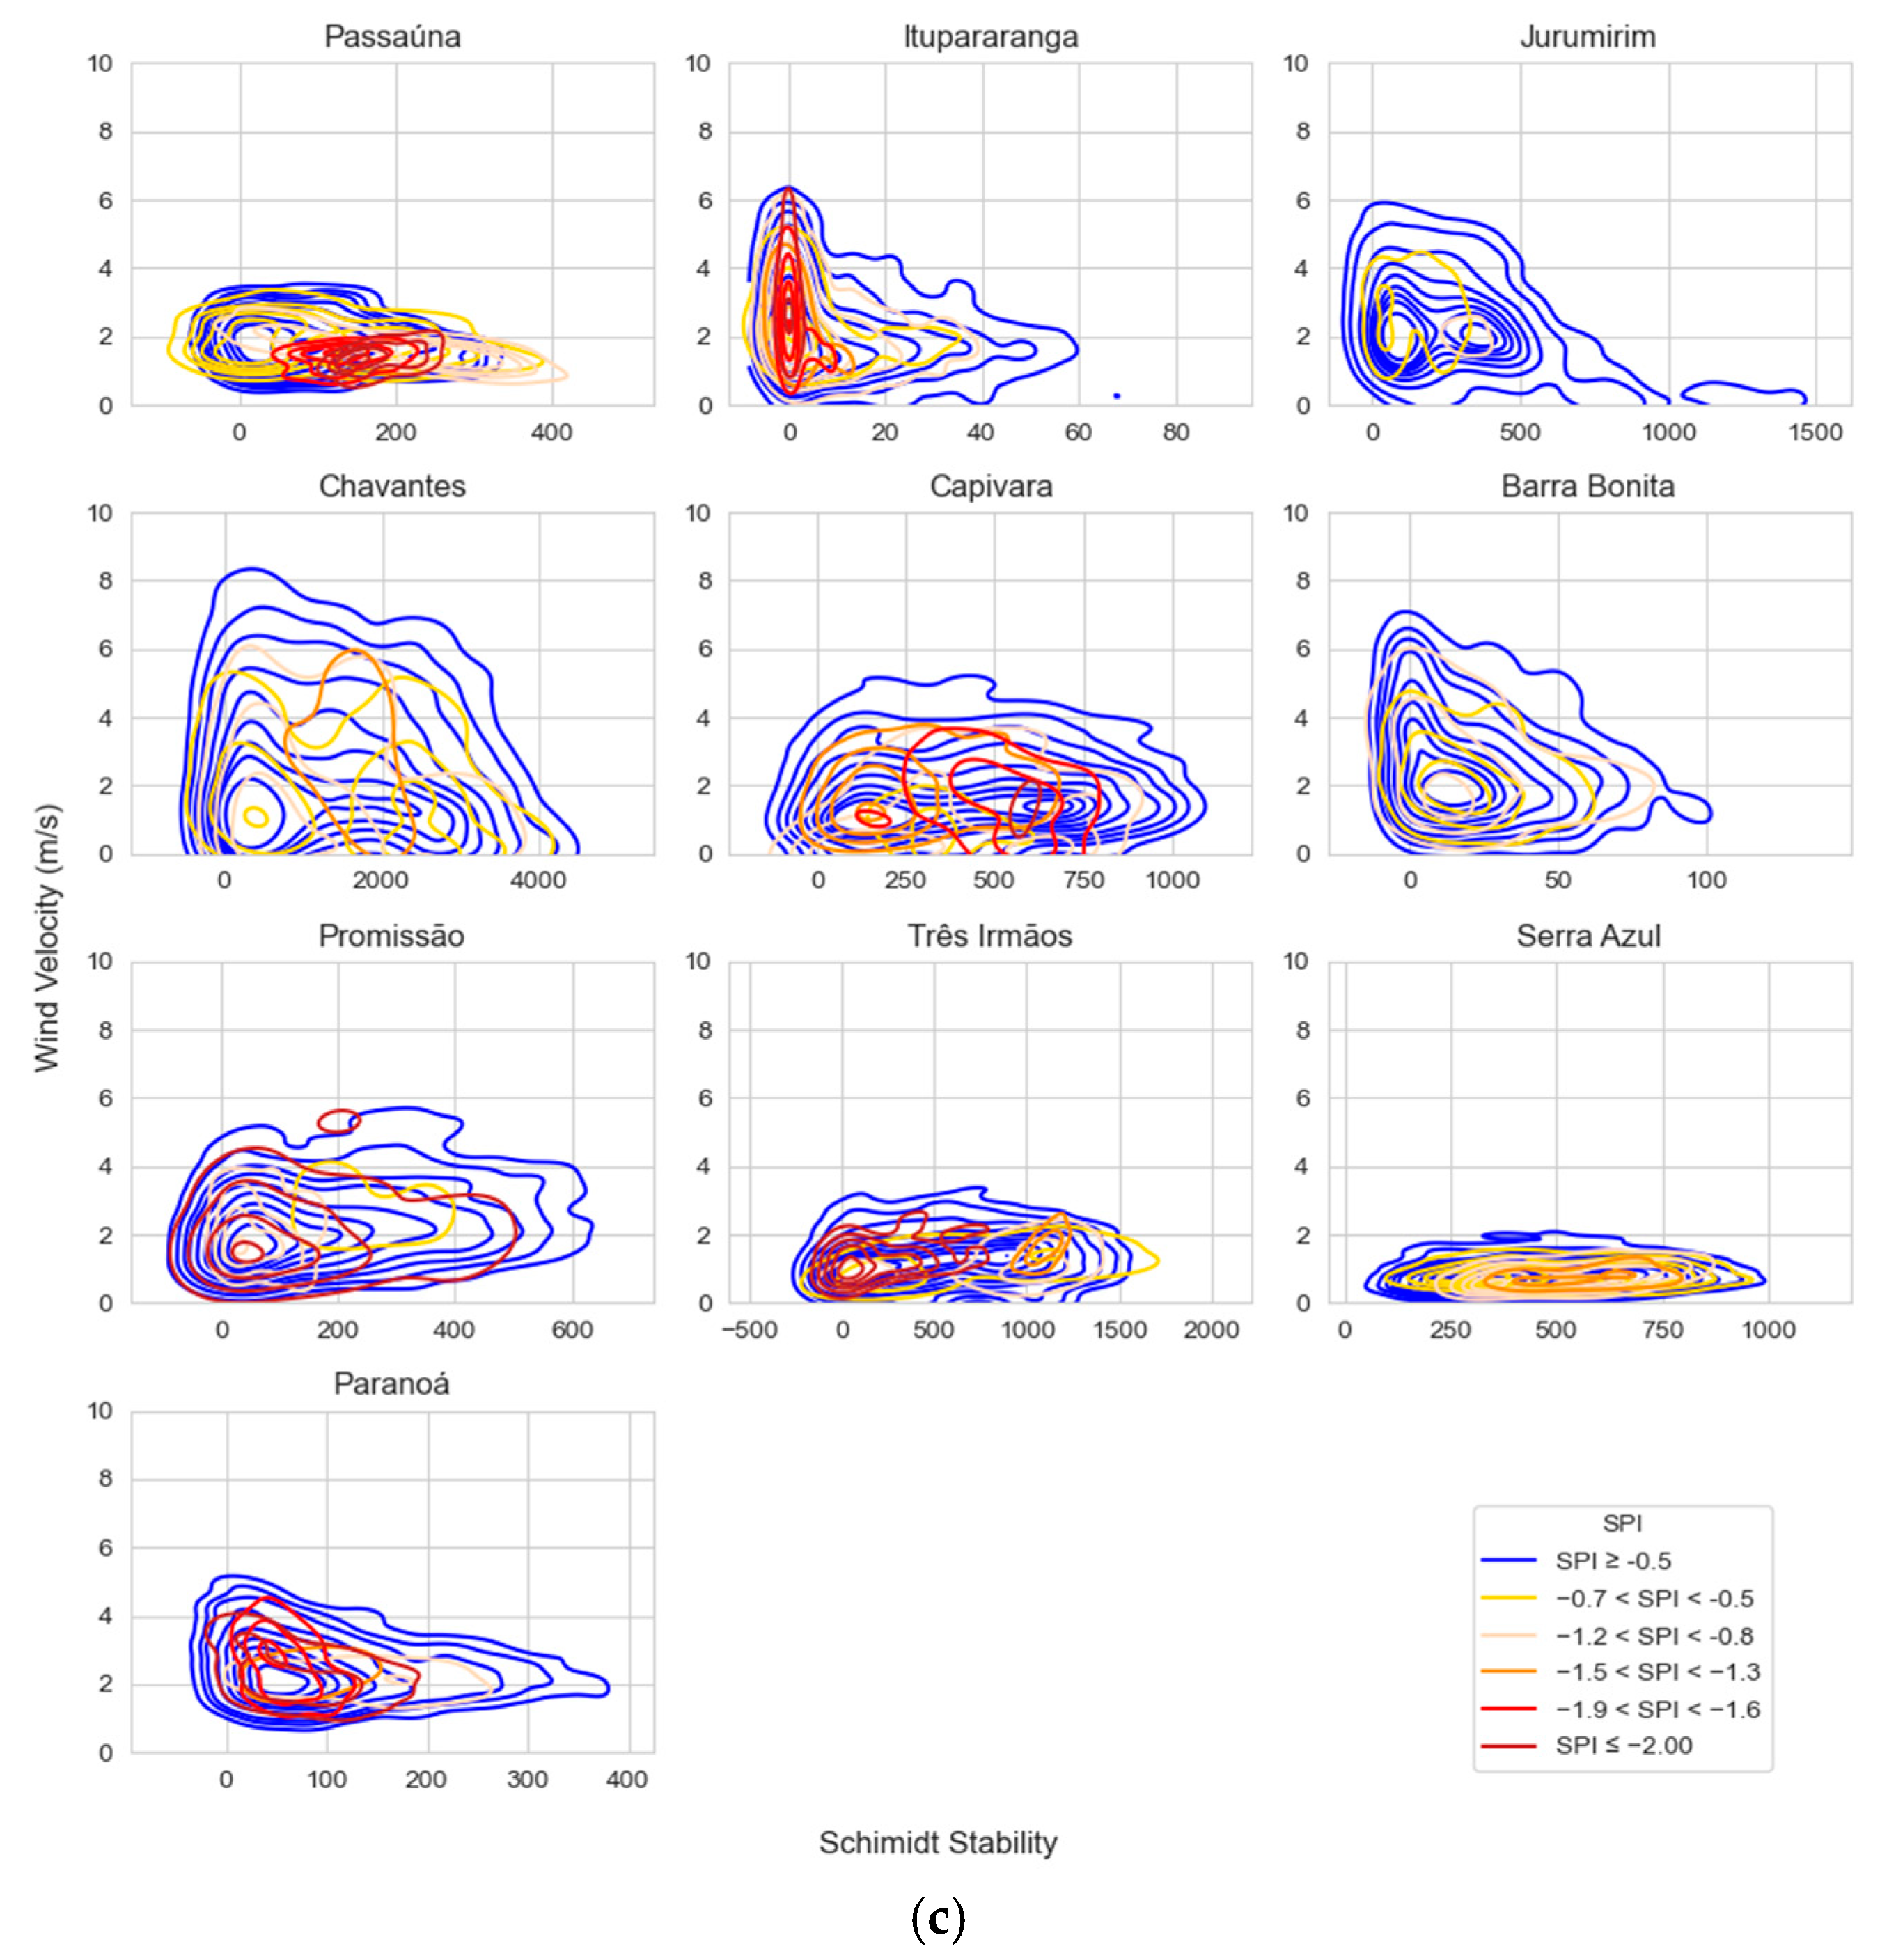
Precipitation values are coherent with drought periods, but the correlation with St varies for each reservoir (Figure 4a). The water level usually reduces during a drought period; this result was observed in Passaúna, Itupararanga, and Chavantes. Promissão and Três Irmãos, in turn, presented the opposite conditions. The other reservoirs presented drought periods distributed along high and low water levels (Figure 4b). The wind relationship with St is observed in Figure 4c. Itupararanga was the most stable reservoir, between all 10 analyzed, in terms of the relationship between St and water level, during the drought period. Independent of the drought classification, its Schmidt number maintained around zero. Paranoá became more stable during extreme drought and Três Irmãos during exceptional drought. All other SPI-12 categories and water levels appeared to increase St’s range (Figure 4b).
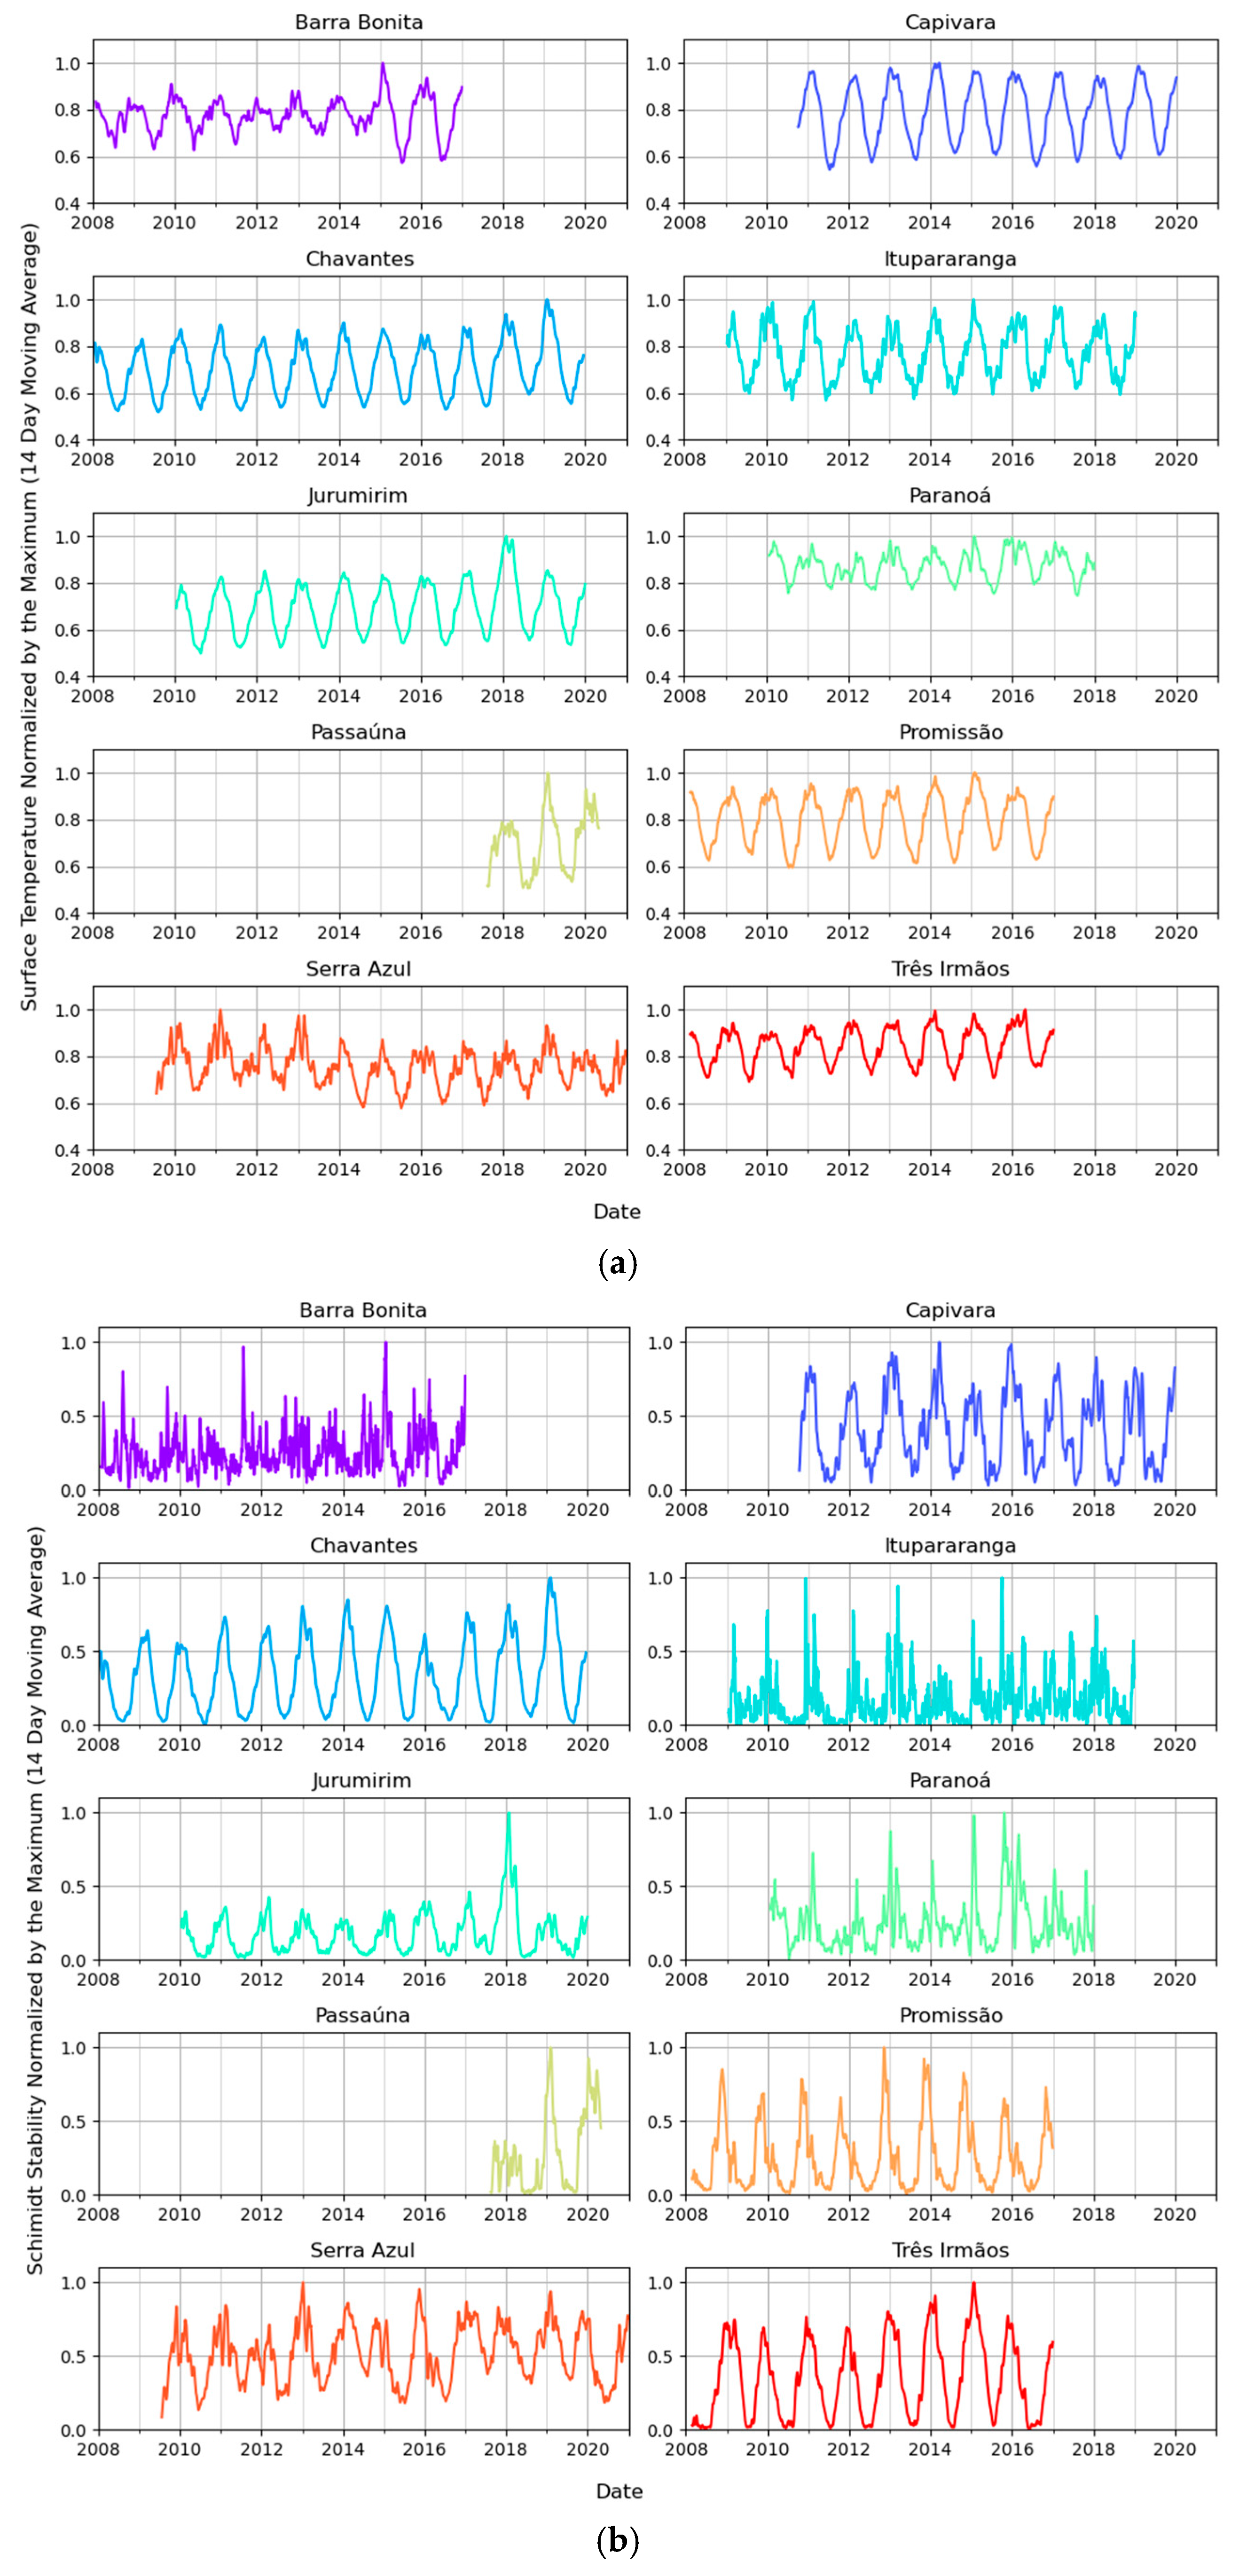
Seasonal variation in surface water temperature showed a regular cycle of increase (in summer) and decrease (in winter) in all reservoirs (Figure 5a). Schmidt Stability also showed this similar pattern, but with less regularity since its value is characteristic for each reservoir, even though St can be altered by precipitation and wind patterns (Figure 5b).
As was indicated in the previous graphs there was a relation between seasons and St values. In this regard, the statistical test (ANOVA-one way) has shown significant differences in St results between wet (SPI-12 ≥ 0.5) and dry (SPI-12 < 0.5) periods for all reservoirs in summer (Table 5).

4. Discussion

4.1. Impacts of Drought Periods on the Management of Reservoirs

The application of SPI-12 analysis for drought periods identification was useful for multipurpose reservoirs, especially where water level fluctuation was correlated to dam operation, due to hydropower generation as well as the existence of cascade reservoirs along the same river. Although there are other drought indexes that consider hydrological parameters directly, multiple variables or inputs are needed for calculations [24]. In addition, the SPI application has some advantages such as the availability of code to run the index free, the low input variables, and how daily data is not required. These advantages facilitate the adoption of SPI by the managers of the hydropower private companies, water utility companies, and governmental agencies. In addition, the low data requirements for SPI computation permit the application of this index even in places with low temporal resolution for monitoring data availability.
Despite the low frequency of time with drought period occurrence, a frequency of extreme drought periods of 6.0% and 4.6% created serious problems for water security. When the drought period persists for more than one year, the water supply systems are severely impacted. The southeast of Brazil faced a severe drought in 2014 and 2015. Due to that event, Serra Azul reservoir, which supplies water for the metropolitan region of Belo Horizonte, experienced a significant decrease in water level. For this period, drinking water had to be supplied by other sources and emergency measures cost more than US$ 32 million [18]. The annual average rainfall in the Itupararanga basin in 2014 was over ⅔ of its long-term annual value (1572 mm). As a consequence, the dam operator adopted a strategy to reduce the outflow, which eventually increased the residence time (453 days) to maintain regular hydropower generation and drinking water supply, yet even so the reservoir water level saw a significant decrease in 2014 [5]. South Brazil also had an exceptional drought period, during which a water emergency was declared from 2020 to 2022. The metropolitan region of Curitiba must adopt water rationing measures and some alternative measures with high costs involved [43].
During a water emergency related to a drought occurrence, the alterations on reservoirs’ thermal regime, which have implications for water quality, are not considered as the main subject of management actions. These implications should be monitored since during low water levels related to drought periods, concentrations of chlorophyll can increase, with an occurrence of cyanobacterial blooms (Cylindrospermopsis raciborskii) as previous study pointed out [44]. In addition, drought periods with lower water levels and intensified near-bed mixing can increase internal loading, which is an important factor for phytoplankton growth in the lacustrine zone of the reservoirs [45].

4.2. Effects of Drought on Reservoirs’ Thermal Stability

The reservoir stratification can be modified by drought in three different ways: change the magnitude of St value in comparison to wet periods, alteration of the stratification duration [5,18], and modification of the period of time of the stratification occurrence [4]. Stratification is promoted by conditions often arising during droughts, usually related to an increase in temperature, and this condition can increase the incidence and persistence of stratification and harmful algal blooms [3,46,47]. Temperature increases and increased stratification can also result in lower dissolved oxygen, especially in the hypolimnion of lakes and reservoirs [48]. Itupararanga is the most stable reservoir in drought periods, especially when there are extreme and exceptional droughts independent of wind speed (Figure 4c). The findings of this study suggest that distinct behavior (Figure 3) may also be connected to morphometric and morphology characteristics, since the reservoirs Jurumirim, Chavantes, and Capivara are long, dendritic, and polymitic. Jurumim and Capivara have similar behaviors, but Capivara’s mixing is characterized by lower temperatures than Jurumirim while Chavantes shows stronger stratifications. Jurumirim and Capivara appear to transfer temperature into greater depths, since they have lower maximum depths than Chavantes. Also, Chavantes may have reduced proportional influence of external forcings and less proportional evaporation, since its surface area is lower, and its maximum depth is higher than the other two making it more difficult to warm in temperature at greater depths (Table 1 and Figure 3). In general, drought periods include stratification periods, but not necessarily the strongest ones, even though it can happen (e.g., Chavantes in mid-2018). Accordingly, Jurumirim is the most unstable (has the weakest stratifications, lower Schmidt) followed by Capivara. Chavantes is the most stable when comparing to Jurumirim and Capivara (Figure 5b).
The significant difference between drought and wet periods in St values for all the reservoirs in the summer indicated that there is an alteration in thermal regime during drought periods in this season. In addition, most of the studied reservoirs have higher St mean values during drought periods (Barra Bonita, Chavantes, Promissão, Serra Azul, Três Irmãos, Passaúna, and Paranoá reservoirs). However, environmental factors such as wind intensity can affect mixing during drought periods as seems to occur in the Itupararanga, Capivara, and Jurumirim reservoirs.

5. Conclusions

This study contemplated an integrated preliminary analysis of ten multipurpose reservoirs, including water supply in some cases, located in different places of Brazil. Such analysis was carried out focusing on drought periods, which are classified by SPI-12 index to verify possible similarities in their behavior. All reservoirs, except Passaúna and Paranoá, faced extreme drought during the analyzed periods. The behavior of the reservoirs was simulated using a unidimensional hydrodynamic model for the periods of data availability for each reservoir.
It became clear that drought periods alter the thermal regime depending on the season and the reservoirs’ characteristics such as morphometry. This study has identified alterations in thermal regimes during drought periods in the summer. Additionally, external factors (e.g., wind intensity and rain) may influence reservoirs’ mixing during drought periods.

Author Contributions

Conceptualization J.A.R., L.M.V.S., C.C.B., A.R.P. and B.P.S.D.; methodology, J.A.R., J.M.C., L.M.V.S., C.C.B., A.R.P. and B.P.S.D.; formal analysis, J.A.R., J.M.C., L.M.V.S., C.C.B., A.R.P. and B.P.S.D.; writing—original draft preparation, J.A.R., J.M.C., L.M.V.S., C.C.B., A.R.P. and B.P.S.D.; writing—review and editing, T.B. and M.M.; supervision, S.K., T.B. and J.R.S.M. All authors have read and agreed to the published version of the manuscript.

Funding

This research received no external funding.

Data Availability Statement

The data presented in this study are available on request from the authors.

Acknowledgments

To CAPES or CNPq for the scholarships granted to part of the team. To Federal University of Paraná for the publication funding (Edital n. 05/2022 Pesquisa/PRPPG/UFPR). To related projects and fundings (e.g., Mudak: Passauna research was funded by the German Federal Ministry of Education and Research within Grant 02WGR1431A and supported by the sanitation company SANEPAR). To CAESB (Environmental Sanitation Company of the Federal District) for providing monitored temperature data of the Paranoá Reservoir. Alice Rocha Pereira acknowledges the scholarship granted by CAPES-ANA. Tobias Bleninger acknowledges the productivity stipend from the National Council for Scientific and Technological Development—CNPq, grant n. 308758/2017-0, call 12/2017. Michael Mannich acknowledges the productivity stipend from the National Council for Scientific and Technological Development—CNPq, grant no. 308744/2021-7, call 04/2021. C.C. Barbosa gives thanks for the support provided by the NSF EPSCoR Track 2 RII grant (EPS-2019528).

Conflicts of Interest

The authors declare no conflict of interest. The funders had no role in the design of the study, in the collection, analysis, or interpretation of data, in the writing of the manuscript, or in the decision to publish the results.

References

  1. Blenckner, T. A conceptual model of climate-related effects on lake ecosystems. Hydrobiologia 2005, 533, 1–14. [Google Scholar] [CrossRef]
  2. Liu, M.; Zhang, Y.; Shi, K.; Zhang, Y.; Zhou, Y.; Zhu, M.; Zhu, G.; Wu, Z.; Liu, M. Effects of rainfall on thermal stratification and dissolved oxygen in a deep drinking water reservoir. Hydrol. Process. 2020, 34, 3387–3399. [Google Scholar] [CrossRef]
  3. Calderó-Pascual, M.; de Eyto, E.; Jennings, E.; Dillane, M.; Andersen, M.R.; Kelly, S.; Wilson, H.L.; McCarthy, V. Effects of Consecutive Extreme Weather Events on a Temperate Dystrophic Lake: A Detailed Insight into Physical, Chemical and Biological Responses. Water 2020, 12, 1411. [Google Scholar] [CrossRef]
  4. Mullin, C.A.; Kirchhoff, C.J.; Wang, G.; Vlahos, P. Future projections of water temperature and thermal stratification in Connecticut reservoirs and possible implications for cyanobacteria. Water Resour. Res. 2020, 56, e2020WR027185. [Google Scholar] [CrossRef]
  5. Barbosa, C.C.; Calijuri, M.d.C.; Santos, A.C.A.d.; Ladwig, R.; Oliveira, L.F.A.d.; Buarque, A.C.S. Future projections of water level and thermal regime changes of a multipurpose subtropical reservoir (Sao Paulo, Brazil). Sci. Total Environ. 2021, 770, 144741. [Google Scholar] [CrossRef]
  6. Janssen, A.B.G.; Hilt, S.; Kosten, S.; de Klein, J.J.M.; Paerl, H.W.; Van de Waal, D.B. Shifting states, shifting services: Linking regime shifts to changes in ecosystem services of shallow lakes. Freshw. Biol. 2020, 66, 1–12. [Google Scholar] [CrossRef]
  7. Vogt, J.V.; Naumann, G.; Masante, D.; Spinoni, J.; Cammalleri, C.; Erian, W.; Pischke, F.; Pulwarty, R.; Barbosa, P. Drought Risk Assessment. A Conceptual Framework; EUR 29464 EN; European Union: Luxembourg, 2018. [Google Scholar] [CrossRef]
  8. Brazil Ministry of the Environment and Climate Change. Brazil: 6th National Report to the Convention on Biological Diversity; Biodiversity Series 55; MMA: Brasília, Brazil, 2023; 1082p. [Google Scholar]
  9. Marengo, J.A.; Cunha, A.P.; Cuartas, L.A.; Deusdará Leal, K.R.; Broedel, E.; Seluchi, M.E.; Michelin, C.M.; De Praga Baião, C.F.; Chuchón Ângulo, E.; Almeida, E.K.; et al. Extreme Drought in the Brazilian Pantanal in 2019–2020: Characterization, Causes, and Impacts. Front. Water 2021, 3, 639204. [Google Scholar] [CrossRef]
  10. Islam, T.; Ryan, J. Hazard Mitigation in Emergency Management; Butterworth-Heinemann Elsevier Inc.: Oxford, UK, 2016. [Google Scholar] [CrossRef]
  11. Kchouk, S.; Melsen, L.A.; Walker, D.W.; van Oel, P.R. A review of drought indices: Predominance of drivers over impacts and the importance of local context. Nat. Hazards Earth Syst. Sci. 2021. [Google Scholar] [CrossRef]
  12. Kumanlioglu, A.A. Characterizing meteorological and hydrological droughts: A case study of the Gediz River Basin, Turkey. Meteorol. Appl. 2020, 27, e1857. [Google Scholar] [CrossRef] [Green Version]
  13. Wang, Q.; Zhang, R.; Qi, J.; Zeng, J.; Wu, J.; Shui, W.; Wu, X.; Li, J. An improved daily standardized precipitation index dataset for mainland China from 1961 to 2018. Sci. Data 2022, 9, 124. [Google Scholar] [CrossRef]
  14. Salimi, H.; Asadi, E.; Darbandi, S. Meteorological and hydrological drought monitoring using several drought indices. Appl. Water Sci. 2021, 11, 11. [Google Scholar] [CrossRef]
  15. Mckee, T.B.; Doesken, N.J.; Kleist, J. The Relationship of Drought Frequency and Duration to Time Scales. In Proceedings of the 8th Conference on Applied Climatology, Anaheim, CA, USA, 17–23 January 1993; American Meteorological Society: Boston, MA, USA, 1993. [Google Scholar]
  16. Samuel, J.; Sutanto, S.J.; Fredrik Wetterhall, F.; Van Lanen, H.A.J. Hydrological drought forecasts outperform meteorological drought forecasts. Environ. Res. Lett. 2020, 15, 8. [Google Scholar] [CrossRef]
  17. Cunha, A.P.M.A.; Zeri, M.; Deusdará Leal, K.; Costa, L.; Cuartas, L.A.; Marengo, J.A.; Tomasella, J.; Vieira, R.M.; Barbosa, A.A.; Cunningham, C.; et al. Extreme Drought Events over Brazil from 2011 to 2019. Atmosphere 2019, 10, 642. [Google Scholar] [CrossRef] [Green Version]
  18. Soares, L.M.V.; Silva, T.F.G.; Vinçon-Leite, B.; Eleutério, J.C.; De Lima, L.C.; Nascimento, N.O. Modelling drought impacts on the hydrodynamics of a tropical water supply reservoir. Inland Waters 2019, 9, 422–437. [Google Scholar] [CrossRef]
  19. Hadley, K.R.; Paterson, A.M.; Stainsby, E.A.; Michelutti, N.; Yao, H.; Rusak, J.A.; Ingram, R.; McConnell, C.; Smol, J.P. Climate warming alters thermal stability but not stratification phenology in a small north-temperate lake. Hydrol. Process. 2014, 28, 6309–6319. [Google Scholar] [CrossRef]
  20. Read, J.S.; Winslow, L.A.; Hansen, G.J.A.; Hoek, J.V.D.; Hanson, P.C.; Bruce, L.C.; Markfortf, C.D. Simulating 2368 temperate lakes reveals weak coherence in stratification phenology. Ecol. Model. 2014, 291, 142–150. [Google Scholar] [CrossRef] [Green Version]
  21. Hallnan, R.; Saito, L.; Busby, D.; Tyler, S. Modeling Shasta Reservoir Water-Temperature Response to the 2015 Drought and Response under Future Climate Change. J. Water Resour. Plan. Manag. 2020, 146, 5. [Google Scholar] [CrossRef]
  22. Köppen, W. Climatología: Um Estudio de los Climas de La Tierra [Climatology: A Study of Climates of the Earth]; Fondo de Cultura Económica: Mexico City, Mexico, 1948. [Google Scholar]
  23. Beguería, S.; Vicente-Serrano, S.M. SPEI: Calculation of the Standardised Precipitation-Evapotranspiration Index, R Package Version 1.7; 2017. Available online: https://CRAN.Rproject.org/package=SPEI (accessed on 15 February 2021).
  24. World Meteorological Organization (WMO); Global Water Partnership (GWP). Handbook of Drought Indicators and Indices; Svoboda, M., Fuchs, B.A., Eds.; Integrated Drought Management Programme (IDMP), Integrated Drought Management Tools and Guidelines Series 2; World Meteorological Organization and Global Water Partnership: Geneva, Switzerland, 2016. [Google Scholar]
  25. Instituto Nacional de Meteorologia (INMET). Automatic and Conventional Monitoring Stations. 2022. Available online: http//www.inmet.gov.br (accessed on 15 March 2021).
  26. Hipsey, M.R.; Bruce, L.C.; Boon, C.; Busch, B.; Carey, C.C.; Hamilton, D.P.; Hanson, P.C.; Read, J.S.; Sousa, E.D.; Weber, M.; et al. A General Lake Model (GLM 3.0) for linking with high-frequency sensor data from the Global Lake Ecological Observatory Network (GLEON). Geosci. Model Dev 2019, 12, 473–523. [Google Scholar] [CrossRef] [Green Version]
  27. Mesman, J.P.; Ayala, A.I.; Adrian, R.; Eyto, E.D.; Frassl, M.A.; Goyette, S.; Kasparian, J.; Perroud, M.; Stelzer, J.A.A.; Pierson, D.C.; et al. Performance of one-dimensional hydrodynamic lake models during short-term extreme weather events. Environ. Model. Softw. 2020, 133, 104852. [Google Scholar] [CrossRef]
  28. Agência Nacional De Águas—ANA. Crise da água. Conjuntura dos Recursos Hídricos. 2017, Cap. 5, 39p. Available online: http://conjuntura.ana.gov.br/ (accessed on 3 February 2021).
  29. CETESB—Environmental Company of São Paulo State. 2021. Available online: https://cetesb.sp.gov.br/ (accessed on 23 January 2021).
  30. CEB—Energy Company of Brasilia. 2021. Available online: https://www.ceb.com.br/ (accessed on 15 March 2021).
  31. SANEPAR—Sanitation Company of Paraná. 2022. Available online: https://site.sanepar.com.br/ (accessed on 5 January 2022).
  32. Soares, L.M.V.; Calijuri, M.d.C.; das Graças Silva, T.F.; de Moraes Novo, E.M.L.; Cairo, C.T.; Barbosa, C.C.F. A parameterization strategy for hydrodynamic modelling of a cascade of poorly monitored reservoirs in Brazil. Environ. Model. Softw. 2020, 134, 104803. [Google Scholar] [CrossRef]
  33. Fernandes, C.V.S.; Bleninger, T.B.; Kishi, R.T.; Paula, E.V.; Ferreira, D.M.; Nowatski, A.; Pereira, G.H.A.; Bernardo, J.W.Y. RT-SP2-02: Modelagem da Qualidade da Água dos rios de Domínio da União e seus Reservatórios na UGRH Paranapanema, para as Cenarizações nos Horizontes de Planejamento do Prognóstico na UGRH Paranapanema; Research Report; UFPR: Curitiba, Brazil, 2020. [Google Scholar]
  34. Sales, G.G.N. Water Quality Modeling in a Subtropical Water Supply Reservoir. Master’s Thesis, Universidade Federal do Paraná, Setor de Tecnologia, Programa de Pós-Graduação em Engenharia Ambiental, Curitiba, Brazil, 2020. [Google Scholar]
  35. Winslow, L.; Read, J.; Woolway, R.; Brentrup, J.; Leach, T.; Zwart, J.; Albers, S.; Collinge, D. rLakeAnalyzer: Lake Physics Tools, R Package Version 1.11.4. 2018. Available online: https://cran.r-project.org/package=rLakeAnalyzer (accessed on 17 July 2020).
  36. Idso, S. On the concept of lake stability. Limnol. Oceanogr. 1973, 18, 681–683. [Google Scholar] [CrossRef]
  37. Imberger, J.; John, C.; Patterson, J.C. Physical Limnology. In Advances in Applied Mechanics; John, W., Theodore, H., Wu, Y., Eds.; Elsevier: Amsterdam, The Netherlands, 1989; Volume 27, pp. 303–475. ISSN 0065-2156. [Google Scholar] [CrossRef]
  38. Read, J.S.; Hamilton, D.P.; Jones, I.D.; Muraoka, K.; Winslow, L.A.; Kroiss, R.; Wu, C.H.; Gaiser, E. Derivation of lake mixing and stratification indices from high-resolution lake buoy data. Environ. Model. Softw. 2011, 26, 1325–1336. [Google Scholar] [CrossRef]
  39. Wu, B.; Wang, G.; Jiang, H.; Wang, J.; Liu, C. Impact of revised thermal stability on pollutant transport time in a deep reservoir. J. Hydrol. 2016, 535, 671–687. [Google Scholar] [CrossRef]
  40. Piccioni, F.; Casenave, C.; Lemaire, B.J.; Le Moigne, P.; Dubois, P.; Vinçon-Leite, B. The thermal response of small and shallow lakes to climate change: New insights from 3D hindcast modelling. Earth Syst. Dynam. 2021, 12, 439–456. [Google Scholar] [CrossRef]
  41. Ishikawa, M.; Gonzalez, W.; Golyjeswski, O.; Sales, G.; Rigotti, J.A.; Bleninger, T.; Mannich, M.; Lorke, A. Effects of dimensionality on the performance of hydrodynamic models for stratified lakes and reservoirs. Geosci. Model Dev. 2022, 15, 2197–2220. [Google Scholar] [CrossRef]
  42. Waskom, M.L. Seaborn: Statistical data visualization. J. Open Source Softw. 2021, 6, 3021. [Google Scholar] [CrossRef]
  43. Moreira, A.C.P.; Silveira, P.H.V.; Possetti, G.R.C.; Gonchorosky, J.C. Soluções inovadoras para o enfrentamento aos efeitos da crise hídrica na região metropolitana de Curitiba: Da lagoa de minas à hidrossemeadura de nuvens. In Proceedings of the 8th International Conference in Corporate, Curitiba, Brazil, 3–4 November 2021; pp. 1–10. [Google Scholar]
  44. Bouvy, M.; Nascimento, S.M.; Molica, R.J.R.; Ferreira, A.; Huszar, V.; Azevedo, S. Limnological features in Tapacura reservoir (northeast Brazil) during a severe drought. Hydrobiologia 2003, 493, 115–130. [Google Scholar] [CrossRef]
  45. Ishikawa, M.; Gurski, L.; Bleninger, T.; Rohr, H.; Wolf, N.; Lorke, A. Hydrodynamic Drivers of Nutrient and Phytoplankton Dynamics in a Subtropical Reservoir. Water 2022, 14, 1544. [Google Scholar] [CrossRef]
  46. Watanabe, F.; Rodrigues, T.; Bernardo, N.; Alcântara, E.; Imai, N. Drought can cause phytoplankton growth intensification in Barra Bonita reservoir. Model. Earth Syst. Environ. 2016, 2, 134. [Google Scholar] [CrossRef] [Green Version]
  47. Mosley, L.M. Drought impacts on the water quality of freshwater systems; review and integration. Earth-Sci. Rev. 2015, 140, 203–214. [Google Scholar] [CrossRef]
  48. Ladwig, R.; Hanson, P.C.; Dugan, H.A.; Carey, C.C.; Zhang, Y.; Shu, L.; Duffy, C.J.; Cobourn, K.M. Lake thermal structure drives interannual variability in summer anoxia dynamics in a eutrophic lake over 37 years. Hydrol. Earth Syst. Sci. 2021, 25, 1009–1032. [Google Scholar] [CrossRef]
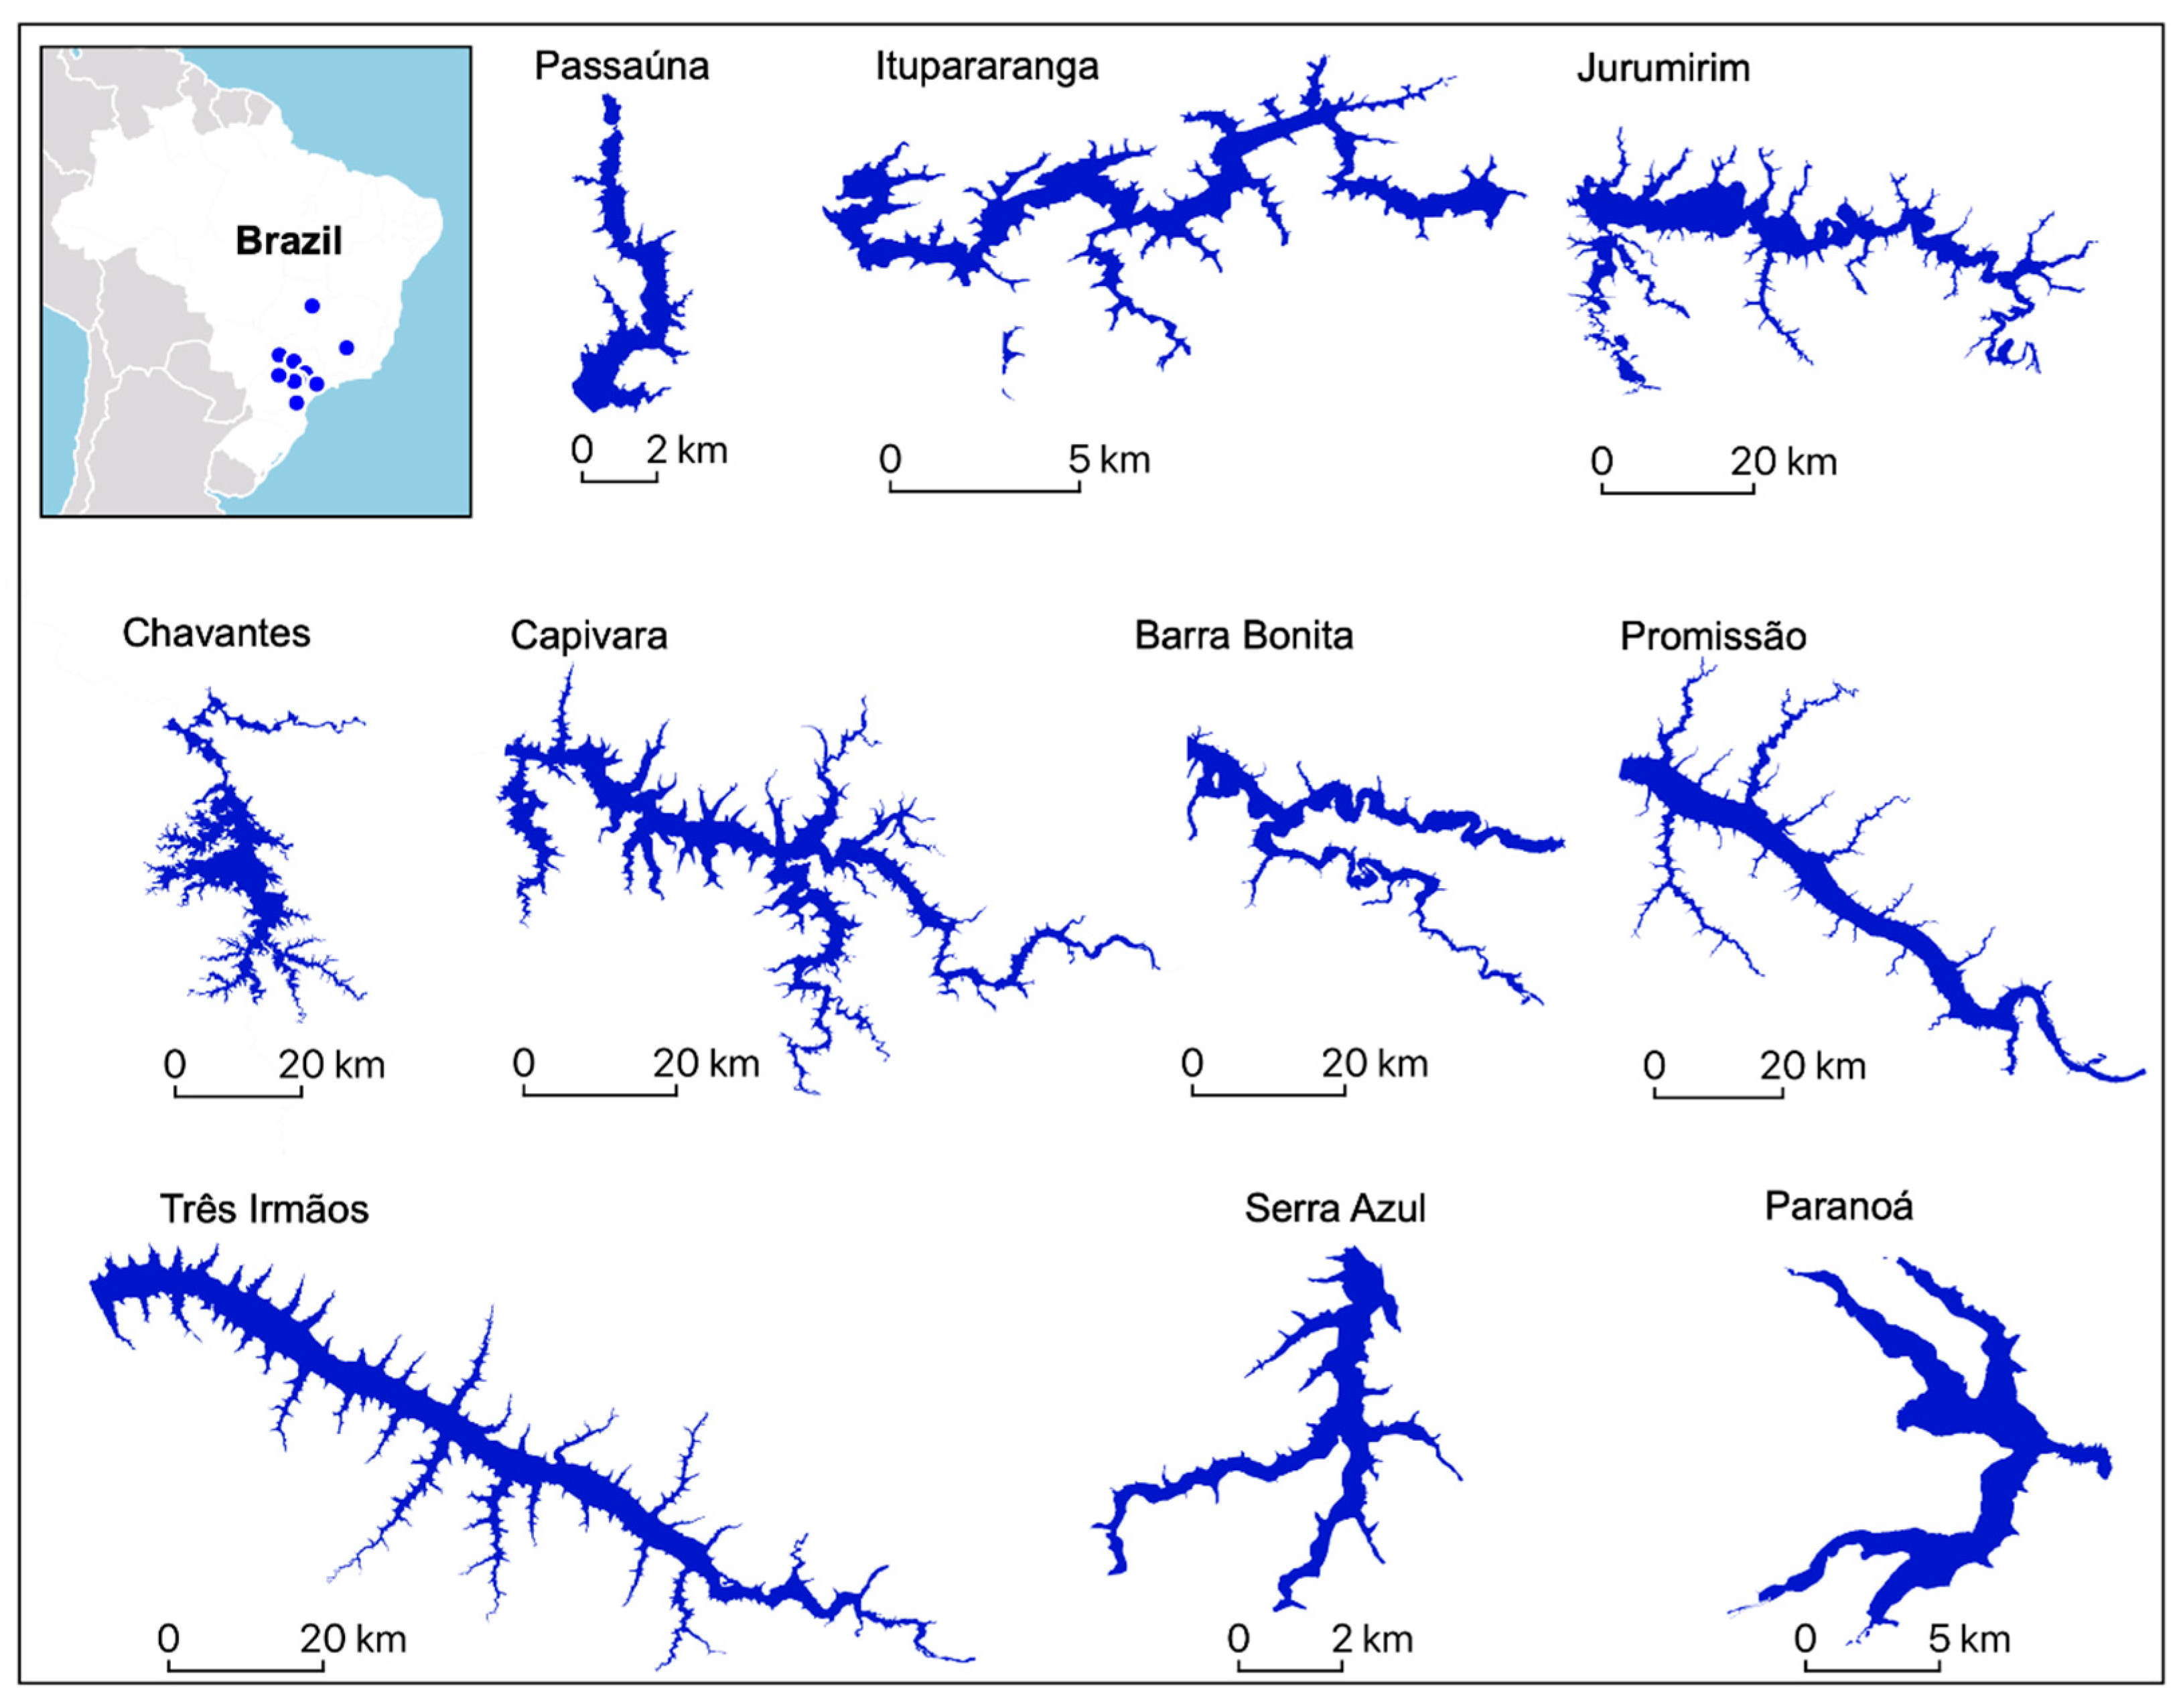
Figure 1. Study site locations and reservoir morphometries. The characteristics are described in Table 1.
Water 15 02877 g001
Figure 2. Histograms of relative frequencies of SPI-12 for each reservoir, according to drought categories: Abnormally Dry (D0), Moderate Drought (D1), Severe Drought (D2), Extreme Drought (D3), and Exceptional Drought (D4).
Water 15 02877 g002
Figure 3. Time-depth temperature contour graph from General Lake Model (GLM) simulated temperature for each reservoir: (a) Passaúna; (b) Itupararanga; (c) Jurumirim; (d) Chavantes; (e) Capivara; (f) Barra Bonita; (g) Promissão; (h) Três Irmãos; (i) Serra Azul; (j) Paranoá. Drought periods are highlighted with a dashed line (SPI-12 ≤ −0.5).
Water 15 02877 g003aWater 15 02877 g003bWater 15 02877 g003cWater 15 02877 g003dWater 15 02877 g003eWater 15 02877 g003f
Figure 4. Pair-grid diagrams of (a) Precipitation, (b) Water Level, and (c) Wind velocity versus Schmidt Stability, according to SPI-12 classification, from each reservoir.
Water 15 02877 g004aWater 15 02877 g004b
Figure 5. Seasonal variation of the Surface Temperature (a) and the Schmidt Stability (b) normalized by the maximum and expressed by a 14-day moving average along the years for each reservoir.
Water 15 02877 g005
Table 1. Characteristics of the reservoirs.
ReservoirClimate 1Main Use 2Max. Depth (m)Surface Area
(106 m2)
Total Volume (106 m3)Residence Time (Days)Thermal Regime Classification
PassaúnaCfbWS16.59.059292Polymictic
ItupararangaCwaWS, HP23.029.0286245Polymictic
JurumirimCfaHP39.5485.07900346Polymictic
ChavantesCfaHP75.5419.09400284Polymictic
CapivaraCfaHP56.0623.711,70095Polymictic
Barra BonitaCwaHP23.5226.0316091Polymictic
PromissãoCwaHP24.5522.08110141Warm monomictic
Três IrmãosCwaHP45.6654.011,460442Warm monomictic
Serra AzulCwaWS47.39.182373Warm monomictic
ParanoáAwWS, HP38.037.5498299Warm monomictic
Notes: 1 Cfb: Temperate oceanic; Cfa: Humid subtropical; Aw: Tropical savanna; Cwa: Dry-winter humid subtropical [22]. 2 WS: Drinking water supply; HP: Hydropower generation.
Table 2. Meteorological stations and available data periods.
ReservoirMeteorological Station (Code and Name—INMET [25])Altitude (masl)Latitude and Longitude
(Datum WGS-84)
Time Period (YYYY-MM)
Passaúna83842—Curitiba924−25.45, −49.231990-01–2021-01
Itupararanga83851—Sorocaba598−23.48, −47.432006-09–2018-12
JurumirimA725—Avaré654−23.21, −49.232006-09–2021-10
ChavantesA821—Joaquim Tavora522−23.13, −49.732006-11–2021-10
CapivaraA718—Rancharia350−22.66, −51.362006-09–2021-10
Barra BonitaA741—Barra Bonita534−22.47, −48.582008-04–2021-05
PromissãoA735—José Bonifácio408−21.09, −49.922007-09–2021-05
Três IrmãosA704—Três Lagoas329−20.78, −51.712001-09–2021-05
Serra AzulA535—Florestal754−19.89, −44.422008-06–2021-05
ParanoáA001—Brasília1161−15.79, −47.931990-01–2021-03
Table 3. Range of SPI values on each drought category following the U. S. Drought Monitor (2022).
CategoryRangeReference Color
W—Normal/WetSPI ≥ −0.5
D0—Abnormally Dry−0.7 < SPI < −0.5
D1—Moderate Drought−1.2 < SPI < −0.8
D2—Severe Drought−1.5 < SPI < −1.3
D3—Extreme Drought−1.9 < SPI < −1.6
D4—Exceptional DroughtSPI ≤ −2.00
Table 4. Simulation, calibration, and validation periods for each reservoir and model performance metric (root mean square error—RMSE) for water level and temperature.
ReservoirSimulation Period (YYYY-MM-DD)Calibration Period Validation Period (YYYY-MM-DD)RMSE
Water Level (m)Temperature (°C)
Passaúna2017-08-01/2020-04-302018-03-01/2019-02-280.351.02
Itupararanga2009-01-01/2019-03-312009-01-01/2013-12-310.631.30
2014-01-01/2019-03-310.451.34
Jurumirim2009-01-01/2019-12-162011-03-01/2011-11-010.001.37
Chavantes2009-01-01/2019-12-162011-03-01/2011-11-010.001.37
Capivara2009-01-01/2019-12-162011-03-01/2011-11-010.000.96
Barra Bonita2008-01-15/2016-12-312008-01-15/2012-12-310.931.79
2013-01-29/2016-12-310.891.82
Promissão2008-12-02/2016-12-312008-02-12/2012-12-310.231.91
2013-01-28/2016-12-310.211.66
Três Irmãos2008-02-12/2016-12-312008-02-12/2012-12-310.511.37
2013-02-26/2016-12-312.241.46
Serra Azul2009-01-01/2016-12-312009-01-01/2012-12-310.741.33
2013-01-29/2016-12-310.742.06
Paranoá2010-01-11/2017-12-312010-01-11/2017-12-310.291.09
Table 5. Schmidt Stability results of ANOVA one-way to test the significance between drought and normal/wet conditions for each reservoir and each season of the year. Significant p-values are shown in bold.
Reservoir 4 Seasons (Significance Test)
SummerAutumnWinterSpring
FpFpFpFp
Passaúna338.890.000251.370.00046.410.00026.760.000
Itupararanga6.820.0102.380.1241.300.2559.310.003
Jurumirim32.480.00010.880.00149.350.00012.030.001
Capivara65.870.00077.550.0000.600.43921.120.000
Chavantes161.090.0004.390.038122.690.00022.390.000
Barra Bonita24.510.0000.650.4225.190.0240.010.916
Promissão16.350.0000.120.7312.170.1435.630.019
Três Irmãos485.670.00062.640.0000.740.39212.750.000
Serra Azul5.300.022995.970.000841.300.000105.230.000
Paranoá62.100.0007.860.00625.710.0001.260.262
Disclaimer/Publisher’s Note: The statements, opinions and data contained in all publications are solely those of the individual author(s) and contributor(s) and not of MDPI and/or the editor(s). MDPI and/or the editor(s) disclaim responsibility for any injury to people or property resulting from any ideas, methods, instructions or products referred to in the content.