
Spatiotemporal Evolution and Nowcasting of the 2022 Yangtze River Mega-Flash Drought


Abstract

1. Introduction
2. Materials and Methods
2.1. ERA5 Reanalysis and CMA-GFS Nowcast Data
2.2. Three-Dimensional Meteorological Flash Drought Index
- (1)
- Extraction of one-dimensional flash drought events
- (2)
- Identification of three-dimensional flash drought events
2.3. Evaluation Metrics
3. Results and Discussion
4. Conclusions
Author Contributions
Funding
Data Availability Statement
Conflicts of Interest
References
- Yuan, X.; Wang, Y.; Ji, P.; Wu, P.; Sheffield, J.; Otkin, J.A. A global transition to flash droughts under climate change. Science 2023, 380, 187–191. [Google Scholar] [CrossRef] [PubMed]
- Zhang, Y.; You, Q.; Chen, C.; Li, X. Flash droughts in a typical humid and subtropical basin: A case study in the Gan River Basin, China. J. Hydrol. 2017, 551, 162–176. [Google Scholar] [CrossRef]
- Noguera, I.; Domínguez-Castro, F.; Vicente-Serrano, S.M. Characteristics and trends of flash droughts in Spain, 1961–2018. Ann. N. Y. Acad. Sci. 2020, 1472, 155–172. [Google Scholar] [CrossRef]
- Mahto, S.S.; Mishra, V. Dominance of summer monsoon flash droughts in India. Environ. Res. Lett. 2020, 15, 104061. [Google Scholar] [CrossRef]
- Otkin, J.A.; Anderson, M.C.; Hain, C.; Svoboda, M.; Johnson, D.; Mueller, R.; Tadesse, T.; Wardlow, B.; Brown, J. Assessing the evolution of soil moisture and vegetation conditions during the 2012 United States flash drought. Agric. For. Meteorol. 2016, 218, 230–242. [Google Scholar] [CrossRef]
- Oh, H.; Kim, G.U.; Chu, J.E.; Lee, K.; Jeong, J.Y. The record-breaking 2022 long-lasting marine heatwaves in the East China Sea. Environ. Res. Lett. 2023, 18, 064015. [Google Scholar] [CrossRef]
- Ma, M.; Qu, Y.; Lyu, J.; Zhang, X.; Su, Z.; Gao, H.; Yang, X.; Chen, X.; Jiang, T.; Zhang, J.; et al. The 2022 extreme drought in the Yangtze River Basin: Characteristics, causes and response strategies. River 2022, 1, 162–171. [Google Scholar] [CrossRef]
- Ma, F.; Yuan, X. When will the unprecedented 2022 summer heat waves in Yangtze River basin become normal in a warming climate? Geophys. Res. Lett. 2023, 50, e2022GL101946. [Google Scholar] [CrossRef]
- Yuan, Y.; Liao, Z.; Zhou, B.; Zhai, P. Unprecedented Hot Extremes Observed in City Clusters in China during Summer 2022. J. Meteorolog. Res. 2023, 37, 141–148. [Google Scholar] [CrossRef]
- Wang, Z.; Luo, H.; Yang, S. Different mechanisms for the extremely hot central-eastern China in July–August 2022 from a Eurasian large-scale circulation perspective. Environ. Res. Lett. 2023, 18, 024023. [Google Scholar] [CrossRef]
- Mishra, A.K.; Singh, V.P. A review of drought concepts. J. Hydrol. 2010, 391, 202–216. [Google Scholar] [CrossRef]
- Yuan, X.; Wang, L.; Wu, P.; Ji, P.; Sheffield, J.; Zhang, M. Anthropogenic shift towards higher risk of flash drought over China. Nat. Commun. 2019, 10, 4661. [Google Scholar] [CrossRef] [PubMed]
- Christian, J.I.; Basara, J.B.; Hunt, E.D.; Otkin, J.A.; Furtado, J.C.; Mishra, V.; Xiao, X.; Randall, R.M. Global distribution, trends, and drivers of flash drought occurrence. Nat. Commun. 2021, 12, 6330. [Google Scholar] [CrossRef]
- Otkin, J.A.; Zhong, Y.; Hunt, E.D.; Basara, J.; Svoboda, M.; Anderson, M.C.; Hain, C. Assessing the evolution of soil moisture and vegetation conditions during a flash drought–flash recovery sequence over the South-Central United States. J. Hydrol. 2019, 20, 549–562. [Google Scholar] [CrossRef]
- Fu, K.; Wang, K. Quantifying flash droughts over China from 1980 to 2017. J. Geophys. Res.-Atmos. 2022, 127, e2022JD037152. [Google Scholar] [CrossRef]
- Noguera, I.; Domínguez-Castro, F.; Vicente-Serrano, S.M. Flash drought response to precipitation and atmospheric evaporative demand in Spain. Atmosphere 2021, 12, 165. [Google Scholar] [CrossRef]
- Parker, T.; Gallant, A.; Hobbins, M.; Hoffmann, D. Flash drought in Australia and its relationship to evaporative demand. Environ. Res. Lett. 2021, 16, 064033. [Google Scholar] [CrossRef]
- Yuan, X.; Ma, Z.; Pan, M.; Shi, C. Microwave remote sensing of short-term droughts during crop growing seasons. Geophys. Res. Lett. 2015, 42, 4394–4401. [Google Scholar] [CrossRef]
- Zhou, S.; Yuan, X. Acceleration of the onset speeds of heat waves over East China by upwind flash droughts. J. Geophys. Res-Atmos. 2023, 128, e2022JD038072. [Google Scholar] [CrossRef]
- Li, J.; Wang, Z.; Wu, X.; Chen, J.; Guo, S.; Zhang, Z. A new framework for tracking flash drought events in space and time. Catena 2020, 194, 104763. [Google Scholar] [CrossRef]
- Li, J.; Wu, C.; Xia, C.A.; Yeh, P.J.F.; Chen, B.; Lv, W.; Hu, B.X. A voxel-based three-dimensional framework for flash drought identification in space and time. J. Hydrol. 2022, 608, 127568. [Google Scholar] [CrossRef]
- Yuan, X.; Wood, E.F. Multimodel seasonal forecasting of global drought onset. Geophys. Res. Lett. 2013, 40, 4900–4905. [Google Scholar] [CrossRef]
- Zhu, E.; Yuan, X.; Wu, P. Skillful decadal prediction of droughts over large-scale river basins across the globe. Geophys. Res. Lett. 2020, 47, e2020GL089738. [Google Scholar] [CrossRef]
- Mo, K.C.; Lettenmaier, D.P. Prediction of flash droughts over the United States. J. Hydrol. 2020, 21, 1793–1810. [Google Scholar] [CrossRef]
- Ma, R.; Yuan, X. Subseasonal Ensemble Prediction of Flash Droughts over China. J. Hydrometeorol. 2023, 24, 897–910. [Google Scholar] [CrossRef]
- Chen, D.; Shen, X. Recent progress on GRAPES research and application. J. Appl. Meteor. Sci. 2006, 17, 773–777. (In Chinese) [Google Scholar]
- Chen, J.; Li, X. The review of 10 years development of the GRAPES global/regional ensemble prediction. Adv. Meteor. Sci. Technol. 2020, 10, 9–18. (In Chinese) [Google Scholar]
- Hersbach, H.; Bell, B.; Berrisford, P.; Hirahara, S.; Horányi, A.; Muñoz-Sabater, J.; Nicolas, J.; Peubey, C.; Radu, R.; Schepers, D.; et al. The ERA5 global reanalysis. Q. J. R. Meteorolog. Soc. 2020, 146, 1999–2049. [Google Scholar] [CrossRef]
- Zhang, L.; Liu, Y.; Liu, Y.; Gong, J.; Lu, H.; Jin, Z.; Tian, W.; Liu, G.; Zhou, B.; Zhao, B. The operational global four-dimensional variational data assimilation system at the China Meteorological Administration. Q. J. R. Meteorolog. Soc. 2019, 145, 1882–1896. [Google Scholar] [CrossRef]
- Fan, K.; Wang, H.; Choi, Y.J. A physically-based statistical forecast model for the middle-lower reaches of the Yangtze River Valley summer rainfall. Chin. Sci. Bull. 2008, 53, 602–609. [Google Scholar] [CrossRef]
- Corzo Perez, G.A.; Van Huijgevoort, M.H.J.; Voß, F.; Van Lanen, H.A.J. On the spatio-temporal analysis of hydrological droughts from global hydrological models. Hydrol. Earth Syst. Sci. 2011, 15, 2963–2978. [Google Scholar] [CrossRef]
- Wang, Y.; Yuan, X. Land-atmosphere coupling speeds up flash drought onset. Sci. Total Environ. 2022, 851, 158109. [Google Scholar] [CrossRef] [PubMed]
- Wang, S.; Yuan, X.; Li, Y. Does a strong El Niño imply a higher predictability of extreme drought? Sci. Rep. 2017, 7, 40741. [Google Scholar] [CrossRef]
- Zeng, D.; Yuan, X.; Roundy, J.K. Effect of teleconnected land–atmosphere coupling on Northeast China persistent drought in spring–summer of 2017. J. Clim. 2019, 32, 7403–7420. [Google Scholar] [CrossRef]
- Ntona, M.M.; Busico, G.; Mastrocicco, M.; Kazakis, N. Modeling groundwater and surface water interaction: An overview of current status and future challenges. Sci. Total Environ. 2022, 846, 157355. [Google Scholar] [CrossRef]
- Patsialis, T.; Kougias, I.; Kazakis, N.; Theodossiou, N.; Droege, P. Supporting renewables’ penetration in remote areas through the transformation of non-powered dams. Energies 2016, 9, 1054. [Google Scholar] [CrossRef]
- Razzagh, S.; Sadeghfam, S.; Nadiri, A.A.; Busico, G.; Ntona, M.M.; Kazakis, N. Formulation of Shannon entropy model averaging for groundwater level prediction using artificial intelligence models. Int. J. Environ. Sci. Technol. 2021, 19, 6203–6220. [Google Scholar] [CrossRef]


| Drought Type | Frequency (Events) | Mean Duration (Pentads/Event) | Mean Intensity (%/Pentad/Event) |
|---|---|---|---|
| One-dimensional flash droughts | 17.2 | 4.92 | 27.57 |
| Three-dimensional flash droughts | 15.5 | 4.86 | 28.21 |
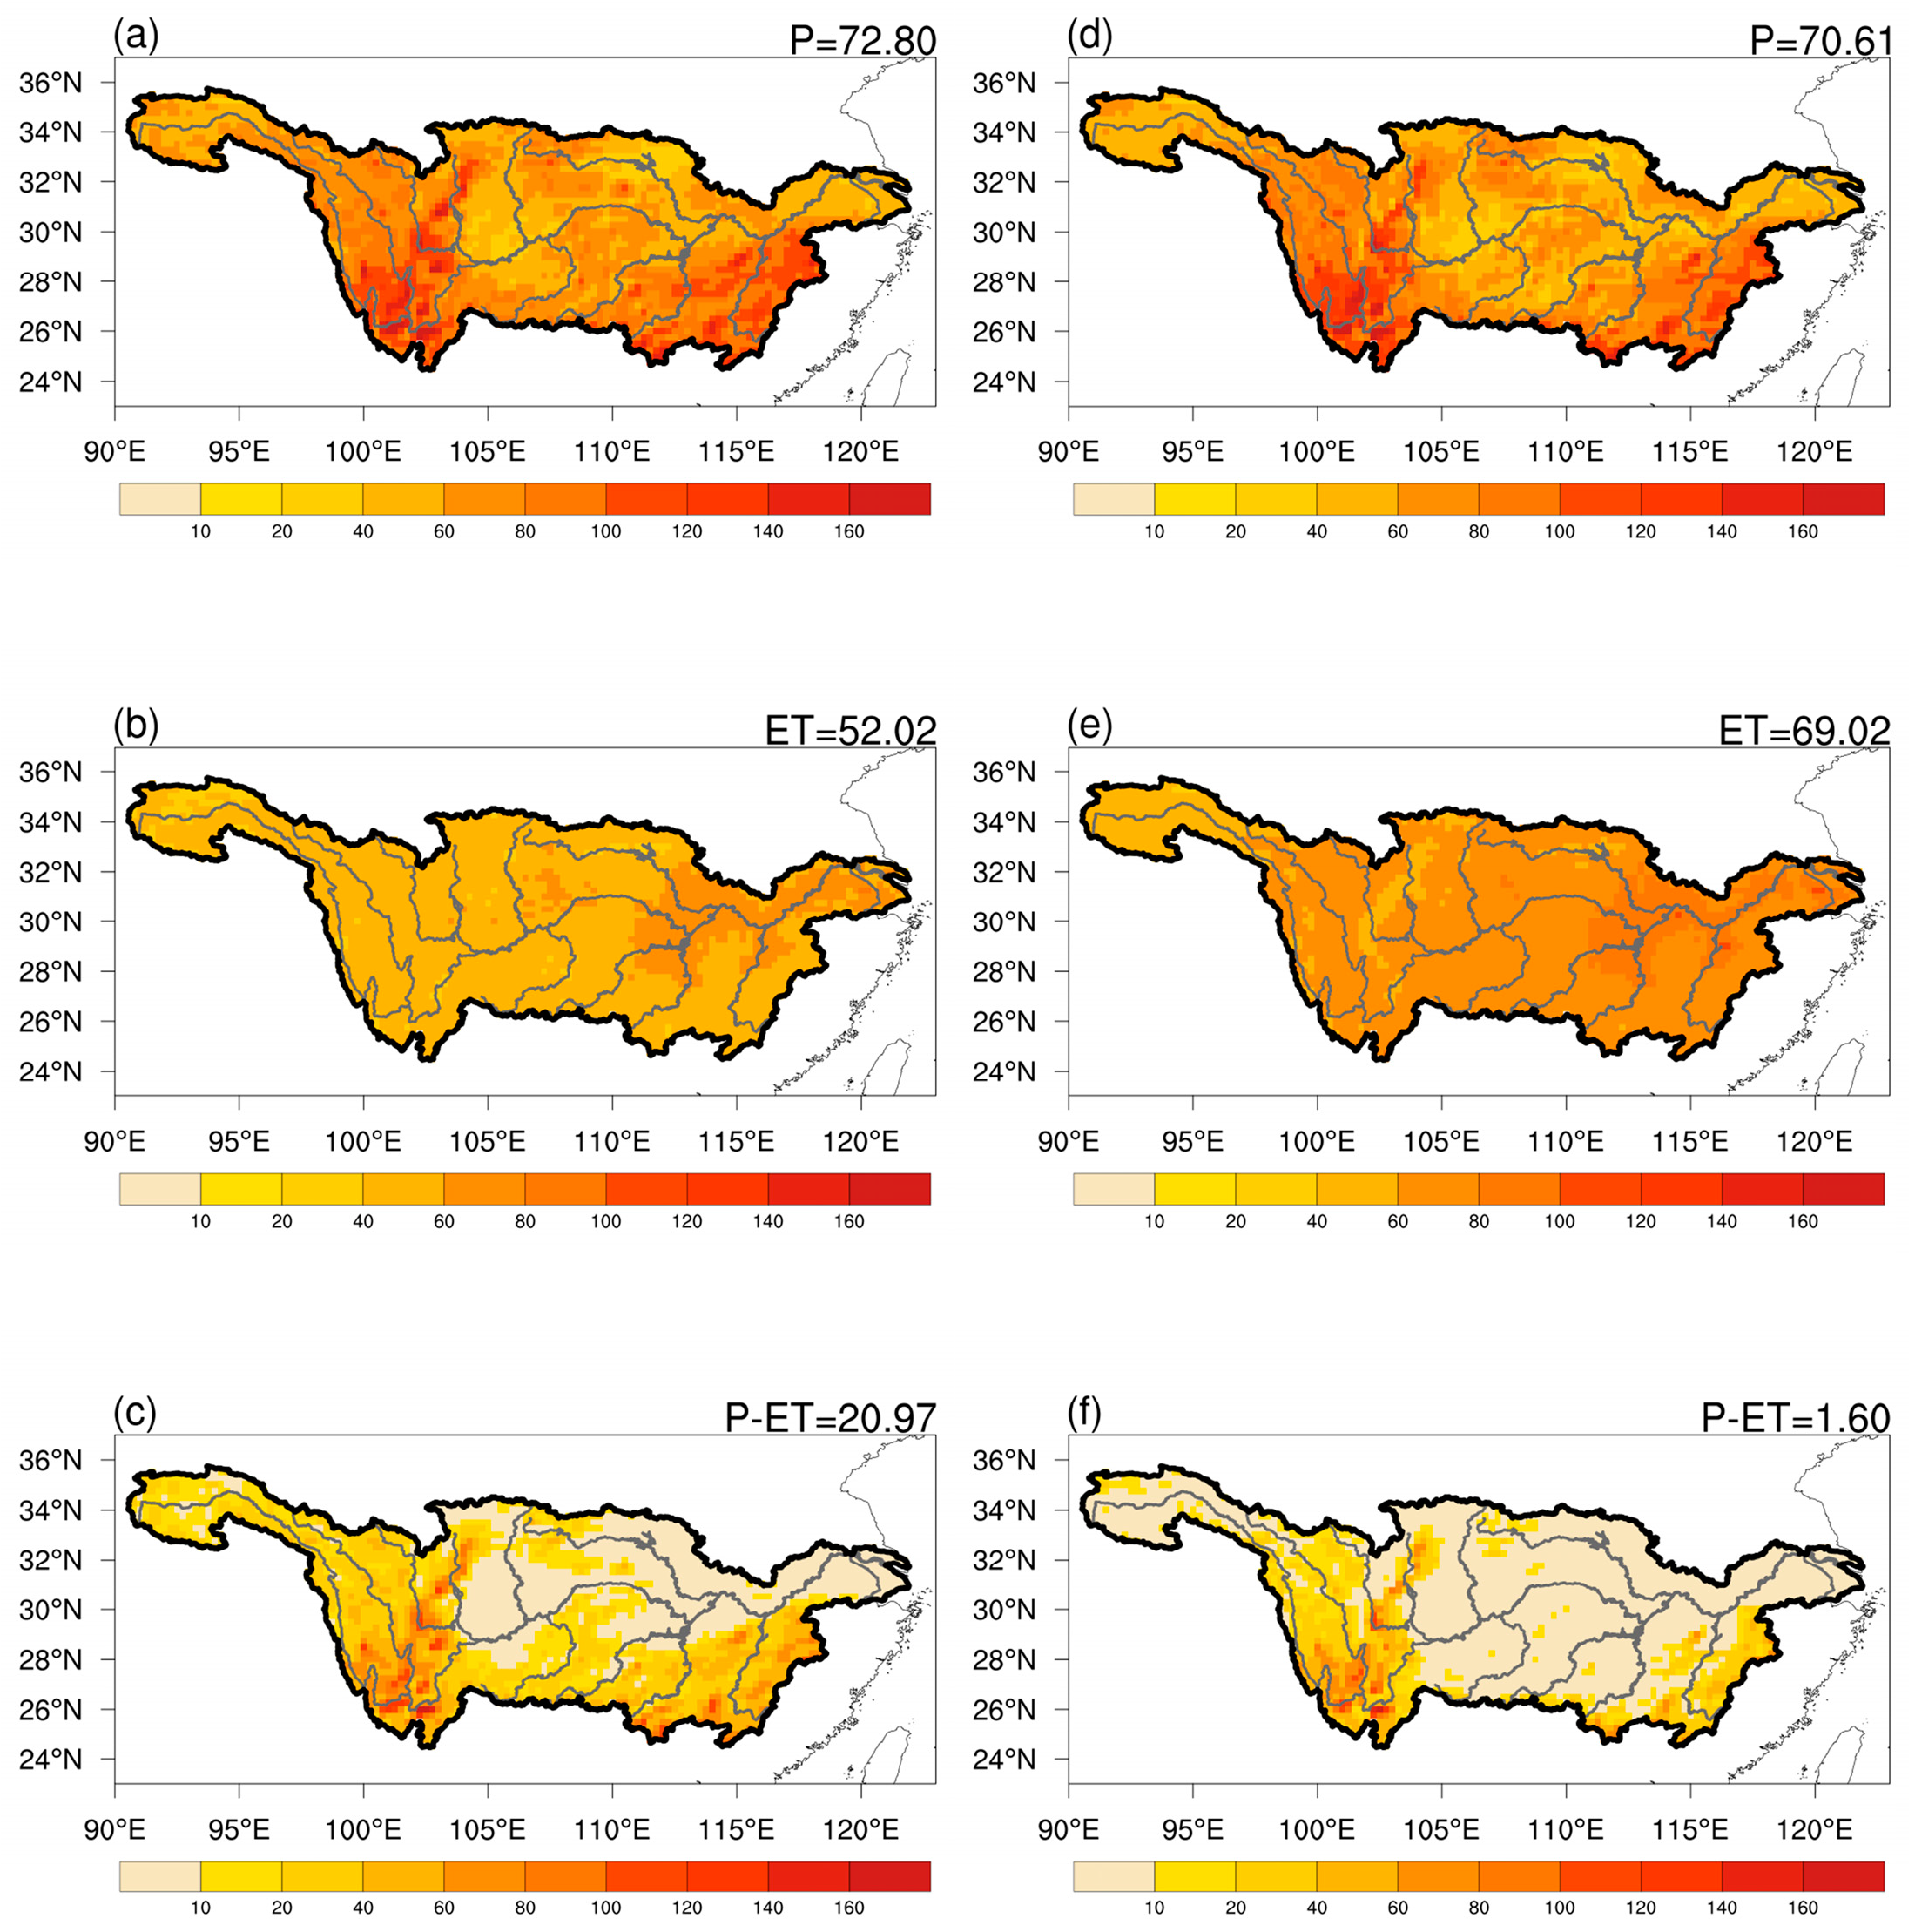
| Data Type | P (mm) | ET (mm) | P-ET (mm) |
|---|---|---|---|
| ERA5 reanalysis | 72.80 | 52.02 | 20.97 |
| CMA-GFS nowcasts | 70.61 | 69.02 | 1.60 |
Disclaimer/Publisher’s Note: The statements, opinions and data contained in all publications are solely those of the individual author(s) and contributor(s) and not of MDPI and/or the editor(s). MDPI and/or the editor(s) disclaim responsibility for any injury to people or property resulting from any ideas, methods, instructions or products referred to in the content. |
© 2023 by the authors. Licensee MDPI, Basel, Switzerland. This article is an open access article distributed under the terms and conditions of the Creative Commons Attribution (CC BY) license (https://creativecommons.org/licenses/by/4.0/).
Share and Cite
Liang, M.; Yuan, X.; Zhou, S.; Ma, Z. Spatiotemporal Evolution and Nowcasting of the 2022 Yangtze River Mega-Flash Drought. Water 2023, 15, 2744. https://doi.org/10.3390/w15152744
Liang M, Yuan X, Zhou S, Ma Z. Spatiotemporal Evolution and Nowcasting of the 2022 Yangtze River Mega-Flash Drought. Water. 2023; 15(15):2744. https://doi.org/10.3390/w15152744
Chicago/Turabian StyleLiang, Miaoling, Xing Yuan, Shiyu Zhou, and Zhanshan Ma. 2023. "Spatiotemporal Evolution and Nowcasting of the 2022 Yangtze River Mega-Flash Drought" Water 15, no. 15: 2744. https://doi.org/10.3390/w15152744
APA StyleLiang, M., Yuan, X., Zhou, S., & Ma, Z. (2023). Spatiotemporal Evolution and Nowcasting of the 2022 Yangtze River Mega-Flash Drought. Water, 15(15), 2744. https://doi.org/10.3390/w15152744