Article

Impacts of Different Gully Consolidation and Highland Protection Models on the Runoff and Sediment Yield in Small Watershed of the Chinese Loess Plateau—A Case Study of Fengbugou in Qingyang City of Gansu

1
School of Water and Environment, Chang’an University, Xi’an 710054, China
2
Key Laboratory of Subsurface Hydrology and Ecological Effects in Arid Region, Ministry of Education, Chang’an University, Xi’an 710054, China
3
Key Laboratory of Mine Geological Hazards Mechanism and Control, Ministry of Natural Resources, Xi’an 710054, China
4
College of Geological Engineering and Geomatics, Chang’an University, Xi’an 710054, China
5
Agricultural Engineering Department, Faculty of Agriculture, Mansoura University, Mansoura 35516, Egypt
6
Agricultural Engineering Department, Faculty of Agriculture, Cairo University, Giza 12613, Egypt
*
Author to whom correspondence should be addressed.
Water 2023, 15(15), 2764; https://doi.org/10.3390/w15152764
Submission received: 28 June 2023 / Revised: 26 July 2023 / Accepted: 28 July 2023 / Published: 30 July 2023
(This article belongs to the Special Issue Hydrological Simulation for Erosion and Infiltration)

Abstract

:
The Gully Consolidation and Highland Protection (GCHP) project is crucial in preventing gully erosion in the Loess Plateau. However, there are new problems after the completion of the GCHP project, such as secondary disasters caused by sudden changes in water flow paths. To study the impact of different GCHP measures on runoff and sediment production, we conducted a series of scouring experiments using the similarity principle, taking Fengbao Gully, Xifeng District, Qingyang City, Gansu Province, as a prototype. Moreover, three scenarios in the GCHP project (landfill (LT), nondrained terraced (NDT), and terrace with a drainage system (DT)) are established. Seasonal rainfall simulation experiments are conducted with a constant slope. The results showed that during summer rainfall, the 10 min runoff depth of LT is 67.83~276.03% higher than that of NDT. However, in spring and autumn, the runoff depth of NDT is 4.12~39.84% higher than LT’s. The sediment yield of LT is 0.06–5.58 times higher than that of NDT and 1.91–25.58 times higher than that of DT. The sediment yield of NDT is 0.46–4.02 times higher than that of LT and 2.27–23.93 times higher than that of DT, indicating that, under the same conditions, the effect of slope replacement with terraces for GCHP is better than that of gully head landfill in reducing soil erosion and secondary geological disasters. Furthermore, imperfect terrace construction can result in increased sediment yield. This study provides a scientific basis for the maintenance and later management of GCHP and helps implement soil and water conservation measures in similar regions worldwide.

1. Introduction

Gully erosion is a complex geomorphic process that occurs when water flows along slopes, cutting through erodible soil and weathered rock to form gullies [1]. Gully erosion severely impacts land resources and causes various environmental problems and geological hazards. Specifically, gully erosion can lead to land degradation, resulting in the loss of valuable land resources [2]. Additionally, the supply and quality of water resources may be affected, leading to floods and water pollution [3,4]. Furthermore, since gully erosion affects the water cycle of the land, it may also impact climate change [5]. Finally, gully erosion can lead to geological hazards such as landslides and debris flows [6]. As one of the world’s most severely eroded and ecologically fragile areas, the Loess Plateau has been a hotspot for researching erosion and its driving mechanisms. Statistics show that gully erosion accounts for 60–90% of the total sediment yield in the Loess Plateau agricultural areas [7]. The soil erosion rate in the gully region on the Loess Plateau is 6.83 × 10³ t·km2·a−1, and its average expansion rate is 0.6 m/a [8,9]. In this context, the Gully Consolidation and Highland Protection (GCHP) project has become a significant national project for controlling soil erosion in the Loess Plateau in the new era. If successful, it will significantly alleviate and control the expansion of heavily eroded gullies in the plateau area. Otherwise, it is easy to cause secondary geological disasters such as loess catastrophes, accelerating the plateau shrinkage. Therefore, studying the impact of the completion of the GCHP project on runoff and erosion can help to propose effective GCHP management models and prevention and control technology systems to address potential risks and has important practical significance for improving the ecological environment of the Loess region and achieving sustainable development of energy, food, and economy [10,11].
Several soil and water conservation measures have been adopted worldwide to secure life and property, agricultural production, and reduce soil erosion, including gully head landfill, check dams, terraces, vegetation cover, etc. [12,13,14]. The “GCHP project” was initiated in 2014 on the Dongzhi Plateau in Qingyang City, Gansu Province. This area is a significant part of the Loess Plateau, known for being China’s largest area with the thickest soil layer and excellent preservation. The Chinese government formulated an overall plan to protect and control the high plateau [15]. By the end of 2019, a total of 1.25 × 10⁶ ha of soil erosion had been controlled in Qingyang, accounting for 53.67% of the lost area. The total area of the protected plateau is 1.10 × 10⁵ ha, and a total of 4.86 × 10⁵ ha of terraced fields have been built [16]. However, what is the effect of such a large area of the GCHP project after implementation? What is the impact of the national costly project on future runoff and erosion, and sand production, and what is the prospect of its sustainable development? All these questions need further study.
The model experiment is an effective method to understand the impact of soil conservation measures on the soil erosion process and disaster mechanism. Huo et al. [10] simulated the response of land use to hydrological processes in the Yanwachuan watershed of the Loess Plateau. It is found that landfill can reduce runoff and sediment, and the combination with forest land and grassland will significantly reduce surface runoff. Hu et al. [17] reported that the average water content of underground soil in the horizontal gully was 11.32%, 46% higher than that of the slope, mainly due to the redistribution of rainfall on the slope caused by the terrace, increasing infiltration and reducing runoff [18], thereby increasing the soil water content. By comparing the Cruz das Almas Landfill and the Muribeca Landfill, Gharabaghi et al. [19] emphasized that excessive pore pressure or weak foundation soil can cause landfill failure [20]. Moreover, in the case of continuous rainfall, the groundwater level of the landfill with poor drainage conditions is subject to rising, causing landslides [21]. Tahereh et al. [22] investigated the drainage system of a deep slope in Australia’s second-largest open pit mine and concluded that a good drainage system could significantly improve the slope strength by reducing the groundwater pressure. However, most of these studies focus on field observations of terraces, landfills, or experimental research on slopes below 40°. Moreover, researchers tend to pay more attention to increasing, constant, extreme rainfall patterns in simulated or natural rainfall conditions [23,24]. There are few quantitative studies on the effects of seasonal rainfall on soil erosion for soil and water conservation measures with slopes of 40° and above. The GCHP project is a major soil and water conservation and land remediation project implemented in the Loess Plateau area under the background of unique geomorphology, and there is no precedent for reference internationally. On a multispatiotemporal scale, the GCHP project has wholly reconstructed the original hydrogeological structure of the construction area, reconstructed the water cycle mode of the site, and combined with the infiltration and erosion of surface water; it is extremely easy to cause changes in the properties of loess, directly leading to project instability or secondary geological disasters. The emergence of these new problems cannot be separated from the impact process of the project on runoff and erosion, sediment production, and secondary geological disasters caused by the project are relatively common in local areas.
In order to reveal the impact mechanism after the completion of the GCHP project on runoff and sediment yield, this study simulated the response mechanism of different GCHP engineering measures to runoff and sediment content during seasonal rainfall through large-scale scouring experiments. Unlike previous studies, this scouring experiment includes the following: (i) Simulating the process of soil erosion under different GCHP measures under seasonal rainfall conditions; (ii) Comparing the impact of sudden changes in runoff on reducing soil erosion; (iii) Clarify the role of drainage systems in reducing erosion and sediment production. The purpose of this study is to explore the impact of different engineering measures for GCHP on runoff and sediment yield on a multispatiotemporal scale and find a scientific solution to the mutual feedback mechanism between GCHP and hydraulic erosion, as well as the secondary geological disasters induced by them, and to provide a theoretical basis for the implementation of water and soil conservation measures in other similar regions. Finally, water-saving and efficient integrated watershed management technologies will be explored to serve the ecological environment protection and high-quality development of the Loess Plateau.

2. Materials and Methods

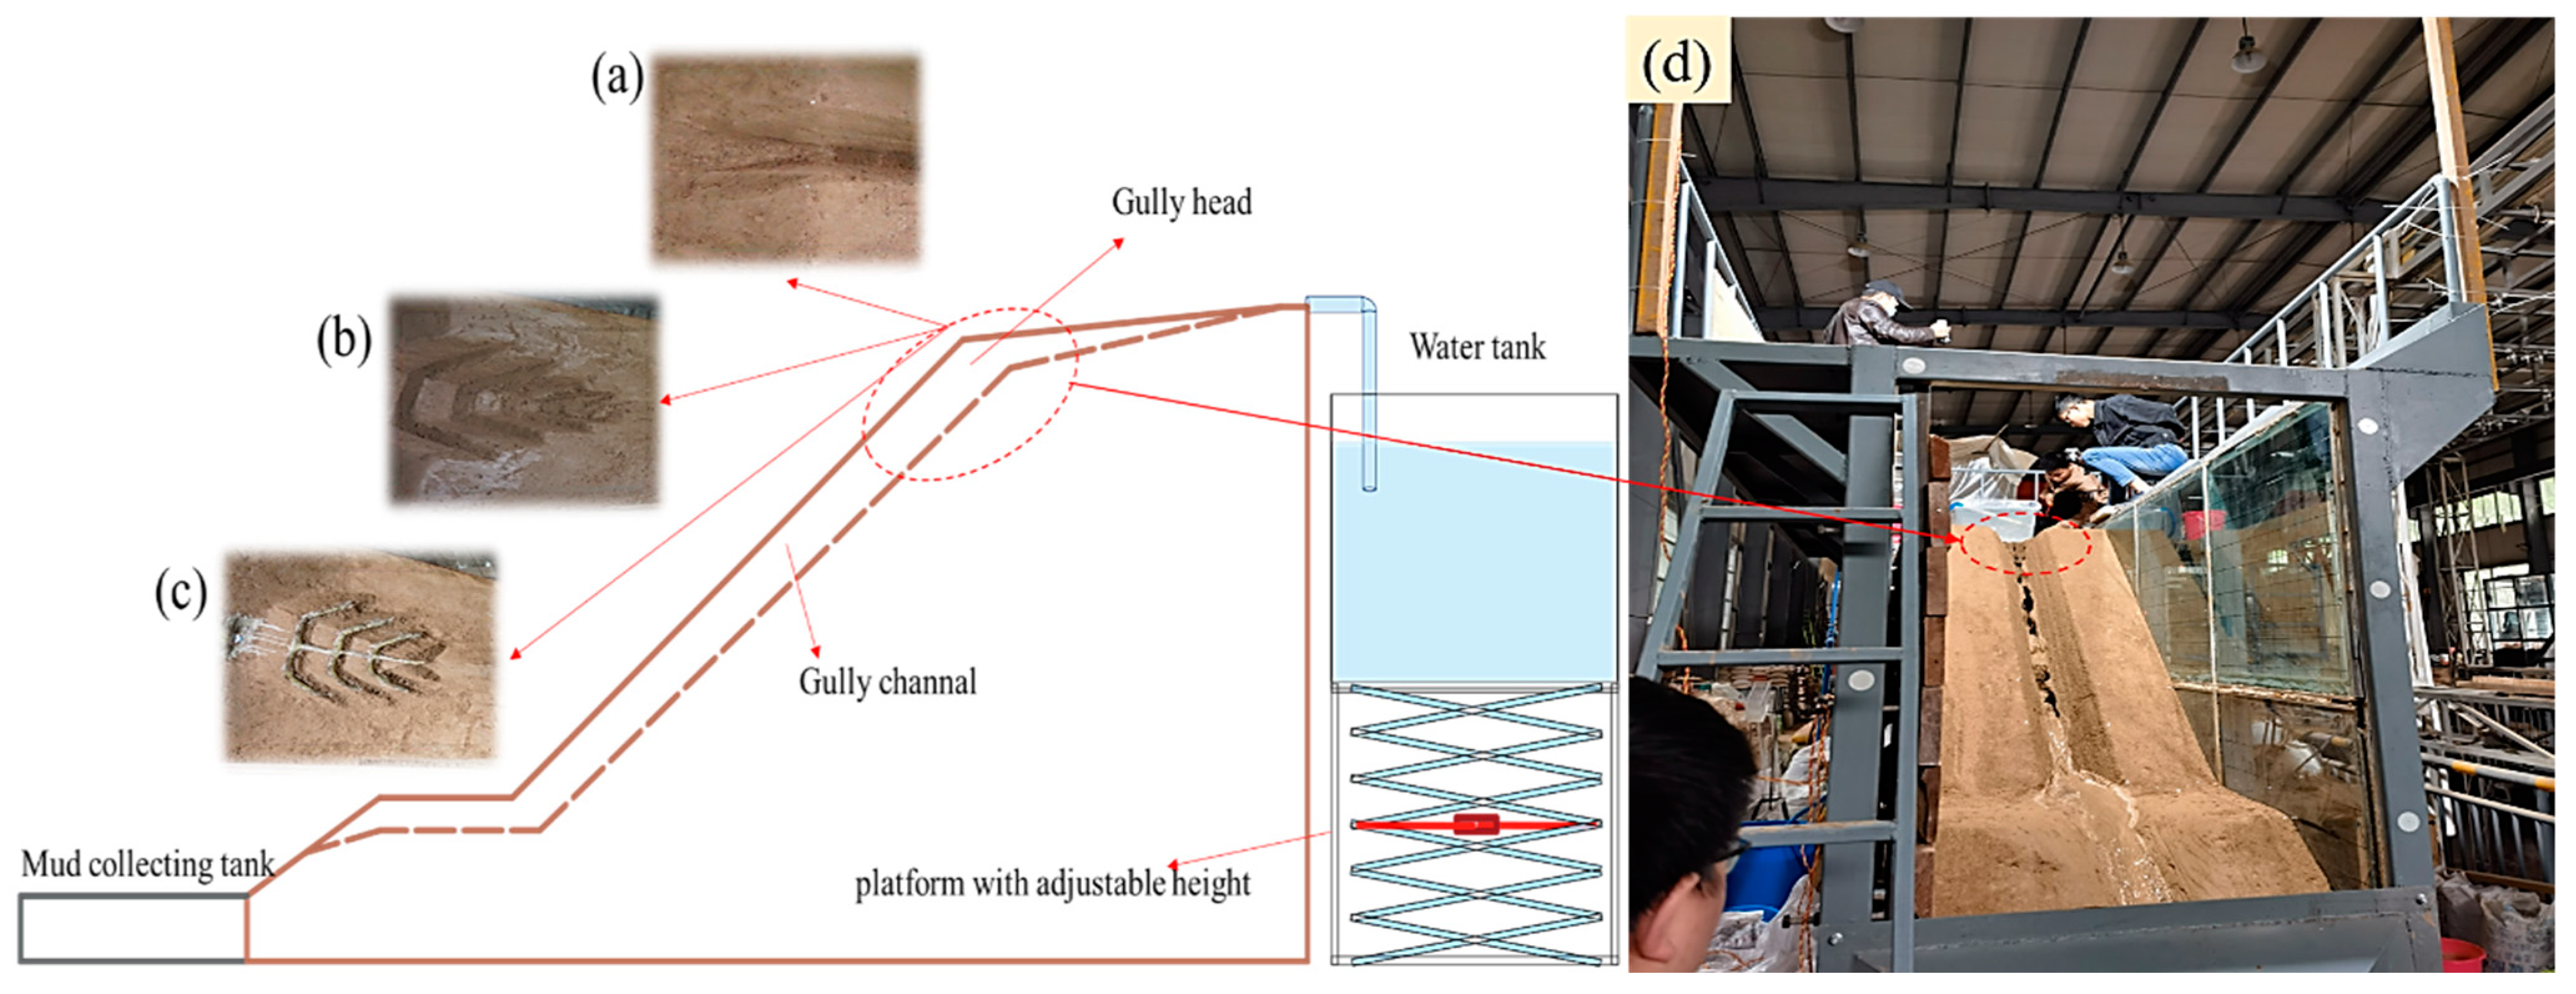
2.1. Experimental Design

Generally speaking, rainfall can be divided into increasing, decreasing, intermittent, and constant patterns according to rainfall intensity changes with rainfall time [25]. In the gully region of the Loess Plateau, the rainfall increase model caused more serious soil erosion than the other three models and was simulated more frequently [26,27]. In reality, rainfall does not always increase and is seasonal. According to the annual average rainfall intensity of the Fengbao Gully, all rainfall scenarios in this experiment are divided into three types: spring, summer, and fall (Table 1).
To achieve the research objectives, we establish three different land use types (landfill treatment (LT), nondrained terraced (NDT), and terraced with drainage systems (DT)) on the Loess slope and conduct six different rainfall intensity scouring experiments (Figure 1). The size of the soil tank is 4 m × 1.2 m × 3 m. The experimental soil tank is a square steel pipe welded with glass-fiber-reinforced plastics on both sides. The water is supplied by a tank full of tap water with a submersible pump at the bottom, and the flow rate is transmitted to the model by an electromagnetic flowmeter at the designed rate. The submersible pump model is Q(D)3-35/2-1.1 KW, the flow is 3 m3/h, the electromagnetic flowmeter model is NRLD-B-50, and the flow range is 0.2–8 m3 h−1. Since the actual flow is also collected into the gully, even with a small amount of sediment, the impact on the soil with a low proportion of clay particles may be insignificant [27]. The water flow with the designed flow is pumped from the water tank into the top of the model and flows into the slope through another triangular weir to achieve uniform water output and avoid the impact force of the water flow affecting the experimental results.

2.2. Experimental Materials

Fengbao Gully (35°39′9″ N, 107°36′27″ E) in the Xifeng district was selected as a typical GCHP project prototype. Reference the particle size distribution of the experimental soil in Huo et al. [28]. We collected soil from the gully measure area, and the dry density of the soil sample was 1.4 g/cm3. Before the experiment started, the soil was sieved through a 5 mm sieve to remove stones and debris. Then, the moisture content of the Loess was adjusted to about 12% and isolated for 24 h to disperse the water in the soil evenly.

2.3. Experiment Procedures

First, the treated Loess is filled into the model box layer by layer. Each filling layer is tamped with concrete round piers, and the surrounding areas are tamped and levelled with rubber hammers. Three soil samples were taken using ring cutters during compaction, and moisture content measurements were taken, maintaining a soil density of 1.4 g/cm3 per layer (Figure 2a). Secondly, before filling the two layers, gently rub the surface with a brush to ensure that there is no apparent stratification between the two layers of Loess. After standing, the filled soil layer begins to cut the slope along the slope line outside the model (the slope line map is drawn for the slope of the Fengbao Gully (Figure 2b). Among them, four steps were cut out in the nondrained terraced (NDT) (Figure 1b). When the drained terraced (DT) was filled with loess, the PVC pipe with a diameter of 10 cm parallel to the slope line was buried under the loess for 30 cm to form a hidden pipe, and a stilling pool was installed at the bottom of the slope to reduce hydraulic scour. After the upper thread was cut out with four steps, the antipenetration measure was carried out. The three measures are represented in Figure 1. Thirdly, after cutting the slope, we sprayed water into the whole gully with a watering can and stood for more than 24 h to simulate the phenomenon of soil crust. Before the test, the water pump was repeatedly adjusted to reach ±5% of the flow rate required by the test. The mud collection tank was placed at the outlet of the gully model, and the total mud volume was recorded every 2 min. Once all the preparations are finished, the flushing process can be initiated. Fourthly, during rainfall, 15 L buckets were used to collect runoff and sediment. The time between two bucket changes was recorded to determine the sampling interval, and the runoff and sediment collected at 2 min intervals were also recorded (Figure 2c).
After the experiment was stopped, the weight of each bucket was recorded, the sediment was recovered after 24 h of settling, and the clear runoff water was removed via siphoning. Then, the mixture in the buckets was stirred evenly, and each bucket corresponded to two aluminum boxes. The samples were weighed, dried (105 °C), weighed again, and the water content of the sediment was calculated. The total runoff and sediment yield can be determined within each sampling interval. Before and after the rainfall, a 3D laser scanner and a high-definition camera were used to take pictures of the gully model, and the gully shape information was obtained by measuring the channel depth change (Figure 2d,e).

3. Result

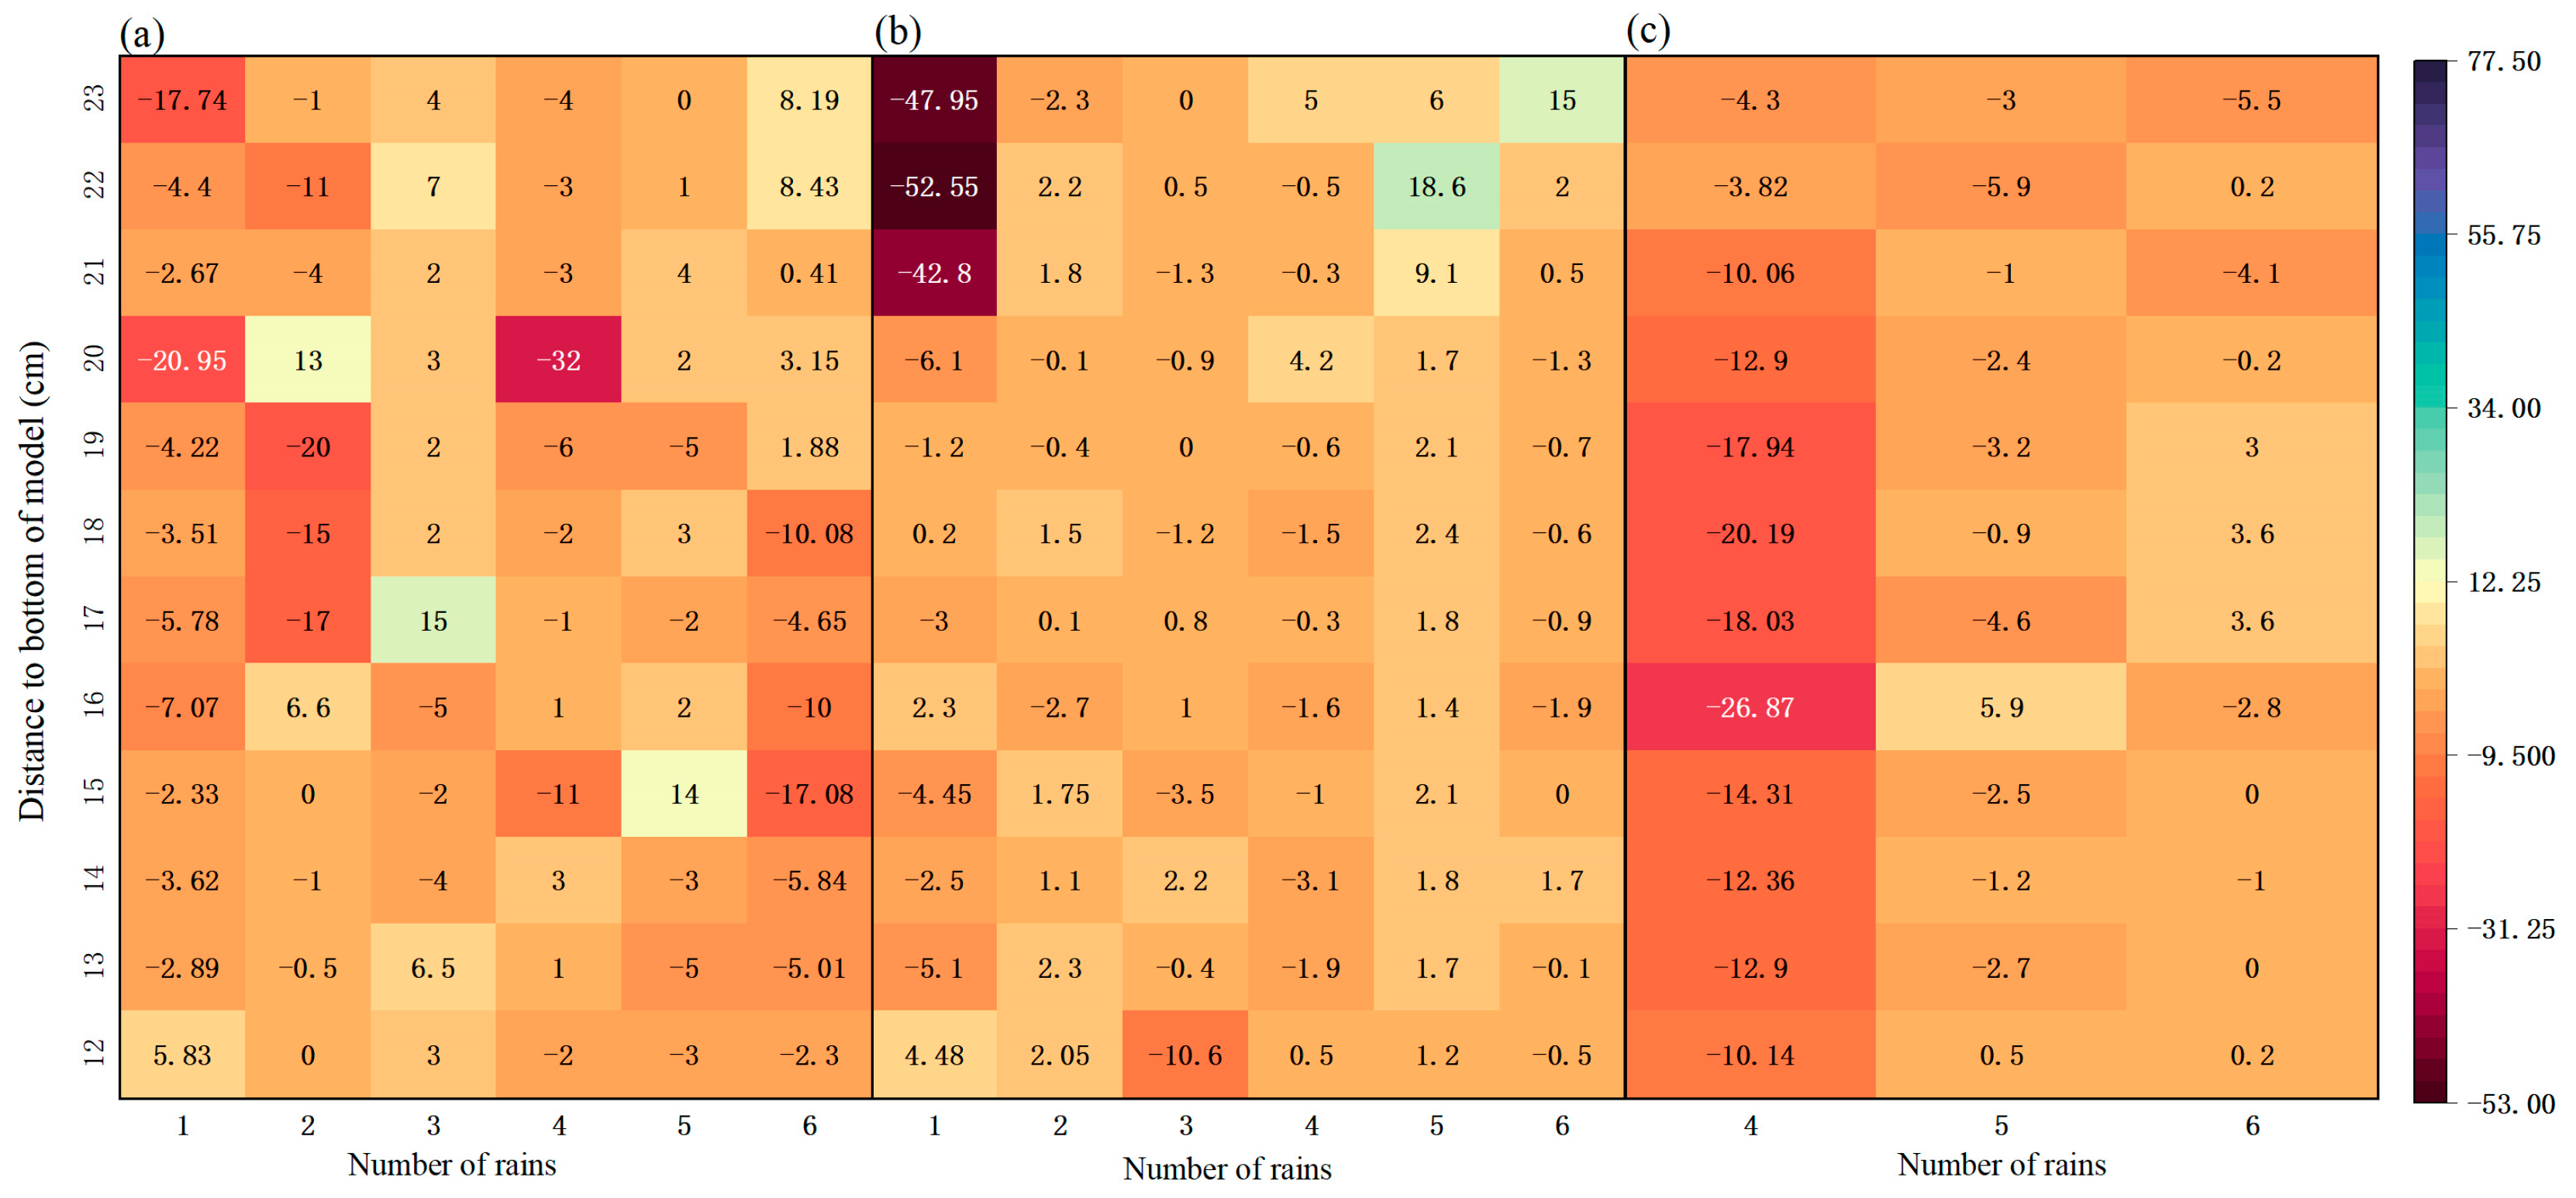
3.1. Morphological Changes
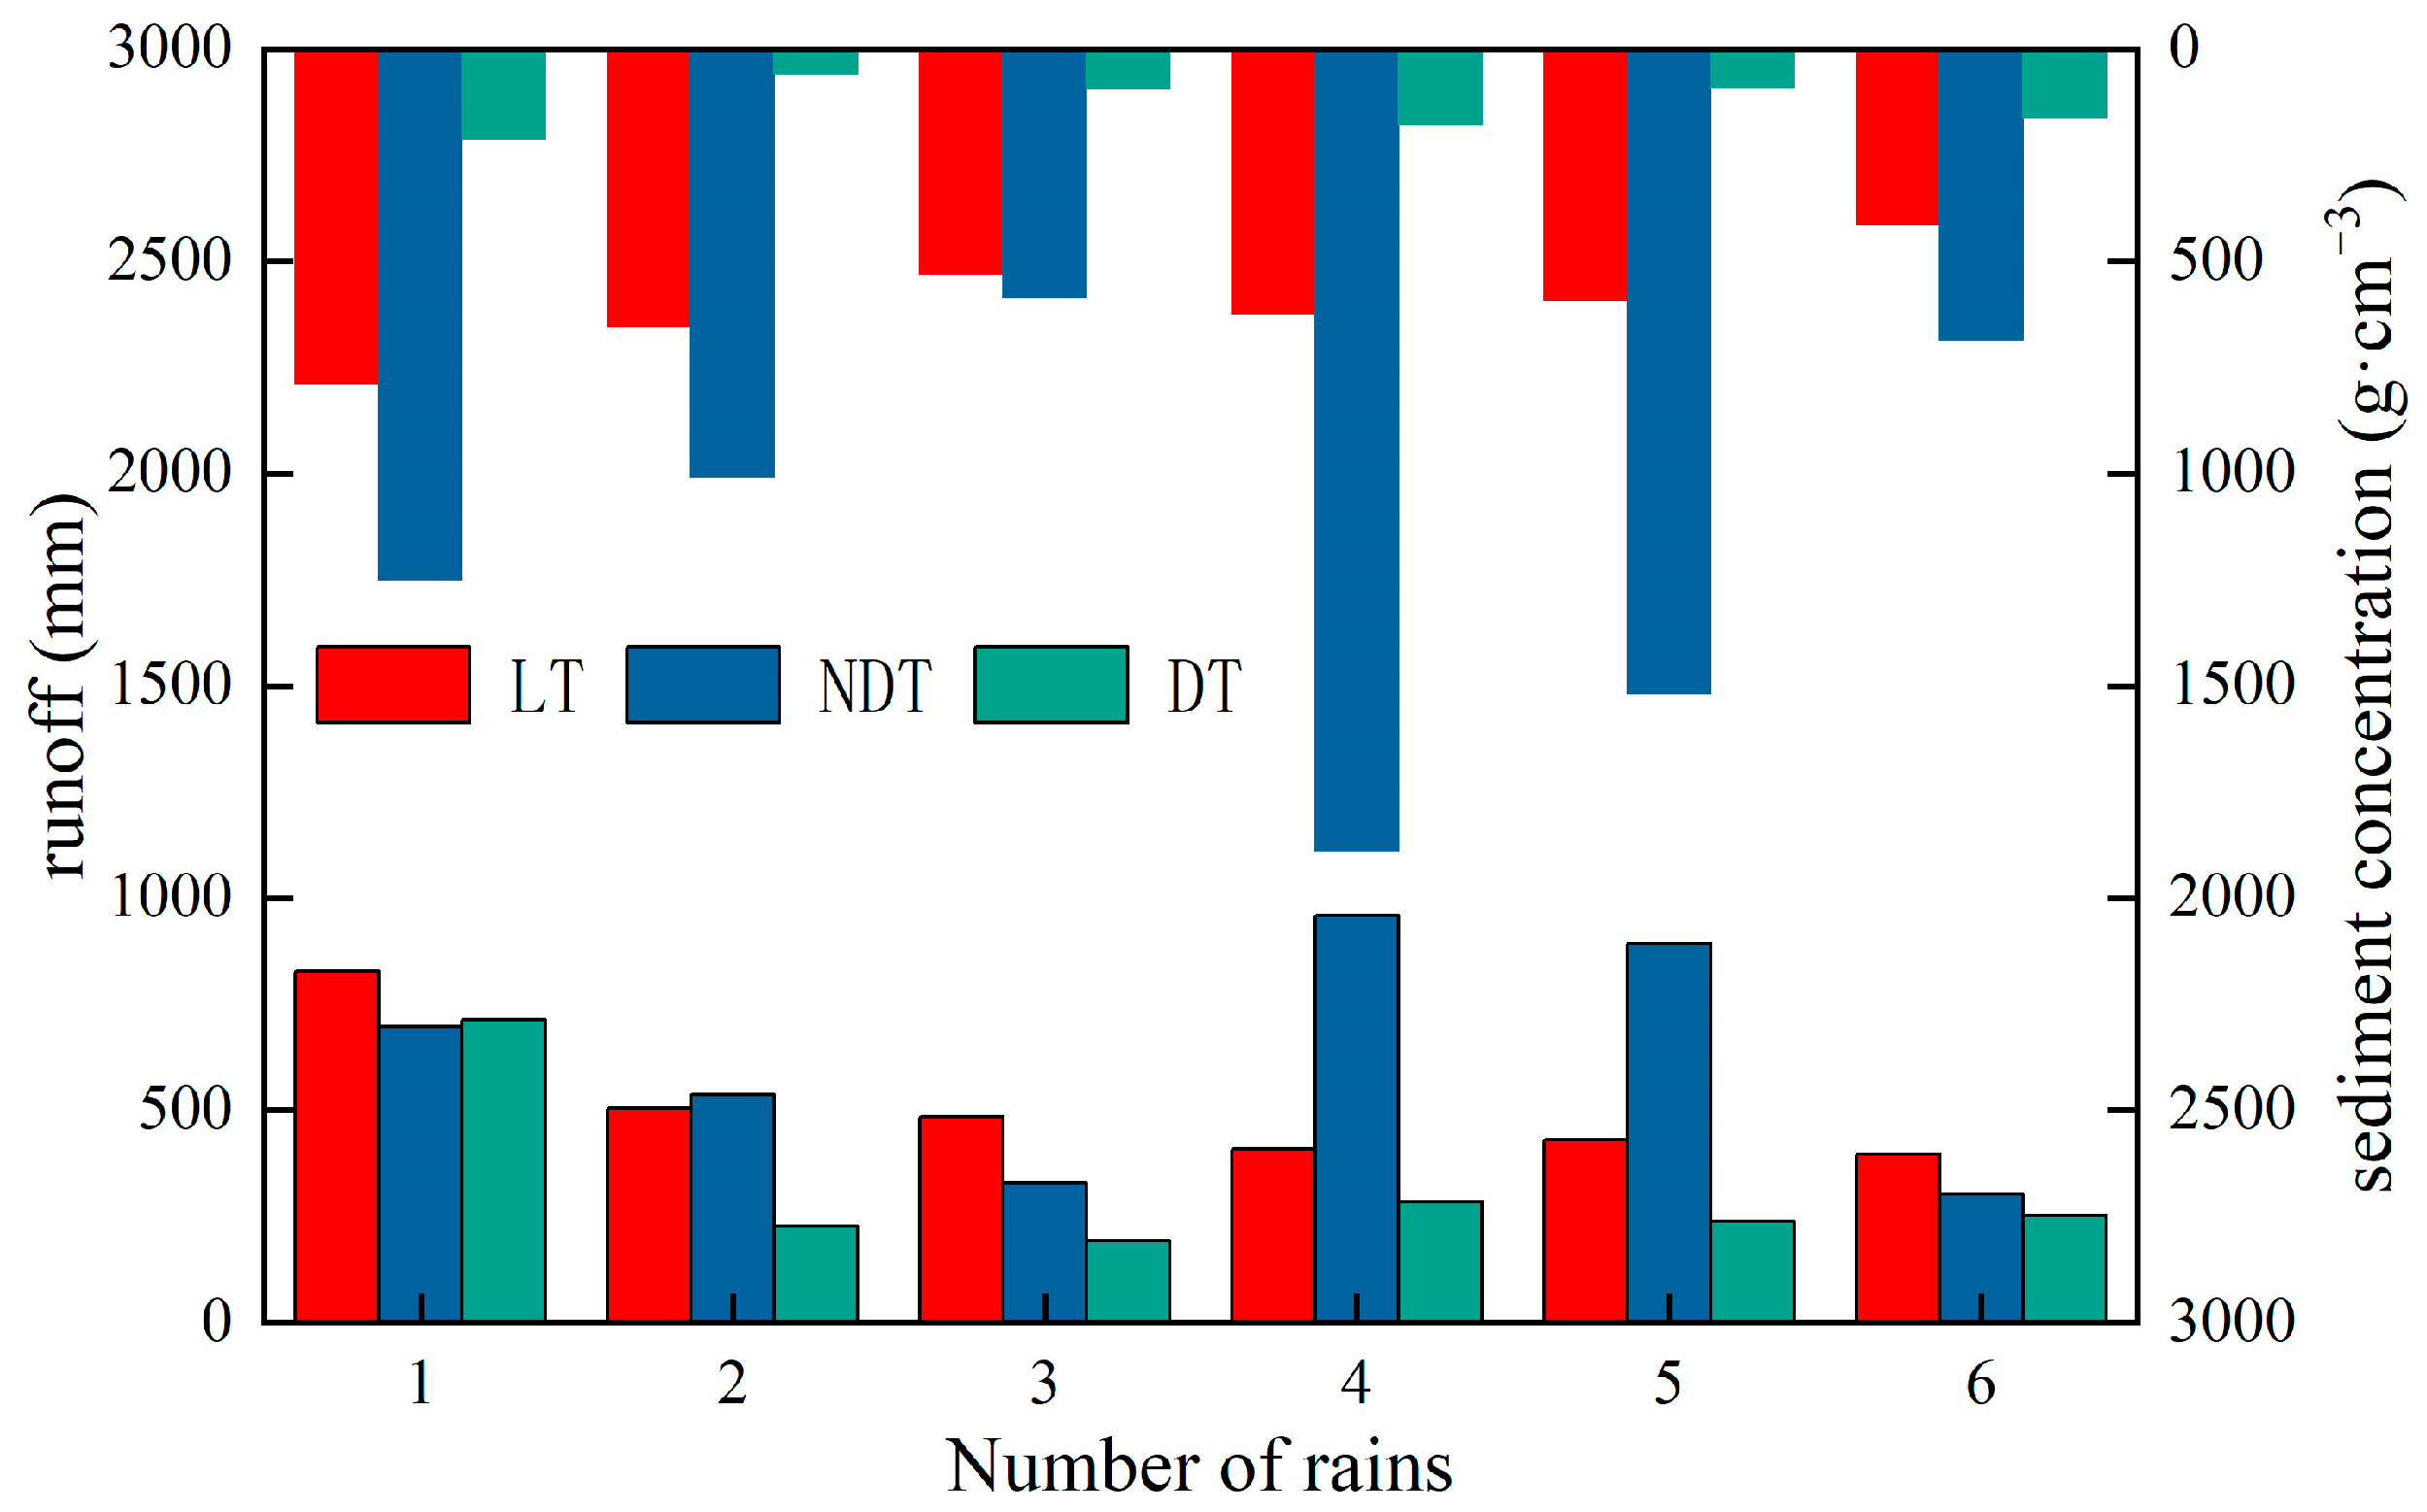
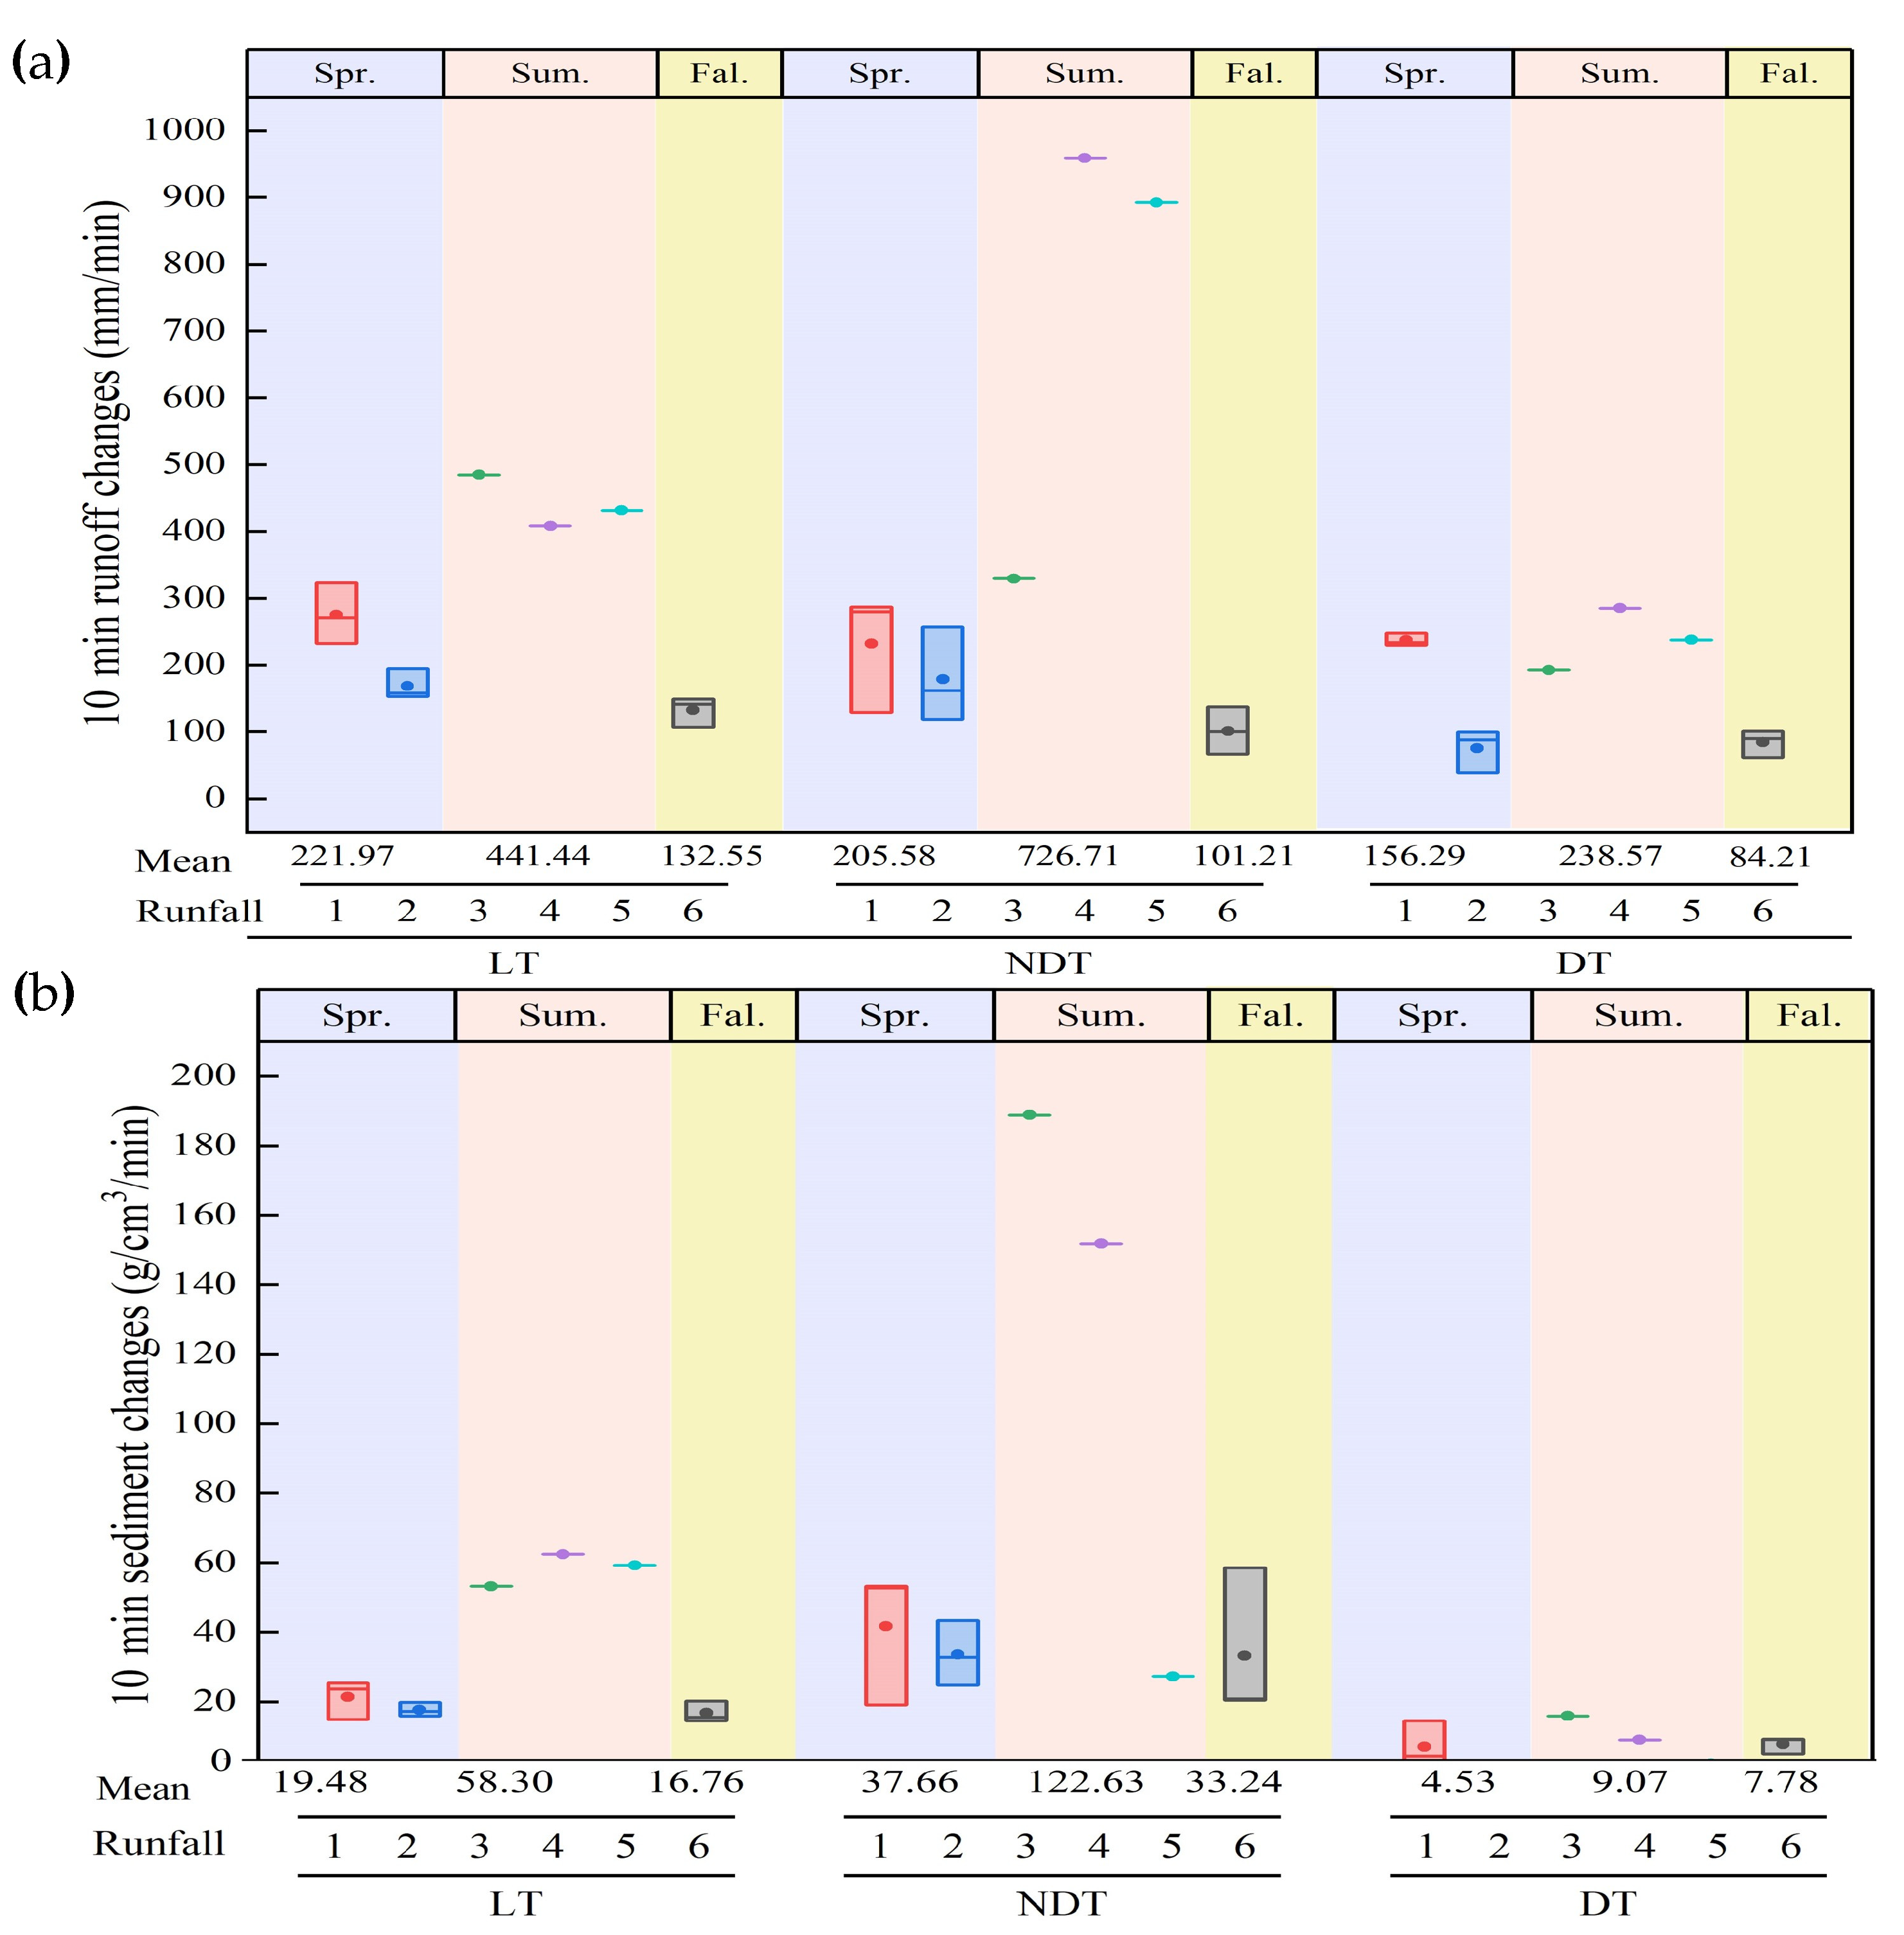
In simulated rainfall, the flow collected into the gully on the slope has large kinetic energy, and the soil blocks in the gully fall in a small range. The changes and characteristics of the relative depth after rain and the difference between the depth from the bottom of the model after two rainfalls are shown in Figure 3 and Table 2, respectively. The depth variation of LT ranges from −32 cm to 15 cm, and the maximum negative value appears upstream of the gully with the heaviest rainstorm, while the maximum positive value occurs due to the large-scale increase in relative depth caused by the collapse. The depth variation range caused by NDT was the largest, ranging from −52.55 cm to 18.6 cm, and the maximum relative depth was concentrated where the gully slope was changed for the first rainfall. There are two reasons: firstly, the floating soil on the surface was not thoroughly cleaned before the experiment started; secondly, there are no protection measures such as vegetation, gravel, or dust net, and the erosion base level is low and easy to erode. For the DT measure, due to the drainage system, there is no runoff on the slope surface of the first three rainfall events, and the relative depth is only calculated for the last three rainfall events. The maximum depth change in DT is −26.87 cm, which is in the center of the gully. The reason may be that the PVC pipe is elastic. When buried in the soil, the soil around the concealed pipe is loose, and the infiltration increases, resulting in significant depth changes. The overall effect of DT is much better than that of LT and NDT.
It can be seen from Table 2 that the minimum, maximum, mean, and median distances from the bottom of LT are higher than those of the NDT, and the proportion of the relative depth greater than 0 is lower than that of NDT, which indicates that the number of landslides and collapses of NDT is more than that of LT. However, due to the terrace in NDT, the falling soil blocks are smaller than LT. In DT, the first three rainfalls did not produce runoff on the slope because of a good drainage system, and the number of collapses was far less than that of LT and NDT during the last three rainfalls. Therefore, the protection effect of DT on the gully is far better than that of NDT and LT.

3.2. Runoff

Figure 4 shows the variation in runoff depth with different rainfall and measures. The runoff depth range of LT is 397.65~826.14 mm, the runoff depth range of NDT is 303.64~958.62 mm, and the runoff depth range of DT is 192.49~712.00. The total output of LT is 57.39~47.14% more than that of NDT and 16.03~151.70% more than that of DT; the total runoff yield of NDT is 0~275.15% more than that of DT. NDT is 6.24%, 134.67%, and 106.86% higher than LT in the second, fourth, and fifth rainfalls, respectively, and LT is 18.66~47.14% higher than NDT in other rainfall intensities. Therefore, the total runoff of LT and NDT is higher than DT, and the total runoff of NDT is higher than LT only in the case of rainstorms.
During the six rainfall periods, the 10 min runoff depth of the three different measures showed different trends (Figure 5a). The variation ranges of 10 min runoff depth increased from 132.55 mm to 484.49 mm in LT, while it increased from 118.56 mm to 287.20 mm in NDT. Meanwhile, the range of 10 min runoff depth increased from 38.50 mm to 248.12 mm in DT. The 10 min runoff change in LT is 67.83–276.03% more than the 10 min runoff depth of NDT, and 1.07-10.20 times more than that of DT in simulated summer rainfall. In simulated spring and fall rainfall, NDT is 4.12–39.84% more than LT in 10 min runoff depth. During the simulated spring rainfall, erosion occurred on the slope surface under the LT treatment, and the water flow path became longer. During the simulated autumn rainfall process, a large-scale collapse occurred on the slope surface under the LT treatment, which blocked the channel. Therefore, in these two seasons, the runoff in the NDT treatment was higher than that in the LT treatment. During the simulated summer rainfall process, slope failure occurred on the LT treatment slope surface, resulting in more runoff. The 10 min runoff depth of NDT is 15.75%-567.55% more than that of DT, and DT is 81.70% more than NDT only in the first summer rainfall due to the falling and collapse of soil in NDT. In general, the amount of runoff was the least in DT. The runoff depth of LT was higher than that of the terrace in summer rainfall and lower than that of NDT in spring and fall.

3.3. Sediment

The variation pattern of sediment content of the three measures was similar, and the maximum sediment content occurred during the heaviest rainstorm. In three measures, the first rainfall caused a significant sediment content due to floating soil, so the data of the first rainfall was removed when comparing the amount of sediment. The sediment content caused by the maximum rainstorm is 5.36~51.10%, 24.39~222.65%, and 9.32~204.86% higher than other rainfall types, respectively, in LT, NDT, and DT. In the six rainfalls, the variation of sediment was all NDT >LT > DT. The sediment content of NDT was 1.10~3.02 times higher than that of LT, 4.17~17.25 times higher than that of DT, and the sediment content of LT is 2.51~11.19 times higher than that of DT (Figure 4).
The average 10 min sediment content changes in LT were significantly higher than that of DT, ranging from 14.56 to 62.44 g/cm3, 1.91 to 25.58 times more than that of DT (Figure 5b). Due to the absence of a perfect drainage system in NDT, the connection between the steps and the slope is weak, so there are a higher 10 min sediment content changes. The average 10 min sediment content changes in NDT were significantly higher than that of the LT and DT, ranging from 19.11 to 188.78 g/cm3, 0.46 to 4.02 times more than that of LT and 2.27 to 23.93 times more than that of DT. Therefore, the loess slope of DT has lower soil sediment content and 10 min sediment content changes.

3.4. Relationship between 10 min Runoff and Sediment Content Changes

Figure 6 shows the relationship between 10 min runoff and 10 min sediment content changes under different rainfall intensities. The coefficient  a  of the linear function    y = a x + b  can be interpreted as the amount of sediment content changes per unit runoff as a parameter reflecting soil erosion sensitivity. The result showed that the coefficient  a  of the function decreases successively in different slope measures, namely LT > NDT >DT. During rainfall, the correlation coefficient between 10 min runoff changes and 10 min sediment content changes in LT was 0.80. When the rain was heavy, the runoff and sediment content changes generally increased; when the rainfall intensity was small, the runoff and sediment content changes generally decreased. Due to human activities interference, there is no linear correlation between 10 min runoff changes and the 10 min sediment content changes under NDT and DT, and the correlation coefficients are insignificant.

4. Discussion

This study discussed the effects of different rainfall types and slope measure on runoff and sediment. Soil and water conservation measures reduce sediment connectivity by changing meso topography, which reduces local soil erosion and sediment transport [29]. Different measures’ protective ability on tableland surfaces differs, consistent with the previous research results [30]. The sediment yield of LT and NDT is much higher than that of DT. On the one hand, continuous rainfall will lead to the generation of high pore pressure and q reduction in effective stress in the bottom layer, which is prone to landslides and collapse [31].
On the other hand, poor drainage conditions lead to the destruction of the sliding surface, and the landslide deposition will block the drainage channel and increase the local hydraulic gradient, resulting in new landslides and collapses [21]. Alternatively, there is no drainage system, so the water flow is transported through the gully, increasing erosive and sediment transport capacity [32]. In addition, the sediment yield of LT is 1.02~4.55 times higher than that of DT because the terrace makes the slope horizontal, effectively intercepting part of the rainfall and slowing down the flow rate of surface runoff, thereby reducing sediment transport [33]. These factors lead to a higher sediment yield of LT than that of DT, which is consistent with the research results of Chen et al. [18]. The risk of erosion is higher than that of LT for simple construction of terrace without drainage treatment, which is consistent with the research results of Lesschen et al. [13].
The slope of LT has a higher runoff than NDT and DT, which is consistent with Ran et al. [34] but inconsistent with Rodrigo-Comino et al. [35]. The main reason for this inconsistency may be that the 26 rainfalls simulated by Rodrigo-Comino were all the same intensities with a low slope. Other studies have shown that the different permeability capacities of subsoil and topsoil influence hydrology and soil erosion processes with the most significant influence [36]. Our results also show that differences in runoff depth are more evident as rainfall intensity increases (Figure 4), supported by previous studies [37,38].
DT is more effective than NDT in reducing runoff and soil erosion. The drainage system maintains pore water pressure and slope stability [31]. Cotecchia et al. [39] found that after the landslide sediment blocked the drainage channel, the pore water pressure increased, and the local groundwater level rose, thus inducing new landslides. Effective drainage systems can fundamentally control the occurrence of landslides. This is consistent with the research results of Ran et al. [34], which found that well-maintained terraces reduced runoff by 72% compared to ridge-free terraces. In the case of low rainfall intensity, DT has no overflow on the platform surface due to the drainage system, and the runoff erosion and slope scouring load are significantly reduced, thus reducing the risk of landslides. This is consistent with the research results of Calsamiglia et al. [40], who also showed that the advantage of drainage pipelines to protect slopes becomes more evident with the increase in rainfall intensity.
Different measures responded differently to changes in runoff during rainfall. NDT is quickly saturated by rainwater. This water then seeps out at all locations of the slope, producing surface runoff that appears as saturated excess runoff [13], which results in a trend in runoff changes that is roughly similar to that of LT (Figure 5a). This is consistent with the results of Wei et al. [37]. With rainstorms, NDT will have different degrees of collapse, followed by landslide and more mud water mixture, resulting in apparent peak distribution of runoff. The meso topography of terraces is more complex than landfills, which alters the direction and turbulence of water flow, thereby reducing runoff, which is more significant during rainstorms [34,41]. In addition, the richness of surface topographic features is generally positively correlated with rainfall intensity, which is also a significant factor affecting runoff changes [42]. Since there are no protective measures such as vegetation, rock fragments or dust nets on soil and water conservation measures, once the rainfall intensity exceeds the infiltration capacity of topsoil, the runoff discharge will be activated immediately, as demonstrated by other authors [43,44,45].
Therefore, the construction of unscientific soil and water conservation measures and the lack of maintenance may cause negative impacts. For example, in the Loess Plateau, the use of construction waste landfill with improper drainage systems leads to a rising groundwater level and landslides and causes water environment pollution. Soil erosion processes can also be activated, sometimes with severe consequences, during the first few years of the new measures, especially when the slope is still bare [46,47]. Ma et al. [48] showed that 25% of the existing terraces on the Loess Plateau in China face severe damage due to lack of maintenance. Therefore, the construction of soil and water conservation measures on the Loess Plateau needs scientific norms to guide the construction. These specifications should consider soil type, depth, slope, hydrology, and rainfall characteristics. Adopting new low-permeability material combined with slope protection technology can reduce the vertical infiltration of surface water in the excavated areas. Before vegetation restoration, cover with gravel or a dust net to reduce water and sediment content. At the same time, periodic protection is essential for the later period of soil and water conservation measures. If there is a problem with the gully, measures should be taken immediately, and temporary remedial measures such as joint filling and slope cutting should be taken in time to guide the water flow into the stilling measures in an orderly manner; the new gully head should be blocked, and the slope at this point should be strengthened to avoid new geological problems.
However, there may be some limitations in simulating soil erosion in the laboratory due to the constraints of experimental conditions. For example, the slope surface established in the laboratory is usually artificially created, and its topography, soil type, vegetation status, and water flow conditions may differ from the natural original slope surface. In addition, the simulated slope in the laboratory is based on the experimental prototype, while the slope in the natural environment varies due to factors such as topography and landform. Moreover, the simulated rainfall in the laboratory is often conducted according to the intensity of the region where the prototype is located. However, rainfall in the natural environment has greater uncertainty and diversity, so the experimental results may not fully reflect soil erosion under natural conditions. Wang et al. [7] demonstrated that terraced fields on the slopes of gullies can reduce runoff energy towards the gullies by changing the slope and increasing infiltration. Gao et al. [49] studied the erosion and transportation process affected by the spatial distribution of terraces and found a time lag in the generation of runoff and sediment compared to bare land. Ding et al. [50] found that different vegetation coverage rates and grass arrangement patterns impact the amount of runoff and sediment produced during slope–gully erosion. Zheng et al. [51] believed that vegetation can effectively control surface erosion but cannot effectively control gravity and gully erosion. In loess areas with high gully density and deep cutting, it is not easy to control high sediment flow only through slope vegetation measures effectively. Therefore, it is necessary to study how to maximize the restoration of the actual system slope and the impact of different slopes on the water and sediment changes in the watershed under various conditions such as slope, vegetation cover, and land use type in the future.

5. Conclusions

The GCHP project aims to control soil erosion and rationally utilize, develop, and protect soil and water resources. In this paper, Fengbao Gully is used as the prototype of the model research, and a series of scouring experiments of equal scale are established to study the sediment production and discharge process of loess slopes in different measures of the GCHP project under simulated rainfall conditions. The results show the following:
(1)
Under the same conditions, the effect of slope replacement with terraces for GCHP measures is better than that of gully head landfill in reducing soil erosion. The runoff depth of LT is more than that of NDT in the simulated summer rainfall process, and the rainfall in spring and autumn is opposite. In summer rainfall, the runoff depth of LT is 67.83~276.03% more than that of NDT. In spring and autumn rainfall, the runoff depth of NDT is 4.12% to 39.84% more than LT’s.
(2)
Under the same conditions, the effect of slope replacement with terraces for GCHP measures is better than that of gully head landfill in reducing secondary geological disasters. LT and NDT are more prone to collapse than DT. NDT has more collapse times in the process of rainfall than LT. However, due to the existence of a terrace in NDT, the falling clods are smaller than LT.
(3)
Optimized drainage systems can reduce the occurrence of secondary geological disasters. Under the same conditions, the engineering measures of GCHP with drainage systems have significant sediment reduction effects. DT is more effective than NDT in reducing soil erosion, and this advantage is more significant during rainstorms. The sediment yield of NDT was 2.27–23.93 times higher than that of DT sediment. The total runoff yield of NDT is 0~275.15% more than that of DT.
Therefore, geological disasters may occur on the loess slope under heavy or long-term rainfall. When evaluating and predicting the impact of the GCHP project on soil erosion on the loess steep slope, the integrity of the drainage system should be considered, which can reduce the risk of GCHP projects. The groundwater level rose due to the flushing of rainwater, which led to the project’s failure. After the completion of the project, it is necessary to cover it with gravel or a dust net to reduce soil erosion. In addition, regular maintenance is required to avoid new geological problems. The results of this study can provide an essential scientific basis for decision makers and researchers of the GCHP project.

Author Contributions

Conceptualization, Z.Z. and A.H.; methodology, Z.Z. and Y.C.; software, Z.Z. and P.L.; validation, J.P., A.E. and A.H.; investigation, Z.Z. and Y.C. data curation, Z.Z. and M.E.-S.A.; writing—original draft preparation, Z.Z.; writing—review and editing, A.M. and A.A. All authors have read and agreed to the published version of the manuscript.

Funding

This research was funded by the National Natural Science Foundation of China (Grant No. 42261144749, 41790444 and 41877232).

Data Availability Statement

Data will be made available on request.

Acknowledgments

This work was financially supported by the National Natural Science Foundation of China (Grant No. 42261144749, 41790444 and 41877232).

Conflicts of Interest

The authors declare that they have no known competing financial interest or personal relationships that could have appeared to influence the work reported in this paper.

References

  1. Đokić, M.; Manić, M.; Đorđević, M.; Gocić, M.; Čupić, A.; Jović, M.; Dragović, R.; Gajić, B.; Smičiklas, I.; Dragović, S. Remote sensing and nuclear techniques for high-resolution mapping and quantification of gully erosion in the highly erodible area of the Malčanska River Basin, Eastern Serbia. Environ. Res. 2023, 235, 116679. [Google Scholar] [CrossRef]
  2. Zhao, Z.; Huo, A.; Liu, Q.; Peng, J.; Elbeltagi, A.; Abuarab, M.E.S.; Abu-Hashim, M.S.D. Spatiotemporal Variation in the Coupling Relationship between Human Activities and Soil Erosion—A Case Study in the Weihe River Basin. Sustainability 2023, 15, 10785. [Google Scholar] [CrossRef]
  3. Ji, Q.; Gao, Z.; Li, X.; Gao, J.E.; Zhang, G.G.; Ahmad, R.; Liu, G.; Zhang, Y.; Li, W.; Zhou, F. Erosion transportation processes as influenced by Gully Land Consolidation Projects in highly managed small watersheds in the Loess Hilly–Gully Region, China. Water 2021, 13, 1540. [Google Scholar] [CrossRef]
  4. Huo, A.; Wang, X.; Zhao, Z.; Yang, L.; Zhong, F.; Zheng, C.; Gao, N. Risk assessment of heavy metal pollution in farmland soils at the northern foot of the Qinling Mountains, China. Int. J. Environ. Res. Public Health 2022, 19, 14962. [Google Scholar] [CrossRef] [PubMed]
  5. Jin, F.; Yang, W.; Fu, J.; Li, Z. Effects of vegetation and climate on the changes of soil erosion in the Loess Plateau of China. Sci. Total Environ. 2021, 773, 145514. [Google Scholar] [CrossRef] [PubMed]
  6. Van Asch, T.W.; Yu, B.; Hu, W. The development of a 1-D integrated hydro-mechanical model based on flume tests to unravel different hydrological triggering processes of debris flows. Water 2018, 10, 950. [Google Scholar] [CrossRef] [Green Version]
  7. Wang, J.; Zhang, Y.; Li, K.; Zhang, Z.; Chen, C. Gully internal erosion triggered by a prolonged heavy rainfall event in the tableland region of China’s Loess Plateau. Int. Soil Water Conserv. Res. 2022, in press. [Google Scholar] [CrossRef]
  8. Wu, Y.; Cheng, H. Monitoring of gully erosion on the Loess Plateau of China using a global positioning system. Catena 2005, 63, 154–166. [Google Scholar] [CrossRef]
  9. Jin, Z.; Peng, J.; Zhuang, J.; Feng, L.; Huo, A.; Mu, X.; Wang, W. Gully erosion and expansion mechanisms in loess tablelands and the scientific basis of gully consolidation and tableland protection. Sci. China Earth Sci. 2023, 66, 821–839. [Google Scholar] [CrossRef]
  10. Huo, A.; Yang, L.; Luo, P.; Cheng, Y.; Peng, J.; Nover, D. Influence of landfill and land use scenario on runoff, evapotranspiration, and sediment yield over the Chinese Loess Plateau. Ecol. Indic. 2021, 121, 107208. [Google Scholar] [CrossRef]
  11. Li, P.; Chen, J.; Zhao, G.; Holden, J.; Liu, B.; Chan, F.K.S.; Hu, J.; Wu, P.; Mu, X. Determining the drivers and rates of soil erosion on the Loess Plateau since 1901. Sci. Total Environ. 2022, 823, 153674. [Google Scholar] [CrossRef] [PubMed]
  12. Chen, S.; Huo, A.; Guan, W. Remote Sensing Monitoring Method for Groundwater Level on Aeolian Desertification Area. J. Water Chem. Technol. 2020, 42, 522–529. [Google Scholar] [CrossRef]
  13. Lesschen, J.P.; Cammeraat, L.H.; Nieman, T. Erosion and terrace failure due to agricultural land abandonment in a semiarid environment. Earth Surf. Process. Landf. J. Br. Geomorphol. Res. Group 2008, 33, 1574–1584. [Google Scholar] [CrossRef]
  14. Wang, X.; Huo, A.; Lyu, J.; Zhao, Z.; Chen, J.; Zhong, F.; Yang, L.; Guan, W. Dynamic changes and driving factors of vegetation coverage in the mainstream of Tarim River, China. Trans. Chin. Soc. Agric. Eng. 2023, 39, 284–292. [Google Scholar]
  15. Wang, X.F.; Huo, A.D.; Zhu, X.H.; Zhao, Y.B.; Jiang, C.; Zheng, X.L. Study on governance mode of gully consolidation and highland protection project in East Gansu. Yellow River 2019, 41, 106–109. [Google Scholar]
  16. Huo, A.; Peng, J.; Cheng, Y.; Luo, P.; Zhao, Z.; Zheng, C. Hydrological analysis of Loess Plateau highland control schemes in Dongzhi Plateau. Front. Earth Sci. 2020, 8, 528632. [Google Scholar] [CrossRef]
  17. Hu, J.Q.; An, Y.P.; Li, Y.W. Comparative study of impact of different site preparation methods for afforestation efforts. J. Ning Xia Teach. Univ. 2007, 28, 110–113. [Google Scholar]
  18. Chen, D.; Wei, W.; Chen, L. How can terracing impact on soil moisture variation in China? A meta-analysis. Agric. Water Manag. 2020, 227, 105849. [Google Scholar] [CrossRef]
  19. Gharabaghi, B.; Singh, M.K.; Inkratas, C.; Fleming, I.R.; McBean, E. Comparison of slope stability in two Brazilian municipal landfills. Waste Manag. 2008, 28, 1509–1517. [Google Scholar] [CrossRef]
  20. Koerner, R.M.; Soong, T.Y. Stability assessment of ten large landfill failures. In Advances in Transportation and Geoenvironmental Systems Using Geosynthetics, Proceedings of sessions of Geo-Denver 2000, Denver, Colorado, USA, 5–8 August 2000; American Society of Civil Engineers: Reston, VA, USA, 2000; pp. 1–38. [Google Scholar]
  21. Feng, S.J.; Chang, J.Y.; Shi, H.; Zheng, Q.T.; Guo, X.Y.; Zhang, X.L. Failure of an unfilled landfill cell due to an adjacent steep slope and a high groundwater level: A case study. Eng. Geol. 2019, 262, 105320. [Google Scholar] [CrossRef]
  22. Tahereh, S.; Mohsen, G.; Ali, T. Design and optimisation of drainage systems for fractured slopes using the XFEM and FEM. Simul. Model. Pract. Theory 2020, 103, 102110. [Google Scholar]
  23. Anache, J.A.; Wendland, E.C.; Oliveira, P.T.; Flanagan, D.C.; Nearing, M.A. Runoff and soil erosion plot-scale studies under natural rainfall: A meta-analysis of the Brazilian experience. Catena 2017, 152, 29–39. [Google Scholar] [CrossRef]
  24. Guo, M.; Wang, W.; Shi, Q.; Chen, T.; Kang, H.; Li, J. An experimental study on the effects of grass root density on gully headcut erosion in the gully region of China’s Loess Plateau. Land Degrad. Dev. 2019, 30, 2107–2125. [Google Scholar] [CrossRef]
  25. Parsons, A.J.; Stone, P.M. Effects of intra-storm variations in rainfall intensity on interrill runoff and erosion. Catena 2006, 67, 68–78. [Google Scholar] [CrossRef]
  26. Wang, B.; Steiner, J.; Zheng, F.; Gowda, P. Impact of rainfall pattern on interrill erosion process. Earth Surf. Process. Landf. 2017, 42, 1833–1846. [Google Scholar] [CrossRef]
  27. Rahma, A.E.; Wang, W.; Tang, Z.; Lei, T.; Warrington, D.N.; Zhao, J. Straw mulch can induce greater soil losses from loess slopes than no mulch under extreme rainfall conditions. Agric. For. Meteorol. 2017, 232, 141–151. [Google Scholar] [CrossRef]
  28. Huo, A.; Zhao, Z.; Luo, P.; Zheng, C.; Peng, J.; Abuarab, M.E.S. Assessment of spatial heterogeneity of soil moisture in the critical zone of gully consolidation and highland protection. Water 2022, 14, 3674. [Google Scholar] [CrossRef]
  29. Haiyan, F.; Liying, S. Modelling soil erosion and its response to the soil conservation measures in the black soil catchment, Northeastern China. Soil Tillage Res. 2017, 165, 23–33. [Google Scholar] [CrossRef]
  30. Haiyan, F. Impacts of soil conservation measures on runoff and soil loss in a hilly region, Northern China. Agric. Water Manag. 2021, 247, 106740. [Google Scholar] [CrossRef]
  31. Cheng, Y.; Huo, A.; Zhao, Z.; Peng, J. Analysis of loess fracture on slope stability based on centrifugal model tests. Bull. Eng. Geol. Environ. 2021, 80, 3647–3657. [Google Scholar] [CrossRef]
  32. Shi, Z.H.; Yan, F.L.; Li, L.; Li, Z.X.; Cai, C.F. Interrill erosion from disturbed and undisturbed samples in relation to topsoil aggregate stability in red soils from subtropical China. Catena 2010, 81, 240–248. [Google Scholar] [CrossRef]
  33. Xu, G.; Ren, Z.; Li, P.; Li, Z.; Yuan, S.; Zhang, H.; Wang, D.; Zhang, Z. Temporal persistence and stability of soil water storage after rainfall on terrace land. Environ. Earth Sci. 2016, 75, 966. [Google Scholar] [CrossRef]
  34. Ran, Q.; Chen, X.; Hong, Y.; Ye, S.; Gao, J. Impacts of terracing on hydrological processes: A case study from the Loess Plateau of China. J. Hydrol. 2020, 588, 125045. [Google Scholar] [CrossRef]
  35. Rodrigo-Comino, J.; Seeger, M.; Iserloh, T.; González, J.M.S.; Ruiz-Sinoga, J.D.; Ries, J.B. Rainfall-simulated quantification of initial soil erosion processes in sloping and poorly maintained terraced vineyards-Key issues for sustainable management systems. Sci. Total Environ. 2019, 660, 1047–1057. [Google Scholar] [CrossRef]
  36. Sun, G.; Zhou, G.; Zhang, Z.; Wei, X.; McNulty, S.G.; Vose, J.M. Potential water yield reduction due to forestation across China. J. Hydrol. 2006, 328, 548–558. [Google Scholar] [CrossRef]
  37. Wei, W.; Pan, D.; Yang, Y. Effects of terracing measures on water retention of pinus Tabulaeformis forest in the dryland loess hilly region of China. Agric. For. Meteorol. 2021, 308, 108544. [Google Scholar] [CrossRef]
  38. Jencso, K.G.; McGlynn, B.L. Hierarchical controls on runoff generation: Topographically driven hydrologic connectivity, geology, and vegetation. Water Resour. Res. 2011, 47. [Google Scholar] [CrossRef] [Green Version]
  39. Cotecchia, F.; Lollino, P.; Petti, R. Efficacy of drainage trenches to stabilise deep slow landslides in clay slopes. Géotech. Lett. 2016, 6, 1–6. [Google Scholar] [CrossRef]
  40. Calsamiglia, A.; Fortesa, J.; García-Comendador, J.; Lucas-Borja, M.E.; Calvo-Cases, A.; Estrany, J. Spatial patterns of sediment connectivity in terraced lands: Anthropogenic controls of catchment sensitivity. Land Degrad. Dev. 2018, 29, 1198–1210. [Google Scholar] [CrossRef]
  41. Siriri, D.; Wilson, J.; Coe, R.; Tenywa, M.M.; Bekunda, M.A.; Ong, C.K.; Black, C.R. Trees improve water storage and reduce soil evaporation in agroforestry systems on bench terraces in SW Uganda. Agrofor. Syst. 2013, 87, 45–58. [Google Scholar] [CrossRef] [Green Version]
  42. Polyakov, V.O.; Nichols, M.H.; McClaran, M.P.; Nearing, M.A. Effect of check dams on runoff, sediment yield, and retention on small semiarid watersheds. J. Soil Water Conserv. 2014, 69, 414–421. [Google Scholar] [CrossRef] [Green Version]
  43. Novara, A.; Gristina, L.; Saladino, S.S.; Santoro, A.; Cerdà, A. Soil erosion assessment on tillage and alternative soil managements in a Sicilian vineyard. Soil Tillage Res. 2011, 117, 140–147. [Google Scholar] [CrossRef] [Green Version]
  44. Aidi, H.; Siming, C.; Jianbing, P.; Yuxiang, C. UAV-based gully retrogressive erosion status dynamic variability investigations in Chinese Loess Plateau. Arab. J. Geosci. 2021, 14, 263. [Google Scholar] [CrossRef]
  45. Carroll, C.; Merton, L.; Burger, P. Impact of vegetative cover and slope on runoff, erosion, and water quality for field plots on a range of soil and spoil materials on central Queensland coal mines. Soil Res. 2000, 38, 313–328. [Google Scholar] [CrossRef]
  46. Chapagain, T.; Raizada, M.N. Agronomic challenges and opportunities for smallholder terrace agriculture in developing countries. Front. Plant Sci. 2017, 8, 331. [Google Scholar] [CrossRef] [Green Version]
  47. Zhao, Z.; Liu, Q.; Huo, A.; Cheng, Y.; Guan, W.; Mohamed, E.L.; Mokhtar, A.; Elbeltagi, A. A novel integrated approach for monitoring drought stress in an aeolian desertification area using Vegetation Drought Status Index. Water Supply 2023, 23, 738–748. [Google Scholar] [CrossRef]
  48. Ma, H.B.; Li, J.J.; He, X.Z.; Liu, X.; Wang, F. The status and sediment reduction effects of level terrace in the Loess Plateau. Yellow River 2015, 37, 89–93. [Google Scholar]
  49. Gao, Z.; Zhang, G.; Fan, H.; Ji, Q.; Li, A.; Zhang, Y.; Feng, B.; Yu, Y.; Ma, L.; Gao, J. Erosion-Transportation Processes Influenced by Spatial Distribution of Terraces in Watershed in the Loess Hilly–Gully Region (LHGR), China. Water 2022, 14, 1875. [Google Scholar] [CrossRef]
  50. Ding, W.; Wang, X.; Zhang, G.; Meng, X.; Ye, Z. Impacts of Grass Coverage and Arrangement Patterns on Runoff and Sediment Yield in Slope-Gully System of the Loess Plateau, China. Water 2022, 15, 133. [Google Scholar] [CrossRef]
  51. Zheng, M.; Cai, Q.; Wang, C.; Liu, J. Effect of vegetation and other measures for soil and water conservation on runoff-sediment relationship in watershed scale. J. Hydraul. Eng. 2007, 38, 47–53. [Google Scholar]
Figure 1. Schematic diagram and model diagram of slope scour model test. (a) LT measure; (b) NDT measure; (c) DT measure; (d) Scour model diagram.
Water 15 02764 g001
Figure 2. Schematic diagram of model design and monitoring. (a) Compacting soil layer; (b) Slope cutting along predetermined slope line; (c) Recording bucket replacement time; (d) Sampling and weighing; (e) Taking photos of the channel; (f) Measuring channel changes.
Water 15 02764 g002
Figure 3. Changes in relative depth after simulated rainfall in different measures. (a) LT measure; (b) NDT measure; (c) DT measure (Note: since the first three rainfalls in the DT measure, the water flow is all discharged from the drainage pipe and does not pass through the slope, so only the relative depth changes in the last three rainfalls are measured).
Water 15 02764 g003
Figure 4. Runoff and sediment concentration with three measures during simulated rainfall. (Note: the bar graph above the figure represents sediment concentration, while the bar graph below represents runoff.)
Water 15 02764 g004
Figure 5. Ten min runoff changes and sediment content changes on the loess slope with different measures during simulated rainfall. (a) Ten min runoff changes; (b) Ten min sediment changes. (Note: Since the rainfall duration in both spring and fall is 30 min, the dots in the box plot represent the mean values of the changes in runoff and sediment concentration averaged over three 10 min intervals. The “mean” label below indicates the specific average values.)
Water 15 02764 g005
Figure 6. Relationship between 10 min runoff and 10 min sediment content changes in different measure types under different rainfall.
Water 15 02764 g006
Table 1. Characteristics of model rainfall intensity.
Simulated SeasonSimulated TimesSimulated Flow (m3 h−1)Time
(min)
Prototype Rain Intensity (mm/d)
Spring20.433033.20
0.323029.20
Summer30.861063.20
1.6210118.24
1.241090.72
Fall10.323029.20
Table 2. The soil erosion depth at different rain times for LT, NDT, and DT measures.
MeasuresRain Time Soil Erosion Depth (cm)Proportion of Relative Depth Greater than 0
Minimum Maximum Mean Median
LT141.00122.8280.0377.030.21
249.00117.0677.1873.030.43
347.00121.0679.3676.440.64
448.00117.0675.1474.670.29
548.50117.0675.6873.260.57
647.00125.2573.0568.400.36
NDT142.9077.3061.4069.150.21
246.0075.0062.1567.850.64
345.1075.4061.1968.750.29
444.5080.0060.9267.400.29
545.0093.5064.4369.300.93
645.70101.0065.5168.000.43
DT437.50131.5077.8072.300.00
538.00128.5076.0669.550.17
638.20123.0075.8173.150.42
Note: the data in the table are the depths from the bottom of the model box.
Disclaimer/Publisher’s Note: The statements, opinions and data contained in all publications are solely those of the individual author(s) and contributor(s) and not of MDPI and/or the editor(s). MDPI and/or the editor(s) disclaim responsibility for any injury to people or property resulting from any ideas, methods, instructions or products referred to in the content.

