Abstract
The operating efficiency of high-head pump turbines is closely related to the internal hydraulic losses within the system. Conventional methods for calculating hydraulic losses based on pressure differences often lack detailed information on their distribution and specific sources. Additionally, the presence of splitter blades further complicates the hydraulic loss characteristics, necessitating further study. In this study, Reynolds-averaged Navier–Stokes (RANS) simulations were employed to analyze the performance of a pump turbine with splitter blades at three different head conditions and a guide vane opening (GVO) of 10°. The numerical simulations were validated by experimental tests using laser doppler velocimetry (LDV). Quantitative analysis of flow components and hydraulic losses was conducted using entropy production theory in combination with an examination of flow field distributions to identify the origins and features of hydraulic losses. The results indicate that higher heads are associated with lower growth rates of total hydraulic losses. In particular, the significant velocity gradients at the trailing edge of the splitter blades contribute to higher hydraulic losses. Furthermore, the hydraulic losses in the runner (RN) region are predominantly influenced by velocity gradients and not by vortices, with the flow conditions in the RN region impacting the hydraulic losses in the draft tube (DT).
1. Introduction
As the global demand for electricity continues to rise, the share of renewable energy power plants in power grids is growing rapidly. To cope with fluctuations in the power system caused by the disruption of renewable energy sources such as photovoltaics, hydroelectric power plants of different capacities are playing a crucial role in power grids [1]. Among these, pumped storage power plants, with their significant regulation capabilities, have become an important part of the grid regulation system [2]. As one of the central elements of pumped storage power plants, the pump turbine is of considerable research importance.
The performance of pump turbines in turbine mode is somewhat limited due to the need to operate in both directions. To optimize the performance of pump turbines, extensive hydraulic design studies have been conducted. Researchers typically employ numerical simulation methods [3,4,5,6,7] and model tests [8,9,10,11,12] as approaches for research on hydraulic machines. The hydraulic characteristics of pump turbines in turbine mode have been extensively investigated. Deng et al. [13] analyzed the vortex motion patterns and pressure pulsation characteristics of pump turbines in vaneless space in turbine mode using numerical simulations and experiments. Lai et al. [14,15] conducted experimental studies on the flow characteristics in the DT of a pump turbine in turbine mode and determined the connection between velocity distribution and vortex rope motion in the DT. While most researchers have focused on flow characteristics, hydraulic loss remains the key factor affecting turbine efficiency.
When studying hydraulic losses, the pressure difference method is typically used first. However, this method does not provide a specific distribution of hydraulic losses. Therefore, researchers have proposed various alternative methods to study hydraulic losses, such as the entropy production method and the local hydraulic loss method. The entropy production method, derived from thermodynamics, has been improved and widely employed in hydraulic loss studies.
In the initial decade of this century, scholars primarily focused on fundamental theoretical research. They engaged in theoretical derivations and modeling analyses to address core issues, utilizing entropy production theory to explore topics such as laminar and turbulent flow, the viscous layer of turbulent wall flows, and more [16]. Subsequently, an increasing number of researchers started employing entropy production theory as a crucial framework for investigating process mechanisms and fluid flow states in specific types of hydraulic machinery. This application aimed at optimizing performance, understanding energy dissipation in flows, and studying flow characteristics [16]. Yan et al. [17] utilized the entropy production method to investigate the hydraulic losses of a pump turbine in the S characteristic zone and found that the vortex flow in the guide vane (GV) zone and the DT contributed significantly to the hydraulic losses. Li et al. [18] applied the entropy production method to examine the hydraulic losses of a pump turbine in the hump region and concluded that rotating stall in this region was a major source of hydraulic losses. Therefore, the entropy production method is well suited for studying hydraulic losses in pump turbines. The local hydraulic loss method, established by Qin et al. [19], was specifically applied to the study of hydraulic losses in pump turbines. Currently, the entropy production method is more widely used due to its superior accuracy. Although entropy production methods have been widely used in the study of energy losses in pump turbines, research on pump turbines with splitter blades has not been conducted.
As a means of validating and supplementing numerical simulations, non-contact measurement methods are widely used in hydromechanics. Two main techniques commonly used in hydraulic machines are particle image velocimetry (PIV) and LDV. PIV is well suited for studying the evolution of flow structures [20,21], while LDV offers higher accuracy in local velocity measurements [22,23]. When the velocity of a point needs to be measured in pump turbines, the LDV technique has become the preferred experimental approach due to its superior accuracy.
This paper investigates the mechanism of hydraulic losses in pump turbines operating in turbine mode at different heads. Numerical simulations are performed and validated by LDV tests. The study utilizes the entropy production method to analyze hydraulic losses and explores the relationship between losses and heads in conjunction with flow field analysis. The findings contribute to a better understanding of the hydraulic performance of pump turbines and provide insights into improving efficiency and operation.
2. Theory of the Simulation
2.1. Turbulence Model and Entropy Production Theory
In the numerical simulations, Navier–Stokes equations based on Reynolds time averaging were used, and the SST k-ω turbulence model was used [24,25,26,27,28].
The entropy production rate (EPR) of the time-averaged Reynolds flow includes the direct entropy rate caused by the time-averaged velocity and the indirect entropy rate caused by the pulsation velocity; the EPR is shown in Equation (1). The EPR caused by direct dissipation (EPDD) is shown in Equation (2), and the EPR caused by turbulence dissipation (EPTD) is calculated using Equation (3).
where , , and denote EPR, EPDD, and EPTD, respectively, in m–3·K–1; , , and denote the time-averaged velocity components in m/s; , , and denote the pulsating velocity components in m/s; T indicates temperature in Kelvin; μeff is the effective dynamic viscosity of fluid in Pa·s; β is an empirical constant, approximated as 0.09; k denotes the turbulent kinetic energy in m2/s2; and ω denotes the turbulent vortex frequency in s–1.
The EPR caused by wall shear stress (EPWS) is calculated using Equation (4):
where denotes EPWS, W·m−2·K−1; and indicate the shear stress and velocity near the wall, respectively.
The TEP (sum of the integrals for each entropy production rate) can be obtained by integrating , and , respectively, over the computational domain with subsequent summation.
where denotes the TEP.
2.2. Calculation Domain and Mesh Generation
The pump turbine model is derived from real units in high-head pumped storage power plants and is created using Unigraphics NX software to achieve high-precision modeling across the entire computational domain based on design blueprints. The pump turbine model used in the numerical simulation is shown in Figure 1, and the geometric parameters of the pump turbine are shown in Table 1.
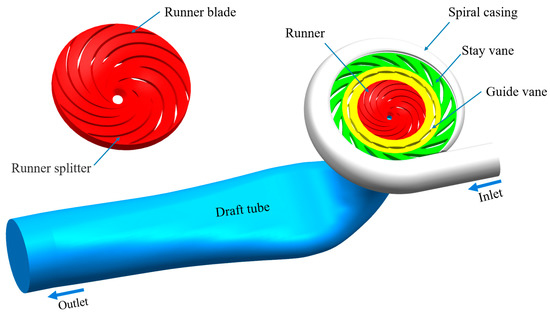
Figure 1.
Calculation domain of pump-turbine.

Table 1.
Geometric parameters of pump-turbine.
The full flow channel of the pump turbine was meshed using ICEM-CFD. The final grid information is shown in Table 2. The full computational domain grid is shown in Figure 2. The cell growth ratio was set to 1.2 at all the wall boundaries.

Table 2.
Pump turbine grid information.
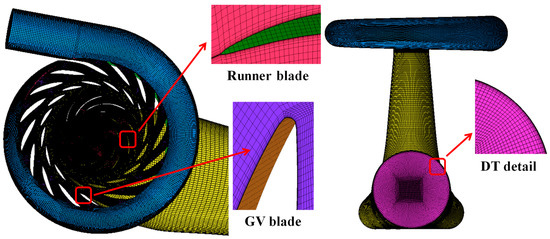
Figure 2.
Grid scheme of the pump turbine.
2.3. Grid Independence Verification
Seven grids were formed, and the numbers of grid cells were about 2,130,000, 3,150,000, 4,210,000, 6,380,000, 8,390,000, 9,560,000, and 11,220,000, respectively. A sensitivity analysis of the key parameters of the external characteristics of the unit, namely, efficiency and torque, was carried out, as shown in Figure 3. It was found that an increase in the number of grid cells could significantly improve the accuracy of the key parameters. The efficiency and torque values remain stable after a grid number greater than 8 million. To further determine the influence of the grid on the calculations, an independence analysis of the grids was performed.
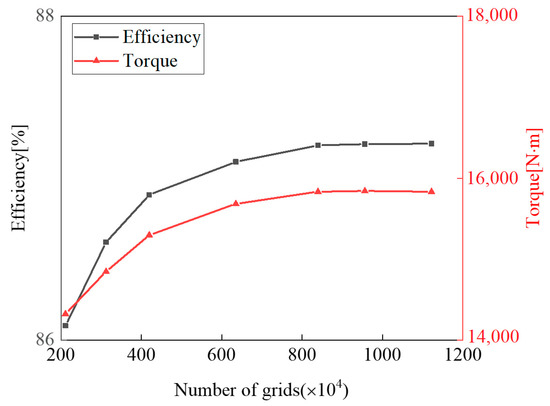
Figure 3.
Grid sensitivity analysis.
To confirm grid independence in this study, the Richardson extrapolation method was utilized [29,30,31,32]. Moreover, the grid convergence index (GCI) was employed to quantitatively assess the convergence of the computational results. The GCI can be calculated using the following formula:
where is the safety factor, typically 1.25; is the relative error of the two sets of grid numerical value and ; is the grid number of G1; is grid refinement factor; is the convergence accuracy; and are the difference between the two sets of numerical values of the grid.
Three groups of grid plans were selected, namely, G1: 11,220,000, G2: 8,390,000, and G3: 3,150,000, which were involved in the verification of grid accuracy with flow rate and efficiency. The GCIs of flow and efficiency involved in the grid independence verification were less than 3.0% when the grid number was 11,220,000, indicating that the grid number of G1 met the requirements of computational accuracy. Grid independence verification information is shown in Table 3.

Table 3.
Grid independence verification.
2.4. Boundary Conditions and Case Information
ANSYS-Fluent software (Ansys, Inc., Canonsburg, PA, USA) was used for the numerical simulation, and the pressure boundary was used for both the inlet and outlet of the computational domain. The inlet boundary pressure is specified using a head value, while the outlet boundary pressure is set to 0. The rotating component moves using the Moving reference frame, and the rotational speed is set to a test value. The SIMPLEC algorithm is used to solve the flow fields, the second order upwind format is used to discretize the convective terms and diffusive terms, the wall condition is set to no-slip wall, and the root mean square of the residuals is set to 10–5 [28]. During the simulation, the interface between the rotating domain and the static domain is dealt with by means of the frozen rotor. This method is usually used for steady calculations, which reduce computational requirements by assuming that the flow field does not change significantly during one rotor revolution. The characteristic operating points during the actual operation of the power plant were selected for the study. The case information is shown in Table 4.

Table 4.
Simulation case selection (all data in the table is from test data are used as boundary conditions for simulation).
3. Experimental Test and Validation
3.1. Test Rig
The model pump turbine was tested on a general hydraulic–mechanical test rig, as shown in Figure 4, and the external characteristics of the unit and the velocity distribution in the DT were obtained. The test bench parameters are shown in Table 5.

Figure 4.
General test rig of reaction turbine.

Table 5.
Test rig parameters.
The structure of the LDV system is shown in Figure 5a, the parameters are shown in Table 6, and the test site is shown in Figure 5b.
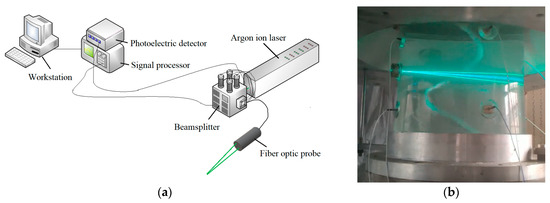
Figure 5.
LDV test system. (a) Structure of LDV test system. (b) Test site.

Table 6.
Parameters of LDV test system.
3.2. Computational Validation
In order to facilitate the comparison of the velocity distribution in the DT obtained from the numerical simulation and the experiment, the velocity in the DT must be dimensionless.
where Cu denotes the tangential velocity coefficient; Cm denotes the axial velocity coefficient; Vu and Vm denote the velocity obtained by the test or numerical simulation, respectively, in m/s; n is the rotational speed in rev/min; and D1 is the RN inlet diameter of the pump turbine in m.
The head HM of the model test is determined from Equation (17):
where H is the head; HM is the model test head, m; nM is the rotational speed of model pump-turbine, rev/min; DM is the RN inlet diameter of model pump-turbine, m.
The external characteristics and velocity distribution of the DT of Case 1 were compared, as shown in Figure 6.
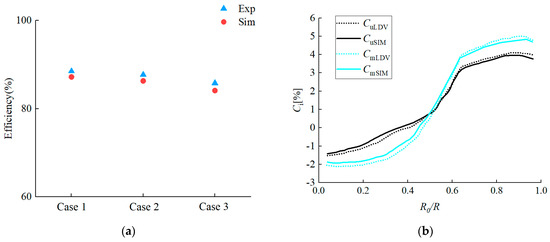
Figure 6.
Comparison between numerical simulation and experimental results: (a) efficiency; (b) velocity distribution of DT (CuSim and CmSim denote the velocity coefficient obtained in CFD, and CuLDV and CmLDV denote the velocity coefficient obtained in LDV).
As seen in Figure 6a, the efficiency values obtained from the three cases were very close to the efficiency values obtained from experimental testing, indicating that the simulated external characteristics were accurate. As seen in Figure 6b, the distribution of the simulated axial velocity coefficient and tangential velocity coefficient in the draft tube exhibited the same trend and almost identical values as the experimental results, indicating that the simulated internal flow within the unit was accurate.
4. Results and Analysis
4.1. Total Energy Loss
In order to accurately calculate the energy loss in the pump turbine under characteristic heads, the entropy production method was utilized; it mainly consists of three terms, namely, EPDD, EPTD, and EPWS. In addition, to describe the TEP increment ratio quantitatively compared to Case 1, the growth ratio (γ) is defined as
where γ1, γ2, and γ3 represent the TEP values in Cases 1, 2, and 3, respectively.
Figure 7 illustrates the entropy production values and growth rates for different entropy terms under three operating conditions. The TEP gradually decreased from Case 1 to Case 3, indicating lower total energy losses at higher heads, consistent with the data in Table 4. Among the three entropy terms, EPTD was the dominant factor, followed by EPWS and EPDD. Specifically, the EPTD accounted for over 98% in all three cases (Figure 7a). Under the turbine condition with the high head, the flow rate of the unit was large, resulting in a large velocity gradient inside the unit, and the EPDD term was closely related to the velocity gradient, which led to a significant increase in the EPDD term in Cases 2 and 3. The efficiency of the unit was higher under the condition of a high water head, indicating that the flow regime of a high head is better. Since the EPTD of the simplified calculation was controlled by the turbulent kinetic energy, the EPTD terms of Cases 2 and 3 were significantly reduced. The large flow in the unit under the high head led to the increase of the velocity in the near-wall region. Since the EPWS item was affected by the near-wall velocity, the EPWS growth rate of Case 2 and Case 3 was significant. Additionally, the negative growth rates of –3.03% and –9.42% for Cases 2 and 3, respectively, compared to the EPTD in Case 1, indicated a decrease in intra-unit turbulence intensity with increasing flow rates (Figure 7b).
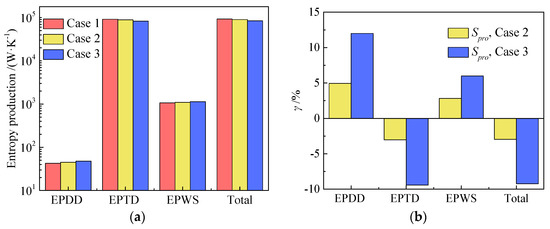
Figure 7.
Entropy production of different entropy terms in three cases and the growth rate relative to case 1: (a) Entropy production; (b) growth rate.
Figure 8 depicts the TEP of the five components for the three cases and their growth rates compared to Case 1. Among the five components, the DT contributed the most to the TEP, followed by the RN, GV, SV, and SC. It was observed that the energy losses increased significantly along the flow direction (Figure 8a). The SC, SV, and GV components were mainly affected by inlet boundary conditions since they are inlet components of the unit. Consequently, the growth rates of the SC, SV, and GV components were more pronounced in Case 2 and Case 3 than the TEP growth rate in Case 1. Furthermore, the TEP growth rate of the impeller in Case 3 was significantly lower than that in Case 2 (–15.74% vs. –6.46%). This indicates that the RN’s efficiency zone is at a higher head (Figure 8b).
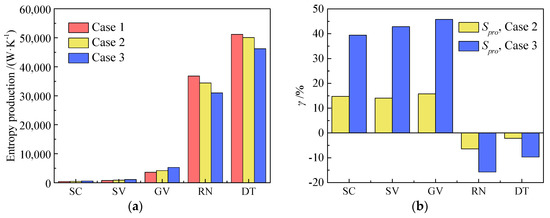
Figure 8.
TEP of different unit components for three investigated cases, and the growth rate relative to Case 1: (a) TEP; (b) growth rate.
4.2. Analysis of Flow Characteristics in Inlet Components
In turbine mode, the pressure difference between the inlet and outlet of the pump turbine served as the primary driving force for the water flow, with energy losses occurring during energy conversion. The improved flow patterns in the inlet components (SC, SV, GV) contributed to lower energy losses in these components, accounting for 5.2%, 6.2%, and 8.3% in the three cases, respectively (Figure 8a).
To facilitate the comparison of the pressure distribution of the inlet part of the pump turbine in three cases (Figure 9), the dimensionless pressure coefficient Cp can be written as
where p0 means the average static pressure at the inlet of the SC, pa.

Figure 9.
Cp value distributions on the horizontal plane of the inflow part of the pump turbine in three cases.
As shown in Figure 9, from the inlet of the worm shell to the outlet of the GV, the pressure gradually decreased, resulting in a more evenly distributed Cp value. This indicates that the number of SV and GV was set correctly, effectively balancing the water pressure created by high heads. The presence of a distinct high Cp region at the leading edge of SV and GV indicated a higher static pressure in this region. Compared to Case 1, the region with low Cp values (dark blue) near the interface between GV and RN was larger in Case 3, indicating a faster pressure drop in the inlet component under high head conditions.
Figure 10 illustrates the streamline distribution on the horizontal surface of the inlet components. In all three cases, the streamlines in the inflow part were smooth, without significant vortex formation, which was related to the proper GV angle and proper boundary conditions. Additionally, the velocity gradually increased along the flow direction, with the most pronounced increase occurring after the GV, as the water flow section through the GV area decreased. Since the GVO remained the same at 10° in all three cases, there was no significant difference in the streamline patterns. However, comparing Case 1 to Case 3, the velocity at the outlet of GV was higher in Case 3 due to the elevated flow rate under high head conditions.

Figure 10.
Velocity streamlines on the horizontal plane of the inflow part of the pump turbine in three cases.
Figure 11 shows the EPR distribution on the horizontal plane of the inlet components, specifically EPDD and EPTD. In all three cases, a distinct region of high EPR was observed at the trailing edge of the GV, corresponding to a significant velocity gradient within this area. Additionally, the energy loss at the SV trailing edge was smaller than that at the GV trailing edge, while the EPR value was lowest in the SC region, which agreed with the TEP distribution of the three inlet components (Figure 8a). It is noteworthy that the increase in EPR values was most pronounced in Case 3 when compared to Case 1, indicating that the higher flow rate led to larger energy losses within the inlet components and consequently to a higher TEP growth rate for the inlet components in Case 3 (Figure 8b).

Figure 11.
EPR distributions on the horizontal plane of the inflow part of the pump turbine in three cases.
4.3. Analysis of the Flow Characteristics in RN
The RN is the key component responsible for energy conversion in a water pump turbine, and its internal flow characteristics have a direct impact on energy conversion efficiency. The pressure difference on both sides of the blade is the main driving force for RN rotation, which will greatly affect the flow state inside the unit. Figure 12 displays the Cp value distribution at different span-wise surfaces of RN in the three cases. Here, span represents the dimensionless distance from hub to shroud, indicating the position of the blade-to-blade surface. For example, span = 0 indicates the blade-to-blade surface at the hub, and span = 1 indicates the blade-to-blade surface at the shroud. It can be clearly seen that the pressure inside the RN gradually decreased from the inlet to the outlet. At span = 0.05, the Cp value of the pressure side (PS) of the rotor blade was much higher than that of the suction side (SS), indicating that the pressure difference between the PS side and the SS side of the rotor blade drives the impeller to rotate. Moreover, the pressure difference on both sides of the blades was greater than that of the splitters, indicating that the ability of the splitter to drive the rotation of the impeller is weaker than that of the blades. At span = 0.5 and 0.95, the Cp distribution in the RN was consistent with that at span = 0.05, indicating that the pressure distribution of different spans is basically the same. Under the three different cases, the distribution of Cp inside the RN was basically the same, indicating that the design of the impeller of the unit is reasonable, and the pressure distribution inside the RN is basically unchanged within the operating range of the characteristic head.
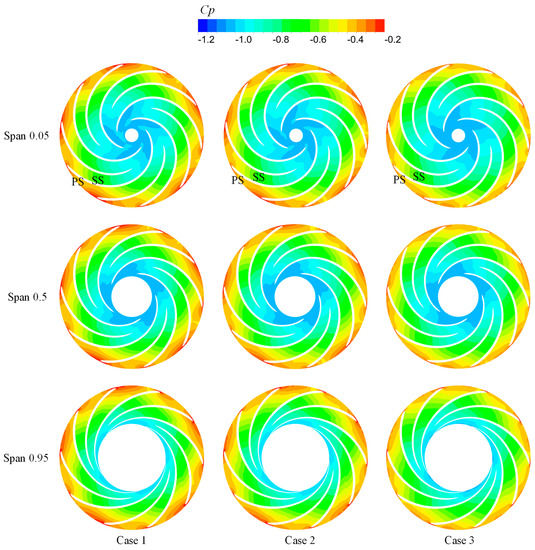
Figure 12.
Cp value distribution at different span-wise surfaces of RN in the three cases.
In order to allow for a clearer comparison of the impeller flow characteristics in the three cases, Figure 13 intentionally shows the relative velocity streamlines at various deployed surfaces within the RN domain. In Case 1, where span = 0.05, the speed decreased continuously during water flow from the leading edge to the trailing edge of the blade. At this point, the energy of the water was gradually converted into the rotational mechanical energy of the blade. At this point, the velocity on the PS of the rotor blade was much higher than on the SS, suggesting that the water flow on the PS side was the main driving force for the rotation of the RN. Simultaneously, the alternating distribution of blades and splitters also influenced the flow pattern, making the flow pattern inside the impeller asymmetric. Compared to the velocity on the PS side of the blades, the velocity on the PS side of the splitters was higher, while the velocity on the SS side of the splitter was lower. Starting from the energy conversion of rotating machinery, the distribution of pressure and flow velocity at the inlet and outlet sections of the impeller was relatively uniform. However, considering that the geometric length of the splitter along the flow direction was shorter than that of the blades, the force bearing area of the splitter was smaller, and the velocity gradient nearby was larger. Compared to the case with span = 0.05 in Case 1, the velocity on the PS of the splitters at span = 0.5 was slightly lower, and the velocity at the RN outlet was also slightly lower. At the same time, the relative velocity streamlines between the blades were smoother at span = 0.5, indicating a better flow pattern at the center line of the blade profile. Furthermore, at span = 0.95, the relative velocity flow direction on the SS side of the leading edge of the splitters deviated from the center line of the blade profile, and there was noticeable low-speed recirculation on the SS side of the trailing edge of the long blades. Comparing the three different cases, it was noticeable that in Case 3, the velocity difference between the two sides of the RN was smaller, with a lower velocity on the PS side and a higher velocity on the SS side. Additionally, the relative velocity streamlines between the blades in Case 3 were smoother and aligned better with the center line of the blade profile. This indicated that Case 3 had the best flow pattern, followed by Case 2, and Case 1 had the worst performance.
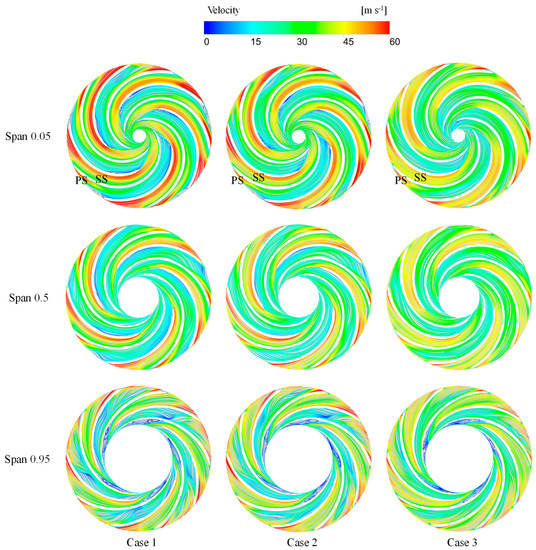
Figure 13.
Relative velocity streamlines at different span-wise surface of RN in three cases.
To investigate the relationship between vortices and energy loss within the RN, absolute helicity, defined as the absolute value of the dot product between the velocity vector and vorticity vector, was used to characterize the degree of vortex spiralization. Energy loss is represented by EPR. Figure 14 and Figure 15 show the distribution of absolute helicity and EPR at different unfolded surfaces of the RN domain. For span = 0.05 in Case 1, the leading edge of the splitter on the SS exhibited high helicity and high EPR, indicating significant vortex spiraling and energy loss in this area. At span = 0.5 in Case 1, there was high EPR and high-velocity flow at the trailing edge of the splitter, but no appreciable helicity, suggesting that the energy loss in this region was mainly due to the large velocity gradient and not the presence of vortices. In Case 1, the helicity distribution inside the impeller at span = 0.95 presented obvious asymmetry, and the leading edge of the splitter had obvious high helicity and energy loss, indicating that the high-speed flow off the centerline existed at the leading edge of the splitter. Significant helicity leads to significant energy loss. At the same time, compared with span = 0.5, the flow direction of the relative velocity near the leading edge of the SS side splitter at span = 0.95 deviated more from the centerline of the blade profile, resulting in higher helicity and EPR, thus exacerbating the impeller internal flow state asymmetry. Comparing the three cases, it was observed that the RN domain in Case 3 had the smoothest streamlines, the lowest helicity, and the lowest EPR. This contributed to the lowest TEP within the RN in Case 3. Consequently, as the head increased, the flow pattern within the RN domain improved, resulting in a reduction in overall helicity and EPR and ultimately a reduction in TEP within the RN (Figure 8).
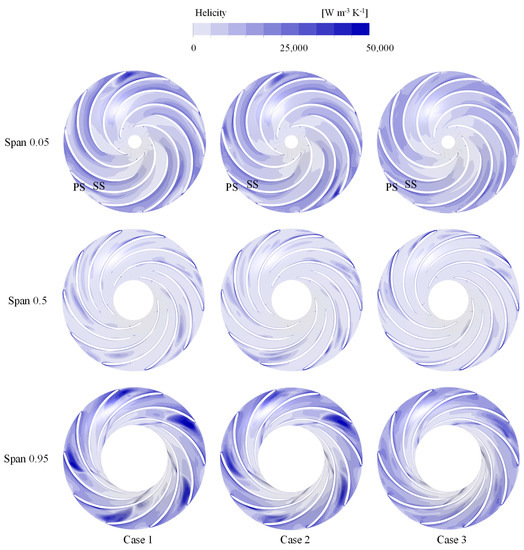
Figure 14.
Helicity distributions at different span-wise surface of RN in three cases.
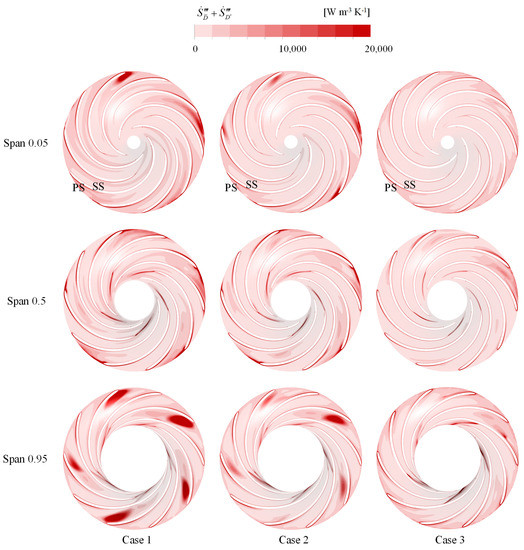
Figure 15.
EPR distributions at different span-wise surface of RN in three cases.
In the process of flowing from the leading edge of the RN to the trailing edge, the water flow gradually transitioned from the state of rotating around the axis to the state of axial outflow. The swirling degree is closely related to the operating efficiency of the unit and the flow state in the RN. In order to quantitatively describe the degree of swirl in the RN under three characteristic water heads, the swirl number (Sw) is calculated as follows [33]:
where Ua is the axial velocity, Ut is tangential velocity, and R is the hydraulic radius, representing the impeller radius.
Figure 16 represents the Sw values on different horizontal planes of RN in the three cases. According to the physical structure of the RN, it could be divided into three regions: R1 is the region where the water flows in tangentially, R2 is the transition region, and R3 is the region where the water flows out axially. It can be clearly seen that the Sw value in the R1 domain was much greater than 1.0, indicating that the tangential velocity of the water flow was much greater than the axial velocity. Moreover, the Sw value dropped sharply along the axial direction, which showed that the kinetic energy of the water flow was quickly converted into the rotational mechanical energy of RN, which was also related to the greater pressure difference between the two sides of the blade in the R1 domain. In the R2 domain, the Sw value was less than 1.0, indicating that the main flow direction of the water flow was axial. At the same time, the Sw value decreased slowly along the axial direction, and it could be seen that the energy transferred by the water flow to RN was reduced. In the R3 domain, the Sw value was maintained at a low level, far below 1.0, and the velocity circulation still existed in the outlet domain. Comparing the three cases, it could be seen that on the same level, the Sw value of case 1 was the highest, followed by case 2, and that of case 3 was the least. Especially in the R3 domain, the average Sw values of the three cases were 0.23, 0.22, and 0.19, respectively. It could be seen that the velocity circulation of the water flow in Case 3 was the smallest, which was also the performance of Case 3 with less energy loss.
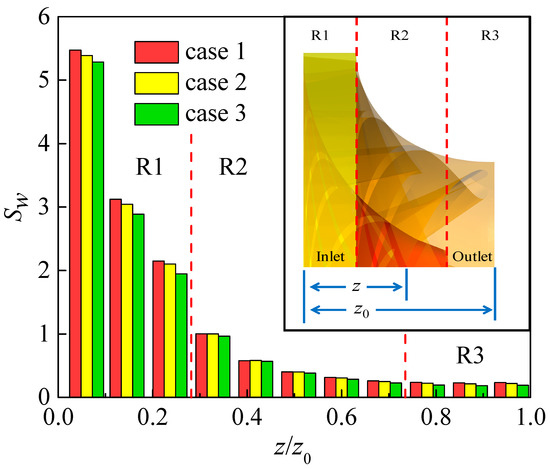
Figure 16.
Swirl number on different horizontal planes of RN in three cases.
4.4. Analysis of the Flow Characteristics in DT
Based on the calculation results of the entropy production in Figure 7, it was observed that the TEP in the DT was larger than that in the RN domain. This was partly due to the presence of significant turbulence at the RN outlet and the larger integration volume of EPR in the DT. Since EPTD was the main contributor to the TEP in the system and was calculated indirectly from the turbulent kinetic energy, analyzing the level of turbulence in the DT could help identify the source of the energy loss. By examining the streamlines in the DT domain, as shown in Figure 17, it could be seen that there was significant tangential velocity at the inlet of the DT and that the velocity near the wall was much higher than that in the central region of the DT. Additionally, the overall flow velocity decreased from the inlet to the outlet of the DT. Figure 18, Figure 19 and Figure 20 represent the distribution of TKE, spiralization, and EPR on the vertical plane of the DT, respectively. In Case 1, there was significant spiralization near the wall in the inlet region of the DT, consistent with the tangential flow distribution. Moreover, the inlet region of the DT exhibited high TKE and EPR values, and their distributions closely matched, indicating that the high level of turbulence in the inlet region resulted in significant energy loss. Moreover, regions of high EPR in the DT exhibited relatively low spiralization, suggesting that the increase in TKE was caused by the velocity gradient rather than the presence of vortices. Comparing the three different cases, it is clear that Case 3 had significantly lower TKE and EPR values compared to Case 1 and Case 2, indicating that the improved flow properties in the RN domain reduced the turbulence level and energy loss in the DT.

Figure 17.
Velocity streamlines in DT of the pump turbine in three cases.

Figure 18.
Turbulence Kinetic Energy distributions on the vertical plane of DT in three cases.

Figure 19.
Helicity distributions on the vertical plane of DT in three cases.

Figure 20.
EPR distributions on the vertical plane of DT in three cases.
5. Conclusions
In this paper, the hydraulic loss mechanism of a high-head pump turbine with splitter blades was studied using three-dimensional visualization techniques. The numerical simulation was verified by an experimental LDV test, and the velocity coefficients at the section of the draft tube were in good agreement. Using entropy generation theory combined with the flow field distribution, the hydraulic loss and internal flow state changes of the unit under three characteristic heads, such as velocity, pressure, helicity, and EPR, were compared to explore the root causes and characteristics of the hydraulic loss. The following main conclusions were drawn:
- (1)
- Among the three terms of entropy production, EPTD dominates, accounting for over 98% of the TEP. Within the five flow components, RN and DT play a dominant role, and TEP increases significantly along the flow direction. In all three cases, the growth rate of TEP decreases with increasing head, suggesting that the high-efficiency region of the turbine is at high-head operating conditions.
- (2)
- In the inlet components, the presence of a large velocity gradient at the trailing edge of the GV leads to a significant EPR. Furthermore, under high head conditions, the higher flow rate increases the velocity in the GV area, increasing the velocity gradient at the trailing edge and causing more energy loss. The average energy loss growth rate of inlet components in case 2 and case 3 are 14.87% and 42.69%, respectively.
- (3)
- In the RN domain, at spans of 0.05 and 0.95, the high spiralization and high EPR are observed at the leading edge of the splitter on SS where the flow direction deviates from the center line of the blade profile. This deviation, together with the high flow velocity, leads to significant spiraling and significant energy losses. At span = 0.5, the high EPR and high flow velocity are observed at the trailing edge of the splitter, with no appreciable spiralization occurring. This indicates that the energy loss in this region is mainly due to the large velocity gradient and not to the presence of vortices. In the RN domain, the Sw value continues to decrease along the axial direction, indicating that the water kinetic energy is continuously converted into the rotational mechanical energy of the RN. Especially in the R3 domain, the average Sw values of the three cases are 0.23, 0.22, and 0.19, respectively.
- (4)
- In Case 1, the region close to the wall in the inflow section of the DT exhibits a high tangential velocity, which leads to significant spiralization. Additionally, the central region of the inflow section with large velocity gradients generates higher TKE and EPR. Case 3 shows significantly lower TKE and EPR values compared to Case 1, indicating that the improved flow properties in the RN domain reduce turbulence and energy losses in the DT.
Author Contributions
Conceptualization, Z.G. and D.L.; methodology, Z.X.; software, L.X.; validation, Z.X., F.Z. and Y.Z. (Yifeng Zhao); formal analysis, Z.X.; investigation, Z.X.; resources, Z.G.; data curation, L.X.; writing—original draft preparation, Z.G.; writing—review and editing, K.K.; visualization, Y.Z. (Yuan Zheng); supervision, K.K.; project administration, Y.Z. (Yuan Zheng); funding acquisition, Z.G. All authors have read and agreed to the published version of the manuscript.
Funding
This work was supported by the Science and Technology Project of State Grid Xinyuan Co., LTD. (Grant No. SGXYKJ-2022-044).
Data Availability Statement
Not applicable.
Acknowledgments
The authors are also grateful for the support of Hohai University.
Conflicts of Interest
The authors declare no conflict of interest.
References
- Kan, K.; Binama, M.; Chen, H.; Zheng, Y.; Zhou, D.; Su, W.; Muhirwa, A. Pump as turbine cavitation performance for both conventional and reverse operating modes: A review. Renew. Sustain. Energy Rev. 2022, 168, 112786. [Google Scholar] [CrossRef]
- Mahfoud, R.J.; Alkayem, N.F.; Zhang, Y.; Zheng, Y.; Sun, Y.; Alhelou, H.H. Optimal Operation of Pumped Hydro Storage-Based Energy Systems: A Compendium of Current Challenges and Future Perspectives. Renew. Sustain. Energy Rev. 2023, 178, 113267. [Google Scholar] [CrossRef]
- Xu, L.; Liu, D.; Li, Z.; Zhao, X.; Liu, X. Experimental and Numerical Simulation Research on Flow Characteristics of Model Pump-Turbine in Four-Quadrant Operating Quadrants. J. Energy Storage 2022, 54, 105083. [Google Scholar] [CrossRef]
- Li, W.; Li, Z.; Han, W.; Li, Y.; Yan, S.; Zhao, Q.; Gu, Z. Pumping-Velocity Variation Mechanisms of a Ferrofluid Micropump and Structural Optimization for Reflow Inhibition. Phys. Fluids 2023, 35, 052005. [Google Scholar] [CrossRef]
- Kan, K.; Chen, H.; Zheng, Y.; Zhou, D.; Binama, M.; Dai, J. Transient Characteristics during Power-off Process in a Shaft Extension Tubular Pump by Using a Suitable Numerical Model. Renew. Energy 2021, 164, 109–121. [Google Scholar] [CrossRef]
- Li, W.; Li, Z.; Han, W.; Li, Y.; Yan, S.; Zhao, Q.; Chen, F. Measured Viscosity Characteristics of Fe3O4 Ferrofluid in Magnetic and Thermal Fields. Phys. Fluids 2023, 35, 012002. [Google Scholar] [CrossRef]
- Kan, K.; Zhang, Q.; Xu, Z.; Zheng, Y.; Gao, Q.; Shen, L. Energy Loss Mechanism Due to Tip Leakage Flow of Axial Flow Pump as Turbine under Various Operating Conditions. Energy 2022, 255, 124532. [Google Scholar] [CrossRef]
- Jia, X.; Lv, H.; Zhu, Z. Research on The Influence of Impeller Tip Clearance on The Internal Flow Loss of Axial Circulating Pump under Unpowered Driven Condition. ASME J. Fluids Eng. 2022, 145, 021202. [Google Scholar] [CrossRef]
- Xu, Z.; Liu, X.; Xu, X.; Li, Y.; Zheng, Y.; Zhong, Z.; Wan, J.; Dai, Q. Similarity of pressure pulsation between prototype and model pumps. J. Drain. Irrig. Mach. Eng. 2023, 41, 224–230. (In Chinese) [Google Scholar]
- Li, W.; Li, Z.; Qin, Z.; Yan, S.; Wang, Z.; Peng, S. Influence of the Solution PH on the Design of a Hydro-Mechanical Magneto-Hydraulic Sealing Device. Eng. Fail. Anal. 2022, 135, 106091. [Google Scholar] [CrossRef]
- Jia, X.; Lv, H.; Zhu, Z. Unsteady Flow Characteristics of an Axial Flow Pump Based on Energy Loss and Vortex Identification under Rotating Stall Condition. J. Process Mech. Eng. 2022. [Google Scholar] [CrossRef]
- Li, D.; Qin, Y.; Wang, J.; Zhu, Y.; Wang, H.; Wei, X. Optimization of blade high-pressure edge to reduce pressure fluctuations in pump-turbine hump region. Renew. Energy 2022, 181, 24–38. [Google Scholar] [CrossRef]
- Deng, W.; Xu, L.; Li, Z.; Tang, W.; Wang, X.; Shang, L.; Liu, D.; Liu, X. Stability Analysis of Vaneless Space in High-Head Pump-Turbine under Turbine Mode: Computational Fluid Dynamics Simulation and Particle Imaging Velocimetry Measurement. Machines 2022, 10, 143. [Google Scholar] [CrossRef]
- Lai, X.-D.; Liang, Q.-W.; Ye, D.-X.; Chen, X.-M.; Xia, M.-M. Experimental Investigation of Flows inside Draft Tube of a High-Head Pump-Turbine. Renew. Energy 2019, 133, 731–742. [Google Scholar] [CrossRef]
- Lai, X.; Chen, X.; Liang, Q.; Ye, D.; Gou, Q.; Wang, R.; Yan, Y. Experimental and Numerical Investigation of Vortex Flows and Pressure Fluctuations in a High-Head Pump-Turbine. Renew. Energy 2023, 211, 236–247. [Google Scholar] [CrossRef]
- Zhou, L.; Hang, J.; Bai, L.; Krzemianowski, Z.; El-Emam, M.A.; Yasser, E.; Agarwal, R. Application of Entropy Production Theory for Energy Losses and Other Investigation in Pumps and Turbines: A Review. Appl. Energy 2022, 318, 119211. [Google Scholar] [CrossRef]
- Qin, Y.; Li, D.; Wang, H.; Liu, Z.; Wei, X.; Wang, X. Investigation on Hydraulic Loss Component and Distribution in Hydraulic Machinery: A Case Study of Pump-Turbine in Pump Mode. J. Energy Storage 2022, 52, 104932. [Google Scholar] [CrossRef]
- Yan, X.; Kan, K.; Zheng, Y.; Chen, H.; Binama, M. Entropy Production Evaluation within a Prototype Pump-Turbine Operated in Pump Mode for a Wide Range of Flow Conditions. Processes 2022, 10, 2058. [Google Scholar] [CrossRef]
- Li, D.; Gong, R.; Wang, H.; Xiang, G.; Wei, X.; Qin, D. Entropy Production Analysis for Hump Characteristics of a Pump Turbine Model. Chin. J. Mech. Eng. 2016, 29, 803–812. [Google Scholar] [CrossRef]
- Liu, D.; Xu, W.; Zhao, Y. Experimental Study of the Flow Field of a High Head Model Pump Turbine Based on PIV Technique. J. Hydrodyn. 2021, 33, 1045–1055. [Google Scholar] [CrossRef]
- Xu, L.; Jin, X.; Li, Z.; Deng, W.; Liu, D.; Liu, X. Particle Image Velocimetry Test for the Inter-Blade Vortex in a Francis Turbine. Processes 2021, 9, 1968. [Google Scholar] [CrossRef]
- Deng, W.; Li, Z.; Ji, L.; Shang, L.; Liu, D.; Liu, X. Laser Doppler Velocimetry Test of Flow Characteristics in Draft Tube of Model Pump Turbine. Processes 2022, 10, 1323. [Google Scholar] [CrossRef]
- Ji, L.; Xu, L.; Peng, Y.; Zhao, X.; Li, Z.; Tang, W.; Liu, D.; Liu, X. Experimental and Numerical Simulation Study on the Flow Characteristics of the Draft Tube in Francis Turbine. Machines 2022, 10, 230. [Google Scholar] [CrossRef]
- Han, Y.; Tan, L. Experimental investigation on spatial-temporal evolution of tip leakage cavitation in a mixed flow pump with tip clearance. Int. J. Multiph. Flow 2023, 164, 104445. [Google Scholar] [CrossRef]
- Kan, K.; Xu, Z.; Chen, H.; Xu, H.; Zheng, Y.; Zhou, D.; Muhirwa, A.; Maxime, B. Energy Loss Mechanisms of Transition from Pump Mode to Turbine Mode of an Axial-Flow Pump under Bidirectional Conditions. Energy 2022, 257, 124630. [Google Scholar] [CrossRef]
- Menter, F.R. Two-Equation Eddy-Viscosity Transport Turbulence Model for Engineering Applications. AIAA J. 1994, 32, 1598–1605. [Google Scholar] [CrossRef]
- Chen, G.; Gu, C.; Hajaiej, H.; Morris, P.J.; Paterson, E.G.; Sergeev, A. OpenFOAM computation of interacting wind turbine flows and control (I): Free rotating case. Int. J. Hydromechatron. 2021, 4, 1–26. [Google Scholar] [CrossRef]
- Ciappi, L.; Stebel, M.; Smolka, J.; Cappietti, L.; Manfrida, G. Analytical and Computational Fluid Dynamics Models of Wells Turbines for Oscillating Water Column Systems. J. Energy Resour. Technol. 2021, 144, 050903. [Google Scholar] [CrossRef]
- Xu, Z.; Zheng, Y.; Kan, K.; Chen, H. Flow Instability and Energy Performance of a Coastal Axial-Flow Pump as Turbine under the Influence of Upstream Waves. Energy 2023, 272, 127121. [Google Scholar] [CrossRef]
- Ji, L.; Li, W.; Shi, W.; Tian, F.; Agarwal, R. Effect of blade thickness on rotating stall of mixed-flow pump using entropy generation analysis. Energy 2021, 236, 121381. [Google Scholar] [CrossRef]
- Kan, K.; Yang, Z.; Lyu, P.; Zheng, Y.; Shen, L. Numerical Study of Turbulent Flow Past a Rotating Axial-Flow Pump Based on a Level-Set Immersed Boundary Method. Renew. Energy 2021, 168, 960–971. [Google Scholar] [CrossRef]
- Li, J.; Sui, T.; Dong, X.; Gu, F.; Su, N.; Liu, J.; Xu, C. Large eddy simulation studies of two-phase flow characteristics in the abrasive flow machining of complex flow ways with a cross-section of cycloidal lobes. Int. J. Hydromechatron. 2022, 5, 136–166. [Google Scholar] [CrossRef]
- Morris, C.E.; O’Doherty, D.M.; Mason-Jones, A.; O’Doherty, T. Evaluation of the swirl characteristics of a tidal stream turbine wake. Int. J. Mar. Energy 2016, 14, 198–214. [Google Scholar] [CrossRef]
Disclaimer/Publisher’s Note: The statements, opinions and data contained in all publications are solely those of the individual author(s) and contributor(s) and not of MDPI and/or the editor(s). MDPI and/or the editor(s) disclaim responsibility for any injury to people or property resulting from any ideas, methods, instructions or products referred to in the content. |
© 2023 by the authors. Licensee MDPI, Basel, Switzerland. This article is an open access article distributed under the terms and conditions of the Creative Commons Attribution (CC BY) license (https://creativecommons.org/licenses/by/4.0/).