Article

Spatio-Temporal Dynamics of Non-Point Source Pollution in Jiulong River Basin (China) Using the Soil & Water Assessment Tool Model in Combination with the GeoSOS-FLUS Model

1
Department of Energy, Environment and Climate Change, School of Environment, Resources and Development, Asian Institute of Technology, Klong Luang 12120, Thailand
2
Department of Civil and Infrastructure Engineering, School of Engineering and Technology, Asian Institute of Technology, Klong Luang 12120, Thailand
*
Author to whom correspondence should be addressed.
Water 2023, 15(15), 2763; https://doi.org/10.3390/w15152763
Submission received: 13 June 2023 / Revised: 15 July 2023 / Accepted: 27 July 2023 / Published: 30 July 2023
(This article belongs to the Special Issue Water-Quality Modeling, Volume II)

Abstract

:
Water pollution, particularly non-point source pollution, poses a significant environmental challenge in river basins around the world. This complex and dynamic process is influenced by both human activities and natural processes. In this study, a quantitative analysis of ammonia-N and total phosphorus (TP) levels in the North Stream of the Jiulong River basin, China from 2010 to 2018 was conducted using the Soil & Water Assessment Tool (SWAT) model. The model was able to facilitate the simulation of spatio-temporal dynamics of concerned pollutants. Additionally, the GeoSOS-FLUS model was integrated with SWAT to predict land use patterns in 2040 and assess their impact on pollutant dynamics. The results demonstrated that the SWAT model effectively simulated the spatial and temporal dynamics of concerned pollutants in the study area, with satisfactory R2 and NS values for river discharges and pollutant loads. Notably, 2016 exhibited significant pollution levels, particularly in March. The study revealed distinct sources of ammonia-N and TP, originating from aquatic animal breeding areas and industrial wastewater discharge, respectively. Moreover, land use patterns influenced the spatial distribution of pollutants. These findings serve as a crucial data foundation for future endeavors in controlling and mitigating non-point source pollution in the Jiulong River basin.

Graphical Abstract

1. Introduction

Water is a critical natural resource for human beings and ecosystems [1]. The quality of water is crucial to the safety of drinking water, the living environment, and the well-being of residents in river basins [2]. With accelerated industrialization and urbanization, as well as the rapid growth of the global population, the problem of water pollution continues to intensify and has become one of the primary constraints limiting the sustainable development of the world [3,4]. Specifically, the deterioration of surface water quality caused by non-point source pollution is one of the most concerning issues in many countries [5]. Non-point source pollution refers to the pollutants that enter the surface and underground water bodies via precipitation and runoff at low concentrations, from dispersed sources, and over large areas. Its characteristics include uncertainty, latency, concealment, and difficulty in monitoring [6]. According to a previous report, approximately 30 to 50% of the global surface water has been affected by non-point source pollution [7]. In China, non-point source pollution contributed 93% phosphorus and 81% nitrogen of the total nutrient input into the watersheds [8]. Despite the importance of non-point source pollution to surface water quality and trophic status, their monitoring and control are extremely difficult and costly due to the nature of such pollution [9] as it: (1) is produced under the complex interaction between humans and nature, hence, a number of factors such as the soil types, topography, meteorological, hydrology, land use/land cover, and management mode could affect its generation and transportation [10,11]; (2) typically occurs over a large contaminated area with numerous sources and random discharge patterns [12]. Alternatively, environmental modeling approaches provide efficient and economical tools to predict the process and impact of non-point source pollutants on water quality [13].
A number of basin models have been applied for the quantitative assessment of non-point pollutant losses over large areas and long-time spans. For example, the Hydrological Simulation Program Fortran (HSPF) model and MIKE SHE [14] have been used to simulate the hydrological cycling processes that take place in upland basins and streams. However, a few drawbacks of these models, such as low spatial resolution and complex input data, have been noted [15]. In addition, several models are available for simulating water quality, such as QUAL2K and MIKE, whereas their application may be limited to relatively small basins and uncomplicated river channels. The Soil & Water Assessment Tool (SWAT) is a semi-distributed, continuous-time watershed hydrological model developed by the United States Department of Agriculture (USDA), which has been successfully used to simulate surface water flow, water balance, and water quality in river basins [16]. The hydrological simulation process of a SWAT model is divided into two stages. The first stage is the land surface process, which controls the internal circulation and transformation of water, sediment, nutrients, and microorganisms in each sub-basin and the output to the main river channel. The second stage refers to the river channel evolution process, which simulates the progress of water and pollutants through the river channel to the outlet of the basin. The SWAT model is embedded with a pollutant migration and transformation module, which can simulate the migration and transformation process of pollutants in water bodies. The model can simulate river runoffs and water quality at flexible temporal and spatial scales, and under various land use, soil type, and management patterns. Previous applications of SWAT in China mainly focused on simulating hydrological processes [17], whereas research on the nutrient migration and transformation processes using SWAT is still in its early stages [18].
The discharges and pathways of nitrogen and phosphorous through non-point sources are highly dependent on land uses and land covers within a river basin. Changes in land use can modify the hydrological processes, energy flow, and nutrient cycling, which consequently affect the surface water quality and ecological functions [19]. There are obvious differences in water quality in different spatial conditions [20]. Previous studies have shown that forestland had a primary interception effect on non-point source pollution, while farmland drainage is the key factor causing surface water eutrophication [21]. Therefore, it is very important to optimize the land use structure and layout in the process of non-point source pollution control [22].
Several models have been used for predicting regional land use development including the Markov model, the Cellular Automata (CA) model, the Dynamics of Land System (DLS) model, and the Conversion of Land Use and its Effect at Small regional extent (CLUE-S) model [23]. However, a few constraints of currently used land use production models have been seen in the literature. For instance, the CA model can only simulate the evolution of a single type of land use. The CA–Markov model failed to fully consider the multifactor-driven impacts of land use [24]. The CLUE-S model does not take into account the probability of small transformation between land use types, which increases the uncertainty of simulation [25]. Whereas, the GeoSOS-FLUS model successfully couples system dynamics (SD) and neural network CA, which can effectively deal with the problem of land conversion probability under the combined action of natural and human activities, and provides a powerful tool for in-depth analysis of landscape pattern evolution [26,27].
This study aims to combine the SWAT model with the GeoSOS-FLUS model to understand the spatio-temporal dynamics of nitrogen and phosphorus loads under future land use development at a river basin scale. The Jiulong River (North Stream) basin in China was selected because it is located in the southeast coastal area of China, where it experienced the rapid development of industry and agriculture in the past few decades [28]. The basin covers a large draining area and possesses complex land use types and a dense population. Daily river discharge and monthly ammonia-nitrogen/total phosphorus loads were calibrated and validated using the field monitoring data during 2010–2014 and 2015–2018, respectively. The spatio-temporal distribution of nitrogen and phosphorus loads in the Jiulong River (North Stream) basin was analyzed. The future nitrogen and phosphorus loads in 2040 and their spatial distribution were further predicted using the SWAT coupling with the GeoSOS-FLUS model.
This study presents a comprehensive analysis incorporating spatial and temporal dynamics of the study area. It demonstrates the successful application of the SWAT model coupled with the GeoSOS-FLUS model in simulating pollutant dynamics and contributes to the understanding of non-point source pollution and its relationship with land use in river basins. The findings of the study have important implications for water resource management and pollution control strategies in river basins. They provide valuable insights for policymakers and stakeholders to develop effective measures for mitigating non-point source pollution.

2. Materials and Methods
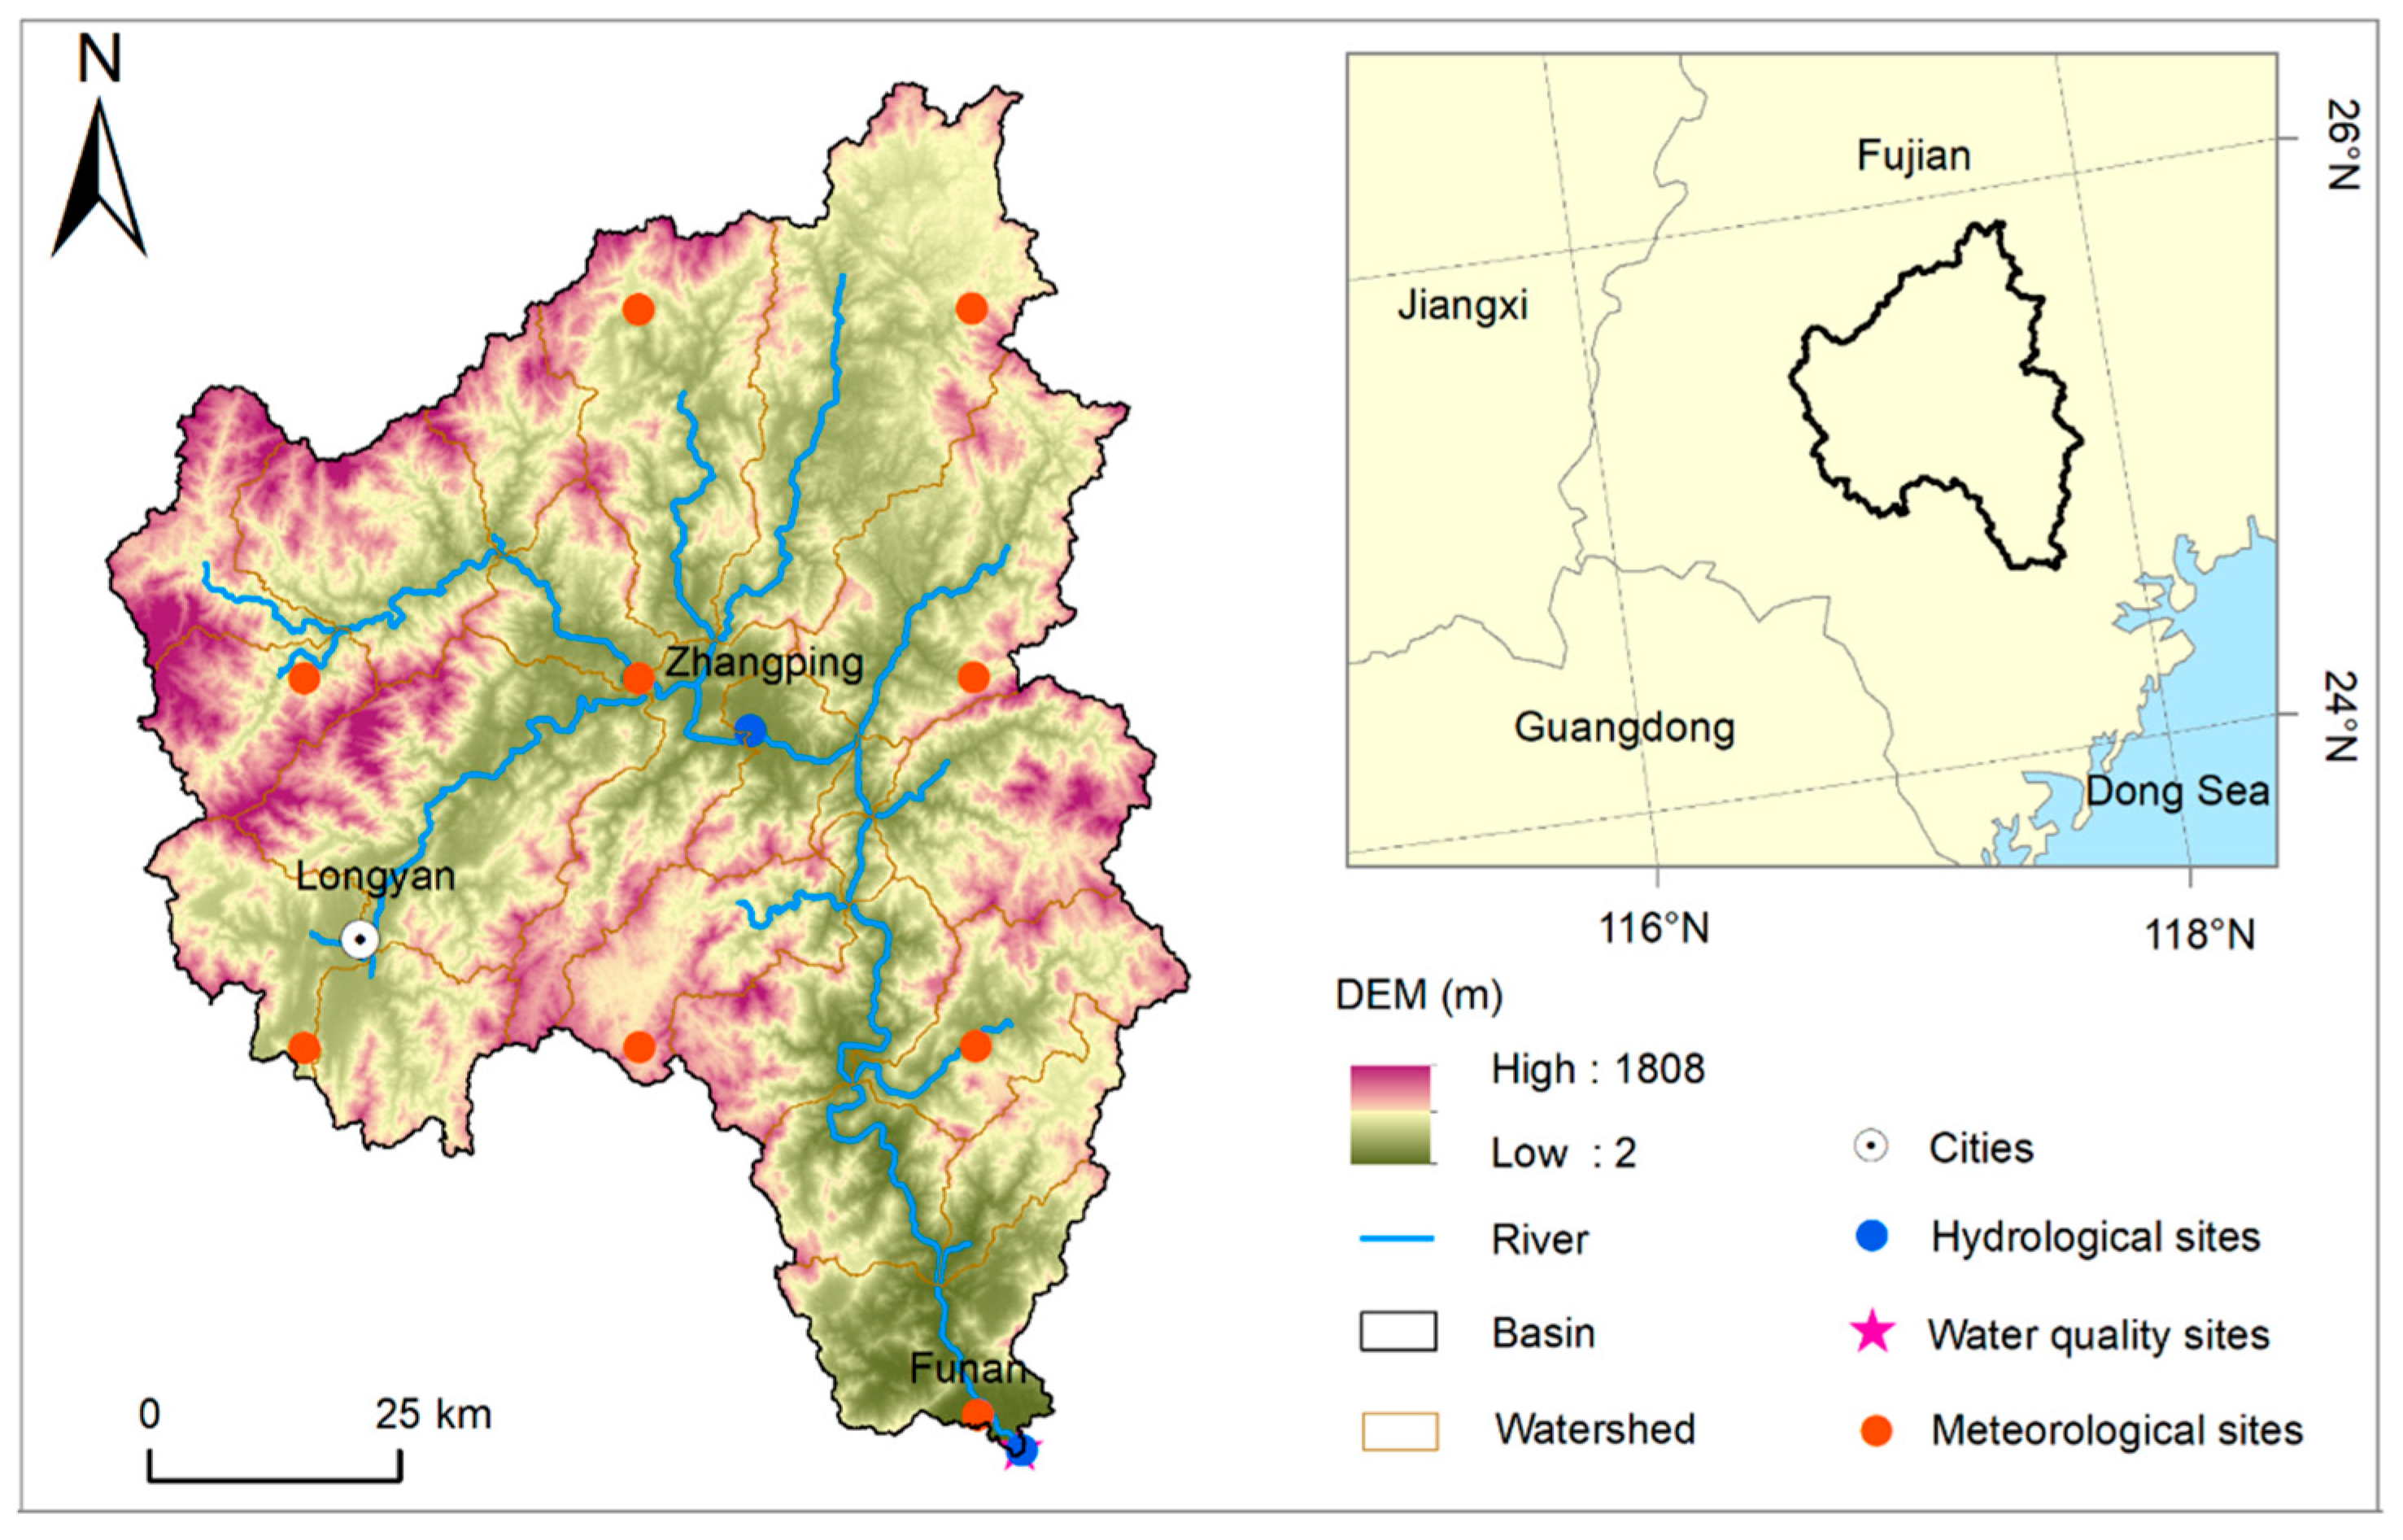
2.1. Study Area

The Jiulong River is the second-largest river in the Fujian Province, China. It is located in the economically developed southeast coastal area of the Fujian Province. The river consists of three tributaries, namely the West Stream, South Stream, and North Stream, draining a total basin area of 14,741 km2. The Jiulong River basin covers three major cities, namely Longyan City, Zhangzhou City, and Xiamen City. The basin is subject to a subtropical monsoon humid climate, with the annual average temperature of 19.9–21.1 °C, and the annual precipitation between 1400 and 1800 mm. Approximately 75% of the annual precipitation cumulates during April–September, generating an annual average runoff of approximately 1010 mm. There are more than 3.8 million of the population living within the basin, which plays an important role in the economic development of the region and contributes approximately 25% of the GDP of the Fujian Province [29]. It is also a major source of drinking water, industrial water, and agricultural irrigation [30]. Therefore, the basin became a primary source of nutrients for Xiamen Bay because of its developed agriculture and animal husbandry. The North Stream is the longest and most important stream of the Jiulong River water system, with a length of 272 km and a catchment area of 9640 km2. The basin has fertile soil and rich natural resources. This study takes the Jiulong River (North Stream) as the study area and its location is shown as follows (Figure 1).

2.2. Data Collection and Processing

Digital elevation model (DEM), land use, soil type, and meteorological data of the study area were collected as inputs for the SWAT model construction. Daily runoff and monthly water quality at the Funan monitoring station between 2010 and 2018 were used for model calibration and validation. The details of collected data for the SWAT model construction and calibration are summarized in Table 1.

2.3. SWAT Model for Water Quantity and Quality Simulation in the Jiulong River (North Stream)

In this study, the SWAT model (ArcMap 10.2) was used to evaluate the water environment of the basin. The study basin was divided into 22 sub-basins based on the DEM and the location of the water outlet (Figure S2). Each sub-basin was further divided into a few hydrological response units (HRUs) depending on specific attributes consisting of different soil types, land use types, and slope grades [31]. The identified HRUs were used for water balance calculations. The total loss of nutrients in each sub-basin was calculated by accumulating the nutrient loss in all HRUs.
The SWAT-CUP was used to calibrate the outputs of the SWAT model. The SUFI-2 algorithm, which takes into account all sources of parameter uncertainty, including driving variables, conceptual models, parameters, and monitoring data, was used for model calibration. The algorithm has the advantages of fast iteration speed and high-computational efficiency, so it was widely applied in previous research. The built-in sensitivity analysis tool was used to screen parameters that have a significant impact on runoff and nutrient simulation so that adjustments can be made to these parameters in a targeted manner. In this study, runoff and nutrient concentration data within a period of 2010–2014 was used for model calibration, and the data between 2015 and 2018 was used for model validation. Ten key parameters that have significant influences on river runoff, sediment generation, and water quality (ammonia nitrogen and total phosphorus) were optimized during model calibration in this study. These parameters are described in detail in Table S1.
Nash–Sutcliffe simulation efficiency coefficient (NS) and decision coefficient (R2) were used to assess the viability of the constructed SWAT model for the Jiulong River (North Stream). NS is used to measure the degree of fitting between the simulated results and observed data. R2 represents the consistency of trend between the simulated data and observed data, which are defined as:
  E n s = 1 i = 1 n F i T i 2 i = 1 n F i F a v g 2
R 2 = i = 1 n F i F a v g T i T a v g i = 1 n F i F a v g 2 0.5 i = 1 n T i T a v g 2 0.5 2
where F i is the observed value, F a v g is the average of observations, T i is the simulated value, T a v g is the average of the simulated values, and n is the number of observations. An NS and R2 value closer to 1 indicates that the simulated values are closer to the observations. According to Sharma [32], acceptable simulation results of river runoff should meet NS and R2 values over 0.6, and those of N and P concentrations should meet the NS and R2 over 0.5.

2.4. Future Land Use Forecasting Using the GeoSOS-FLUS Model

The GeoSOS-FLUS model was used to forecast land use changes under the influence of human activities and natural processes in future years. The model includes two calculation modules: (1) Adaptive probability calculation module based on neural network. It obtains the adaptive probability of various land use types within the research scope from land use data and various driving factors including human activities and natural effects. (2) Cellular Automata module based on adaptive inertia mechanism. The adaptive inertia competition mechanism based on roulette wheel selection can effectively deal with the uncertainty and complexity of the mutual transformation of various land use types under the joint influences of natural and anthropogenic processes. The FLUS model has high simulation accuracy and can obtain similar results to real land use development scenarios [33].
In this study, land use data from 1980, 1990, 2000, and 2010 were input into the GeoSOS-FLUS model to simulate the land use change in 2040 in the study area. The obtained land use information in 2040 was used as the input for the SWAT model to predict the non-point source pollution situation in 2040.

2.5. Identification of Key Pollution Source Areas

The load of ammonia nitrogen and total phosphorus were computed in each sub-basin based on the calibrated model. The load per unit area index (LPUAI) was used to identify the key pollution source areas [34]. The pollutant load loss intensity is defined as follows:
P i = P S i A i
where Pi denotes pollutant load loss intensity; PSi denotes the pollutant load generated in the ith sub-basin, kg; and Ai denotes the area of the ith sub-basin, ha.
The loss intensities of ammonia nitrogen and total phosphorus in 22 identified sub-basins were used as the index to identify the key pollution source areas. The natural fracture point classification method was used to classify the loss intensity into five levels (Table S2), which is a statistical method for grading and classifying according to numerical statistical distribution rules. From I to V, the level of pollution increases gradually. Therefore, the key pollution source areas in the basin can be identified [34].

3. Results and Discussion

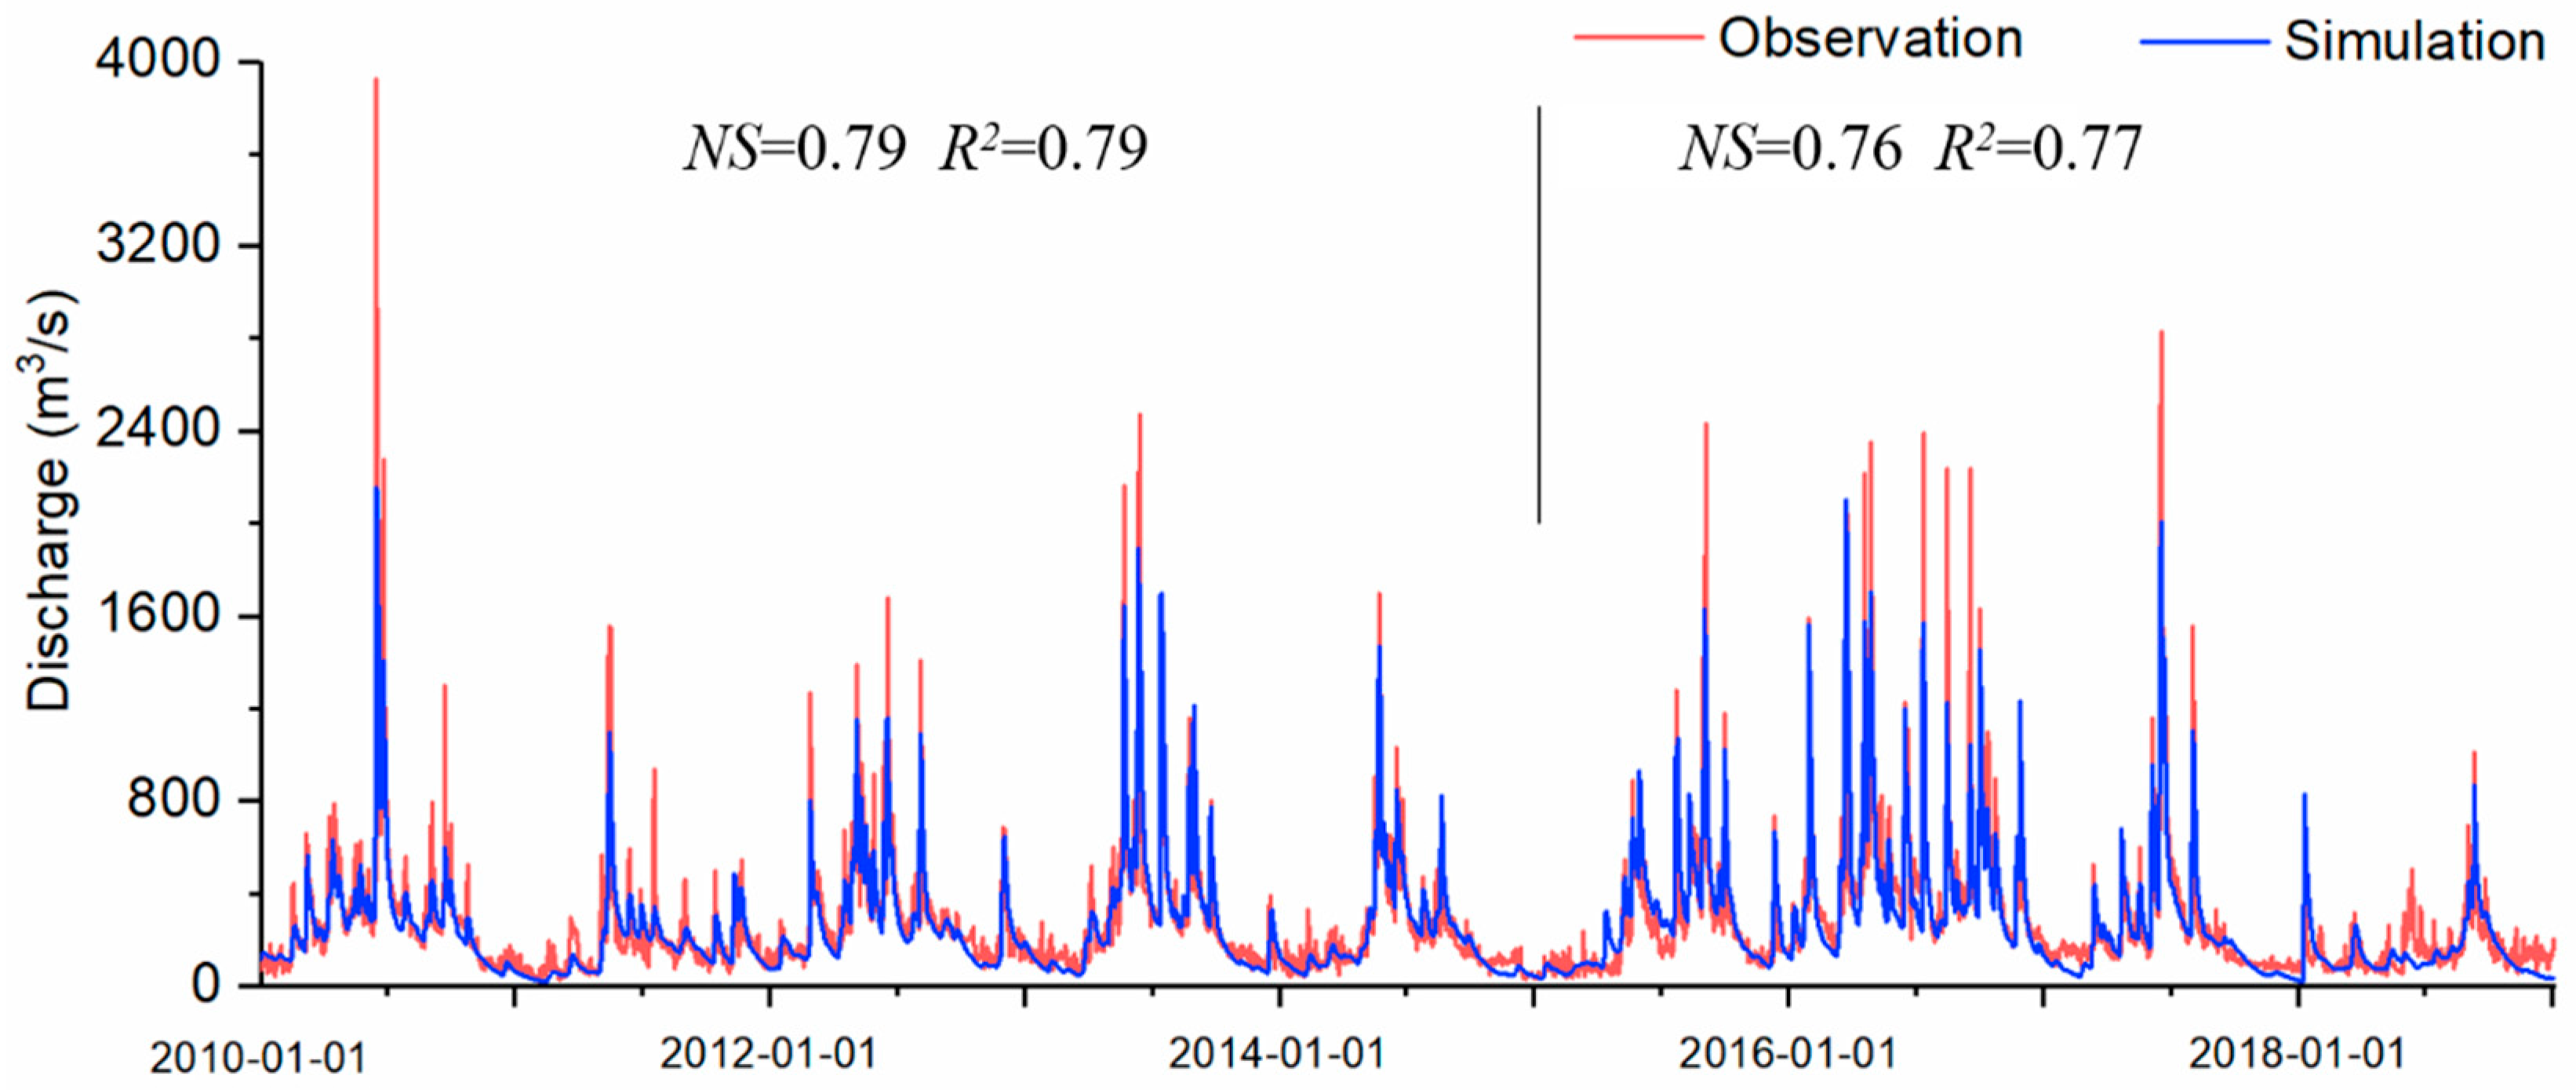
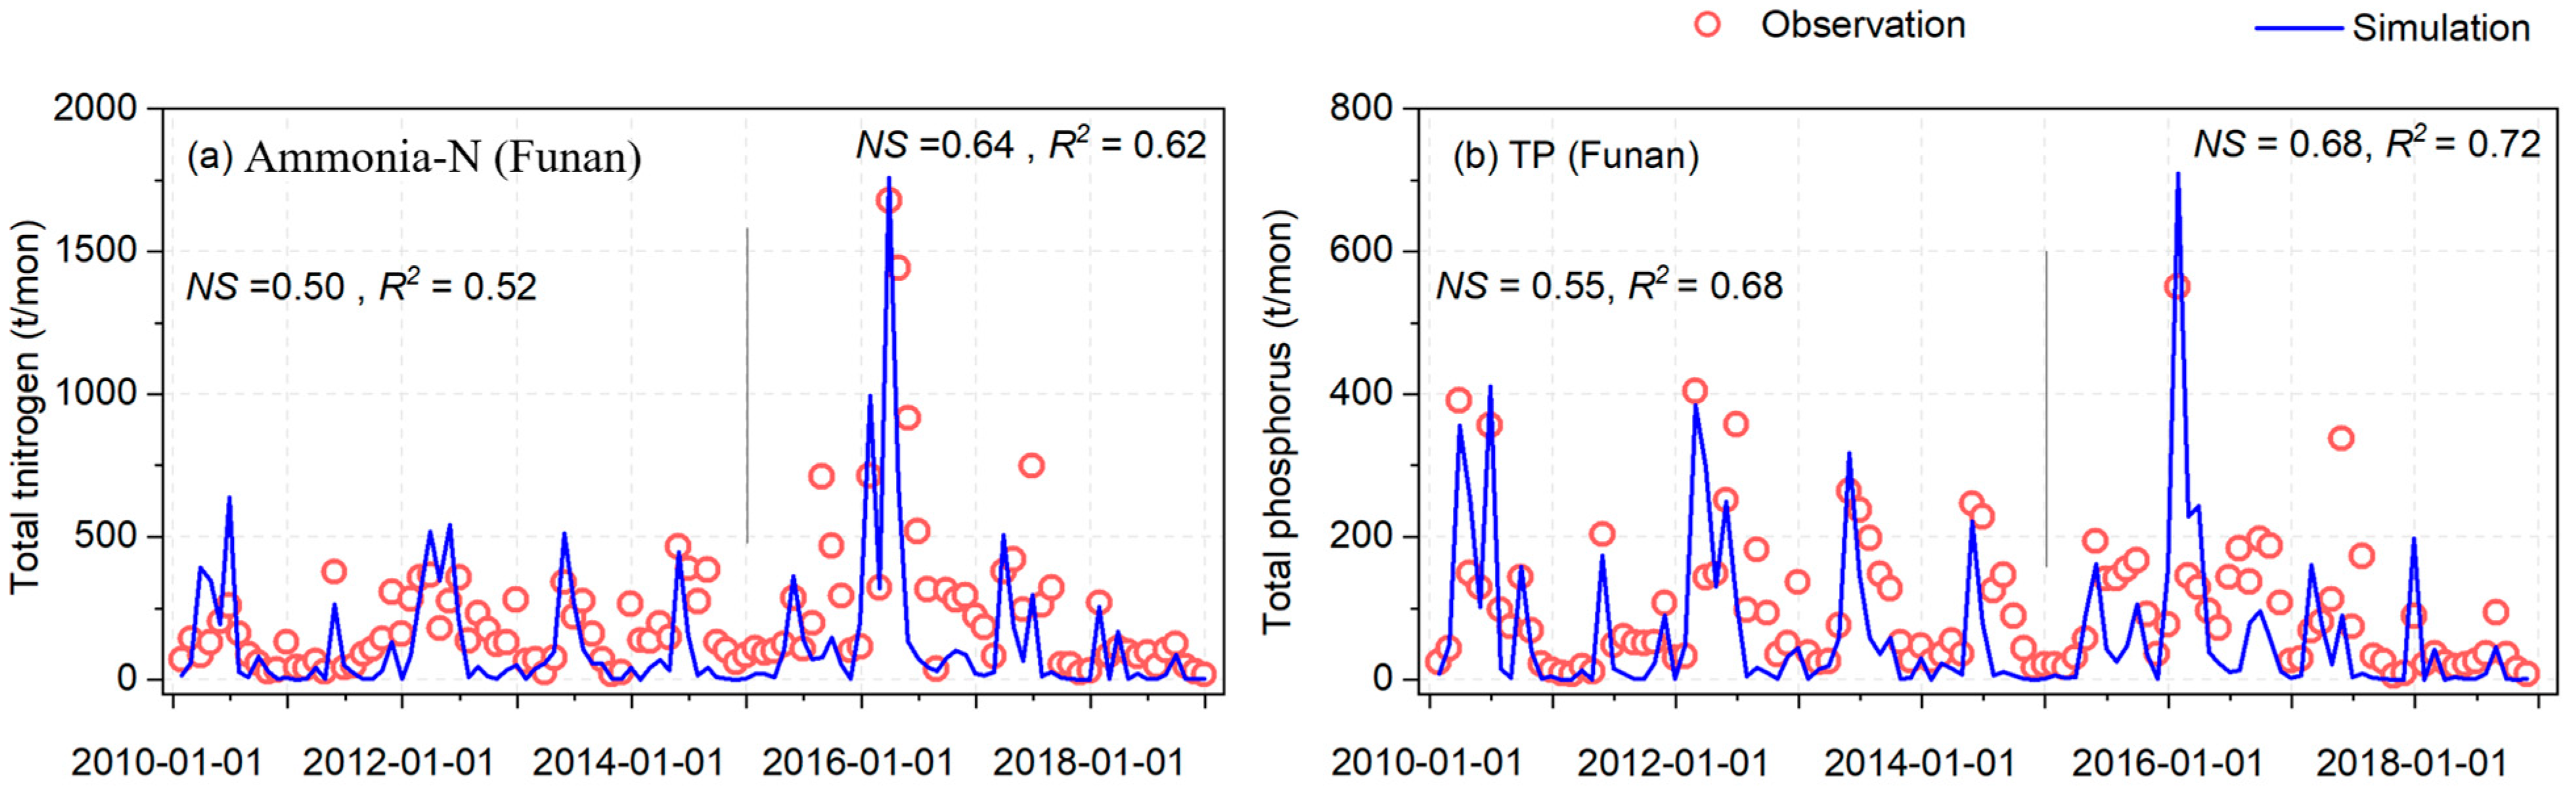
3.1. SWAT Model Calibration and Validation

The hydrological process of the Jiulong River (North Stream) basin was calibrated using the observed daily runoff data during 2010–2014 and verified using the data between 2015 and 2018. Figure 2 shows a good fitting between the model simulation and field observation results at Funan station. Satisfactory R2 and NS values of 0.79 were obtained in the calibration period. Similarly, comparable R2 and NS values of 0.77 and 0.76, respectively, were obtained during the validation period. This performance was highly comparable with a few recent reports that applied the SWAT model for river basin hydrological process simulation, for example, in the Wangjiaqiao basin and Luoyang region, China [5,35]. It is worth noting that the simulated results at peak runoffs were generally lower than field observations, indicating a slightly high uncertainty in peak simulation by SWAT. Since the runoff calibration in this study was based on a daily scale, a large amount of data will lead to uncertainty in the model and parameter settings during the calibration process, resulting in the underestimation of peak daily discharge. The river discharge pattern presents two peaks in a year, which were primarily affected by the local climate. March and October were the months with the highest intensity of precipitation in South China. Four years, i.e., 2010, 2013, 2016, and 2017, showed relatively intensive runoff compared with the other studied years, due to the large annual precipitation of the years, revealing the alternative appearances of wet years and dry years.
The pollution source data of monthly ammonia-N loads and total phosphorous loads at the same station were used for calibrating and validating the water quality parameters in the SWAT model. Good fittings between the simulated and observed monthly nutrient loads with properly identified peak values and changing trends are presented in Figure 3. The R2 and NS values for ammonia-N were calculated as 0.50 and 0.52 in the calibration period, and 0.64 and 0.62 in the validation period, respectively. The R2 and NS values for total phosphorus were calculated as 0.55 and 0.68 in the calibration period, and 0.68 and 0.72 in the validation period, respectively. This performance was highly comparable with several recent reports that applied the SWAT model for river basin water quality process simulation like the Cau River basin in Vietnam [21]. Consistent with the river discharge pattern, the nutrient load pattern generally presented two peaks in March and October each year. This indicated that river runoff intensity was one direct factor affecting the nutrient flowing into the river networks from the basin. With increased upstream discharge intensity and accelerated runoff velocity, the sediment carrying capacity was advanced, and, hence, nitrogen and phosphorus loads from the river draining catchments raised significantly during the wet season.

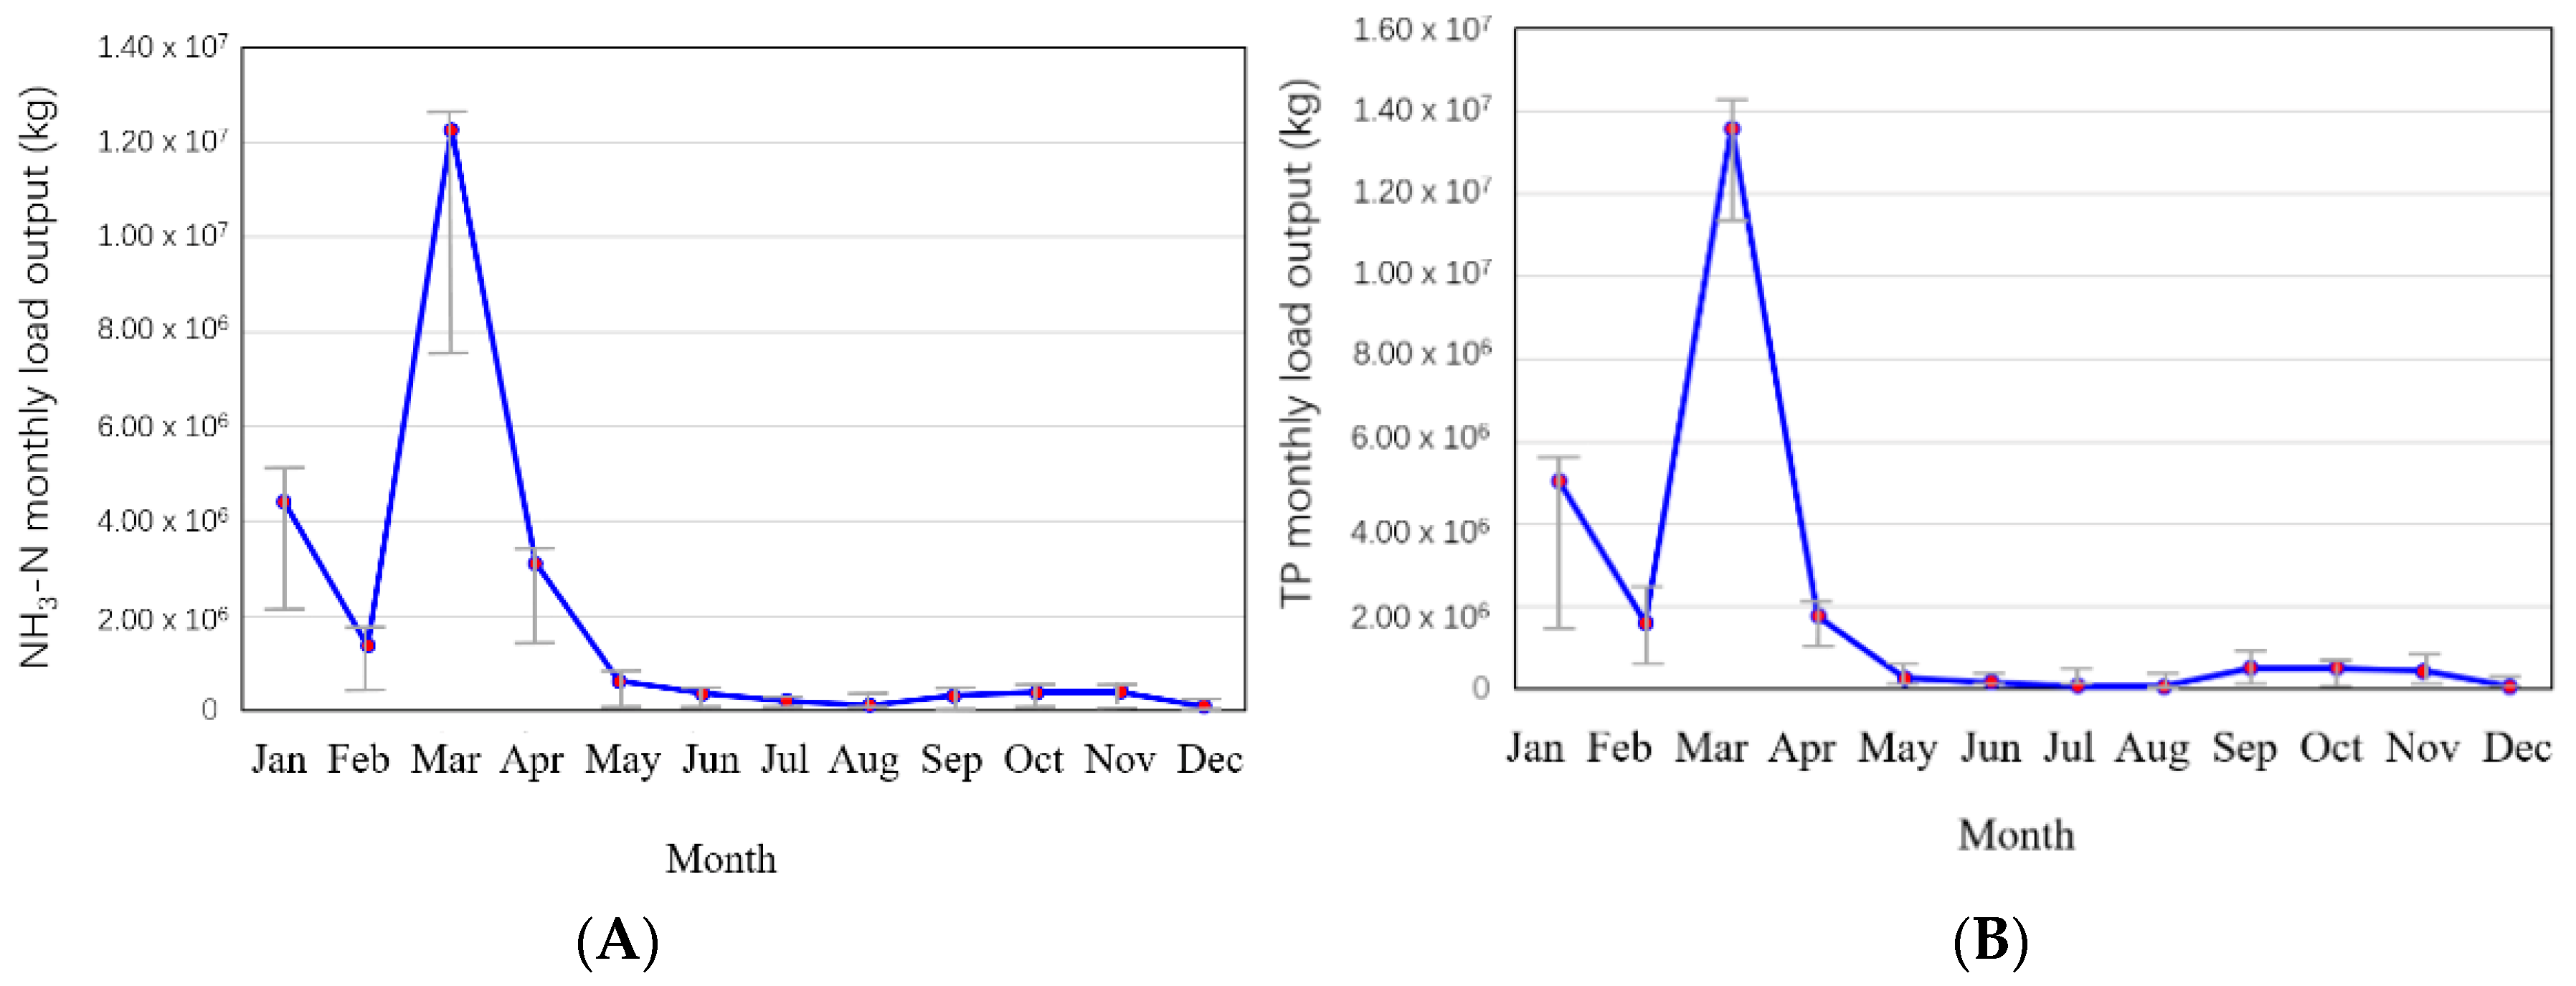
3.2. Temporal Variations of Ammonia-N and TP Mass Load in the North Stream of Jiulong River (North Stream)

The variations in annual mass loads of ammonia-N and TP in the North Stream sub-basin from 2010 to 2018 are shown in Figure 4. Comparable average annual mass loads of ammonia-N and TP were obtained at 7.36 × 10⁶ kg and 7.13 × 10⁶ kg, respectively. This was in good consistency with a few previous reports in the Tiete River basin in Brazil [6] and in the Wulong River basin in China [36]. Extremely high nutrient loads were observed in 2016, with the annual ammonia-N and TP discharge loads reaching 2.36 × 10⁷ kg and 2.41 × 10⁷ kg, respectively, accounting for more than 3-folds of the nutrient loads generated in the other investigated years. The peak nutrient loads presented in 2016 may be attributed to two reasons: (1) The extreme annual precipitation occurred in the Fujian Province in 2016. According to the Climate Bulletin of Fujian Province (fj.weather.com.cn (accessed on 12 November 2022)), the average annual precipitation of the Fujian Province in 2016 reached 2432.6 mm, 47% higher than the annual precipitation and reaching the highest annual precipitation on record since 1961. The effect of intensive rainfall events on river discharge is clearly indicated in Figure 2. Such high precipitation resulted in intensive surface runoff, which exacerbated the nutrient wash-off from non-point sources distributed in the catchments and caused high nutrient loads in the Jiuling River channel. (2) The accelerating agricultural and social-economic growth in the corresponding period. According to the Fujian Province National Economic and Social Development Statistical Bulletin in 2016 (http://tjj.fujian.gov.cn/ (accessed on 12 November 2022)), the province’s residential population increased by 350,000 over the previous year. A high GPP growth rate of 11.1% was achieved. The production of agricultural products such as meat, eggs, and milk increased by 4.6% in 2016 in comparison with the previous year. In particular, the production of poultry meat, freshwater aquatic products, and marine aquaculture products increased by 10%, 4.6%, and 7%, respectively. Large-scale industries saw an added value increase of 7.6%. The rapid increase in industry, livestock and poultry farming, and aquaculture led to exacerbated domestic sewage discharges and agricultural and industrial waste generation. A declining trend in nutrient loads was observed, this was possibly related to the Fujian Province’s strong commitment to the basin restoration and protection from 2016. The main measures included strengthening the environmental supervision of water sources; fine-grained management of major river basin units; carrying out pilot projects to control the total amount of pollutants discharged into the sea from the Jiulongjiang–Xiamen Bay; carrying out ecological protection and restoration of mountains, rivers, forests, fields, lakes, and grasses in the Minjiang River basin; and implementing water environment governance and ecological protection, etc (www.fujian.gov.cn (accessed on 12 November 2022)). As a result, a generally good river water quality was reported in Fujian’s 2018 Ecological and Environmental Status Bulletin (www.gov.cn (accessed on 12 November 2022)), despite the highly rapid economic growth since 2017.
The average monthly variations in ammonia-N and TP loads during 2010 and 2018 are shown in Figure 5. In general, the monthly ammonia-N and TP loads followed a consistently changing trend, with the discharges peaking in March at 1.23 × 10⁷ kg and 1.36 × 10⁷ kg, respectively. The distribution of rainfall in the study area is highly fluctuated throughout the year, especially with the frontal rainfall occurring in spring and early summer leading to spring floods. There are relatively frequent typhoons in late autumn, so the precipitation will have a small increase trend. Moreover, late February to March is the sowing period of early rice, spring soybeans, and thermophilic vegetables, as well as the seedling planting season of afforestation and fruit trees in the Fujian Province. This results in intensive consumption and accumulation of chemical fertilizers in agricultural lands, which are washed into the river channels in association with soil erosion by intensified surface runoff. Obviously, with the end of the sowing season after March, the loss of ammonia-N and TP decreased significantly and became stable.

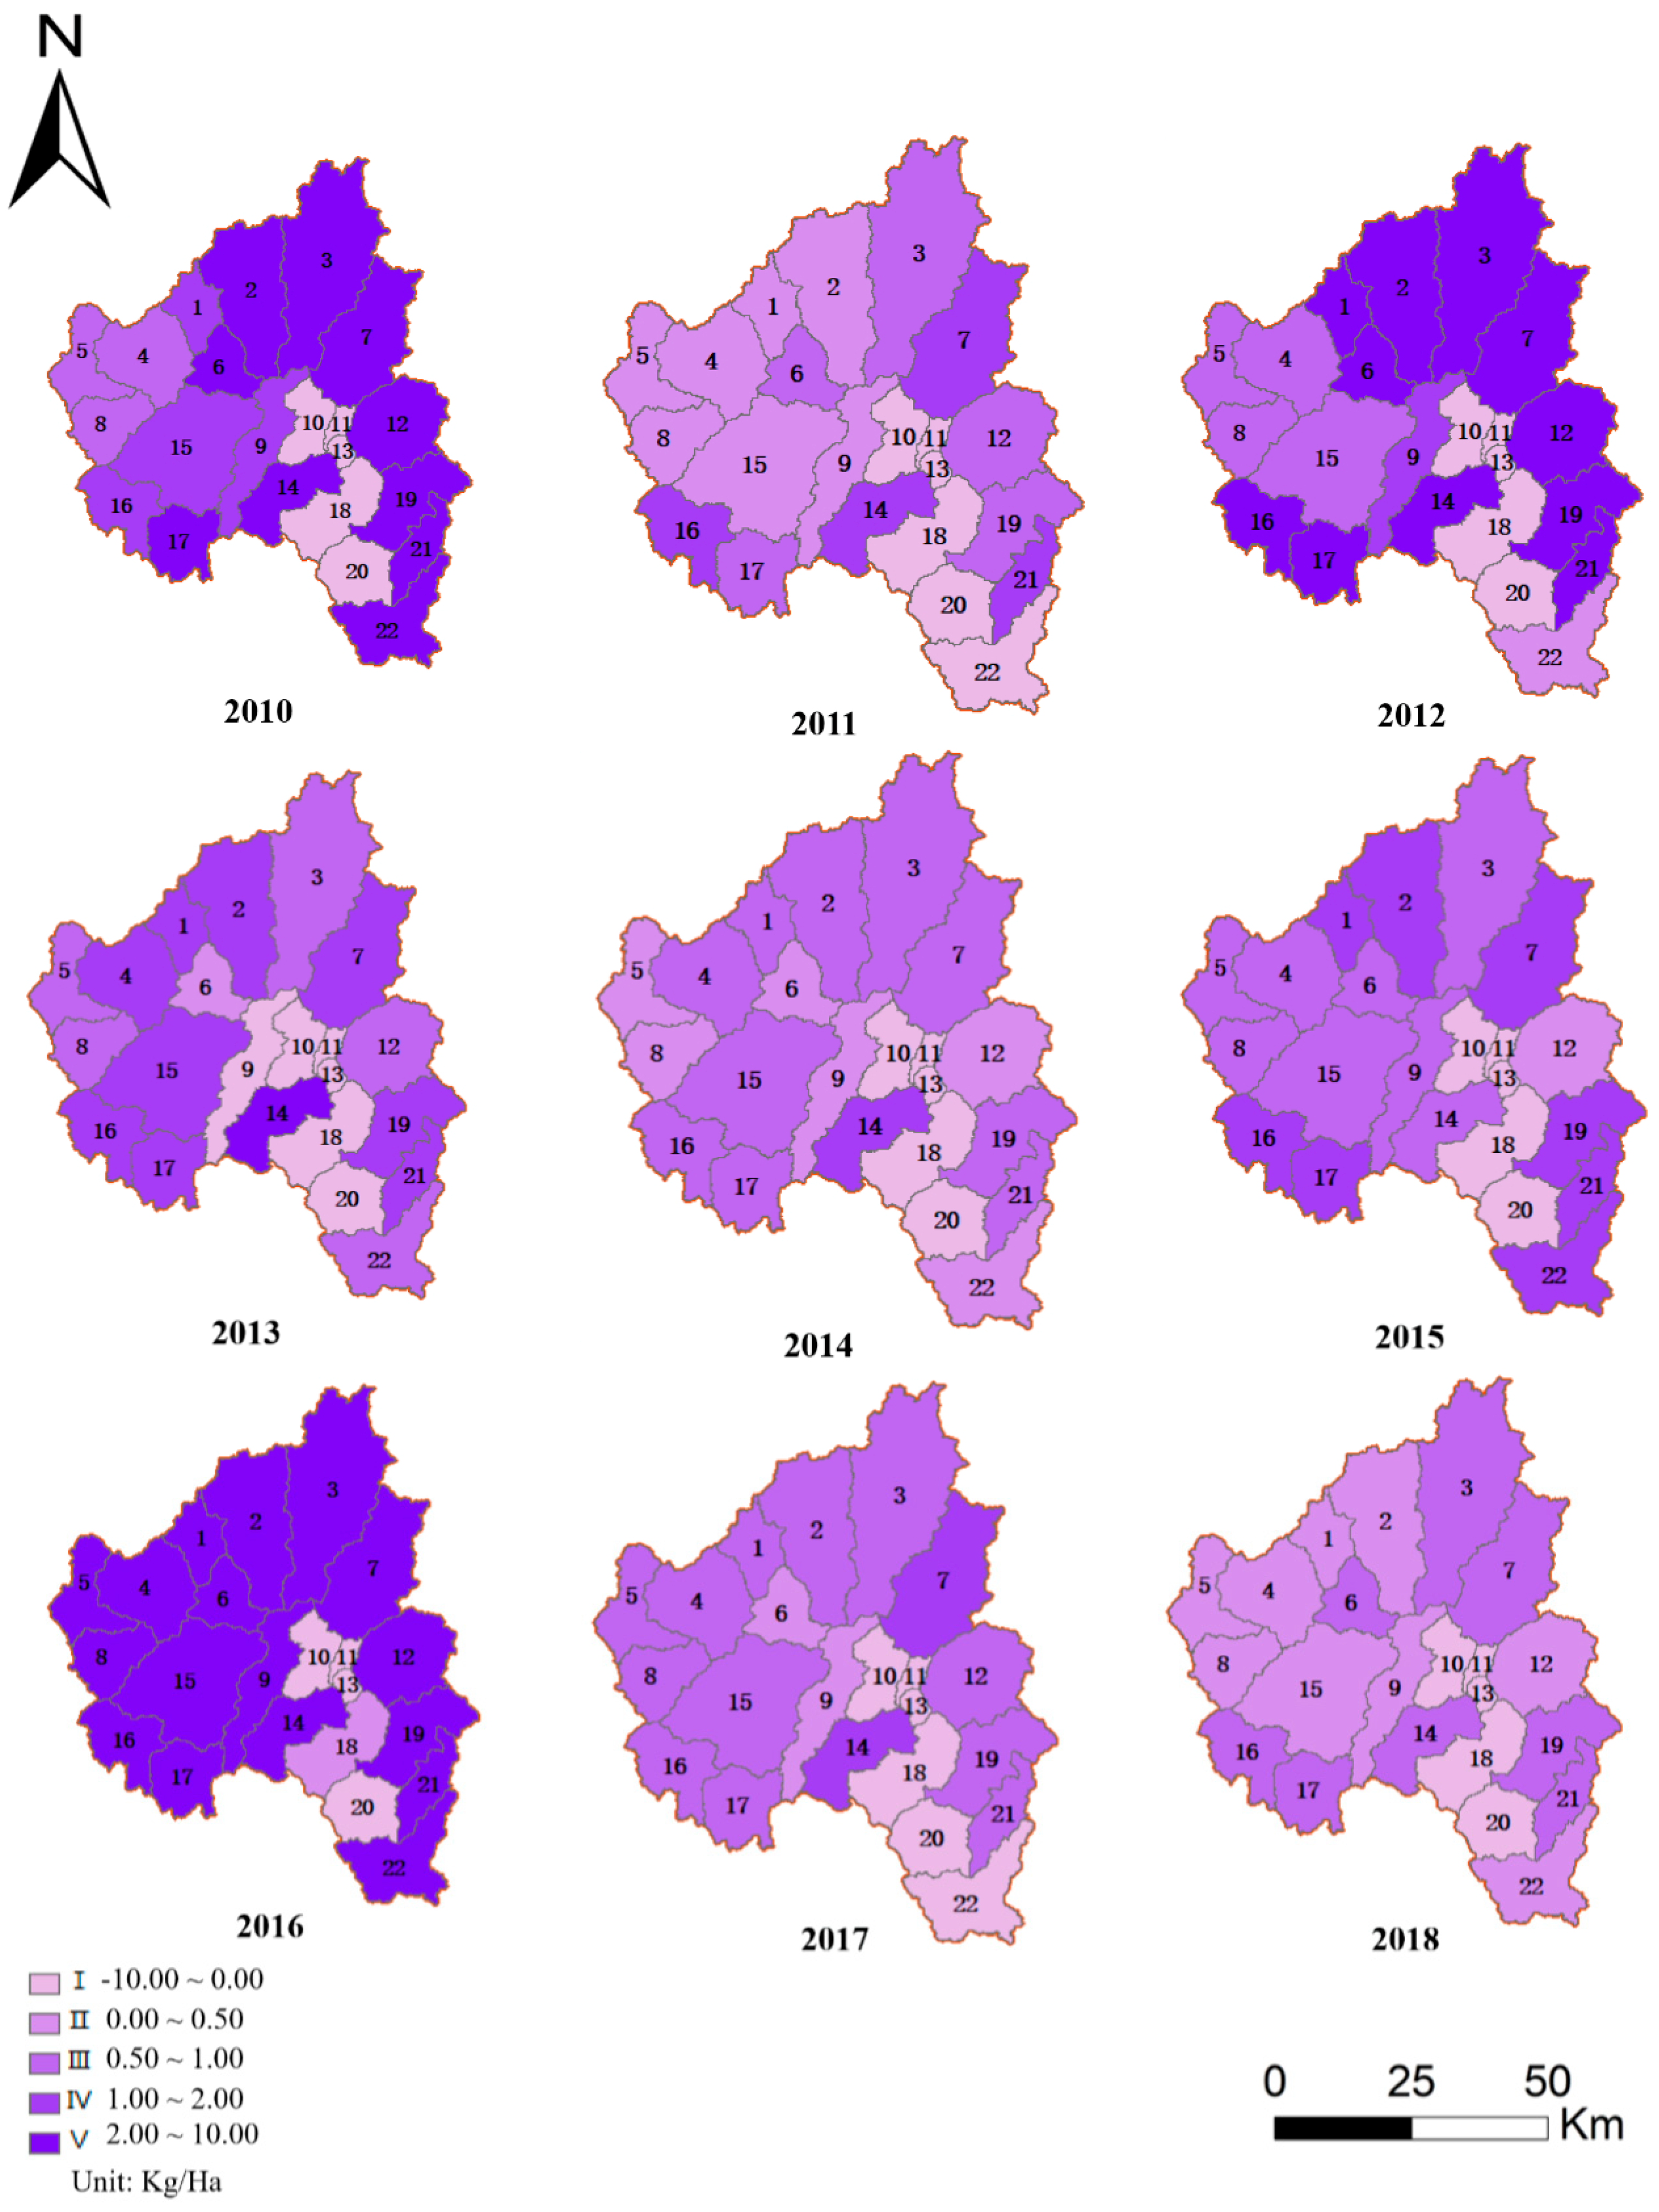
3.3. Spatial Distributions of Ammonia-N and TP Mass Load in the North Stream of Jiulong River

Based on the calibrated SWAT model, it was able to calculate the mass discharge loads of ammonia-N and TP within each sub-basin of the study area. Figure 6 and Figure 7 depict the spatial distribution of annual nutrient loss intensities for ammonia-N and TP, respectively, during 2010 and 2018. The spatial distribution of ammonia-N loss intensity showed high temporal consistency with the elevated loads observed in the central and southern parts of the study basin. In particular, No. 6, 9, 10, 11, 13, 18, 20, and 22 sub-basins, at which the surface runoff converges to the main stream, presented elevated ammonia-N loss intensity ranging between levels IV and V throughout the whole study period. The main possible reason for the formation of such a spatial pattern of ammonia-N was land use type. According to the distribution information of aquaculture in the Fujian Province, these sub-basins contributed high ammonia-N loss intensities located at the main aquaculture area of the basin. Ammonia-N in aquaculture water mainly comes from the accumulation and decomposition of nitrogen-contained substances such as aquatic animal carcasses, excrement, feed, and fertilizer [37]. In addition, the areas with a high contribution rate of ammonia-N are mainly distributed in the agricultural land concentration areas where the land use type is dry land, which is relatively consistent with the research results of previous research [38]. Nutrients such as ammonia-N in farmland soil gradually converge downstream with the runoff process and the transport of sediment, resulting in the aggravation of pollutant load and nutrient enrichment in water.
From the perspective of the spatial distribution of TP, the sub-basins responsible for TP sources are No. 16, 17, 14, 3, 7, 12, 19, 21, and 22, mainly located upstream of the basin and the downstream outlet of the basin. This phenomenon is possibly associated with land use distributions which are described as follows: (1) Two important industrial cities in the Fujian Province, i.e., Zhangzhou City and Longyan City with intensive anthropogenic activities, are located in these sub-basins. According to the Second Pollution Census Bulletin of Fujian Province (www.fujian.gov.cn (accessed on 15 November 2022)), the top three industries for TP emissions are agricultural and sideline food processing, food manufacturing, and textile in Fujian, which accounted for 65.99% of TP emissions from industrial sources in the province. Zhangzhou City generated approximately 19.3% of the overall industrial wastewater in Fujian, of which the TP discharge accounted for approximately 19.6% of the whole province. (2) The impact of vegetation type on the spatial distribution of TP is also prominent. In this area mentioned above, the area of woodland and shrub forest is relatively large. Due to the high content of organic matter, the loss of organic phosphorus components in the soil is very low, so it contributes a lot to the loss intensity of total phosphorus. This is consistent with the previous report of Zhang [5].

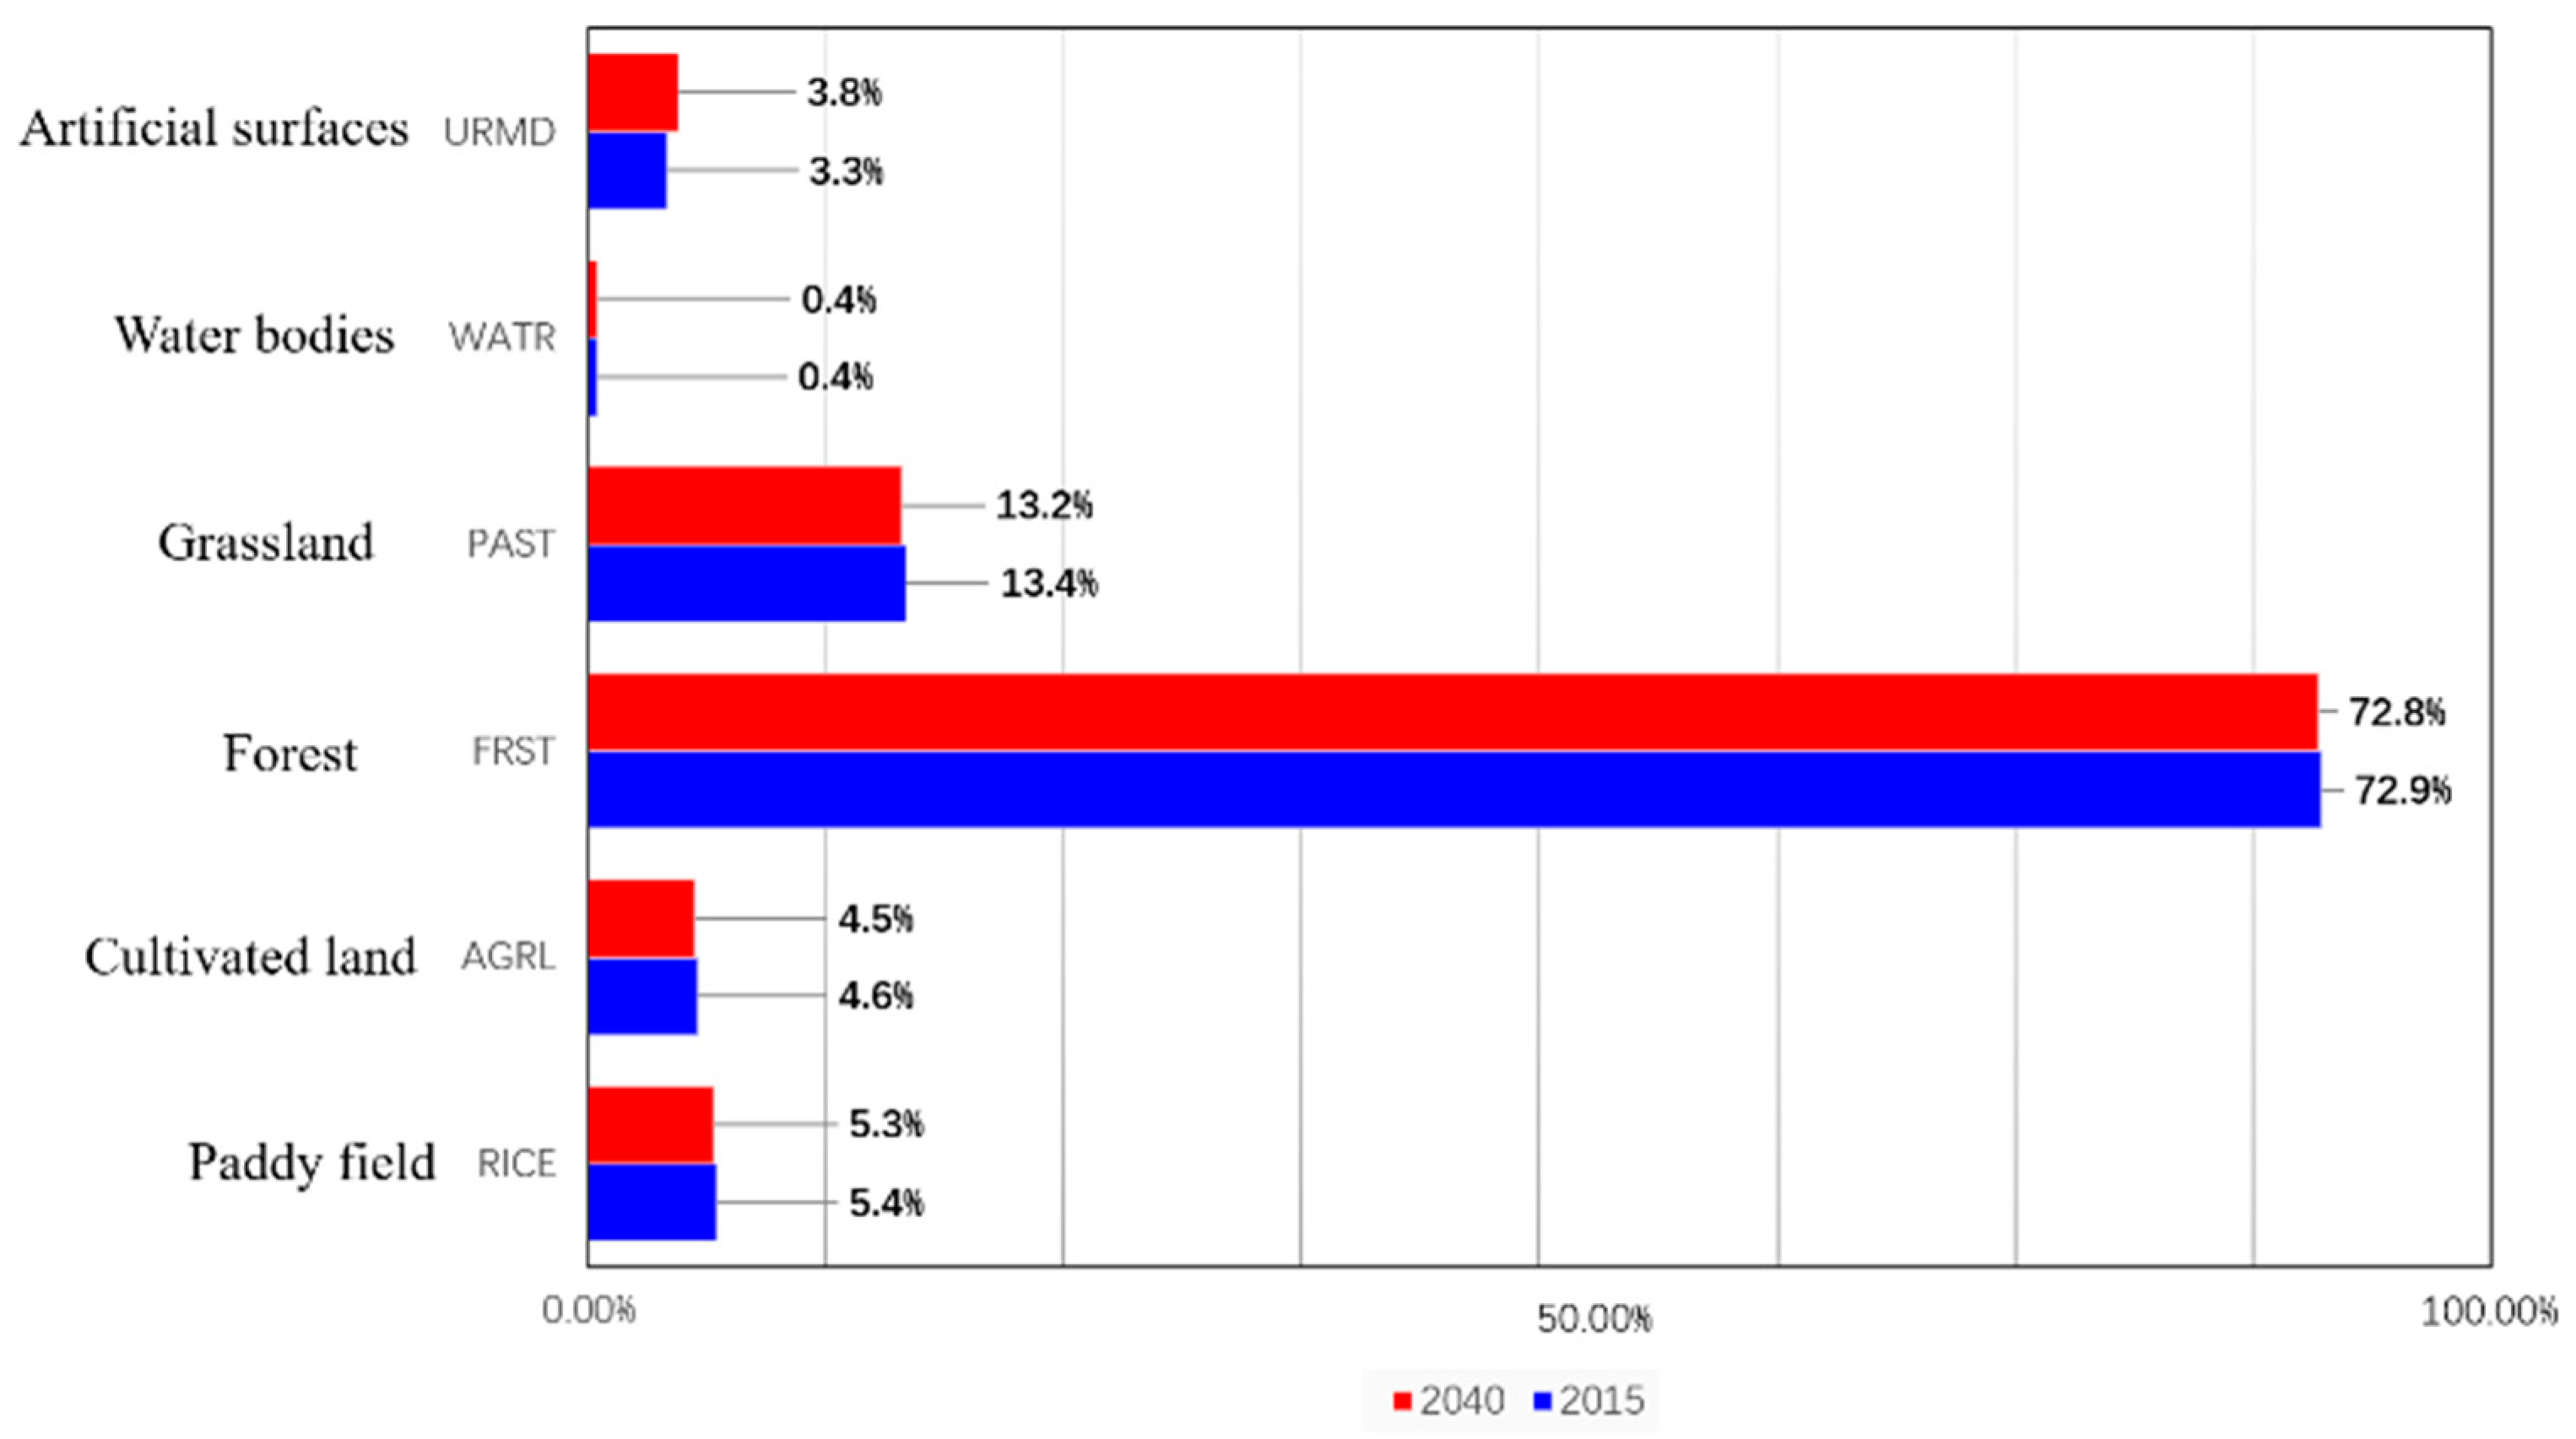
3.4. Prediction of Ammonia-N and TP Pollution Load in 2040 Using GeoSOS-FLUS Model in Combination with SWAT Model

Land use and land cover play an important role in the generation, distribution, migration, and transformation of non-point source pollutants [39]. In this study, the land use variation in 2040 was predicted using the GeoSOS-FLUS model based on the land use data of the past four decades (Figure 8). The urban build-up area has increased from 3.3% to 3.8%, while forest land and grassland have decreased to 72.8% and 13.2%, respectively.
The predicted land use in 2040 was further adopted as the input of the SWAT model, with the validated model settings in Section 3.1 remaining unchanged. Figure 9 shows the predicted monthly loads of ammonia-N and TP in 2040 in comparison with the current loads in 2018. As anticipated, the maximum monthly loads of ammonia-N and TP will appear in March of 2040, due to the climate pattern and agricultural pattern as usual. The peak monthly discharges of ammonia-N and TP are predicted to reach 2.14 × 10⁷ kg and 5.99 × 10⁶ kg, respectively, higher than the average peak loads between 2010 and 2018.
On the other hand, the spatial distribution of nutrient load intensity is predicted in 2040 and compared with those belonging to 2018 in Figure 10. Overall, the forecast results show that the non-point pollution in the study area has become more serious than it is now based on the monthly mass loads. The total annual production of ammonia-N and TP in the study area in 2040 are predicted as 7.29 × 10⁷ kg and 1.86 × 10⁷ kg, respectively. The loads of ammonia-N and TP pollution show a similar spatial distribution, with the high-intensity index present in the central areas of the basin, specifically in sub-basins No. 16, 17, 19, and 21, accounting for 3.2% and 2.8% of ammonia-N and TP discharge over the whole basin, respectively. The intensity of ammonia-N in the most polluted sub-basin, No. 16, was 20.3 kg/ha, accounting for 7.5% of the total intensity in the study area, followed by sub-basins No. 19 and No. 17 with intensities of 19.6 kg/ha and 19.5 kg/ha, respectively. The intensity of TP in the most polluted sub-watershed No. 21 was 4.7 kg/ha, accounting for 6.6% of the total intensity, followed by sub-basins No. 19 and No. 17 with intensities of 4.5 kg/ha and 4.1 kg/ha, respectively.
Compared to 2018, the distribution of key source areas of ammonia-N in the study area has changed in 2040, with sub-basins No. 16, 17, 19, and 21 becoming areas with severe ammonia-N pollution, while sub-basins No. 3 and No. 4 remain areas with severe pollution. Moreover, the pollution of TP has become more serious than in 2018 as a whole, with sub-basins No. 16, 17, 19, and 21 being the areas with serious pollution. As more forest land is converted into urban build-up and more people live in these areas, the degree of pollution has become more severe.

4. Conclusions

This study applied the SWAT model to simulate the temporal and spatial variations of ammonia-N and TP mass loads in the Jiulong River (North Stream) basin over a nine-year period (i.e., 2010–2018). The model calibration and validation demonstrated its effectiveness in accurately predicting the daily runoff (with the R2/NS ≥ 0.77/0.76) and monthly mass loads of ammonia-N (R2/NS ≥ 0.52/0.50) and TP (R2/NS ≥ 0.68/0.55), respectively. Relatively stable annual ammonia-N and TP losses at 7.36 × 10⁶ and 7.13 × 10⁶ from the studied basin were obtained throughout the study period, with an exception observed in 2016. The annual losses of ammonia-N and TP reached 2.36 × 10⁷ and 2.41 × 10⁷, accounting for 3-folds of the other studied year. It was possibly due to the intensive precipitation and rapid agricultural and social-economic growth in 2016. The spatial distributions of nutrient losses indicated distinct pollution sources for ammonia-N and TP in the study basin, with agricultural and aquaculture sources contributing to ammonia-N, and domestic and industrial sources contributing to TP, respectively. Furthermore, the study predicted the future status of non-point source pollution in 2040 by integrating the SWAT model with the GeoSOS-FLUS model to account for land use changes. The findings indicated that a 0.5% increase in built-up land and a 0.1% decline in forest land could lead to a substantial 177% increment in nutrient loads compared to 2018. This underscores the significant influence of land use changes on non-point source pollution in river basins. These results emphasize the importance of considering both temporal and spatial dynamics in managing water quality and controlling non-point source pollution. The findings provide valuable insights for policymakers and stakeholders in implementing effective measures to mitigate pollution, especially in areas experiencing land use changes. Future efforts should focus on sustainable land use practices and targeted pollution control strategies to ensure the long-term health and sustainability of river basins.

Supplementary Materials

The following supporting information can be downloaded at: https://www.mdpi.com/article/10.3390/w15152763/s1, Figure S1: Land use map of Jiulong River (North Stream) basin; Figure S2: Sub-basin division map in study area. Table S1: The meanings and value results of parameters; Table S2: Classification of nutrients loss intensity.

Author Contributions

Z.L.: Conceptualization, Data curation, Investigation, Methodology, and Writing—original draft; W.X.: Conceptualization, Supervision, and Writing—review and editing; E.W.: Writing—review and editing; and S.S.: Writing—review and editing. All authors have read and agreed to the published version of the manuscript.

Funding

This research received no external funding.

Data Availability Statement

Not applicable.

Acknowledgments

The authors acknowledge the Ministry of Ecology and Environment of the People’s Republic of China and the Fujian Provincial Department of Ecology and Environment for the data support of this research, and the support of Chinese Government Scholarship. ChatGPT was applied to polish the language in the Abstract and Conclusions sections.

Conflicts of Interest

The authors declare no conflict of interest.

References

  1. Wan, W.; Han, Y.; Wu, H.; Liu, F.; Liu, Z. Application of the Source–Sink Landscape Method in the Evaluation of Agricultural Non-Point Source Pollution: First Estimation of an Orchard-Dominated Area in China. Agric. Water Manag. 2021, 252, 106910. [Google Scholar] [CrossRef]
  2. Zou, L.; Liu, Y.; Wang, Y.; Hu, X. Assessment and Analysis of Agricultural Non-Point Source Pollution Loads in China: 1978–2017. J. Environ. Manag. 2020, 263, 110400. [Google Scholar] [CrossRef]
  3. Xue, J.; Wang, Q.; Zhang, M. A Review of Non-Point Source Water Pollution Modeling for the Urban–Rural Transitional Areas of China: Research Status and Prospect. Sci. Total Environ. 2022, 826, 154146. [Google Scholar] [CrossRef] [PubMed]
  4. Xueman, Y.; Wenxi, L.; Yongkai, A.; Weihong, D. Assessment of Parameter Uncertainty for Non-Point Source Pollution Mechanism Modeling: A Bayesian-Based Approach. Environ. Pollut. 2020, 263, 114570. [Google Scholar] [CrossRef] [PubMed]
  5. Zhang, X.; Chen, P.; Dai, S.; Han, Y. Analysis of Non-Point Source Nitrogen Pollution in Watersheds Based on SWAT Model. Ecol. Indic. 2022, 138, 108881. [Google Scholar] [CrossRef]
  6. Santos, F.M.D.; De Oliveira, R.P.; Mauad, F.F. Evaluating a Parsimonious Watershed Model versus SWAT to Estimate Streamflow, Soil Loss and River Contamination in Two Case Studies in Tietê River Basin, São Paulo, Brazil. J. Hydrol. Reg. Stud. 2020, 29, 100685. [Google Scholar] [CrossRef]
  7. Di Matteo, M.; Dandy, G.C.; Maier, H.R. A Multi-Stakeholder Portfolio Optimization Framework Applied to Stormwater Best Management Practice (BMP) Selection. Environ. Model. Softw. 2017, 97, 16–31. [Google Scholar] [CrossRef]
  8. Tatum, V.L.; Jackson, C.R.; McBroom, M.W.; Baillie, B.R.; Schilling, E.B.; Wigley, T.B. Effectiveness of Forestry Best Management Practices (BMPs) for Reducing the Risk of Forest Herbicide Use to Aquatic Organisms in Streams. For. Ecol. Manag. 2017, 404, 258–268. [Google Scholar] [CrossRef]
  9. Fan, J.; Kuang, C.; Liu, H.; Wang, D.; Liu, J.; Wang, G.; Zou, Q. Impact of Artificial Islands and Reefs on Water Quality in Jinmeng Bay, China. Water 2023, 15, 959. [Google Scholar] [CrossRef]
  10. Li, H.; Zhang, J.; Zhang, S.; Zhang, W.; Zhang, S.; Yu, P.; Song, Z. A Framework to Assess Spatio-Temporal Variations of Potential Non-Point Source Pollution Risk for Future Land-Use Planning. Ecol. Indic. 2022, 137, 108751. [Google Scholar] [CrossRef]
  11. Lu, W.; Lei, H.; Yang, D.; Tang, L.; Miao, Q. Quantifying the Impacts of Small Dam Construction on Hydrological Alterations in the Jiulong River Basin of Southeast China. J. Hydrol. 2018, 567, 382–392. [Google Scholar] [CrossRef]
  12. Datok, P.; Sauvage, S.; Fabre, C.; Laraque, A.; Ouillon, S.; Moukandi N’kaya, G.; Sanchez-Perez, J.-M. Sediment Balance Estimation of the ‘Cuvette Centrale’ of the Congo River Basin Using the SWAT Hydrological Model. Water 2021, 13, 1388. [Google Scholar] [CrossRef]
  13. Sun, X.; Hu, Z.; Li, M.; Liu, L.; Xie, Z.; Li, S.; Wang, G.; Liu, F. Optimization of Pollutant Reduction System for Controlling Agricultural Non-Point-Source Pollution Based on Grey Relational Analysis Combined with Analytic Hierarchy Process. J. Environ. Manag. 2019, 243, 370–380. [Google Scholar] [CrossRef]
  14. Lin, C.; Wang, Y.; Hu, G.; Yu, R.; Huang, H. Source Apportionment and Transfer Characteristics of Pb in a Soil-Rice-Human System, Jiulong River Basin, Southeast China. Environ. Pollut. 2023, 326, 121489. [Google Scholar] [CrossRef] [PubMed]
  15. Mandrekar, J.N. Receiver Operating Characteristic Curve in Diagnostic Test Assessment. J. Thorac. Oncol. 2010, 5, 1315–1316. [Google Scholar] [CrossRef] [Green Version]
  16. Hou, C.; Chu, M.L.; Botero-Acosta, A.; Guzman, J.A. Modeling Field Scale Nitrogen Non-Point Source Pollution (NPS) Fate and Transport: Influences from Land Management Practices and Climate. Sci. Total Environ. 2021, 759, 143502. [Google Scholar] [CrossRef]
  17. He, R.; Yang, X.; Gassman, P.W.; Wang, G.; Yu, C. Spatiotemporal Characterization of Nutrient Pollution Source Compositions in the Xiaohong River Basin, China. Ecol. Indic. 2019, 107, 105676. [Google Scholar] [CrossRef]
  18. Multi-Scenario Simulation and Optimization Control of Ecological Security Based on GeoSOS-FLUS Model in Ecological Fragile Area in Northeast Qinghai-Tibet Plateau, China—ScienceDirect. Available online: https://www.sciencedirect.com/science/article/pii/S1470160X23004661 (accessed on 12 June 2023).
  19. Wang, H.; Liu, C.; Xiong, L.; Wang, F. The Spatial Spillover Effect and Impact Paths of Agricultural Industry Agglomeration on Agricultural Non-Point Source Pollution: A Case Study in Yangtze River Delta, China. J. Clean. Prod. 2023, 401, 136600. [Google Scholar] [CrossRef]
  20. Wang, L.; Dang, D.; Liu, Y.; Peng, X.; Liu, R. Dynamic Water Environment Capacity Assessment Based on Control Unit Coupled with SWAT Model and Differential Evolution Algorithm. Water 2023, 15, 1817. [Google Scholar] [CrossRef]
  21. Bui, H.H.; Ha, N.H.; Nguyen, T.N.D.; Nguyen, A.T.; Pham, T.T.H.; Kandasamy, J.; Nguyen, T.V. Integration of SWAT and QUAL2K for Water Quality Modeling in a Data Scarce Basin of Cau River Basin in Vietnam. Ecohydrol. Hydrobiol. 2019, 19, 210–223. [Google Scholar] [CrossRef]
  22. Wang, Q.; Liu, R.; Men, C.; Guo, L. Application of Genetic Algorithm to Land Use Optimization for Non-Point Source Pollution Control Based on CLUE-S and SWAT. J. Hydrol. 2018, 560, 86–96. [Google Scholar] [CrossRef]
  23. Zhang, P.; Liu, Y.; Pan, Y.; Yu, Z. Land Use Pattern Optimization Based on CLUE-S and SWAT Models for Agricultural Non-Point Source Pollution Control. Math. Comput. Model. 2013, 58, 588–595. [Google Scholar] [CrossRef]
  24. Mansour, S.; Al-Belushi, M.; Al-Awadhi, T. Monitoring Land Use and Land Cover Changes in the Mountainous Cities of Oman Using GIS and CA-Markov Modelling Techniques. Land Use Policy 2020, 91, 104414. [Google Scholar] [CrossRef]
  25. Jin, H.; Li, H.; Lee, J.; Sun, W. Simulation Analysis of Rural Land Use Using Rate of Change Driven by Population and Economic Dynamics—A Case Study of Huangguashan Village in Chongqing, China. Ecol. Model. 2023, 475, 110204. [Google Scholar] [CrossRef]
  26. Liu, X.; Liang, X.; Li, X.; Xu, X.; Ou, J.; Chen, Y.; Li, S.; Wang, S.; Pei, F. A Future Land Use Simulation Model (FLUS) for Simulating Multiple Land Use Scenarios by Coupling Human and Natural Effects. Landsc. Urban Plan. 2017, 168, 94–116. [Google Scholar] [CrossRef]
  27. Wang, Y.; Shen, J.; Yan, W.; Chen, C. Backcasting Approach with Multi-Scenario Simulation for Assessing Effects of Land Use Policy Using GeoSOS-FLUS Software. MethodsX 2019, 6, 1384–1397. [Google Scholar] [CrossRef]
  28. Huang, H.; Lin, C.; Yu, R.; Yan, Y.; Hu, G.; Wang, Q. Spatial Distribution and Source Appointment of Rare Earth Elements in Paddy Soils of Jiulong River Basin, Southeast China. J. Geochem. Explor. 2019, 200, 213–220. [Google Scholar] [CrossRef]
  29. Yang, X.; Cai, S.; Wu, X.; Zhang, Y.; Li, D.; Chen, Y.; Chen, Q.; Zhu, S.; Yan, D.; Xu, W.; et al. Analysis of the Distribution Characteristics of Enterovirus Types Based on Environmental Surveillance from 2013 to 2021 in Fujian Province, China. Biosaf. Health 2023. [Google Scholar] [CrossRef]
  30. Assessment of Nitrogen Reduction by Constructed Wetland Based on InVEST: A Case Study of the Jiulong River Watershed, China—ScienceDirect. Available online: https://www.sciencedirect.com/science/article/pii/S0025326X18303795 (accessed on 12 June 2023).
  31. Liu, Z.; Rong, L.; Wei, W. Impacts of Land Use/Cover Change on Water Balance by Using the SWAT Model in a Typical Loess Hilly Watershed of China. Geogr. Sustain. 2023, 4, 19–28. [Google Scholar] [CrossRef]
  32. Sharma, A.; Patel, P.L.; Sharma, P.J. Influence of Climate and Land-Use Changes on the Sensitivity of SWAT Model Parameters and Water Availability in a Semi-Arid River Basin. Catena 2022, 215, 106298. [Google Scholar] [CrossRef]
  33. Liu, X.; Wei, M.; Li, Z.; Zeng, J. Multi-Scenario Simulation of Urban Growth Boundaries with an ESP-FLUS Model: A Case Study of the Min Delta Region, China. Ecol. Indic. 2022, 135, 108538. [Google Scholar] [CrossRef]
  34. Abouali, M.; Nejadhashemi, A.P.; Daneshvar, F.; Adhikari, U.; Herman, M.R.; Calappi, T.J.; Rohn, B.G. Evaluation of Wetland Implementation Strategies on Phosphorus Reduction at a Watershed Scale. J. Hydrol. 2017, 552, 105–120. [Google Scholar] [CrossRef]
  35. Wang, S.; Wang, Y.; Wang, Y.; Wang, Z. Assessment of Influencing Factors on Non-Point Source Pollution Critical Source Areas in an Agricultural Watershed. Ecol. Indic. 2022, 141, 109084. [Google Scholar] [CrossRef]
  36. Han, Y.; Liu, Z.; Chen, Y.; Li, Y.; Liu, H.; Song, L.; Chen, Y. Assessing Non-Point Source Pollution in an Apple-Dominant Basin and Associated Best Fertilizer Management Based on SWAT Modeling. Int. Soil Water Conserv. Res. 2023, 11, 353–364. [Google Scholar] [CrossRef]
  37. Electrochemical Ammonia Removal and Disinfection of Aquaculture Wastewater Using Batch and Flow Reactors Incorporating PtRu/Graphite Anode and Graphite Cathode—ScienceDirect. Available online: https://www.sciencedirect.com/science/article/pii/S014486092100011X (accessed on 12 June 2023).
  38. Li, H.; Cui, Z.; Cui, H.; Bai, Y.; Yin, Z.; Qu, K. Hazardous Substances and Their Removal in Recirculating Aquaculture Systems: A Review. Aquaculture 2023, 569, 739399. [Google Scholar] [CrossRef]
  39. de Oliveira, L.M.; Maillard, P.; de Andrade Pinto, E.J. Application of a Land Cover Pollution Index to Model Non-Point Pollution Sources in a Brazilian Watershed. Catena 2017, 150, 124–132. [Google Scholar] [CrossRef]
Figure 1. Location of the Jiulong River (North Stream) basin.
Water 15 02763 g001
Figure 2. Calibration and validation of daily runoff at the Funan station of Jiulong River (North Stream).
Water 15 02763 g002
Figure 3. Calibration and validation of monthly ammonia-N (a) and TP (b) loads at the Funan station of the Jiulong River (North Stream).
Water 15 02763 g003
Figure 4. Annual variations in ammonia-N (A) and TP (B) mass loads during 2010–2018 in Jiulong River (North Stream).
Water 15 02763 g004
Figure 5. Monthly variations in ammonia-N (A) and TP (B) loads during 2010–2018 in Jiulong River (North Stream).
Water 15 02763 g005
Figure 6. Spatial distribution of ammonia-N loss intensity in the Jiulong River (North Stream) basin during 2010–2018. Numbers in the maps refer to the sub-basin IDs.
Water 15 02763 g006
Figure 7. Spatial distribution of TP loss intensity in the Jiulong River (North Stream) basin during 2010–2018. Numbers in the maps refer to the sub-basin IDs.
Water 15 02763 g007
Figure 8. Comparison of land use composition between 2018 and 2040.
Water 15 02763 g008
Figure 9. Comparison of monthly load changes for ammonia-N (A) and TP (B) between 2018 and 2040.
Water 15 02763 g009
Figure 10. Prediction on the spatial distribution of ammonia-N (A) and TP (B) loss intensities in 2040. Numbers in the maps refer to the sub-basin IDs.
Water 15 02763 g010
Table 1. Summary of datasets used in this study.
Data TypeIndicatorTime PeriodResolutionSource
Digital elevation model (DEM)Elevation data201530 mGeospatial Data Cloud (https://www.gscloud.cn (accessed on 6 May 2022))
Land useLand use type201830 mGeospatial Data Cloud
Soil dataSoil type20151:1,000,000Soil Science Database (https://www.geodata.cn (accessed on 6 May 2022))
Meteorological dataPrecipitation,
wind speed,
sunshine,
humidity, and
temperature (mean, maxima, and minima)
2010–2018DailyPrecipitation stations
Weather stations
Measured hydrological dataRunoff2010–2018DailyChina Hydrologic Data Year Book
Measured water quality dataAmmonia-N and
TP
2010–2018MonthlyMinistry of Ecology and Environment of the People’s Republic of China
Fujian Provincial Department of Ecology and Environment
Disclaimer/Publisher’s Note: The statements, opinions and data contained in all publications are solely those of the individual author(s) and contributor(s) and not of MDPI and/or the editor(s). MDPI and/or the editor(s) disclaim responsibility for any injury to people or property resulting from any ideas, methods, instructions or products referred to in the content.

