Article

Geochemical Investigations of the Geothermal Waters in the Kangding Area, SW China: Constraints from Hydrochemistry and D-O-T Isotopy

1
Faculty of Geosciences and Environmental Engineering, Southwest Jiaotong University, Chengdu 611756, China
2
China Railway Eryuan Engineering Group Co., Ltd., Chengdu 610031, China
3
State Key Laboratory of Geohazard Prevention and Geoenvironment Protection, Chengdu University of Technology, Chengdu 610059, China
*
Author to whom correspondence should be addressed.
Water 2023, 15(15), 2761; https://doi.org/10.3390/w15152761
Submission received: 29 June 2023 / Revised: 25 July 2023 / Accepted: 27 July 2023 / Published: 30 July 2023
(This article belongs to the Topic Groundwater Pollution Control and Groundwater Management)

Abstract

:
Geothermal resources, as a representative of clean energy, has been paid significant attention in the world. Due to active neotectonics and widespread magmatic rocks, the abundant geothermal waters in the Kangding area have been investigated. Hydrochemistry and D–O–T isotopy studies were carried out to clarify the genetic mechanism of geothermal waters. The hydrochemical types of geothermal waters are mainly Ca2+–Na+–HCO3 type, Na+–Cl–HCO3 type, and Na+–HCO3 type. Silicate dissolution and the cation exchange process are the water–rock interactions determining hydrochemical compositions. The recharge elevation of geothermal water was calculated to be 3034–3845 m, with an average of 3416 m. The reservoir temperatures of shallow and deep geothermal reservoirs vary from 50 to 115 °C and from 114 to 219 °C, respectively, and the mixing ratio of cold water is 0.56–0.89. These findings help to reveal the genetic mechanism of geothermal waters in the Kangding area.

1. Introduction

The global geothermal resources are mainly distributed in tectonically active plate margins, which are manifested in four major high-temperature geothermal belts: the Pacific Rim, the Mediterranean–Himalayan, the Mid-Atlantic Ridge, and the Red Sea–Gulf of Aden–East African Rift Tropics [1]. In China, the Mediterranean–Himalayan geothermal belt consists of the Tibetan, the western Yunnan, and the western Sichuan geothermal belts [2]. In the context of the “double carbon” goal, the development and utilization of geothermal resources, as clean, green, and stable energy resources, has become a popular research topic globally [3,4,5]. The study of the geothermal genesis mechanism is an important prerequisite for geothermal resource development and utilization. The Earth is releasing energy outward all the time, but high-quality and high-temperature geothermal resources are often distributed in specific areas, which are closely related to the geological structure. Tectonically active volcanic–seismic–orogenic zones tend to form high-temperature geothermal resources, while tectonically gentle cratons tend to form low-to-moderate-temperature geothermal resources or even display no surface heat.
Geothermal fluids constitute a complete circulation of the recharge–runoff–discharge process in the geothermal system, so it is necessary to trace the flow process of geothermal water in the study area by hydrogeochemical signatures. Geothermal water lixiviates minerals during runoff. By analyzing hydrochemical compositions of geothermal waters, it is possible to assess the water–rock reactions experienced by geothermal water with the corresponding hydrogeochemical diagrams [6,7] in the study area. Principal component analysis, a reduced-dimension algorithm, allows the integration of indicators in the spring to discern the main sources of ions [8,9]. The geothermal reservoir temperature is one of the important indicators used to determine the development and utilization of geothermal energy, and the calculation of the geothermal reservoir temperature of geothermal systems is mainly based on empirical formulas, such as SiO2 geothermometer and cation geothermometer [10,11,12,13,14,15]. In addition, geothermal water is often mixed with cold water at the surface during the rising process, and the cold-water mixing ratio can be estimated using methods such as the SiO2 equation.
The northern section of the Sanjiang orogenic belt is located in the southeastern part of the Tibetan Plateau, and is a transitional area between the high-temperature hydrothermal zone in southern Tibet and the high-temperature hydrothermal zone in western Sichuan. Its geothermal water chemistry types include the Na+–HCO3 type, Na+–Cl type, Ca2+ (Mg2+)–SO42− type, and Ca2+ (Mg2+)–HCO3 type [16]. Researchers have investigated the deep thermal structure and crust–mantle heat flow ratio of the Batang–Litang–Kangding high-temperature hydrothermal region using a combination of gravity, magnetism, seism, and helium isotopes, and found that a low-velocity layer exists at a certain depth in the region, which provides the main heat source for the geothermal system [17]. The Xianshuihe Fault is a deep-seated fault. As a regional compression-torsional fracture in the deep crust, the Xianshuihe Fault plays a vital role in determining the hydrothermal activity of the Kangding geothermal area, which not only conducts the deep heat source [18], but also provides a channel for groundwater infiltration. Finally, for the geothermal reservoir temperature of the Kangding geothermal zone, previous studies have evaluated its development potential using the SiO2 geothermometer, cation geothermometer, and chemical-thermodynamic geothermometer [19]. In summary, fruitful research results have been achieved in the Kangding geothermal area. However, due to the complexity of geothermal evolution in the Kangding geothermal area, the water–rock reactions need to be studied in depth and the genetic model has yet to be summarized [19,20,21,22].
Based on field work, hydrochemistry, and D-O-T isotopy, this study aimed to (1) explore the hydrogeochemical evolution; (2) identify the geothermal reservoir characteristics; (3) trace the recharge source and residential time; and (4) build the genetic model of the geothermal waters in the Kangding area. These achievements would provide a significant reference for geothermal exploitation and utilization.

2. Geothermal Geological Background

The study area belongs to the Ganzi Tibetan Autonomous Prefecture of Sichuan Province and is situated at the eastern margin of Tibetan Plateau (Figure 1). The climate is the sub-temperature plateau humid type with annual temperature of −14 to 29 °C and average annual rainfall of 664.4 to 974.8 mm. The terrain is typical of the alpine valley type with an elevation of 1390 to 7556 m. The elevation of the snow line in the area is 4800 m above sea level.
The exposed strata in the study area are mainly the Sinian, Silurian, Devonian, Permian, and Triassic carbonate and sandstone (Figure 2). The magmatic rocks exposed in the study area are mainly Neoproterozoic mafic rocks and Yanshanian to Himalayan granite, which indicates that two phases of magmatic intrusions developed in the study area. The zircon U-Pb dating results indicate that the latest phase of the Gonggarshan granite is a plagioclase formed at 15-4 Ma, which is a product of the recent rapid uplift of the Tibetan Plateau [23,24]. The Yanshanian to Himalayan granite is much younger than the Neoproterozoic Kangding mélange, and the heat generated by the decay of its radioactive elements provides a source of heat for the geothermal system in the region [25,26,27,28]. Due to active neotectonic activity, a number of faults and fractures have developed in the study area. At a regional scale, the Xianshuihe, Longmenshan, and Anninghe faults formed a giant “Y”-shaped tectonic system. The Xianshuihe fault is a strike slip fault, and the Kangding section controls the hydrothermal activity in the study area. The Xianshuihe fault provides a heat-conducting channel for geothermal waters and acts as a water-blocking boundary. The secondary fractures play a role as a water-conducting channel for geothermal water. Geothermal springs are distributed along the faults and secondary fractures. The exposed temperature and flow are 30 to 88 °C and 0.3 to 10.0 L/s, respectively.

3. Sample Collection and Analytical Testing

Eight geothermal water samples and one river water sample were collected in the study area. The temperature and pH values were measured in situ by a portable device (WTW-MultiLine Multi 3310 IDS, Xylem Dewatering Solutions, Inc, Washington, DC, USA). The HCO3 concentration was determined by HNO3 according to the standard titration in the field. All water samples were collected by polyethylene bottles after rinsing at least three times. Afterwards, water samples were sent to the laboratory for hydrochemical and isotopic analyses in the Tianjin Kehui Experimental Co., Ltd., Tianjin, China. The concentrations of the cations (Na+, K+, Ca2+, Mg2+, and H2SiO3) were determined by ICP-OES (ICAP6000, Thermo Fisher Scientific, Waltham, MA, USA). The anion concentrations were analyzed by IC (Dionex ICS600, Thermo Fisher Scientific, Waltham, MA, USA). The detection limit for cations and anions was 1 mg/L, with precision better than 5%. The charge balance between major anions and cations was from −0.61% to +3.87%, within the permission range of ±5%. δD and δ18O were measured using a laser absorption water isotope spectrometer analyzer. The results of δD and δ18O were indicated following the VSMOW standard, with the precisions of 0.1‰ and 0.5‰, respectively. Tritium (3H) were analyzed by the electrolytic enrichment method and presented as tritium units (TU).

4. Results and Discussion

4.1. Hydrochemical Characteristics

The concentration of cations and anions of geothermal waters followed the order of Na+ (112.50–566.10 mg/L) > Ca2+ (3.21–296.59 mg/L) > K+ (20.10–63.40 mg/L) > Mg2+ (0.49–34.05 mg/L), and HCO3 (317.30–1440.07 mg/L) > Cl (12.05–322.60 mg/L) > SO42− (1.92–69.16 mg/L), respectively (Figure 3a). Hence, the major cations and anions of geothermal waters in the study area were Na+ and HCO3, respectively (Table 1). The hydrochemical types of geothermal water in the study area can be classified into three types: Ca2+–Na+–HCO3 (D1), Na+–Cl–HCO3 (D2, D3, D6, D8), and Na+–HCO3 (D3, D5. D7) (Figure 3b). The river sample was the hydrochemical type of Ca2+–Mg2+–HCO3 (D9).

4.2. Ion Source Analysis

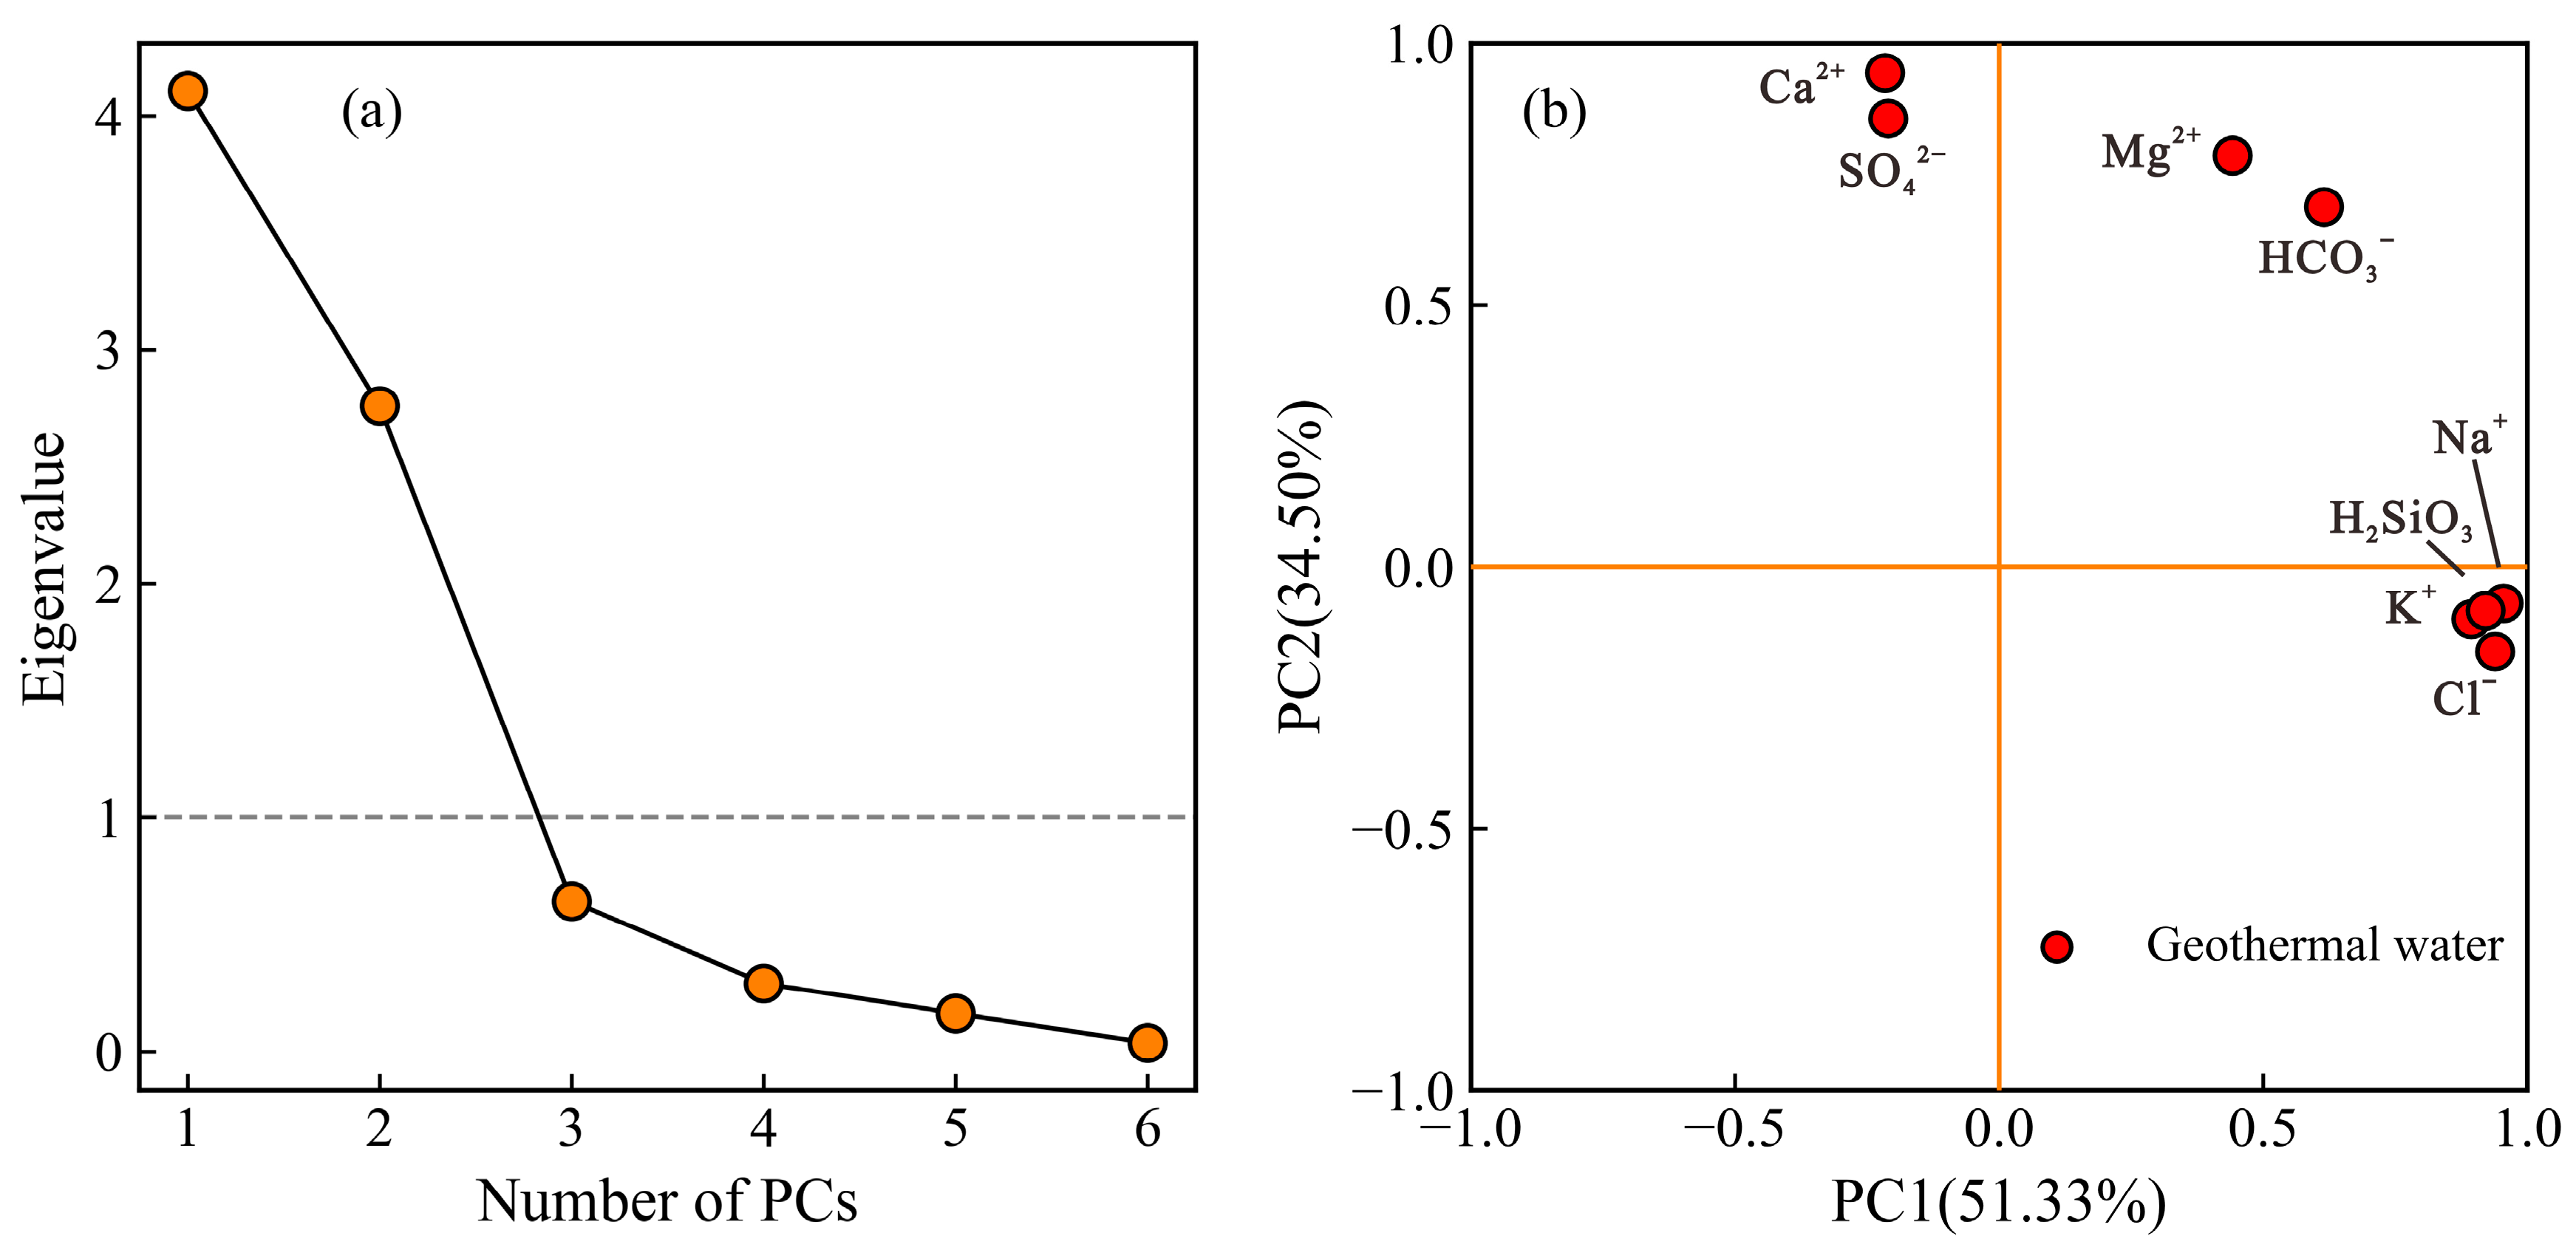
4.2.1. Principal Component Analysis

Principal component analysis aims to transform multiple indicators into a few composite indicators (i.e., principal components) using the idea of dimensionality reduction, and each principal component is used to analyze and interpret the information contained in the original data indicators [8,9,29,30]. In order to identify the sources of major elements in geothermal fluids, the eight indicators of Ca2+, Mg2+, Na+, K+, Cl, SO42−, HCO3, and H2SiO3 of eight geothermal water samples were subjected to principal component analysis in this study. The Kaiser–Meyer–Olkin (KMO) index of 0.72 indicated the robustness of the PCA analysis. Two integrated indicators, PC1 and PC2, were obtained by scree plot (Figure 4a). PC1 included the hydrochemical components of Cl, K+, Na+, and H2SiO3, indicating the similar source from deep fluids. PC2 consisted of the hydrochemical components of Ca2+, Mg2+, SO42−, and HCO3, suggesting that they are determined by water–rock interactions in Equations (1)–(4) (Figure 4b).

4.2.2. Cl Correlation Analysis

Cl is a conservative element in the hydrochemical process and is used to analyze the ion source [31,32,33]. In Figure 5, Cl is significantly positively correlated with Na+, K+, and H2SiO3, and the R2 values are all above 0.65; it was assumed that they were derived from deep fluids. The linear correlation between Cl and HCO3 was slightly higher than that between Cl and Ca2+, Mg2+, and SO42−, which may be due to the influence of mantle degassing and mixing of deep CO2 [34,35]. The positive correlation between Cl and TDS also indicates that geothermal water was mixed with deep fluids. In contrast, the linear correlation between Cl and Ca2+, Mg2+, and SO42− in the geothermal waters was very low, indicating that they had different sources, such as water–rock interaction.

4.2.3. Ion Ratio Analysis

The molar ratio of (Na+ + K+)/Cl is equal to 1 if halite dissolution exists [36]. In this study, the excess Na+ and K+ concentrations indicated they were possibly derived from silicate mineral dissolution (Figure 6a).
When dissolution of carbonate minerals (calcite and dolomite) and gypsum occurs, the equivalence ratio of (Ca2+ + Mg2+ )/(HCO3 + SO42− ) is 1:1 [37]. As shown in Figure 6b, the river water sample was located near the 1:1 line, while all geothermal water samples were distributed above the 1:1 line, which indicates that (Ca2+ + Mg2+) was less than (HCO3 + SO42−). This reveals that the dissolved Ca2+ and Mg2+ concentrations decreased during transport. The dissolution of calcite and dolomite is shown in Equations (1) and (2), respectively:
CO2 + H2O + CaCO3 → Ca2+ + 2HCO3
CaMg(CO2)3 + 2CO2 + 2H2O → Ca2+ + Mg2+ + 4HCO3
The molar ratio of Ca2+ and HCO3 is 1:2 after calcite is dissolved, and the molar ratio of Mg2+ and HCO3 is 1:4 after dolomite is dissolved. As shown in Figure 6c,d, the river water sample is plotted near the calcite dissolution line and dolomite dissolution line, while the geothermal water samples are situated above the calcite dissolution line and dolomite dissolution line. The plots further prove that the dissolved Ca2+ and Mg2+ concentrations in calcite and dolomite are diluted during the transport. If geothermal water leaches gypsum (or hard gypsum), the molar ratio of Ca2+ to SO42− is 1:1 (Equation (3)).
CaSO4 − nH2O → Ca2+ + SO42− + nH2O
As shown in Figure 6e, all samples are located above the gypsum (or hard gypsum) dissolution line, which indicates that gypsum (or hard gypsum) was not dissolved in geothermal water. If evaporated sulfate minerals are dissolved in geothermal water, the following reaction would occur in solution according to the co-ion effect (Equation (4)):
2HCO3 + CaSO4 − nH2O → CaCO3 ↓ + CO2 ↑ + SO42− + (1 + n)H2O
HCO3 and SO42− would be negatively correlated. HCO3 and SO42− did not show a significant negative correlation, which further indicates that the sulfate mineral gypsum (or hard gypsum) was not dissolved. The Na+ concentration was higher than the Cl concentration, which may be due to the dissolution of sodium feldspar and other sodium-containing minerals. In addition, the influence of cation exchange and adsorption would cause the Na+ and K+ concentrations of rocks to be replaced by Ca2+ and Mg2+ of groundwater (Figure 6f). As shown in Figure 6g, the CAI-I and CAI-II values of geothermal water samples are below zero, which proves that the geothermal water underwent cation exchange reaction [38,39]. Hence, the geothermal waters were subject to cation exchange and adsorption, which caused changes in the chemical composition in geothermal water. As shown in Figure 6h, some geothermal water points are located near the 100 °C equilibrium line (black) of kaolinite and sodium feldspar, and some of the geothermal water points are located near the 200 °C equilibrium line (red) of kaolinite and sodium mica, which indicates that hydrothermal alteration was a source of Na+ concentration in geothermal water. Figure 6i also illustrates that the K+ concentration of geothermal water was derived from the dissolution of muscovite and kaolinite.

4.3. Recharge Source and Residential Time by D-O-T Isotopes

4.3.1. Recharge Source

Hydrogen and oxygen isotopes can be used to calculate the geothermal water recharge elevation, determine the source of geothermal water recharge, and estimate the intensity of geothermal water–rock interaction [19,40]. As shown in Figure 7, the geothermal water samples and river water sample basically follow the global atmospheric precipitation line or the local atmospheric precipitation line. Compared with the river water sample, geothermal water samples deviate in a rightward direction (oxygen isotope drift). Since oxygen isotope exchange occurred between geothermal water and aquifer rock, the deuterium isotope was more suitable for estimating the recharge elevation of geothermal water in this study, and the calculation formula is shown in Equation (5):
H = R R ρ × 100 + h
where H is the recharge elevation (m), R is the δD isotopic value of geothermal water (‰), R’ is the δD isotopic value of atmospheric precipitation (‰), h is the elevation of atmospheric precipitation (m), and ρ is the δD isotope gradient value of atmospheric precipitation in the study area, which is taken as −2.6‰/100 m [41]. The recharge elevation of geothermal waters varied from 3034 m to 3845 m, with an average of 3416 m (Table 1). The results demonstrated the geothermal waters were recharged by atmospheric precipitation and snow melt water in the study area.

4.3.2. Residential Time

In this study, the age range or average retention time of groundwater was estimated qualitatively by tritium; tritium content less than 1 TU in geothermal fluid is considered to be mainly due to recharge of sub-modern water before 1952 [44]. As shown in Figure 8a, the tritium contents of geothermal waters were greater than 1 TU, which indicates that geothermal water runoff was fast and easily renewed. Due to active local neotectonic activities, faults and fractures developed in the study area. In addition, the geomorphology of the study area was of the alpine canyon type, with a large terrain drop and strong hydrodynamic conditions. As the tritium isotope content increases in geothermal water, the δ18O values increase in solution, the TDS content decreases, and the recharge elevation also tends to decrease (Figure 8b). On the one hand, the lower tritium content in geothermal water indicates that the longer the residential time of geothermal water and the stronger the water–rock interaction, the greater the solution TDS content. On the other hand, it was speculated that when geothermal water leached minerals, the lighter oxygen isotopes in minerals were easily carried to the aqueous solution, which made the solution δ18O values lower [45]. Finally, the geothermal water with higher recharge elevation has a larger water table, making it infiltrate to a deep level and increasing its circulation time (Figure 8c).

4.4. Geothermal Reservoir

4.4.1. Water–Rock Equilibrium State

In the Na-K-Mg triangle diagram, the geothermal water samples are all located in the “immature water” area [46] (Figure 9). This indicates that the intensity of the geothermal water–rock interaction was not high in the study area, so this study was not suitable for calculating the geothermal reservoir temperature using the cation geothermometer.
The mineral saturation index (SI) of the geothermal waters was calculated using Phreeqc software with the database of phreeqc.dat, and the calculation results are shown in Table 2. The mineral saturation index was lower than zero, indicating the unsaturated condition. Hard gypsum and gypsum were in unsaturated state, which may be due to the fact that there is no widely distributed paste salt layer in the study area, and the geothermal water did not fully dissolve and filter hard gypsum and gypsum in the runoff process. Calcite and dolomite were basically saturated, which was due to the extensive existence of carbonate rocks in the study area and the full dissolution and filtration of carbonate minerals by geothermal water in the runoff process. Quartz and chalcedony were basically in equilibrium, which provides a theoretical basis and data support for the calculation of the geothermal reservoir temperature by a SiO2 geothermometer.

4.4.2. Geothermal Geothermometer

(1)
SiO2 geothermometer
The SiO2 geothermometer is often used to calculate the temperature of geothermal reservoirs [47]. This study used quartz and chalcedony geothermometers for calculations and, after analysis, a suitable geothermometer was selected to represent the temperature of the shallow geothermal reservoir in the Kangding area. The equation for calculating the quartz geothermometer is shown as follows:
No steam loss:
T = 1309/(5.19 − lgSiO2) − 273.15
Boiling flash steam:
T = 1522/(5.75 − lgSiO2) − 273.15
The formula for calculating the chalcedony geothermometer is shown below:
T = 1032/(4.69 − lgSiO2) − 273.15
The calculation results are shown in Table 3.
The geothermal reservoir temperature range calculated by the quartz geothermometer without steam loss was 81–141 °C, and the average value was 116 °C; the geothermal reservoir temperature range calculated by the quartz boiling flash geothermometer was 85–136 °C, and the average value was 115 °C; the geothermal reservoir temperature range calculated by the chalcedony geothermometer was 50–115 °C, and the average value was 88 °C. The quartz geothermometer is suitable for high-temperature geothermal systems with geothermal reservoir temperature higher than 150 °C, and the geothermal reservoir temperature calculated by the quartz geothermometer was lower than 150 °C, so the chalcedony geothermometer was used to calculate the shallow geothermal reservoir temperature of the area. Hence, the shallow geothermal reservoir temperature of Kangding geothermal area was 50–115 °C.
In order to accurately calculate the initial temperature of geothermal water (deep geothermal reservoir temperature), as well as the cold water mixing ratio, this study used the silicon enthalpy equation method to analyze the geothermal water samples [48]. The silicon enthalpy equation method utilizes the following equations:
Hc X + Hh (1 − X) = Hs
Sic X + Sih (1 − X) = Sis
where Hc, Hh, and Hs are the enthalpy of surface cold water, enthalpy of deep geothermal water, and enthalpy of hot spring water, respectively; Sic, Sih, and Sis are the SiO2 content of surface cold water, SiO2 content of deep geothermal water, and SiO2 content of hot spring water, respectively; X is the cold-water mixing ratio.
In this study, the river water in the Kangding geothermal area was used as the cold end of the surface, and the silicon enthalpy mixing curve of the study area was drawn as shown in Figure 10. As a result, the deep heat storage temperature range was 114–219 °C, and the shallow cold water mixing ratio was 0.56–0.89.
(2)
Geochemical thermodynamic geothermometer
The geochemical thermodynamic geothermometer, i.e., the multi-mineral equilibrium graphical method, is a method used to calculate the geothermal reservoir temperature of the geothermal system based on the mineral saturation index (SI) [49]. It is based on the principle that the dissolved state of multiple minerals in water is considered a function of temperature; if a group of minerals approaches equilibrium at a specific temperature at the same time, the geothermal water can be judged to have reached equilibrium with this group of minerals, and the temperature at this time is the geothermal reservoir temperature. The calculation of the mineral saturation index is shown in Equation (11):
SI = logQ/K = logQ − logK
where Q is the mineral activity product and K is the mineral equilibrium constant.
In this study, the point D2 with the highest surface outcrop temperatures was selected for geochemical thermodynamic geothermometer calculation, and the result is shown in Figure 11. The mineral saturation index of hot spring site D2 showed convergence around 200 °C, which further indicates that the deep geothermal reservoir temperature calculated in this study was reasonable, i.e., the deep geothermal reservoir in the Kangding geothermal area was about 200 °C.

4.5. Genetic Model of Geothermal Waters in the Study Area

Comprehensive analysis of the above conceptual model of the geothermal system in the study area, as derived in this study, is shown in Figure 12. The study area is located in a region where a low-velocity, high-conductivity layer existed within the crust, which was considered to be a local melt. Ice melt water and atmospheric precipitation infiltrated along the tectonic fissures under great head pressure, and after heating by radioactive element decay in granite and heating by a deep local melt body, magma water was mixed in the deep thermal reservoir. Then, the geothermal fluid rose along the secondary water-conducting fractures of Xianshuihe fault and mixed with the infiltrated cold water in the shallow fissure thermal reservoir, and the cold-water mixing ratio was about 73%. After mixing, the geothermal water continued to rise along the dominant fractures and finally emerged as springs at the surface.

5. Conclusions

By analyzing the geological and hydrogeochemical conditions of the study area, this study identified the water–rock interaction, determined the geothermal reservoir temperature of the geothermal system, and finally explored the genesis mode of the geothermal system in the Kangding geothermal area.
(1)
The hydrochemical types of Kangding geothermal water were mainly Ca2+–Na+–HCO3 type, Na+–HCO3 type, and Na+–HCO3 type. The hydrochemical characteristics of geothermal water were mainly influenced by deep fluid mixing and water–rock interactions in the Kangding geothermal area.
(2)
The temperature of the deep geothermal reservoir was 114–219 °C, the temperature of the shallow geothermal reservoir was 50–115 °C, and the mixing ratio of cold water was 0.56–0.89.
(3)
The geothermal water was affected by water–rock interactions in the study area, and there was a certain degree of the “oxygen isotope drift” phenomenon. In this study, the recharge elevation of geothermal water was calculated to be 3034–3845 m, with an average of 3416 m.
(4)
The source of geothermal waters was atmospheric precipitation and high mountain ice and snow melt water in Kangding geothermal area. It was heated by a radioactive element decay in the granite and local melt body in the deep part, and mixed with magma water in the deep geothermal reservoir. Then, the geothermal fluid rose along the secondary fractures of Xianshui River, mixed with cold water in the shallow geothermal reservoir, and was exposed at the surface, thereby becoming springs.

Author Contributions

Writing—original draft preparation, investigation, methodology, X.Z.; writing—review and editing, software, data curation, C.D.; supervision, project administration, funding acquisition, T.F., resources, data curation, Y.Z. All authors have read and agreed to the published version of the manuscript.

Funding

This research was funded by National Natural Science Foundation of China grant number [42072313, 42102334], Sichuan Science and Technology Program grant number [2023YFS0356], Scientific Key R&D project of the Tibet Autonomous Region grant number [XZ202201ZY0021G], Opening fund of State Key Laboratory of Geohazard Prevention and Geoenvironment Protection (Chengdu University of Technology) grant number [SKLGP2022K017].

Data Availability Statement

All the research data has been provided in the paper.

Conflicts of Interest

The authors declare no conflict of interest.

References

  1. Muffler, L.J.P. Tectonic and hydrologic control of the nature and distribution of geothermal resources. Geo-Heat Cent. Q. Bull. 1993, 15, 1–10. [Google Scholar]
  2. Tang, X.; Zhang, J.; Pang, Z.; Hu, S.; Tian, J.; Bao, S. The eastern Tibetan Plateau geothermal belt, western China: Geology, geophysics, genesis, and hydrothermal system. Tectonophysics 2017, 717, 433–448. [Google Scholar] [CrossRef]
  3. Guo, Q.; Planer-Friedrich, B.; Liu, M.; Yan, K.; Wu, G. Magmatic fluid input explaining the geochemical anomaly of very high arsenic in some southern Tibetan geothermal waters. Chem. Geol. 2019, 513, 32–43. [Google Scholar] [CrossRef]
  4. Liu, M.; Guo, Q.; Wu, G.; Guo, W.; She, W.; Yan, W. Boron geochemistry of the geothermal waters from two typical hydrothermal systems in Southern Tibet (China): Daggyai and Quzhuomu. Geothermics 2019, 82, 190–202. [Google Scholar] [CrossRef]
  5. Tian, J.; Pang, Z.; Wang, Y.; Guo, Q. Fluid geochemistry of the Cuopu high temperature geothermal system in the eastern Himalayan syntaxis with implication on its genesis. Appl. Geochem. 2019, 110, 104422. [Google Scholar] [CrossRef]
  6. Apollaro, C.; Fuoco, I.; Gennaro, E.; Giuliani, L.; Iezzi, G.; Marini, L.; Radica, F.; Di Luccio, F.; Ventura, G.; Vespasiano, G. Advanced argillic alteration at Cave di Caolino, Lipari, Aeolian Islands (Italy): Implications for the mitigation of volcanic risks and the exploitation of geothermal resources. Sci. Total Environ. 2023, 889, 164333. [Google Scholar] [CrossRef]
  7. Fuoco, I.; Figoli, A.; Criscuoli, A.; Brozzo, G.; De Rosa, R.; Gabriele, B.; Apollaro, C. Geochemical modeling of chromium release in natural waters and treatment by RO/NF membrane processes. Chemosphere 2020, 254, 126696. [Google Scholar] [CrossRef]
  8. Griffiths, J.C. Statistics and Data Analysis in Geology. Technometrics 2005, 47, 526–527. [Google Scholar]
  9. Zhang, X.; Guo, Q.; Liu, M.; Luo, J.; Yin, Z.; Zhang, C.; Zhu, M.; Guo, W.; Li, J.; Zhou, C. Hydrogeochemical processes occurring in the hydrothermal systems of the Gonghe–Guide basin, northwestern China: Critical insights from a principal components analysis (PCA). Environ. Earth Sci. 2016, 75, 1187. [Google Scholar] [CrossRef]
  10. Cioni, R.; Marini, L. A Thermodynamic Approach to Water Geothermometry; Springer: Berlin/Heidelberg, Germany, 2020. [Google Scholar] [CrossRef]
  11. Fournier, R.O.; Truesdell, A.H. An empirical Na K Ca geothermometer for natural waters. Geochim. et Cosmochim. Acta 1973, 37, 1255–1275. [Google Scholar] [CrossRef]
  12. García-López, C.; Pandarinath, K.; Santoyo, E. Solute and gas geothermometry of geothermal wells: A geochemometrics study for evaluating the effectiveness of geothermometers to predict deep reservoir temperatures. Int. Geol. Rev. 2014, 56, 2015–2049. [Google Scholar] [CrossRef]
  13. Santoyo, E.; Díaz-González, L. A New Improved Proposal of the Na/K Geothermometer to Estimate Deep Equilibrium Temperatures and their Uncertainties in Geothermal Systems. In Proceedings of the World Geothermal Congress, Bali, Indonesia, 1 November 2009. [Google Scholar]
  14. Verma, S.P.; Pandarinath, K.; Santoyo, E. SolGeo: A new computer program for solute geothermometers and its application to Mexican geothermal fields. Geothermics 2008, 37, 597–621. [Google Scholar] [CrossRef]
  15. Verma, S.P.; Santoyo, E. New improved equations for NaK, NaLi and SiO2 geothermometers by outlier detection and rejection. J. Volcanol. Geotherm. Res. 1997, 79, 9–23. [Google Scholar] [CrossRef]
  16. Yi, L.; Qi, J.; Li, X.; Xu, M.; Zhang, X.; Zhang, Q.; Tang, Y. Geochemical characteristics and genesis of the high-temperature geothermal systems in the north section of the Sanjiang Orogenic belt in southeast Tibetan Plateau. J. Volcanol. Geotherm. Res. 2021, 414, 107244. [Google Scholar] [CrossRef]
  17. Zhang, J.; Li, W.; Tang, X.; Tian, J.; Wang, Y.; Guo, Q.; Pang, Z. Geothermal data analysis at the high-temperature hydrothermal area in Western Sichuan. Sci. China Earth Sci. 2017, 60, 1507–1521. [Google Scholar] [CrossRef]
  18. Qi, J.; Xu, M.; An, C.; Wu, M.; Zhang, Y.; Li, X.; Zhang, Q.; Lu, G. Characterizations of geothermal springs along the Moxi deep fault in the western Sichuan plateau, China. Phys. Earth Planet. Inter. 2017, 263, 12–22. [Google Scholar] [CrossRef]
  19. Luo, J.; Pang, Z.; Kong, Y.; Wang, Y. Geothermal potential evaluation and development prioritization based on geochemistry of geothermal waters from Kangding area, western Sichuan, China. Environ. Earth Sci. 2017, 76, 343. [Google Scholar] [CrossRef]
  20. Guo, Q.; Pang, Z.; Wang, Y.; Tian, J. Fluid geochemistry and geothermometry applications of the Kangding high-temperature geothermal system in eastern Himalayas. Appl. Geochem. 2017, 81, 63–75. [Google Scholar] [CrossRef]
  21. Li, X.; Huang, X.; Liao, X.; Zhang, Y. Hydrogeochemical Characteristics and Conceptual Model of the Geothermal Waters in the Xianshuihe Fault Zone, Southwestern China. Int. J. Environ. Res. Public Health 2020, 17, 500. [Google Scholar] [CrossRef] [Green Version]
  22. Zhang, Y.; Xu, M.; Li, X.; Qi, J.; Zhang, Q.; Guo, J.; Yu, L.; Zhao, R. Hydrochemical Characteristics and Multivariate Statistical Analysis of Natural Water System: A Case Study in Kangding County, Southwestern China. Water 2018, 10, 80. [Google Scholar] [CrossRef] [Green Version]
  23. Roberts, N.M.W.; Searle, M.P. Zircon U–Pb–Hf constraints from Gongga Shan granites on young crustal melting in eastern Tibet. Geosci. Front. 2019, 10, 885–894. [Google Scholar] [CrossRef]
  24. Searle, M.P.; Roberts, N.M.W.; Chung, S.-L.; Lee, Y.-H.; Cook, K.L.; Elliott, J.R.; Weller, O.M.; St-Onge, M.R.; Xu, X.-W.; Tan, X.-B.; et al. Age and anatomy of the Gongga Shan batholith, eastern Tibetan Plateau, and its relationship to the active Xianshui-he fault. Geosphere 2016, 12, 948–970. [Google Scholar] [CrossRef] [Green Version]
  25. Arevalo, R.; McDonough, W.F.; Luong, M. The K/U ratio of the silicate Earth: Insights into mantle composition, structure and thermal evolution. Earth Planet. Sci. Lett. 2009, 278, 361–369. [Google Scholar] [CrossRef]
  26. de Sigoyer, J.; Vanderhaeghe, O.; Duchêne, S.; Billerot, A. Generation and emplacement of Triassic granitoids within the Songpan Ganze accretionary-orogenic wedge in a context of slab retreat accommodated by tear faulting, Eastern Tibetan plateau, China. J. Asian Earth Sci. 2014, 88, 192–216. [Google Scholar] [CrossRef]
  27. Lai, S.-C.; Zhao, S.-W. Petrogenesis of the Zheduoshan Cenozoic granites in the eastern margin of Tibet: Constraints on the initial activity of the Xianshuihe Fault. J. Geodyn. 2018, 117, 49–59. [Google Scholar] [CrossRef]
  28. Rybach, L. Radioactive heat production in rocks and its relation to other petrophysical parameters. Pure Appl. Geophys. 1976, 114, 309–317. [Google Scholar] [CrossRef]
  29. Jiang, Y.; Guo, H.; Jia, Y.; Cao, Y.; Hu, C. Principal component analysis and hierarchical cluster analyses of arsenic groundwater geochemistry in the Hetao basin, Inner Mongolia. Geochemistry 2015, 75, 197–205. [Google Scholar] [CrossRef]
  30. Seyedrahimi-Niaraq, M.; Mahdiyanfar, H.; Mokhtari, A.R. Integrating principal component analysis and U-statistics for mapping polluted areas in mining districts. J. Geochem. Explor. 2022, 234, 106924. [Google Scholar] [CrossRef]
  31. Nyakairu, G.W.A.; Kasule, J.; Ouma, O.; Bahati, G. Origin and hydrogeochemical formation processes of geothermal fluids from the Kibiro area, Western Uganda. Appl. Geochem. 2023, 152, 105648. [Google Scholar] [CrossRef]
  32. Wang, X.; Luo, Z.; Xu, C.; Lv, Y.; Cheng, L.; Zhang, Y. Formation mechanism of a carbonate geothermal system and calculation of the reservoir temperature under complex conditions. Geothermics 2022, 99, 102295. [Google Scholar] [CrossRef]
  33. Wang, Y.; Li, L.; Wen, H.; Hao, Y. Geochemical evidence for the nonexistence of supercritical geothermal fluids at the Yangbajing geothermal field, southern Tibet. J. Hydrol. 2022, 604, 127243. [Google Scholar] [CrossRef]
  34. Bärenbold, F.; Schmid, M.; Brennwald, M.S.; Kipfer, R. Missing atmospheric noble gases in a large, tropical lake: The case of Lake Kivu, East-Africa. Chem. Geol. 2020, 532, 119374. [Google Scholar] [CrossRef]
  35. Stefánsson, A.; Sveinbjörnsdóttir, Á.E.; Heinemeier, J.; Arnórsson, S.; Kjartansdóttir, R.; Kristmannsdóttir, H. Mantle CO2 degassing through the Icelandic crust: Evidence from carbon isotopes in groundwater. Geochim. Cosmochim. Acta 2016, 191, 300–319. [Google Scholar] [CrossRef]
  36. Wang, Y.; Yuan, X.; Zhang, Y.; Zhang, X.; Xiao, Y.; Duo, J.; Huang, X.; Sun, M.; Lv, G. Hydrochemical, D–O–Sr isotopic and electromagnetic characteristics of geothermal waters from the Erdaoqiao area, SW China: Insights into genetic mechanism and scaling potential. Ore Geol. Rev. 2023, 158, 105486. [Google Scholar] [CrossRef]
  37. Yang, P.; Luo, D.; Hong, A.; Ham, B.; Xie, S.; Ming, X.; Wang, Z.; Pang, Z. Hydrogeochemistry and geothermometry of the carbonate-evaporite aquifers controlled by deep-seated faults using major ions and environmental isotopes. J. Hydrol. 2019, 579, 124116. [Google Scholar] [CrossRef]
  38. Carol, E.; Kruse, E.; Mas-Pla, J. Hydrochemical and isotopical evidence of ground water salinization processes on the coastal plain of Samborombón Bay, Argentina. J. Hydrol. 2009, 365, 335–345. [Google Scholar] [CrossRef]
  39. Chen, L.; Wang, G.; Hu, F.; Wang, Y.; Liu, L. Groundwater hydrochemistry and isotope geochemistry in the Turpan Basin, northwestern China. J. Arid Land 2013, 6, 378–388. [Google Scholar] [CrossRef] [Green Version]
  40. Wang, S.; Liu, Z.; Shao, J. Hydrochemistry and H-O-C-S Isotopic Geochemistry Characteristics of Geothermal Water in Nyemo-Nagqu, Tibet. Acta Geol. Sin.-Engl. Ed. 2017, 91, 644–657. [Google Scholar] [CrossRef]
  41. Sun, M.; Zhang, X.; Yuan, X.; Yu, Z.; Xiao, Y.; Wang, Y.; Zhang, Y. Hydrochemical Characteristics and Genetic Mechanism of Geothermal Springs in the Aba Area, Western Sichuan Province, China. Sustainability 2022, 14, 12824. [Google Scholar] [CrossRef]
  42. Craig, H. Isotopic Variations in Meteoric Waters. Science 1961, 133, 1702–1703. [Google Scholar] [CrossRef]
  43. Xiangyang, S.; Genxu, W.; Juying, S.; Shouqin, S.; Zhaoyong, H.; Chunlin, S.; Shan, L. Contrasting water sources used by a coniferous forest in the high-altitude, southeastern Tibetan Plateau. Sci. Total Environ. 2022, 849, 157913. [Google Scholar] [CrossRef] [PubMed]
  44. Thomas, M.A. The association of arsenic with redox conditions, depth, and ground-water age in the glacial aquifer system of the northern United States. In Scientific Investigations Report; US Geological Survey: Reston, VA, USA, 2007. [Google Scholar]
  45. Pasvanoğlu, S. Geochemical Survey of low- temperature geothermal resource of the Reşadiye Spa (Tokat, Northern Turkey). Geothermics 2021, 94, 102088. [Google Scholar] [CrossRef]
  46. Giggenbach, W.F. Geothermal solute equilibria. Derivation of Na-K-Mg-Ca geoindicators. Geochim. Cosmochim. Acta 1988, 52, 2749–2765. [Google Scholar] [CrossRef]
  47. Fournier, R.O.; Berger, B.R.; Bethke, P.M. The Behavior of Silica in Hydrothermal Solutions. In Geology and Geochemistry of Epithermal Systems; Society of Economic Geologists: Littleton, CO, USA, 1985; Volume 2. [Google Scholar]
  48. Fournier, R.O. Chemical geothermometers and mixing models for geothermal systems. Geothermics 1977, 5, 41–50. [Google Scholar] [CrossRef]
  49. Reed, M.H. Calculation of multicomponent chemical equilibria and reaction processes in systems involving minerals, gases and an aqueous phase. Geochim. Cosmochim. Acta 1982, 46, 513–528. [Google Scholar] [CrossRef]
Figure 1. (a) Location of the Kangding county in China, (b) Location of the study are in the Kangding county, (c) Distribution of collected samples in the study area.
Water 15 02761 g001
Figure 2. (a) Geological map of the study area, (b) Geological section A–B.
Water 15 02761 g002
Figure 3. (a) Schöller diagram, (b) Piper trilinear diagram of geothermal waters.
Water 15 02761 g003
Figure 4. Principal component analysis of geothermal waters: (a) scree plot, (b) PC1 vs. PC2.
Water 15 02761 g004
Figure 5. Relationship between Cl and hydrochemical parameters: (a) Ca2+, (b) Mg2+, (c) Na+, (d) K+, (e) SO42−, (f) HCO3, (g) H2SiO3, (h) TDS; (i) correlation matrix.
Water 15 02761 g005
Figure 6. Hydrochemical analysis diagrams: (a) Na+ + K+ vs. Cl, (b) Ca2+ + Mg2+ vs. HCO3 + SO42−, (c) Ca2+ vs. HCO3, (d) Mg2+ vs. HCO3, (e) SO42− vs. Ca2+, (f) Na+ + K+–Cl vs. (Ca2+ + Mg2+)–(HCO3 + SO42−), (g) CAI-I vs. CAI-II, (h) lg(SiO2) vs. lg(Na+/H+), (i) lg(SiO2) vs. lg(K+/H+).
Water 15 02761 g006
Figure 7. δ18O vs. δD relationship diagram. GMWL: Global Meteoric Water Line [42]; LMOW: Local Meteoric Water Line [43].
Water 15 02761 g007
Figure 8. (a) The content of tritium and (b) δ18O vs. tritium. Arrows indicate the increasing effects of altitude, depth of circulation, and residence time. (c) TDS vs. tritium diagram. Local circulation system indicates shallow circulation, short residence time, and rapid response to precipitation. Deep groundwater system indicates longer residence time and different depths.
Water 15 02761 g008
Figure 9. Na-K-Mg triangle in the geothermal water area.
Water 15 02761 g009
Figure 10. Relations between fraction of cold water and temperature in the mixing model. (Red curve = enthalpy, black curve = silica; the brackets at the intersection point show the initial geothermal temperature on the left and the mixing ratio of cold water on the right).
Water 15 02761 g010
Figure 11. Mineral equilibria graph of D2 sample.
Water 15 02761 g011
Figure 12. Conceptual model of the geothermal system in Kangding area.
Water 15 02761 g012
Table 1. Hydrochemical and D-O-3H isotopic results of geothermal water and river water samples.
Sample IDSample TypeElevation
(m)
Flow
(L/s)
Discharge T
(°C)
pHTDS
(mg/L)
Charge
Balance
(%)
Hydrochemical TypeNa+
(mg/L)
K+
(mg/L)
D1Geothermal water260010.0426.212620.63Ca2+·Na+–HCO3153.5020.10
D229702.0887.110910.65Na+–Cl·HCO3325.7063.40
D327800.2306.53960.84Na+–HCO3112.5020.20
D429201.0656.47883.87Na+–Cl·HCO3246.5027.50
D529121.0727.116542.10Na+–HCO3566.1051.20
D628602.0857.21420−0.61Na+–Cl·HCO3512.1047.40
D732961.0547.63661.14Na+–HCO3136.5023.30
D829780.3746.813322.07Na+–Cl·HCO3459.6045.50
D9River water2968-107.51090.15Ca2+·Mg2+–HCO310.302.70
Sample IDCa2+Mg2+ClSO42−HCO3H2SiO3δDδ18O3HRecharge elevation
mg/Lmg/Lmg/Lmg/Lmg/Lmg/L‰VSMOW‰VSMOWTUm
D1296.5927.2454.5969.161281.4258.50−113.2−15.306.893034
D248.1017.02232.5538.42732.24138.90−118.0−15.514.013076
D323.258.7661.6811.53317.3040.70−112.1−15.43-3261
D461.7210.21165.205.76576.03109.90−118.9−15.625.153296
D552.1034.05226.883.841440.07114.80−128.2−16.033.143541
D613.637.30266.583.841066.63117.80−127.5−16.143.153626
D73.210.4912.051.92378.3240.90−133.2−18.201.733652
D845.6914.11322.605.76878.69139.10−125.3−16.15-3845
D920.047.304.259.61109.8412.00−110.4−15.265.63-
Table 2. Calculation results of mineral saturation index in the study area.
AnhydriteCalciteChalcedonyDolomiteGypsumQuartz
D1−1.620.39−0.090.25−1.490.29
D2−1.980.85−0.131.58−2.290.13
D3−3.23−0.95−0.12−1.93−2.980.3
D4−2.87−0.03−0.04−0.33−2.970.28
D5−3.280.91−0.082.13−3.450.22
D6−3.60.49−0.181.08−3.880.09
D7−4.57−0.34−0.37−0.97−4.56−0.03
D8−3.010.45−0.010.85−3.190.28
Table 3. Calculated results of quartz and chalcedony geothermal geothermometer in Kangding geothermal area (°C).
Field SurveySilica GeothermometerSilicon Enthalpy Equation
Sample IDDischarge TQuartz
(No Vapor
Loss)
Quartz
(Maximum
Vapor Loss)
ChalcedonyCold Water
Mixing
Ratio
Reservoir
Temperature
-°C°C°C°C%°C
D14297986782181
D28814113611558194
D33081855089180
D46512812510073205
D57213012710367196
D68513212810456178
D75481855058114
D87414113611570219
Disclaimer/Publisher’s Note: The statements, opinions and data contained in all publications are solely those of the individual author(s) and contributor(s) and not of MDPI and/or the editor(s). MDPI and/or the editor(s) disclaim responsibility for any injury to people or property resulting from any ideas, methods, instructions or products referred to in the content.

