Article

Simulating Changes in Hydrological Extremes—Future Scenarios for Morocco

1
Research and Education Department, RSS-Hydro, Kayl, L-3593 Luxembourg, Luxembourg
2
School of Geographical Sciences, University of Bristol, Bristol BS8 1QU, UK
3
DFO—Flood Observatory, INSTAAR, University of Colorado, Boulder, CO 80309-0545, USA
4
FathomTM, Square Works, Bristol BS8 1HB, UK
5
German Institute for Development Evaluation, 53113 Bonn, Germany
*
Author to whom correspondence should be addressed.
Water 2023, 15(15), 2722; https://doi.org/10.3390/w15152722
Submission received: 12 June 2023 / Revised: 24 July 2023 / Accepted: 25 July 2023 / Published: 28 July 2023
(This article belongs to the Special Issue Impacts of Climate Change on Water Resources and Water Risks)

Abstract

:
This paper presents a comprehensive river discharge analysis to estimate past and future hydrological extremes across Morocco. Hydrological simulations with historical forcing and climate change scenario inputs have been performed to better understand the change in magnitude and frequency of extreme discharge events that cause flooding. Simulations are applied to all major rivers of Morocco, including a total of 16 basins that cover the majority of the country. An ensemble of temperature and precipitation input parameter sets was generated to analyze input uncertainty, an approach that can be extended to other regions of the world, including data-sparse regions. Parameter uncertainty was also included in the analyses. Historical simulations comprise the period 1979–2021, while future simulations (2015–2100) were performed under the Shared Socioeconomic Pathway (SSP) 2–4.5 and SSP5–8.5. Clear patterns of changing flood extremes are projected; these changes are significant when considered as a proportion of the land area of the country. Two types of basins have been identified, based on their different behavior in climate change scenarios. In the Northern/Mediterranean basins we observe a decrease in the frequency and intensity of events by 2050 under both SSPs, whereas for the remaining catchments higher and more frequent high-flow events in the form of flash floods are detected. Our analysis revealed that this is a consequence of the reduction in rainfall accumulation and intensity in both SSPs for the first type of basins, while the opposite applies to the other type. More generally, we propose a methodology that does not rely on observed time series of discharge, so especially for regions where those do not exist or are not available, and that can be applied to undertake future flood projections in the most data-scarce regions. This method allows future hydrological hazards to be estimated for essentially any region of the world.

1. Introduction

For many regions of the world, the frequency and severity of flood events are projected to increase under the effects of climate change [1,2], and we are already seeing the signals and impacts in some large events [3]. However, the hazard of flooding varies significantly with geography. Arid and semi-arid regions are typically more prone to experiencing flash floods [4] than other climatic zones. This type of flood poses a serious socio-economic threat, particularly in countries that lack the infrastructure to mitigate and protect against their impacts.
This study focuses on Morocco, a country that experiences a semi-arid climate and has historically suffered from major flood events [5], often with devastating consequences for the local economy and livelihoods. The objective of this work is to employ a hydrological model across all the basins in Morocco to assess current and possible future changes in hydrological extremes.
Morocco has a semi-arid climate with a tendency for thunderstorms and extreme precipitation events [5]. Cumulative rainfall demonstrates a clear north–south gradient with highest precipitation, exceeding 800–1000 mm/year, in the northwest and less precipitation, <50 mm/year, in the southern region [6,7]. Both droughts [8] and extreme precipitation events leading to devastating flash floods [9,10] are common phenomena in Morocco.
Global climate models (GCMs) project Morocco to experience an increase in temperature and a general decline in average rainfall in the coming decades (e.g., [7]), with an associated northwards expansion of the arid zone, and as such, increasing desertification [11]. Likewise, the occurrence of heavy rainfall events is expected to decline over the course of the 21st century [12,13], bearing in mind that projecting precipitation into the future is still highly uncertain, especially for looking at flash floods [14]. Generally speaking, dry soils reduce the infiltration capacity and so less frequent but heavy precipitation events may result in more severe flash flooding due to a rapid increase in surface runoff. A tendency of more extreme flood events has already been reported [15,16], and this trend is expected to accelerate due to climate change [17]. Additionally, sea level rises will increase the hazard of flooding in the coastal region of Morocco [18,19].
Vulnerability to flood impacts varies by economic sector and characteristics of the population. Across the socioeconomic spectrum, the economically poor often reside in informal (slum) settlements with precarious building quality that cannot withstand weather extremes, and are often located in the most flood-prone areas [20]. With regard to economic activities, the agricultural and industrial sectors are most vulnerable to flood impacts. Floods have caused extensive and large-scale damage to crops and livestock [20,21]. For instance, the Gharb Valley, one of Morocco’s largest agricultural production areas, is frequently impacted by riverine flooding from the adjacent Sebou River [22].
Given that flooding is frequently occurring in Morocco, researchers have studied floods by employing basin-scale hydrological models in certain areas [23,24,25] and to some extent also flood inundation models; primarily 1D models at river reach and regional scales to identify high-hazard areas [26,27,28,29,30,31,32], or 2D flood models [33,34,35,36,37].
While the use of models to identify flood hazard areas for Morocco is not new, prior studies are highly localized and focus on subcatchment and river reach scale. A country-wide study of flood hydrology to estimate related hazards and associated risks is still missing. More importantly, little is understood about changes in future hydrological hazard under various climate change scenarios. To fill this gap, this study addresses the following research questions:
(1)
How will the frequency and magnitude of hydrological extremes be impacted in Morocco by 2100 under climate change?
(2)
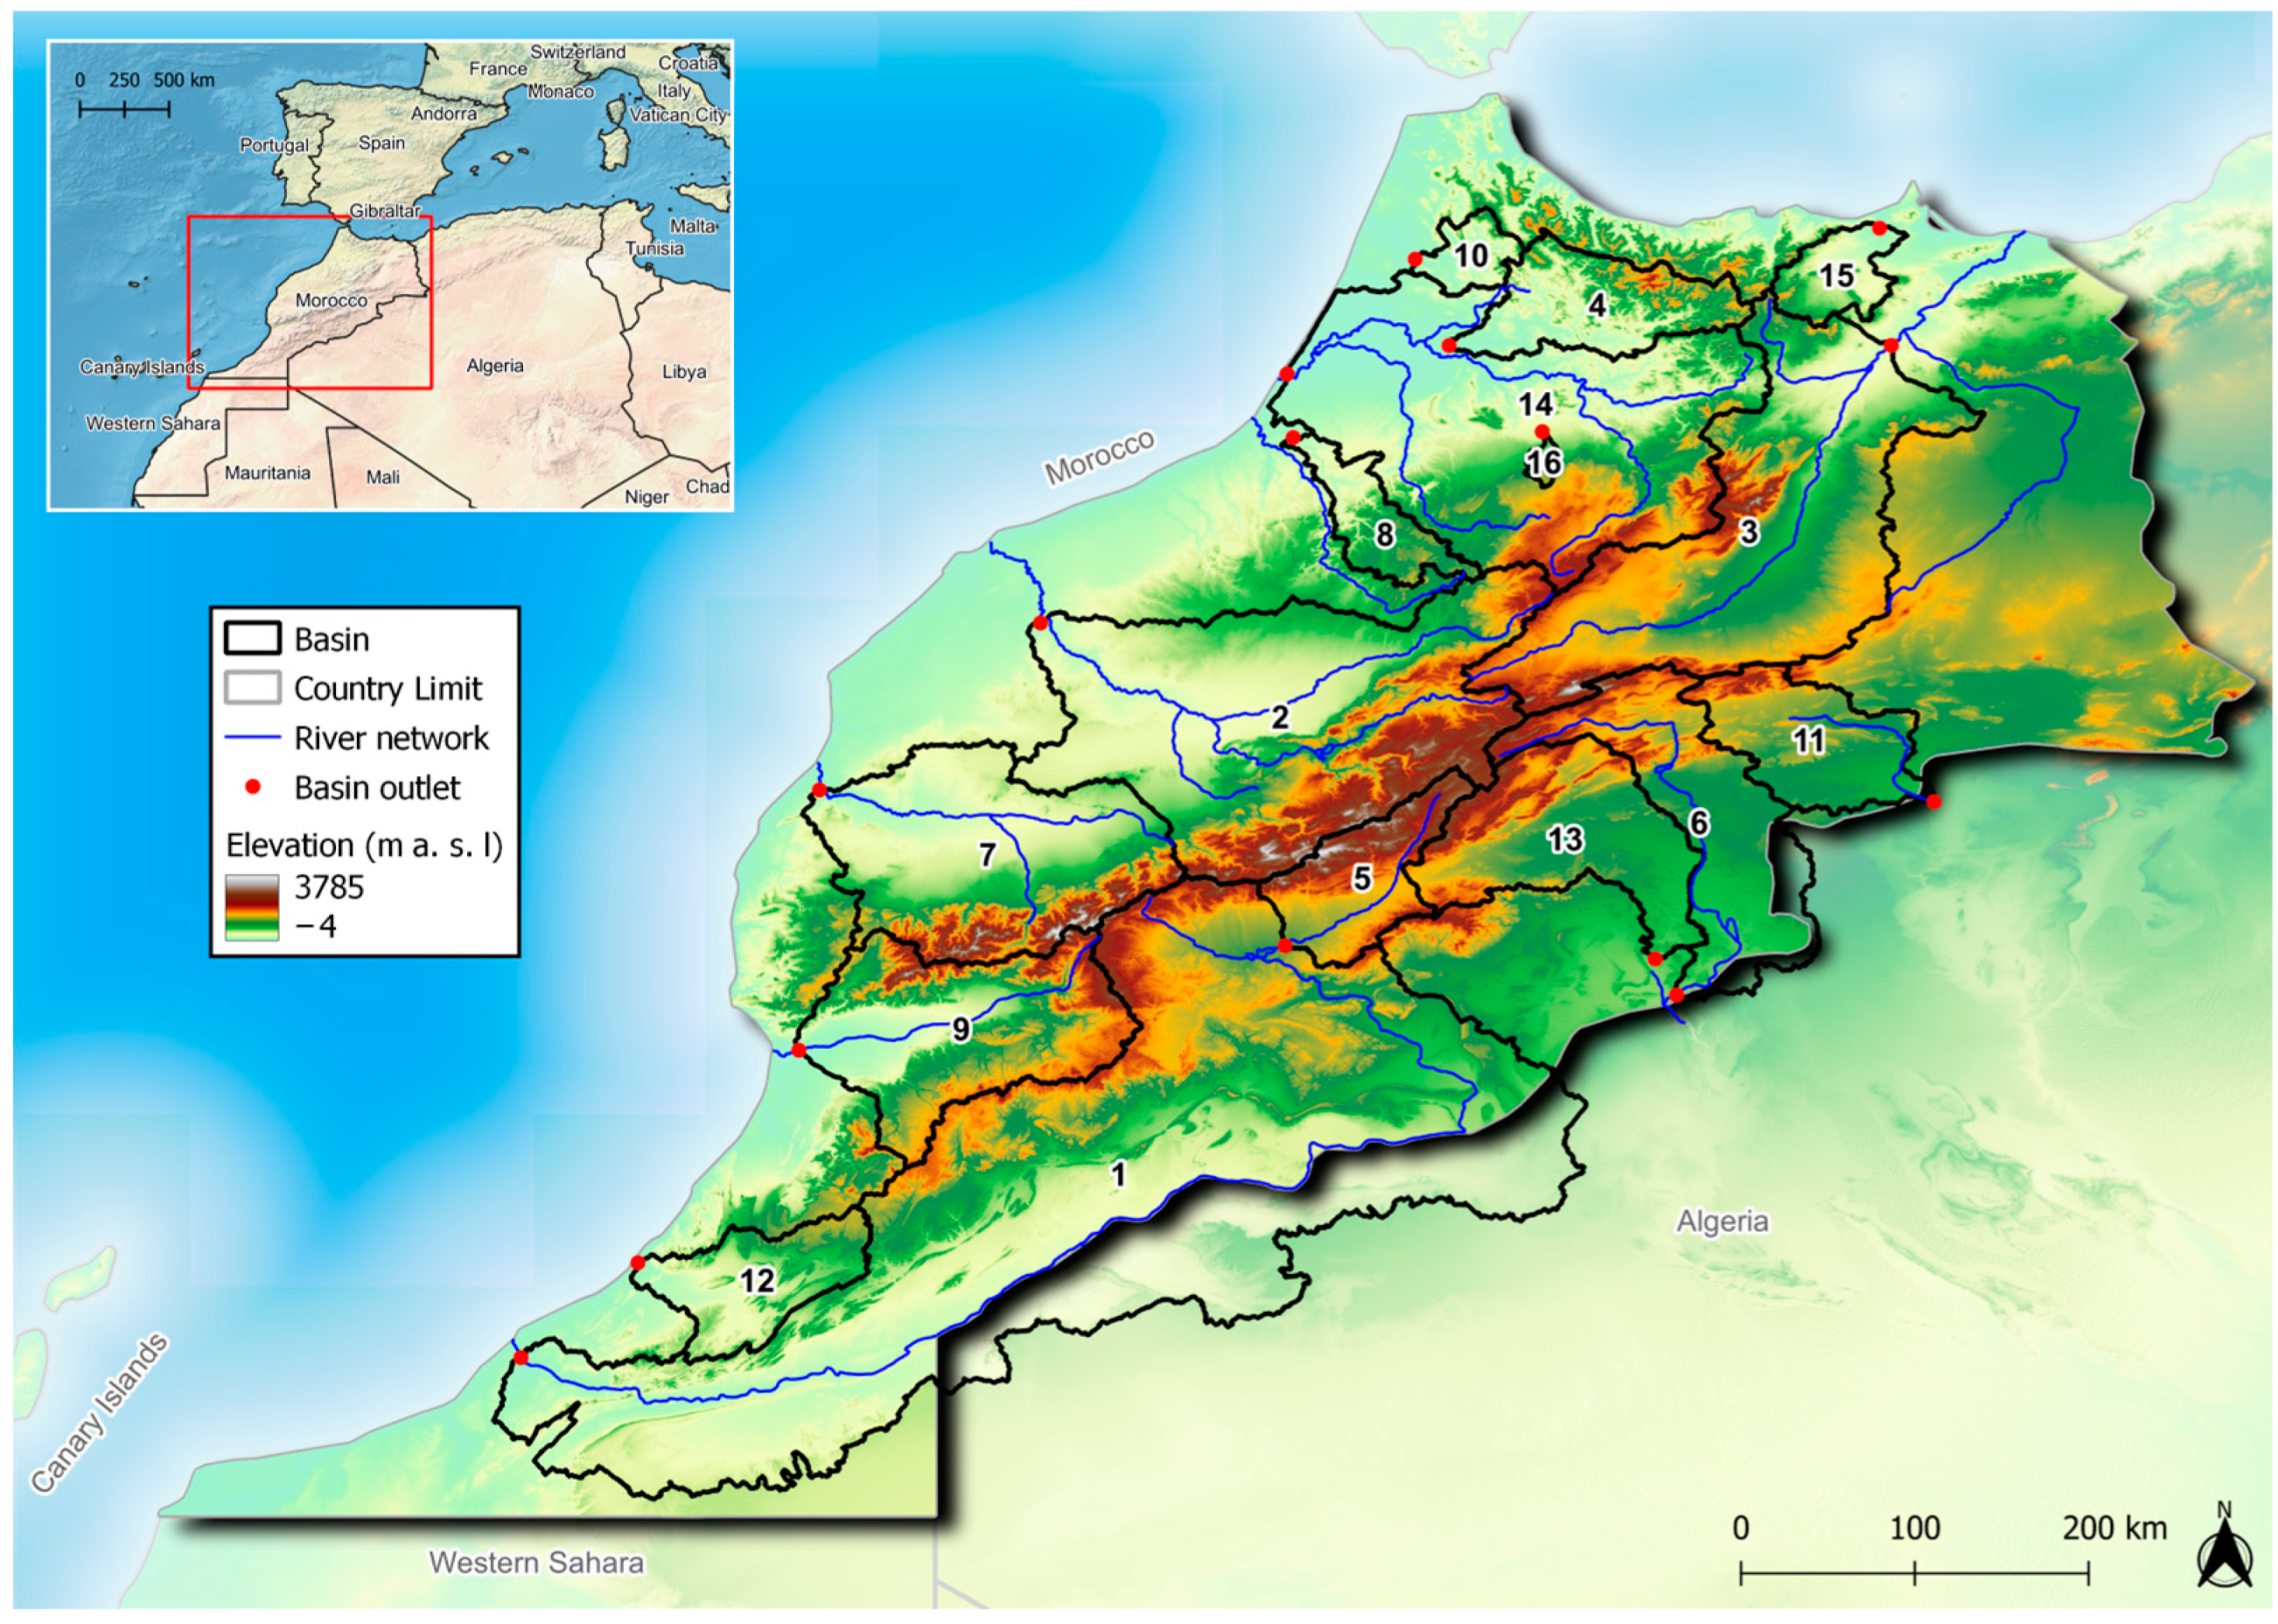
Which basin areas in Morocco will experience changes in hydrological extremes under climate change, and in which direction?
It is important to note that from a general point of view, coupling climate change scenarios and hydrological models could lead to a potential considerable bias estimation of streamflow extremes in climate change studies. This is because hydrological studies on the effects of climate change on extremes often rely on model calibration procedures using only observed hydro-meteorological data, which could lead to biased assessments of extreme flows. As a possible solution to this, Majone et al. [38] suggest, for example, a calibration procedure that maximizes the probability that the modeled and observed high streamflow extremes belong to the same statistical population.
In our approach, we accounted for uncertainty in the model parameter sets, which should accommodate biases but is no guarantee that high flows are well represented under climate change conditions.

2. Materials and Methods

A total of 16 hydrological basins (Figure 1) representing rivers of various sizes (area range: 400–110,000 km2) and discharge magnitudes were selected across Morocco. No record of observed discharge was readily available for the basins studied, and therefore no traditional calibration of a hydrological model is possible.

2.1. Historical Datasets

For historical simulations, 43 years of forcing data (1979–2021) were obtained from the NOAA Climate Prediction Center (CPC) accessible at the NOAA Earth System Research Laboratory (NOAA ESRL). We selected CPC global unified gauge-based analysis of daily precipitation and CPC global daily minimum and maximum temperature, both available at 50 × 50 km grids from 1 January 1979 to 31 December 2021 [39].

2.2. Climate Change Datasets

To determine future flood hazard, we used climate simulations to reproduce future river discharges over the period of 2015–2100 (86 years). The sixth assessment report (AR6) of the Intergovernmental Panel on Climate Change (IPCC) provides climate scenarios for the globe that are derived from General Circulation Model (GCM) simulations conducted under the Coupled Model Intercomparison Project Phase 6 (CMIP6) and across different greenhouse gas emissions scenarios.
The NASA Earth Exchange Global Daily Downscaled Projections (NEX-GDDP) dataset is comprised of global downscaled climate scenarios derived from the GCM runs of CMIP6, across two of the four “Tier 1” greenhouse gas emissions scenarios known as Shared Socioeconomic Pathways (SSPs) [40,41]. The spatial resolution of the dataset is 0.25° and the downscaling approach used is based on bias-correction spatial disaggregation [39].
We selected two emission scenarios, one with intermediate emissions and one with very high emissions, namely SSP2–4.5 and SSP5–8.5. The SSP2–4.5 scenario can be described as moderate. The levels of CO2 emissions remain stable, without significant changes, until the middle of the century when they begin to decline. However, they do not reach net-zero by 2100. Socioeconomic factors continue to follow their historical patterns without any noteworthy deviations. The progress towards sustainability is gradual, with varying rates of development and income growth. According to this scenario, temperatures are projected to increase by 2.7C by the close of the century. In sharp contrast, the SSP5–8.5 scenario represents a future that should be strongly avoided. By 2050, CO2 emissions levels in this scenario approximately double compared to the present. The global economy experiences rapid growth, but it heavily relies on the exploitation of fossil fuels and energy-intensive lifestyles. Consequently, by the year 2100, the average global temperature rises dramatically by 4.4C, reaching extreme heat levels. Although the IPCC6 report did not estimate the likelihoods of these scenarios, a 2020 commentary described SSP5–8.5 as highly unlikely and SSP2–4.5 as likely [42].
Time series of daily precipitation and average temperature were extracted from 30 GCM ensemble members within NEX-GDDP. Both SSP2–4.5 and SSP5–8.5 comprise projections for the period 2015–2100. For the hydrological model setup, we define the historic period as 1979–2021 and provide future analysis for the time period 2015–2100, which represents a seven-year simulation overlap period. The overlap period permits the evaluation of the simulation.

2.3. Hydrological Model Parameterization

The Hydrologiska Byråns Vattenbalansavdelning (HBV) hydrologic model was selected for the analysis. This is a lumped or semi-distributed conceptual hydrological model representing various components of the hydrological cycle, which has been widely applied to a variety of application studies [43,44,45,46,47,48,49], across a range of temporal and spatial scales and from a single basin to global coverage. For global-scale studies, typically, hydrological models are calibrated with a timeseries of measured discharge. However, in many areas around the world there is a lack of gauged data or those data cannot be easily shared. In addition, as stated earlier, in climate impact studies, using observed streamflow to calibrate a hydrological model may lead to biased assessments of climate change’s impact. In order to overcome these limitations, we propose to use the regionalized parameterization in Beck et al. [50] that provides parameter maps for the global land surface including ungauged regions. Such parameterization consists of ten cross-validation folds of parameter sets, with each parameter set being composed of 16 parameters. The regionalized parameters are available as global high-resolution parameter maps at www.gloh2o.org/hbv (accessed on 17 July 2023).

3. Methodology

Analyzing the impact of future climate change on hydrological hazards for most rivers and streams in Morocco requires a robust hydrological modeling approach that represents all key governing hydrological processes.
As mentioned previously, the HBV model was chosen because only minimal input data are required to simulate river discharge. Different versions of HBV exist, and the version used here only requires daily precipitation and daily mean temperature as forcing data to simulate most components of the hydrological cycle (e.g., groundwater, soil moisture, snow water equivalent, etc.). Potential evapotranspiration (PET), typically also a required input to the model, was calculated using the McGuinness–Bordne formulation, which is based on the Penman–Monteith equation but uses simplified assumptions to calculate PET. HBV has been used successfully in climate impact studies across a wide variety of catchments and scales [44,45,46,47,48,49]. Additionally, the model is computationally efficient and proven to be effective under a wide range of climatic and physiographic conditions. In fact, the methodology proposed here is potentially applicable to any region of the world, including those with scarce information.
For each selected basin, HBV was set up to simulate historical discharge time series at the outlets of all selected basins (Figure 1). The absence of observed discharge time series hinders the possibility of a traditional, more straightforward model calibration, which in the case of climate change studies may not be preferred anyway since it could lead to an underestimation of future discharge [38]. However, the availability of the global regionalized calibrated parameterization provided in Beck et al. [51] compensates for the absence of observed discharge. The tenfold cross validation used by Beck et al. [51] to evaluate the generalizability of the approach and to obtain an ensemble of parameter maps helps account for parameter uncertainty, given the number of parameters involved [52].
While the HBV model and the regionalized calibrated parameterization offer significant advantages, it is crucial to acknowledge the uncertainties associated with climate change projections and the inherent limitations of modeling techniques. Climate change scenarios involve complex interactions of multiple variables, and uncertainties arise from factors such as emissions scenarios, global climate models, and downscaling techniques.
Additionally, modeling approaches inherently simplify the complex processes occurring in hydrological systems, and uncertainties may arise due to simplifications or assumptions made during model development. However, by utilizing a comprehensive approach that incorporates parameter uncertainty and leverages ensemble modeling, the analysis can account for these uncertainties to a certain extent, providing more reliable results and actionable insights. We believe that the proposed modeling approach enables a more comprehensive assessment of future discharge under climate change scenarios, capturing potential variations in hydrological response across different basins. This approach helps to mitigate underestimation biases and provides a more robust estimation of hydrological hazards in river systems in Morocco, and across the globe.

4. Results

This section presents the analysis of the discharge simulations, and provides a comparison between the historical period and that of future scenarios, for both SSP2–4.5 and SSP5–8.5. For each SSP and for each of the 30 GCM member runs, we compute 10 discharge timeseries, using 10 cross-validation folds of parameter sets. So, for each SSP, 300 discharge timeseries were simulated for each of the 16 river basin outlets.
Given the large uncertainties inherent in climate models and their projections [53,54], we chose the parameter set that best represents the median (best estimate) discharge, instead of the mean discharge, to simulate future discharge timeseries. Analysis indicates that the spread in terms of temperature among the different GCMs is rather small, whereas the variance among GMCs is more pronounced for precipitation, with different trends for different basins. This leads to a large spread in the simulated discharge timeseries.
Table 1 reports, for all 16 basins and for both SSPs, the changes, with reference to the historical dataset, in terms of magnitude and frequency in peak discharge, average rainfall and average precipitation.
For the historical simulations, 10 discharge time series, 1 per fold of the parameter sets, were computed while for the climate change simulations, for each SSP and for each basin, we used 300 discharge time series, from a combination of 30 GCMs and 10 folds of parameter sets. In both cases, historical and climate change, we then computed, for each SSP and for each basin, the mean over the number of discharge time series. In the end, we obtained, per SSP per basin, one discharge time series for the historical period and one discharge time series for the future period. Concerning peak discharge, for each basin in both the historical and the future time series, we extracted the yearly peaks. The change in the magnitude of yearly peaks was computed as the difference between the average of the historical yearly peak values and the average of the climate change peak values, over the average of the historical peak values. The change in the frequency of peaks was calculated by identifying, in the historical and in the future time series, all events higher than the average of the yearly maxima in the historical period.
To determine the change in rainfall, given the number of values equal to zero in the time series of such variable, we computed, for each SSP, for each basin and for each of the 30 GCMs, the average of the yearly accumulation, and then, for each SSP and for each basin, we calculated the median over the 30 GCMs, to obtain one value per basin per SSP. For the historical time series, we also computed averages of the accumulated yearly rainfall, also to obtain one value per basin per SSP. The change in the yearly rainfall is then represented as the change in percentage between the SSP value and the historical value.
For the change in average temperature, per basin, we computed the difference between the historical temperature time series and the average of the 30 temperature time series (one per GCM), over the historical temperature.
Table 1 and Table 2 report the changes between the values computed following the methods described above.
Under both SSPs, the basins showing an increase in rainfall present unsurprisingly also show a corresponding increase in discharge magnitude and peak frequency. All basins present a decrease in the change in discharge magnitude and peak frequency when comparing SSP2–4.5 to SSP5–8.5, as is expected given the more extreme nature of the latter. Most basins are subject to an increase in temperature (between 1.7% and 11.8% for SSP2–4.5 and between 8.9% and 17.8% for SSP5–8.5), which is in line with a general projection of drier conditions in the future. The basin with highest increase in discharge magnitude (6441% and 4937% for SSP2–4.5 and SSP5–8.5, respectively), basin 6, is at the same time characterized by a significant increase in rainfall and the lowest rise in temperature.
Table 1 and Table 2 show two clusters of basins, one with decreasing rainfall and therefore decreasing discharge magnitude and frequency and one with the opposite behavior. All basins exhibit the same directional change in both discharge magnitude and frequency under both SSPs, except for basins 9 and 12. Basins 3, 4, 8, 10, 14, 15 and 16 present decreasing discharge in both magnitude and frequency, in both SSPs. All the other basins show an increase in both discharge characteristics.
We display the comparison between historical simulation and climate change scenarios for basin 1 (Figure 2) and 4 (Figure 3), representative of the two different groups of basins in terms of their response to climate change, under SSP2–4.5.
Figure 4 illustrates the changes in magnitude of the yearly maxima between the historical period and the future climate change scenarios.

5. Discussion

Care should be taken when interpreting future flood hazard. Individual climate simulations are extremely uncertain, they can represent unrealistically high or low precipitation and they often diverge greatly, e.g., [53]. However, on average, there seems to be a decrease in discharge for northern Morocco in the future, which is most likely related to the semi-arid climate and projected increases in temperature for this region, accompanied by a decrease in rainfall. A different behavior is observed in the remaining part of the country. For these catchments, an increase in the magnitude of rainfall peaks and also in the magnitude and frequency of floods result from our simulations. Such regional differences are only detectable when performing more regional climate change impact studies at the hydrological basin scale, as we present here.
A general decrease in discharge for Morocco has also been noted in a global study concerning climate change impacts on discharge trends by Falloon and Betts [55] and more recently by Sperna Weiland et al. [53]. For basins that will reach their water limit and where local water demand will thus be difficult to satisfy in the future, adaptation strategies will need to be developed. However, it should be noted that an average decrease of discharge in the future does not necessarily mean a lower flood hazard at local level [56]. Also, it is worth noting that even if flood events may become less frequent, in the case of generally drier conditions, the actual impact of a high-magnitude flash flood may be worse. However as indicated above, these forecasts should be treated with caution, precipitation projection accuracy strongly depends on the spatial and temporal resolution of the models. Given the spatial resolution, downscaling to local conditions is highly recommended, especially for a proper representation of extreme weather events [57].
This said, it will be important for the national and regional authorities as well as the local municipalities to consider an increase in the frequency and magnitude of flood events when planning for a future under increasingly severe climate impacts [58], despite the uncertainty. Our analysis has revealed a distinct spatial pattern (Figure 4) that is similar across the two different SSP future scenarios (SSP2–4.5 and SSP5–8.5): an increase in discharge magnitude and a resulting higher likelihood for flood events in basins in the southern regions of Morocco. Policies and programs to reduce the exposure of infrastructure, businesses, as well as the vulnerability of the local population to flood impacts may be most effective when strategically placed in these southern catchment regions. For example, flood risk insurance policies, such as implemented in the Ait Melloul area by Deutsche Gesellschaft für Internationale Zusammenarbeit (GIZ) in cooperation with the Allianz Insurance Group [59] may be expanded across southern Morocco. Similarly, flood events are most destructive in urban areas with poor engineering infrastructure (e.g., culverts, drainage channels, pipes, etc.) and in these areas, carefully planned development projects may go a long way towards reducing the vulnerability of local businesses and populations to floods [60].
Despite the large uncertainties associated with flood-related climate impact studies, we demonstrate a methodology to undertake future discharge projections at the hydrological basin scale, in particular for data-scarce regions. This method allows future hydrological hazards to be estimated for any region of the world. Studies like the one presented here are still relatively rare but are starting to appear. The significance of such studies can be extremely far-reaching and are of global importance. This is particularly true when performed over even larger spatial scales but with impact-level detail, such as the recent study for the entire US by Bates et al. [61].

6. Conclusions

In this paper, we used a basin-scale hydrological modeling approach to assess current and possible future changes in hydrological extremes across Morocco. The work emphasizes the need for caution when interpreting future flood hazards, as individual climate simulations can be highly uncertain and divergent. However, on average, there appears to be a decrease in discharge and rainfall in Northern Morocco due to the semi-arid climate and projected temperature increases. In contrast, other regions of the country may experience an increase in the magnitude and frequency of (flash) floods. These regional differences are detectable through more localized climate change impact studies at the hydrological basin scale.
While a general decrease in discharge has been observed for Morocco in global studies, it does not necessarily translate to a lower flood hazard at the local level. The actual impact of high-magnitude flash floods may be worse in drier conditions. Accuracy in precipitation projections relies heavily on the spatial and temporal resolution of the models, emphasizing the importance of downscaling to local conditions for a better representation of extreme weather events.
Considering the uncertain future, national, regional and local authorities should take into account the potential increase in frequency and magnitude of flood events when planning for climate impacts. Southern regions of Morocco show a spatial pattern of increased discharge magnitude and higher likelihood of floods across different future scenarios. Policies and programs to reduce exposure and vulnerability to floods should be strategically implemented in these areas, including flood risk insurance and well-planned development projects in vulnerable urban areas.
Despite the uncertainties in flood-related climate impact studies, this paper highlights the need to project future discharge at the hydrological basin scale, especially in data-scarce regions. Such studies have global importance and can contribute to better understanding and preparedness for hydrological hazards.

Author Contributions

L.G. completed most of the model runs, analysis and wrote the main body of the manuscript. G.J.-P.S. led the study framework and contributed significant work to the analysis as well as to the text of the manuscript. A.J.K. contributed to initial investigations into the methods, suggested the use of the modeling approach and reviewed the manuscript. A.S. contributed to the formulation of integrating climate change effects into the hydrological modeling framework. R.N. provided the research framework for the modeling and contributed to several sections of the manuscript. All authors have read and agreed to the published version of the manuscript.

Funding

This work received funding as part of an independent study to model regional flood risk for Morocco under current and future climate conditions, commissioned by the German Institute for Development Evaluation (Deval) under contract number KZM_18_KLIMA_2022_SV03.

Data Availability Statement

All input data and model versions used are all freely available online via the links provided in the manuscript. Data on results and codes can be obtained from the corresponding order upon request.

Acknowledgments

We thank Livio Loi for the production of the maps used in Figure 1 and Figure 4.

Conflicts of Interest

The authors have no conflict of interest and no relevant financial or non-financial interests to disclose.

References

  1. IPCC. Summary for Policymakers. In Global Warming of 1.5 °C. An IPCC Special Report on the Impacts of Global Warming of 1.5 °C above Pre-Industrial Levels and Related Global Greenhouse Gas Emission Pathways, in the Context of Strengthening the Global Response to the Threat of Climate Change, Sustainable Development, and Efforts to Eradicate Poverty; Masson-Delmotte, V., Zhai, P., Pörtner, H.-O., Roberts, D., Skea, J., Shukla, P.R., Pirani, A., Moufouma-Okia, W., Péan, C., Pidcock, R., et al., Eds.; Cambridge University Press: Cambridge, UK, 2018; pp. 3–24. [Google Scholar] [CrossRef]
  2. Panagoulia, D.; Dimou, G. Sensitivity of flood events to global climate change. J. Hydrol. 1997, 191, 208–222. [Google Scholar] [CrossRef]
  3. Wehner, M.; Sampson, C. Attributable human-induced changes in the magnitude of flooding in the Houston, Texas region during Hurricane Harvey. Clim. Change 2021, 166, 20. [Google Scholar] [CrossRef]
  4. Wayne Higgins, R.; Douglas, A.; Hahmann, A.; Berbery, E.H.; Gutzler, D.; Shuttleworth, J.; Stensrud, D.; Amador, J.; Carbone, R.; Cortez, M.; et al. Progress in pan American CLIVAR research: The North American Monsoon system. Atmosfera 2003, 16, 29–65. [Google Scholar]
  5. Born, K.; Fink, A.; Knippertz, P. I-5.2: Meteorological processes influencing the weather and climate of Morocco. In Impacts of Global Change on the Hydrological Cycle in West and Northwest Africa; Springer: Berlin/Heidelberg, Germany, 2010; pp. 150–163. [Google Scholar]
  6. Born, K.; Fink, A.H.; Paeth, H. Dry and wet periods in the northwestern Maghreb for present day and future climate conditions. Meteorol. Z. 2008, 17, 533–551. [Google Scholar] [CrossRef]
  7. Driouech, F.; Déqué, M.; Sánchez-Gómez, E. Weather regimes—Moroccan precipitation link in a regional climate change simulation. Glob. Planet. Chang. 2010, 72, 1–10. [Google Scholar] [CrossRef]
  8. Benassi, M. Drought and climate change in Morocco. Analysis of precipitation field and water supply. In Drought Management: Scientific and Technological Innovations; López-Francos, A., Ed.; CIHEAM: Zaragoza, Spain, 2008; pp. 83–86. [Google Scholar]
  9. Driouech, F.; Déqué, M.; Mokssit, A. Numerical simulation of the probability distribution function of precipitation over Morocco. Clim. Dyn. 2008, 32, 1055–1063. [Google Scholar] [CrossRef]
  10. Saidi, A.D.; Szönyi, M. Risk Nexus. In Morocco Floods of 2014: What We Can Learn from Guelmim and Sidi Ifni; Zurich Insurance Group and Targa-AIDE: Zurich, Switzerland, 2015. [Google Scholar]
  11. Van Dijck, S.J.E.; Laouina, S.; Carvalho, A.V.; Loos, S.; Schipper, A.M.; Van der Kwast, H.; Nafaa, R.; Antari, M.; Rocha, A.; Borrego, C.; et al. Desertification in Northern Morocco due to effects of climate change on groundwater recharge. In Desertification in the Mediterranean Region. A Security Issue; Kepner, W.G., Rubio, J.L., Mouat, D.A., Pedrazzini, F., Eds.; Kluwer Academic Publishers: Dordrecht, The Netherlands, 2006; pp. 549–577. [Google Scholar]
  12. Tramblay, Y.; Badi, W.; Driouech, F.; El Adlouni, S.; Neppel, L.; Servat, E. Climate change impacts on extreme precipitation in Morocco. Glob. Planet. Chang. 2012, 82–83, 104–114. [Google Scholar] [CrossRef]
  13. Driouech, F.; Ben Rached, S.; Hairech, T.E. Climate Variability and Change in North African Countries. In Climate Change and Food Security in West Asia and North Africa; Springer: Dordrecht, The Netherlands, 2013; pp. 161–172. [Google Scholar]
  14. Hapuarachchi, H.A.P.; Wang, Q.J.; Pagano, T.C. A review of advances in flash flood forecasting. Hydrol. Process. 2011, 25, 2771–2784. [Google Scholar] [CrossRef]
  15. World Bank. Building Morocco’s Resilience: Inputs from an Integrated Risk Management Strategy; World Bank: Washington, DC, USA, 2013. [Google Scholar]
  16. Ouazarr, D. Integrated Flood Management: Data /Big Data, Models, (Un)certainty and Knowledge; IFM: Rabat, Morocco, 2015. [Google Scholar]
  17. Karmaoui, A.; Balica, S.; Messouli, M. Analysis of applicability of flood vulnerability index in Pre-Saharan region, a pilot study to assess flood in Southern Morocco. Nat. Hazards Earth Syst. Sci. Discuss. 2016, 1–24. [Google Scholar] [CrossRef] [Green Version]
  18. Snoussi, M.; Ouchani, T.; Niazi, S. Vulnerability assessment of the impact of sea-level rise and flooding on the Moroccan coast: The case of the Mediterranean eastern zone. Estuar. Coast. Shelf Sci. 2008, 77, 206–213. [Google Scholar] [CrossRef]
  19. Azidane, H.; Benmohammadi, A.; Hakkou, M.; Magrane, B.; Haddout, S. A Geospatial approach for assessing the impacts of sea-level rise and flooding on the Kenitra coast (Morocco). J. Mater. Environ. Sci. 2018, 9, 1480–1488. [Google Scholar] [CrossRef]
  20. OECD. OECD Review of Risk Management Policies Morocco; OECD Publishing: Paris, France, 2017. [Google Scholar]
  21. Roman, A.; Hssaine, A.A. Causes and consequences of the November 2014 torrential rains in the center & south of Morocco. Int. J. Environ. 2016, 5, 11–30. [Google Scholar] [CrossRef] [Green Version]
  22. OECD. Guide Pratique. In Connaitre et Evaluer les Risques de Catastrophes Naturelles au Maroc; OECD Publishing: Paris, France, 2018. [Google Scholar]
  23. Fadil, A.; Rhinane, H.; Kaoukaya, A.; Kharchaf, Y.; Alami, B.O. Hydrologic Modeling of BouregregWatershed (Morocco) Using GIS and SWAT Model. J. Geogr. Inf. Syst. 2011, 3, 279–289. [Google Scholar]
  24. Khalid, C. Hydrological modeling of the Mikkés watershed (Morocco) using ARCSWAT model. Sustain. Water Resour. Manag. 2018, 4, 105–115. [Google Scholar] [CrossRef]
  25. Boufala, M.; El Hmaidi, A.; Chadli, K.; Essahlaoui, A.; El Ouali, A.; Taia, S. Hydrological modeling of water and soil resources in the basin upstream of the Allal El Fassi dam (Upper Sebou watershed, Morocco). Model. Earth Syst. Environ. 2019, 5, 1163–1177. [Google Scholar] [CrossRef]
  26. Azouagh, A.; El Bardai, R.; Hilal, I.; el Messari, J.S. Integration of GIS and HEC-RAS in Floods Modeling of Martil River (Northern Morocco). Eur. Sci. J. ESJ 2018, 14, 130. [Google Scholar] [CrossRef]
  27. Adjinacou, A.M. Flood Modeling and Floodplain Mapping Based on Geographical Information System (GIS) and HEC-RAS in Oued Fez Watershed (Morocco); Pan African University Institute of Water and Energy Sciences (including Climate Change): Tlemcen, Algeria, 2016. [Google Scholar]
  28. Echogdali, F.Z.; Boutaleb, S.; Jauregui, J.; Elmouden, A. Cartography of Flooding Hazard in Semi-Arid Climate: The Case of Tata Valley (South-East of Morocco). J. Geogr. Nat. Disasters 2018, 8, 1–11. [Google Scholar] [CrossRef]
  29. Bourak, A.; Midaoui, A.; Lahrach, A.; Elarrim, A.; Chaouni, A.-A. Modélisation hydraulique du système Sebou-Fouarat, ville de Kenitra, Maroc—Cas des inondations de 2010. Eur. Sci. J. ESJ 2017, 13, 369–383. [Google Scholar] [CrossRef] [Green Version]
  30. Fatma, C.S.E.K. Délimitation des Zones Inondables par L’utilisation Combiné du Logiciel HEC-RAS et HEC GEORAS cas du Centre « Ain Jemaa »; Université Sidi Mohamed Ben Abdellah Fès: Fes, Morocco, 2013. [Google Scholar]
  31. Tabyaoui, H.; El Hammichi, F.; Er-Rguiouag, M.A.; Lahrach, A. Hydraulic Modelling Using HEC-RAS and GIS, Application to Oued Inaouen. In Taza, Northern Morocco; Sidi Mohamed Ben Abdellah University: Taza, Morocco; Fes, Morocco, 2011. [Google Scholar]
  32. El-Hamdouny, M.; Abdelbaset, M.; El Hassani, F.; Gmira, S.; Lahrach, A.; Chaouni, A.A. Delimitation of flood areas based on hydrological calculation and hydraulic modeling: Case of Malal village in the province of Taza (Morocco). Am. J. Innov. Res. Appl. Sci. 2016, 6, 11–19. [Google Scholar]
  33. Werren, G.; Lasri, M. Cartographie du danger d’inondation. In Guide Pratique Pour L’application de la Méthode Suisse au Maroc; Institut de Géographie et Durabilité de l’Université de Lausanne (IGD): Lausanne, Switzerland; Laboratoire d’analyses géo-environnementales et aménagement de l’Université Sidi Mohamed Ben Abdellah Fès (LAGEA): Fes, Morocco, 2014. [Google Scholar]
  34. Werren, G.; Reynard, E.; Lane, S.N.; Balin, D. Flood hazard assessment and mapping in semi-arid piedmont areas: A case study in Beni Mellal, Morocco. Nat. Hazards 2015, 81, 481–511. [Google Scholar] [CrossRef] [Green Version]
  35. Fels, A.E.A.E.; Alaa, N.; Bachnou, A.; Rachidi, S. Flood frequency analysis and generation of flood hazard indicator maps in a semi-arid environment, case of Ourika watershed (western High Atlas, Morocco). J. Afr. Earth Sci. 2018, 141, 94–106. [Google Scholar] [CrossRef]
  36. Zellou, B.; Rahali, H. Assessment of reduced-complexity landscape evolution model suitability to adequately simulate flood events in complex flow conditions. Nat. Hazards 2016, 86, 1–29. [Google Scholar] [CrossRef]
  37. Chabaane, M.S.; Abouali, N.; Boumeaza, T.; Zahouily, M.; Yazidi, A.O. Three-dimensional simulation of a centennial flood of Mohammedia city in the the river of El Maleh—Morocco. J. Mater. Environ. Sci. 2019, 10, 305–315. [Google Scholar]
  38. Majone, B.; Avesani, D.; Zulian, P.; Fiori, A.; Bellin, A. Analysis of high streamflow extremes in climate change studies: How do we calibrate hydrological models? Hydrol. Earth Syst. Sci. 2022, 26, 3863–3883. [Google Scholar] [CrossRef]
  39. Thrasher, B.; Wang, W.; Michaelis, A.; Melton, F.; Lee, T.; Nemani, R. NASA Global Daily Downscaled Projections, CMIP6. Sci. Data 2022, 9, 262. [Google Scholar] [CrossRef]
  40. O′Neill, B.C.; Tebaldi, C.; van Vuuren, D.P.; Eyring, V.; Friedlingstein, P.; Hurtt, G.; Knutti, R.; Kriegler, E.; Lamarque, J.-F.; Lowe, J.; et al. The Scenario Model Intercomparison Project (ScenarioMIP) for CMIP6. Geosci. Model Dev. 2016, 9, 3461–3482. [Google Scholar] [CrossRef] [Green Version]
  41. Meinshausen, M.; Nicholls, Z.R.J.; Lewis, J.; Gidden, M.J.; Vogel, E.; Freund, M.; Beyerle, U.; Gessner, C.; Nauels, A.; Bauer, N.; et al. The shared socio-economic pathway (SSP) greenhouse gas concentrations and their extensions to 2500. Geosci. Model Dev. 2020, 13, 3571–3605. [Google Scholar] [CrossRef]
  42. Hausfather, Z.; Peters, G.P. Emissions—The ′business as usual′ story is misleading. Nature 2020, 577, 618–620. [Google Scholar] [CrossRef] [PubMed] [Green Version]
  43. Akhtar, M.; Ahmad, N.; Booij, M. The impact of climate change on the water resources of Hindukush–Karakorum–Himalaya region under different glacier coverage scenarios. J. Hydrol. 2008, 355, 148–163. [Google Scholar] [CrossRef]
  44. Bergström, S.; Carlsson, B.; Gardelin, M.; Lindström, G.; Pettersson, A.; Rummukainen, M. Climate change impacts on runoff in Sweden-assessments by global climate models, dynamical downscaling and hydrological modelling. Clim. Res. 2001, 16, 101–112. [Google Scholar] [CrossRef] [Green Version]
  45. Cloke, H.L.; Wetterhall, F.; He, Y.; Freer, J.E.; Pappenberger, F. Modelling climate impact on floods with ensemble climate projections. Q. J. R. Meteorol. Soc. 2012, 139, 282–297. [Google Scholar] [CrossRef] [Green Version]
  46. Hinzman, L.D.; Kane, D.L. Snow hydrology of a headwater Arctic basin: 2. Conceptual analysis and computer modeling. Water Resour. Res. 1991, 27, 1111–1121. [Google Scholar] [CrossRef]
  47. Seibert, J. Estimation of Parameter Uncertainty in the HBV Model: Paper presented at the Nordic Hydrological Conference (Akureyri, Iceland—August 1996). Hydrol. Res. 1997, 28, 247–262. [Google Scholar] [CrossRef]
  48. Smith, A.; Freer, J.; Bates, P.; Sampson, C. Comparing ensemble projections of flooding against flood estimation by continuous simulation. J. Hydrol. 2014, 511, 205–219. [Google Scholar] [CrossRef] [Green Version]
  49. Teutschbein, C.; Wetterhall, F.; Seibert, J. Evaluation of different downscaling techniques for hydrological climate-change impact studies at the catchment scale. Clim. Dyn. 2011, 37, 2087–2105. [Google Scholar] [CrossRef]
  50. Beck, H.E.; van Dijk, A.I.J.M.; de Roo, A.; Miralles, D.G.; McVicar, T.R.; Schellekens, J.; Bruijnzeel, L.A. Global-scale regionalization of hydrologic model parameters. Water Resour. Res. 2016, 52, 3599–3622. [Google Scholar] [CrossRef] [Green Version]
  51. Beck, H.E.; Pan, M.; Lin, P.; Seibert, J.; van Dijk, A.I.J.M.; Wood, E.F. Global fully-distributed parameter regionalization based on observed streamflow from 4229 headwater catchments. J. Geophys. Res. Atmos. 2020, 125, e2019JD031485. [Google Scholar] [CrossRef]
  52. Beven, K. On model uncertainty, risk and decision making. Hydrol. Process. 2000, 14, 2605–2606. [Google Scholar] [CrossRef]
  53. Weiland, F.C.S.; van Beek, L.P.H.; Kwadijk, J.C.J.; Bierkens, M.F.P. Global patterns of change in discharge regimes for 2100. Hydrol. Earth Syst. Sci. 2012, 16, 1047–1062. [Google Scholar] [CrossRef] [Green Version]
  54. Deser, C. Certain Uncertainty: The Role of Internal Climate Variability in Projections of Regional Climate Change and Risk Management. Earth′s Futur. 2020, 8, e2020EF001854. [Google Scholar] [CrossRef]
  55. Falloon, P.D.; Betts, R.A. The impact of climate change on global river flow in HadGEM1 simulations. Atmospheric Sci. Lett. 2006, 7, 62–68. [Google Scholar] [CrossRef]
  56. Smith, A.; Bates, P.; Freer, J.; Wetterhall, F. Investigating the application of climate models in flood projection across the UK. Hydrol. Process. 2013, 28, 2810–2823. [Google Scholar] [CrossRef]
  57. Bucchignani, E.; Mercogliano, P.; Panitz, H.J.; Montesarchio, M. Climate change projections for the Middle East–North Africa domain with COSMO-CLM at different spatial resolutions. Adv. Clim. Change Res. 2014, 9, 66–80. [Google Scholar] [CrossRef]
  58. IPCC. Summary for Policymakers. In Climate Change 2022: Impacts, Adaptation, and Vulnerability. Contribution of Working Group II to the Sixth Assessment Report of the Intergovernmental Panel on Climate Change; Pörtner, H.-O., Roberts, D.C., Tignor, M., Poloczanska, E.S., Mintenbeck, K., Alegría, A., Craig, M., Langsdorf, S., Löschke, S., Möller, V., et al., Eds.; Cambridge University Press: Cambridge, UK; New York, NY, USA, 2022; pp. 3–33. [Google Scholar] [CrossRef]
  59. Leppert, G.; Köngeter, A.; Moul, K.; Nawrotzki, R.; Römling, C.; Schmitt, J. Evaluation of interventions for climate change adaptation. In Instruments for Managing Residual Climate Risks; German Institute for Development Evaluation (DEval): Bonn, Germany, 2021. [Google Scholar]
  60. Loudyi, D.; Hasnaoui, M.D.; Fekri, A. Flood risk management practices in Morocco: Facts and challenges. In Wadi Flash Floods, Challenges and Advanced Approaches for Disaster Risk Reduction; Sumi, T., Kantoush, S.A., Saber, M., Eds.; Springer: New York, NY, USA, 2022; pp. 35–94. [Google Scholar] [CrossRef]
  61. Bates, P.D.; Quinn, N.; Sampson, C.; Smith, A.; Wing, O.; Sosa, J.; Savage, J.; Olcese, G.; Neal, J.; Schumann, G.; et al. Combined modelling of US fluvial, pluvial and coastal flood hazard under current and future climates. Water Resour. Res. 2020, 57, e2020WR028673. [Google Scholar] [CrossRef]
Figure 1. Map of the 16 selected basins and their ID. Note: Elevation expressed in meters above sea level (m.a.s.l.).
Water 15 02722 g001
Figure 2. Timeseries of monthly water discharge for basin 1 (increase in discharge magnitude and frequency) for both the historical and the climate change period, under SSP2–4.5 inputs.
Water 15 02722 g002
Figure 3. Same as Figure 2 but for basin 4 (decrease in discharge magnitude and frequency).
Water 15 02722 g003
Figure 4. Difference in magnitude between empirical distribution of yearly maximum discharge for the period 1979–2020 compared to the future climate change scenarios: (a) SSP2–4.5 and (b) SSP5–8.5.
Water 15 02722 g004
Table 1. Percentage of changes in discharge magnitude and frequency, rainfall and temperature between the historical period and the future, under SSP2–4.5.
Basin IDChange in Magnitude of Yearly Peak (%)Change in Frequency of Peaks (%)Change in Yearly Rainfall (%)Change in Average Temperature (%)
11190.61089.010.86.8
2217.01287.326.010.1
3−40.2−6.45.310.9
4−85.0−100.0−16.710.8
51204.75682.283.69.5
66440.89189.494.31.7
7186.3494.216.24.8
8−42.4−27.32.710.4
9−19.746.00.95.8
10−84.5−100.0−16.12.7
114374.67956.780.56.1
1213.097.1−20.611.8
134091.17039.976.06.2
14−74.6−98.2−9.110.1
15−70.5−100.0−5.29.6
16−58.1−53.5−5.810.0
Table 2. Percentage of changes in discharge magnitude and frequency, rainfall and temperature between the historical period and the future, under SSP5–8.5.
Basin IDChange in Magnitude of Yearly Peak (%)Change in Frequency of Peaks (%)Change in Yearly Rainfall (%)Change in Average Temperature (%)
1560.4870.3−0.512.3
2174.1936.210.116.5
3−53.0−32.1−4.317.8
4−87.9−100.0−28.616.8
59414440.865.317.0
64936.98205.677.08.9
7162465.6−0.410.1
8−50.7−43.6−12.116.7
9−33.321.1−12.411.4
10−86.6−100.0−30.19.1
112694.86666.268.012.9
12−35.038.2−32.516.2
133201.35984.458.813.0
14−78.4−99.3−21.816.3
15−75.8−84.9−15.415.5
16−64.4−65.1−18.216.8
Disclaimer/Publisher’s Note: The statements, opinions and data contained in all publications are solely those of the individual author(s) and contributor(s) and not of MDPI and/or the editor(s). MDPI and/or the editor(s) disclaim responsibility for any injury to people or property resulting from any ideas, methods, instructions or products referred to in the content.

