Article

Suspended Sediment Transport in Mediterranean Streams: Monitoring and Load Estimation

by
Anna Maria De Girolamo
1,
Giovanni Francesco Ricci
2,*,
Ossama M. M. Abdelwahab
2,
Antonio Lo Porto
1,
Fabio Milillo
2,
Addolorata Maria Netti
2 and
Francesco Gentile
2
1
Water Research Institute, National Research Council, 70132 Bari, Italy
2
Department of Soil, Plant and Food Sciences, University of Bari Aldo Moro, 70126 Bari, Italy
*
Author to whom correspondence should be addressed.
Water 2023, 15(15), 2715; https://doi.org/10.3390/w15152715
Submission received: 21 June 2023 / Revised: 24 July 2023 / Accepted: 25 July 2023 / Published: 27 July 2023
(This article belongs to the Special Issue Soil Erosion Measurement Techniques and Field Experiments)

Abstract

:
The suspended sediment (SS) load provides valuable insights into soil loss magnitude, requiring comprehensive monitoring of streamflow (Q) and SS concentrations (SSC) across various hydrological conditions. The primary aim of this paper was to quantify SS loads in two mountainous river basins: the Carapelle (506 km2) and the Celone (72 km2) located in Apulia (Southeast Italy) where different monitoring strategies were adopted (i.e., continuous and discrete). The specific objective was to develop sediment rating curves to address gaps in the SSC time series. An optical probe was used to continuously monitor the SSC during 2007 to 2011 in a river section of the Carapelle river, while Q was measured with the ultrasonic method. A comprehensive dataset comprising continuous Q measurements and discrete SSC measurements was systematically acquired for the Celone river over the period of 2010 to 2011. Distinct sediment rating curves were formulated for three specific subsets of data delineated by discernible hydrological conditions (i.e., high, normal, and low flow) and SSCs were computed for the missing daily records. The annual specific sediment load exhibited a range of 2.4 to 6.06 t ha−1 yr−1 for the Celone river, while the Carapelle river displayed a range of 0.9 to 7.45 t ha−1 yr−1. A significant majority of the SS load was transported during high-flow conditions, accounting for over 80% of the total load. In contrast, during low-flow conditions, the SS load constituted less than 1% of the total load. The findings of this study highlight the significance of the hydrological regime as a critical factor influencing sediment transport in mountainous Mediterranean rivers. Furthermore, it demonstrates that the duration of the sampling period, along with its specific characteristics, such as dry or wet conditions, can have a substantial impact on the accurate quantification of the sediment load.

1. Introduction

Soil erosion and land degradation are prevalent issues observed in the majority of river basins across the Mediterranean region [1]. In these basins, the geomorphologic and climatic characteristics and the agricultural practices adopted (e.g., tillage) contribute to soil loss [2]. Local, national, European, and international policymakers have shown a growing interest in erosion and its effects on soil and surface waterways in the last few decades. Extensive research efforts have been dedicated to investigating the factors influencing the transport of suspended sediment (SS) and developing models for predicting sediment yield and load [3,4,5].
Soil erosion may greatly affect soil and surface ecosystems. SS transport may be of concern because it plays a significant role in the transport of contaminants to surface waters resulting from anthropogenic activities (such as farming and breeding) [2,6]. Furthermore, sediment transfer may contribute to lake eutrophication and reservoir siltation [2,7].
The hydrological regime of Mediterranean rivers exerts a substantial influence on the processes of soil erosion and sediment delivery [8,9]. As a result of the pronounced heterogeneity observed in rainfall patterns across space and time, Mediterranean rivers commonly exhibit abrupt fluctuations in flow and a period without flow. These hydrological dynamics give rise to the notable transport of suspended materials and erosional processes within such rivers [10]. These peculiarities make it more challenging to take precise and ongoing measurements of suspended sediment concentrations (SSC) [11], and it also suggests that computing the SS load is highly challenging [12].
Several techniques were used to estimate loads by using measurements of SSC and streamflow (Q) for medium and large catchments [13,14]. The selection of which method is going to be adopted mainly depends on the availability of data, catchment size, and streamflow regime even though each of these techniques has its own drawbacks [12]. All the methods require measurements of Q and SSC that must cover all of the hydrograph characteristics, especially flood events. Also, approaches based on modelling soil losses were developed to quantify sediment loads at different times and spatial scales [15,16,17,18]. However, models rely on extensive measurements of Q and SSC, which serve as essential components for validating the model’s prognostications [19].
Continuous monitoring of SS transport involves employing infrared optical probes to measure turbidity, while laboratory analysis of water samples is used to determine SSC. These methodologies are commonly adopted for monitoring the transport of SS. Continuous measurements allow us to determine the sediment load during flood events with sufficient accuracy. Since optical technology is regarded as a reliable tool for measuring suspended sediment, its usage for continuous river monitoring has greatly expanded in recent years [18]. These optical instruments demonstrate sensitivity toward the particle size distribution flowing in the water. This trait could be of less significance in small catchments (where rainfall regimes and erodibility are uniform) while it is of great impact in large catchments [20].
In situations where continuous measurements are obtained for both Q and SSC, the sediment load transported through a specific river section within a given time interval is determined by calculating the integral of the product of SSC and Q over that time interval. This equation cannot be applied when SSC are discrete measurements [12]. In this case, sediment load computation requires the estimation of the SSC for the days when no records are available. A common approach for estimating SSC is based on a regression equation, the so-called “sediment rating curve” (SRC), that relates SSC to Q at the time of sampling.
SRCs are also used for filling the gaps in the SSC time series in the case of the failure of continuous measurements, since interruptions due to the malfunction noise of the instruments are quite common. However, according to Horowitz [21], due to the significant degree of dispersion of the SSC data, the SRC leads to an underestimation of loads. Hydrologists have invested a lot of time and energy into developing reliable approaches for reducing bias [22,23]. In-depth knowledge of the flow regime, seasonality, and sediment properties may be useful to adopt a strategy to improve SRC [12].
The present paper aimed to (i) quantify SS loads in two river basins of the Daunia Mountains: the Carapelle river and the Celone river (Apulia Region, Southeast Italy), and (ii) develop different SRCs based on the flow regime (i.e., high flow, normal flow, and low flow conditions) to fill the gaps in the SSC time series. The results are expected to advance the knowledge of SS load quantification in Mediterranean rivers and to provide water resource decision-makers with a rapid and affordable tool for SSC and load estimations.

2. Study Area: The Carapelle and the Celone River Basins

The experimental site for monitoring SSC and Q is situated at the Ordona bridge (Figure 1) along the main course of the Carapelle River, a prominent watercourse in northern Apulia. The stream rises in the Apennine mountains, runs across the Tavoliere floodplain, and discharges into the Adriatic Sea. The catchment area (considering the outlet at the gauging station) is 506 km2, and the elevation ranges from 120 to 1075 m a.s.l., with an average slope of 8.2%. The mountainous hilly parts of the catchment experience considerable erosion mainly due to agricultural activities [2]. They are made up of flysch formations, whilst clay–sand Plio-Pleistocene sediments define the alluvial plain [16]. The majority of the soils in the region are fine clay loam textured Entisols with low levels of organic matter.
The primary economic activity is agriculture, with deciduous oaks and hardwoods (Quercus pubescens s.l. and Quercus cerris L.) covering the higher hillslopes along with conifers, pastures, and meadows [24]. Flat areas and low-lying plains are primarily covered by wheat cultivation, and to a lesser extent, olive orchards and other agricultural crops. The catchment has a Mediterranean climate with wet autumn/winter and dry spring/summer seasons with average temperatures that vary from 10 °C to 16 °C. Average annual rainfall ranges from 779 mm (1921–2012), at Bisaccia station, to 531 mm (1921–2012) at Castelluccio dei Sauri station according to the Department of Civil Protection. August (6.4 mm) is the driest month, while March (94.9 mm) and November (81.4 mm) represent the rainiest [2,25]. The hydrological regime is characterized by considerable spatial and temporal variability, with exceptionally low flow conditions or absence of flow in some areas of the river network during the summer (June to August).
The Celone river basin, spanning 72 km2, encompasses steep slopes ranging from 150 m to 1150 m above sea level (a.s.l.). The river channel exhibits incision in the upper part of the basin and transitions into a braided course within the initial alluvial plain, which serves as a deposition zone for significant quantities of both suspended and bed-load material. In the lowland areas of the basin, the soils predominantly consist of deep clay loam and sandy clay loam textures, reaching depths of 1.5 to 2 m. In the hill and mountainous regions, the soils are moderately deep. The Celone river basin is primarily an agricultural area, with major cultivations including winter and durum wheat (45%), sunflower (9%), pasture (6%), and olive groves (8%). Vegetables and vineyards are minor land uses (2%). Forests (29%) are widely spread in mountainous areas. Urbanized regions account for only 1% of the total area. The basin experiences a climate characterized by a wet season extending from November to May, followed by a dry season. Historical records from 1960 to 2001 indicate an average annual rainfall of 792 mm in the upper part of the basin and 623 mm in the lowland areas. The Celone river shows an intermittent nature with a long dry season interrupted by flash flood events that may occur leading to high SS material transportation. Both catchments experience soil erosion caused by water due to the implementation of conventional tillage practices. Indeed, in autumn and winter, most of the agricultural fields (seeded and ploughed fields for spring crops) are unprotected by the vegetation from erosion. Both soil erosion (i.e., sheet and rill) and river bank erosion contribute to SS transport.

3. Materials and Methods

3.1. Monitoring SSC and Q

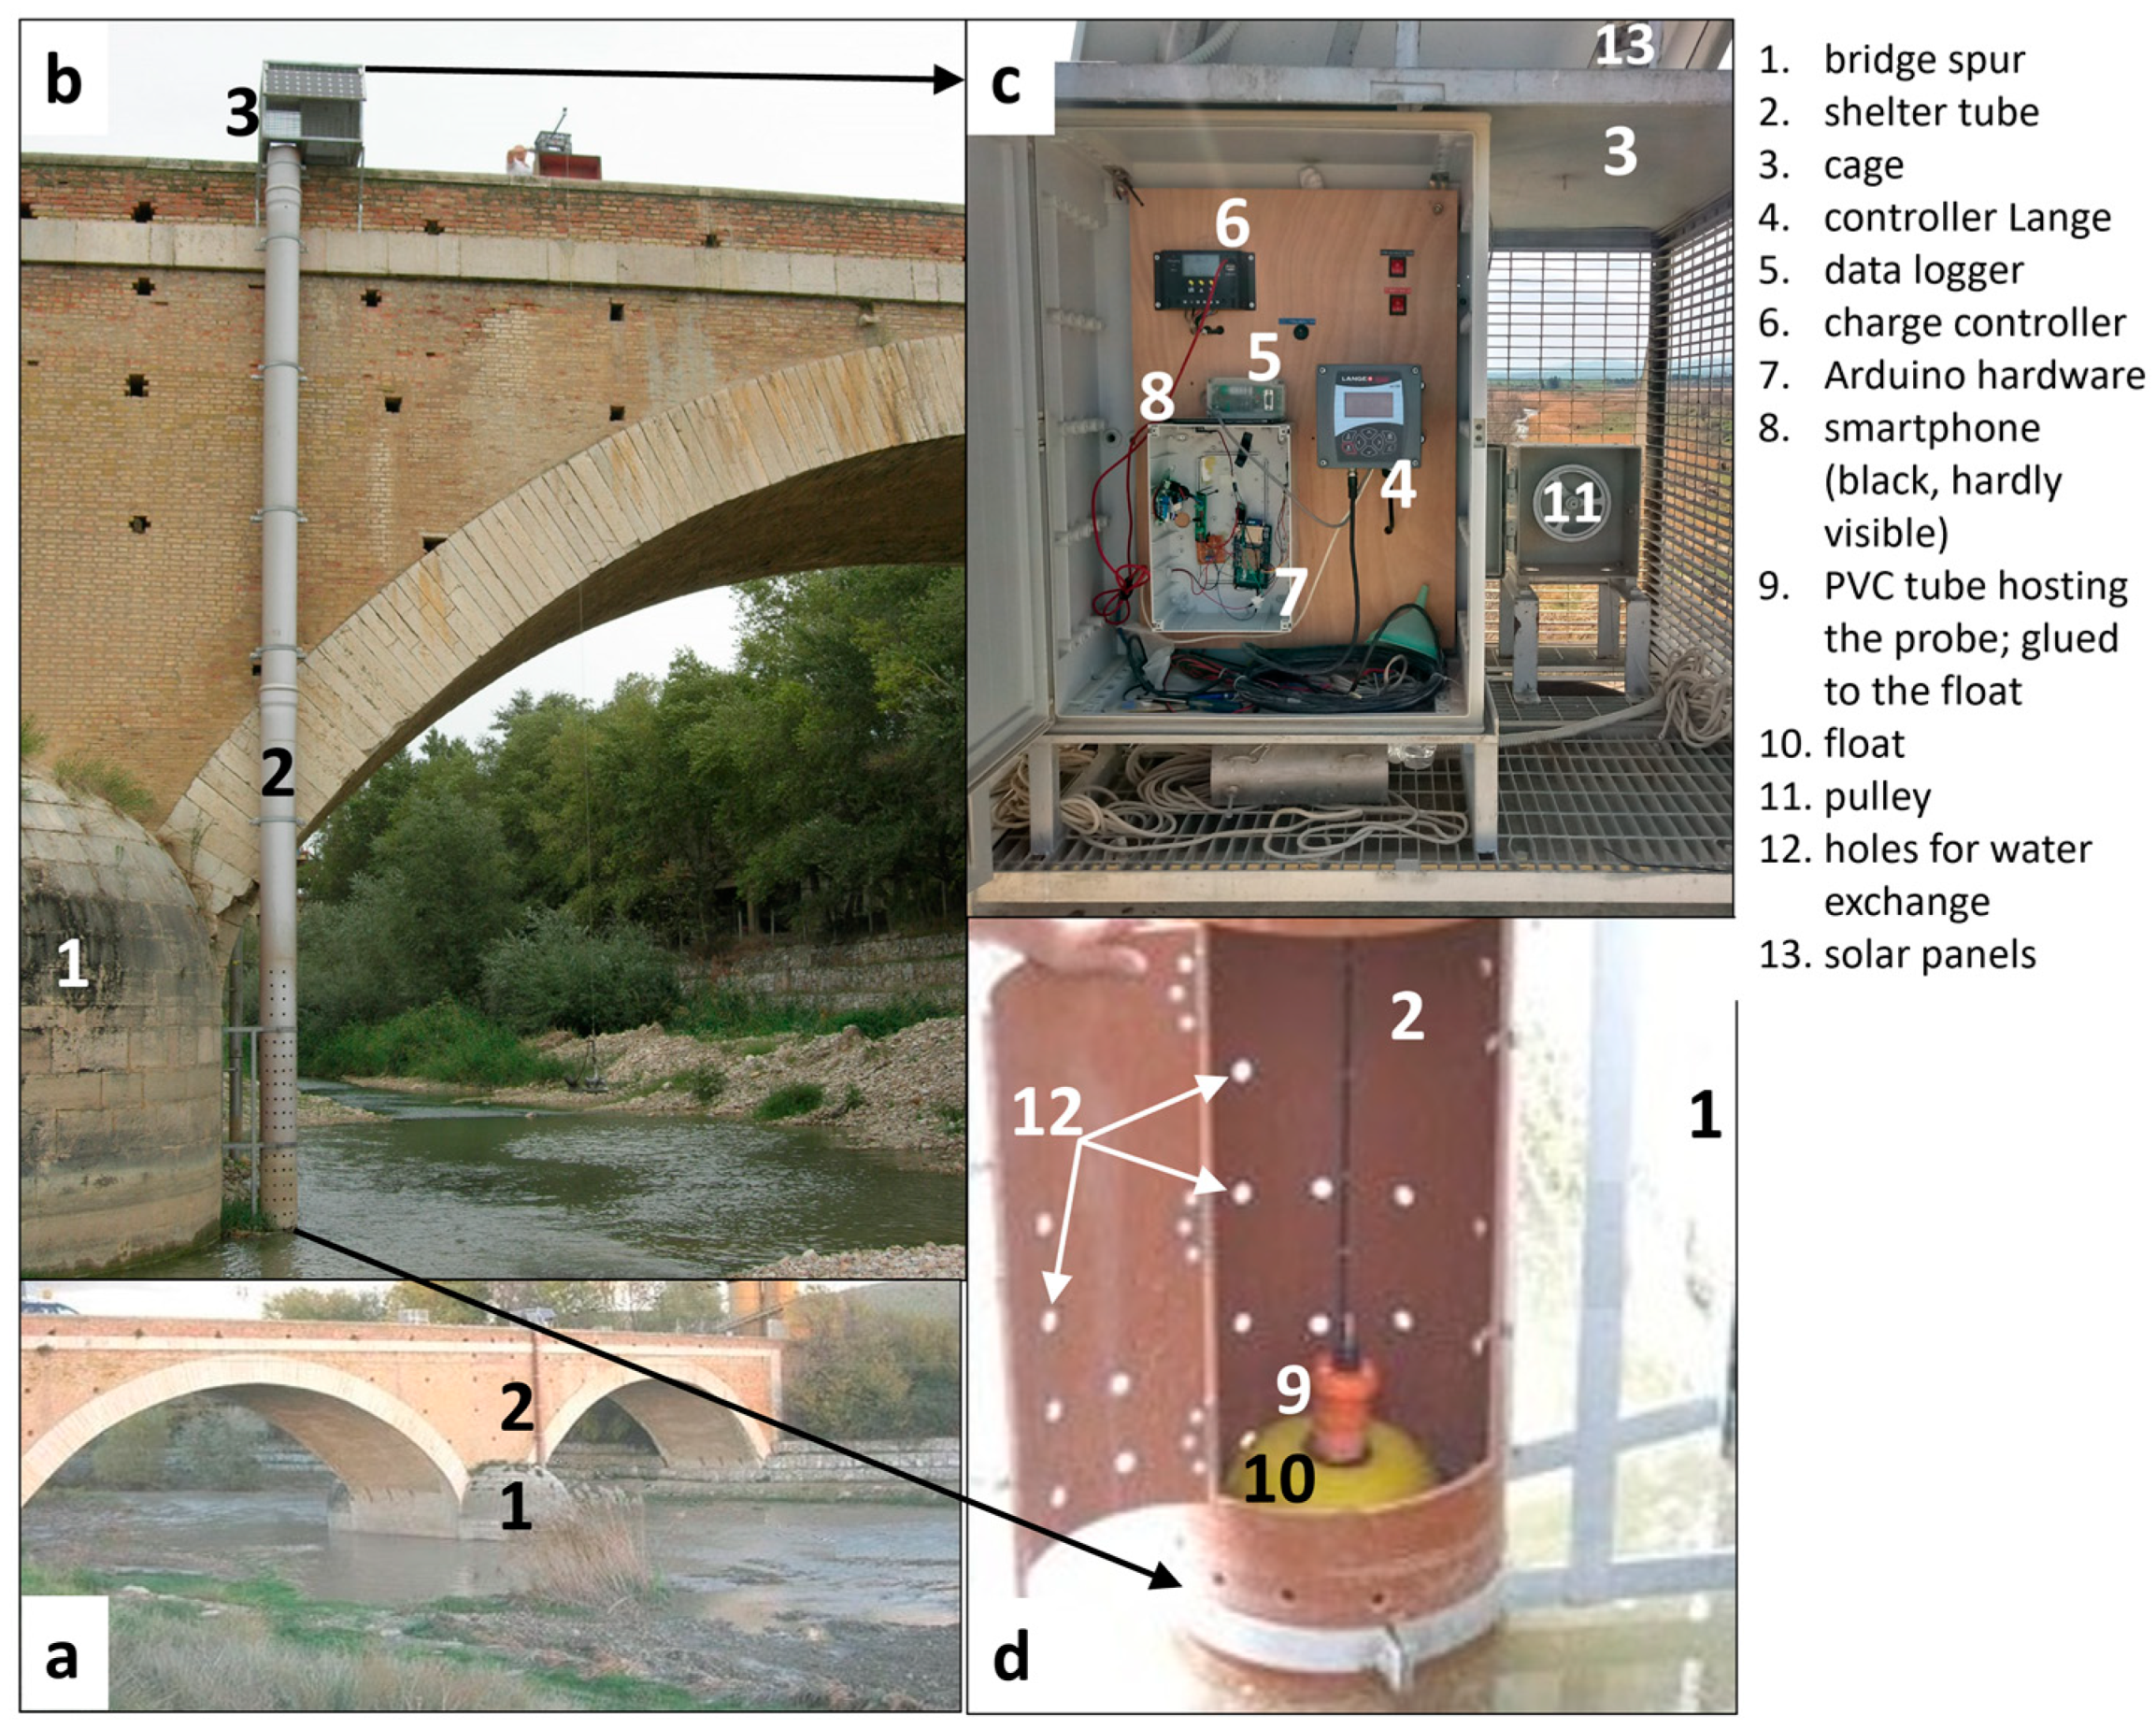
At the Carapelle Ordona bridge gauge Q and SSC were continuously monitored (2007–2011). However, due to the lack of data caused by the maintenance of the gauging station, 2009 was not included in this study [8]. The Hach–Lange Solitax hs-line sc probe was installed for measuring SSC (Figure 2) as it is able to measure high values of SSC (SSC > 15 g L−1) [26]. For fouling prevention, the probe has a screen wiper with a customizable time interval. By merging signals, the Hach–Lange Solitax sc100 controller transforms them into SSC [27] (Figure 2c). This approach considers the stray light effects, organic matter, and the colour of the watery medium while allowing for the examination of a wide range of concentrations (0.001–4000 Nephelometric Turbidity Units—NTU—for turbidity and 0–150 g L−1 for suspended particles).
The probe is securely housed in a drilled tube, providing protection against the impact of coarse materials in the stream and preventing potential measurement errors caused by stray radiant energy entering the infrared field. At the same time, the holes drilled on the tube (Figure 2d) allow an efficient exchange of the flowing suspension, as observed through several simultaneous manual samplings, which gave the same SSC values inside and outside the shelter tube.
The mechanical system consists of a pulley (Figure 2c), float (Figure 2d), and counter-weight group which allow the probe to be always submerged 20 cm below the free water surface. By employing a data acquisition framework and a transmission infrastructure, the data are sent to a server in the Department. An ultrasonic stage recorder, managed by the Centro Funzionale Decentrato (CFD) of the Sezione Protezione Civile della Regione Puglia, is operated for Q measurements. CFD developed the rating curves and provided Q data.
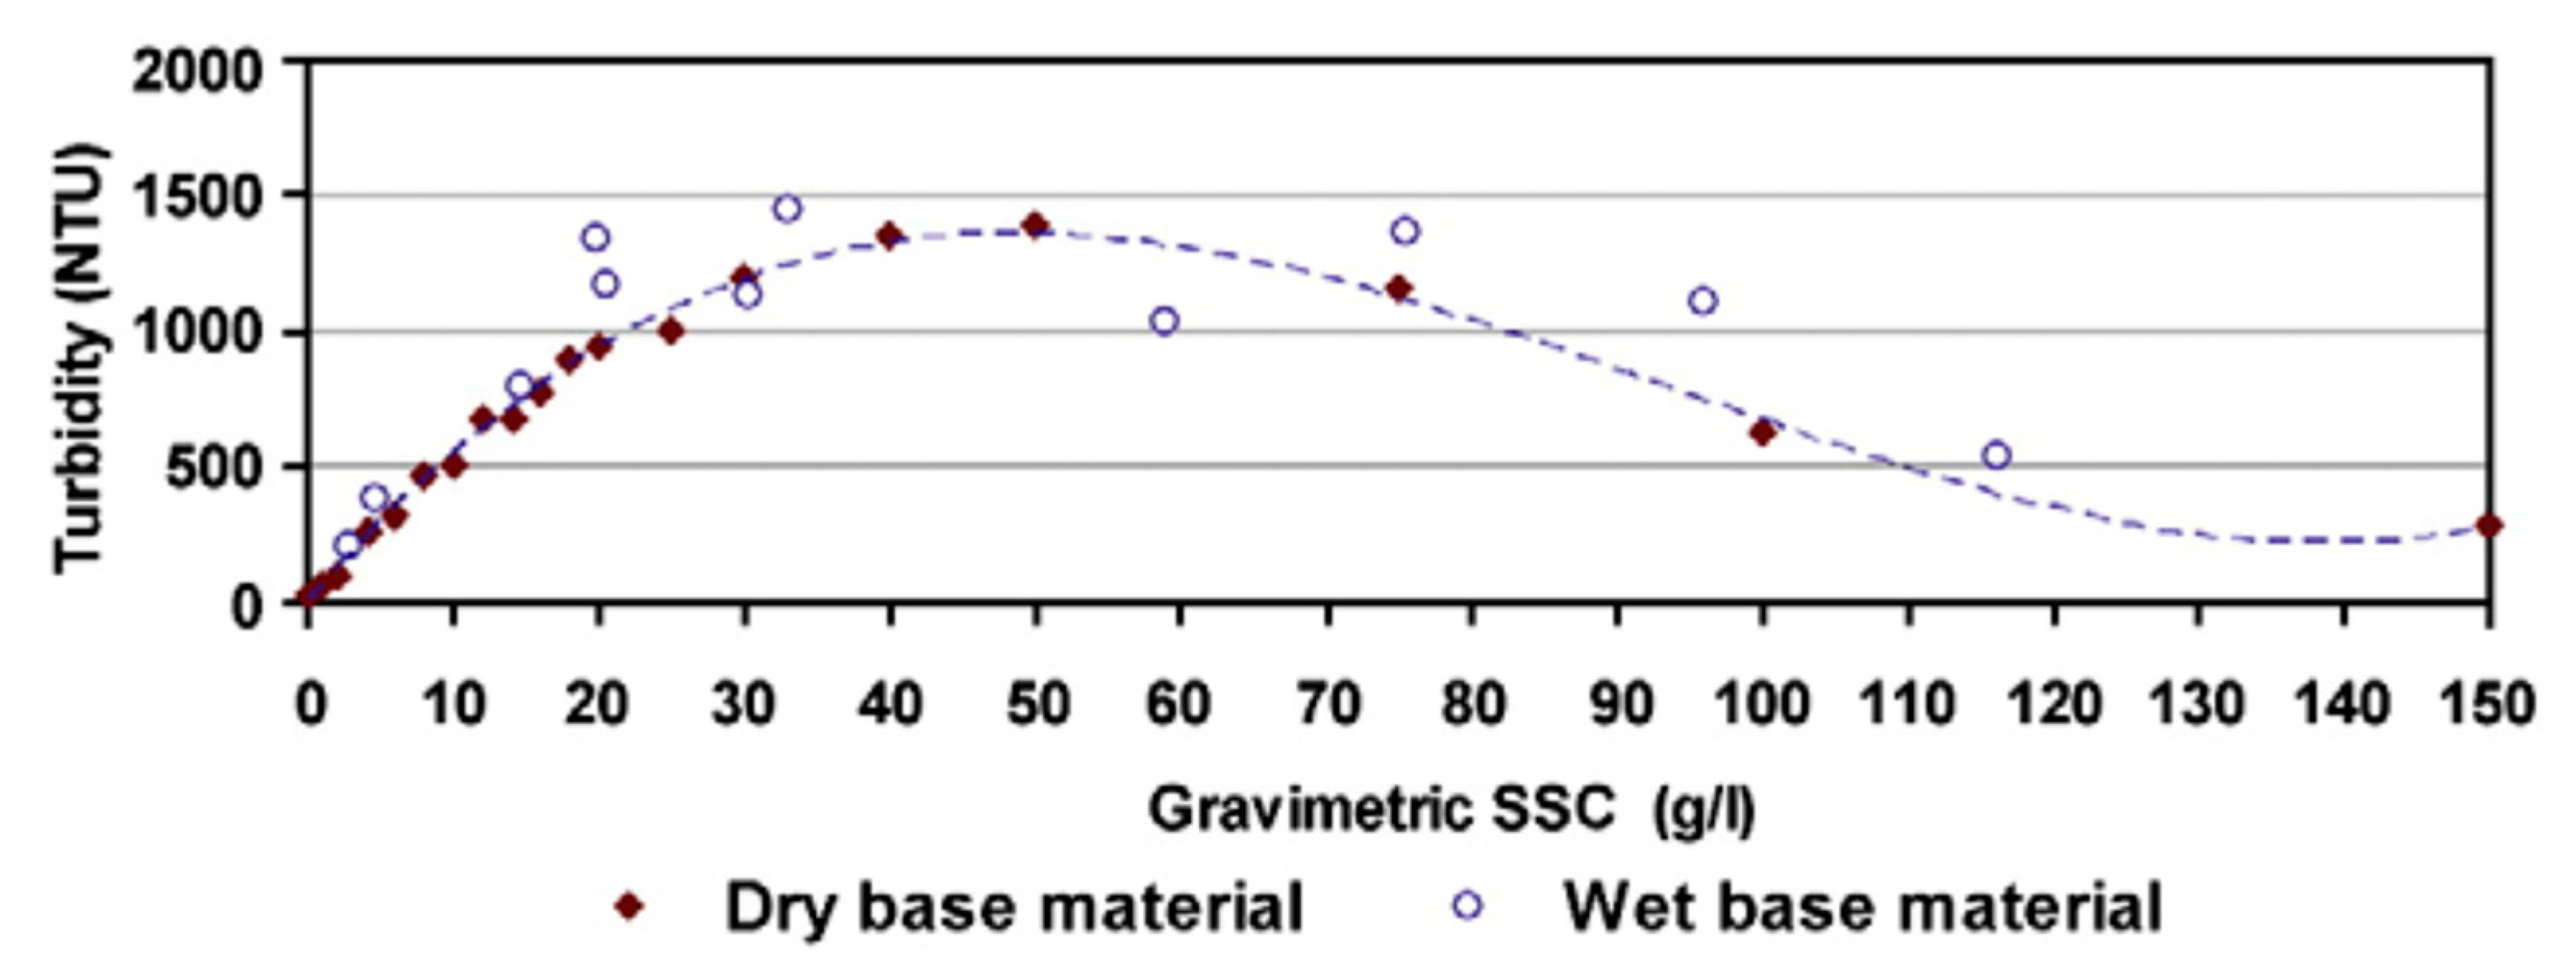
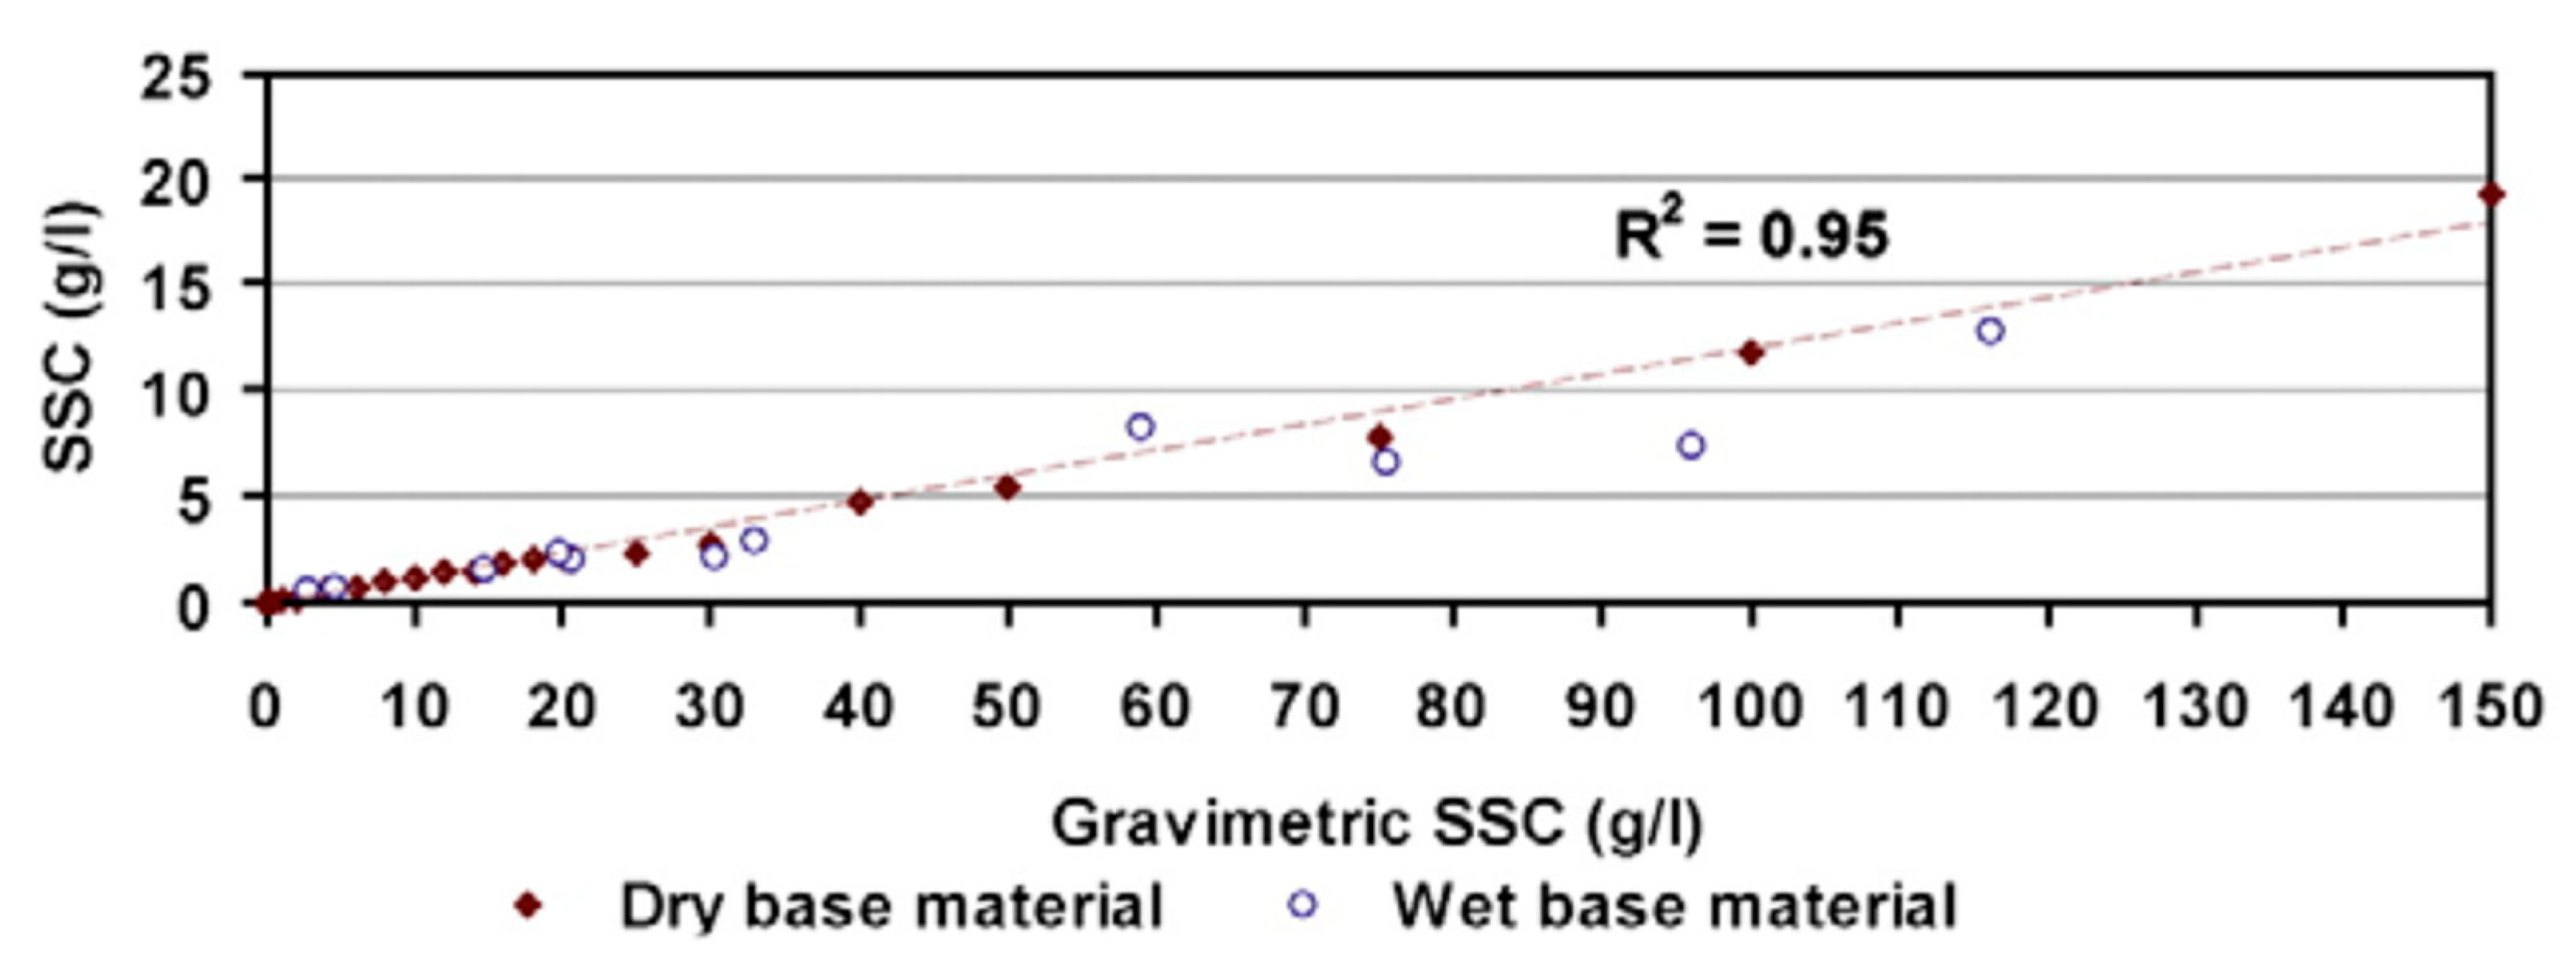
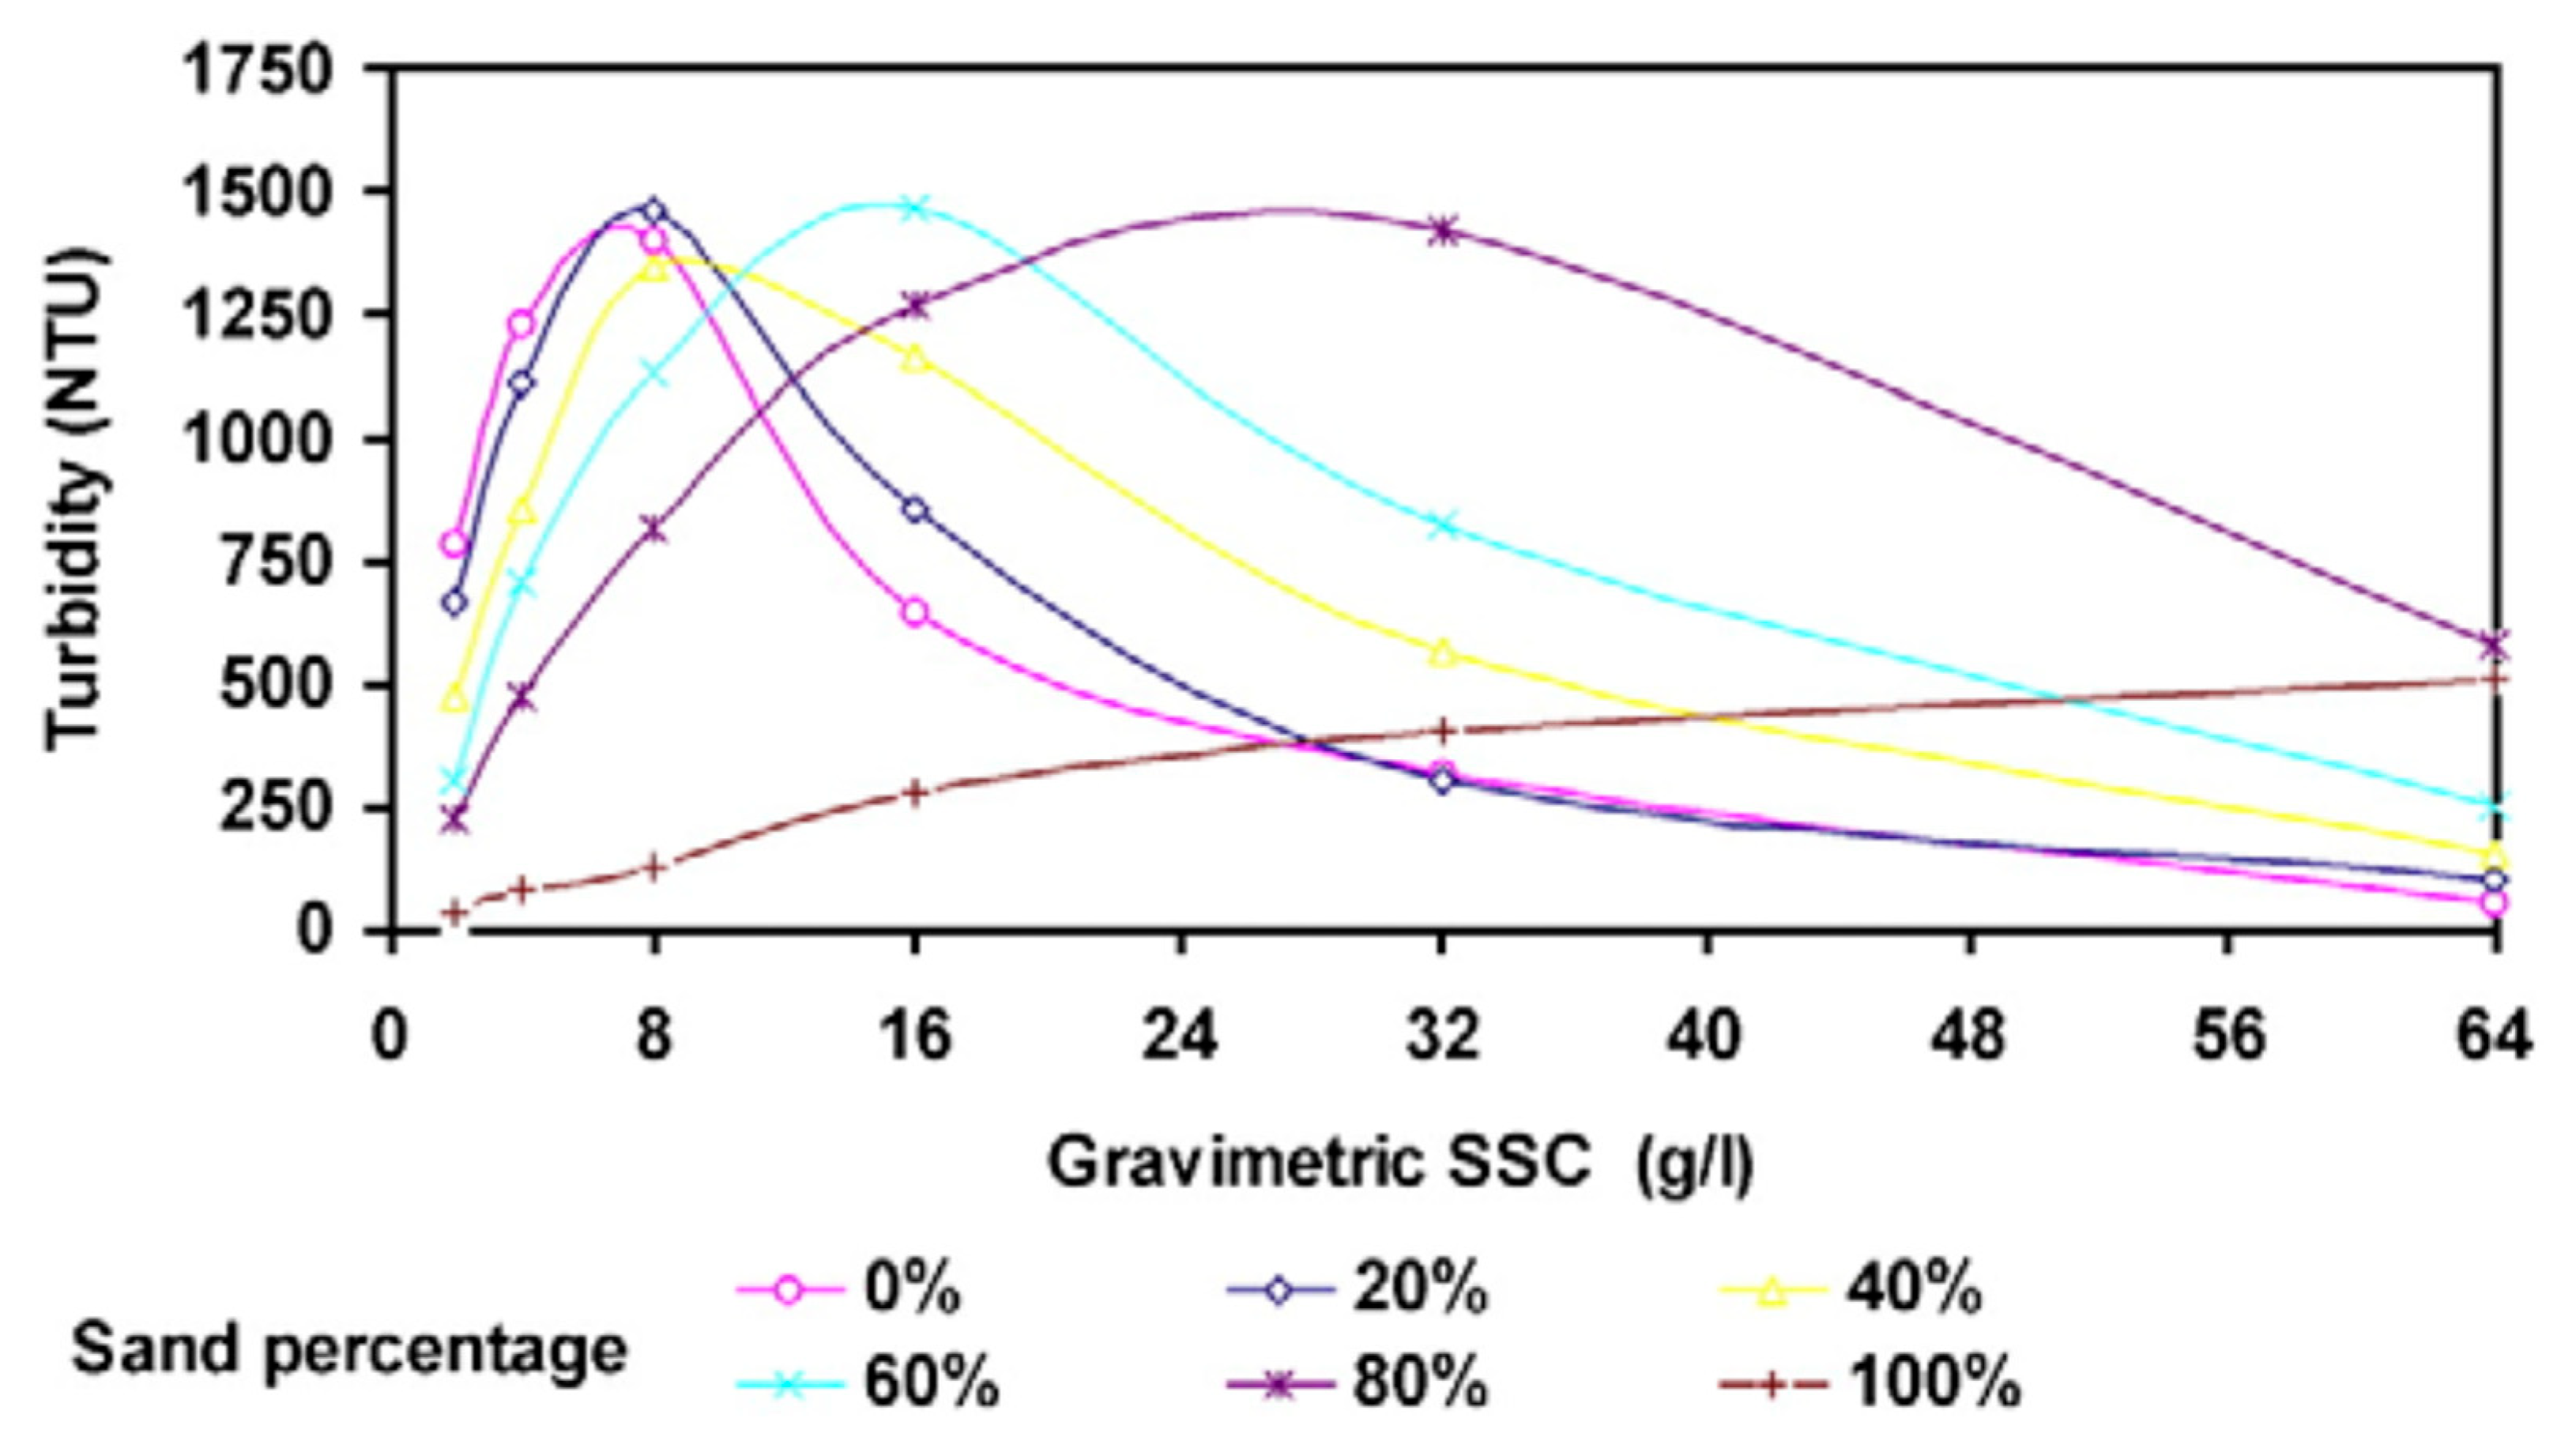
Laboratory experiments evaluated the functionality of the Solitax sc probe in relation to river sediments, offering versatile applications across various water conditions. Operating in the turbidity-nephelometric mode for low turbid water and suspended sediment-ratio detection system mode for highly concentrated sediments, the instrument’s two-detector optical system enabled accurate measurements of high Suspended Sediment Concentrations (SSCs) while compensating for colour variations, light fluctuations, and stray light. The study involved tests on suspensions with fixed granulometric mixtures and varying ratios of sandy and fine fractions, derived from sediment samples collected from the Carapelle stream’s riverbed. Gravimetric analysis revealed predominant sandy content (87.5%) with minor proportions of silt (8.8%) and clay (3.7%). The suspensions were prepared in wet, oven-dried, and separated forms to examine their impact on measurements. The experiments yielded valuable insights into the probe’s performance, the influence of sediment composition, and the relationship between optical data and gravimetric SSCs (Figure A1, Figure A2 and Figure A3 in Appendix A). Following that, the equipment was field-calibrated considering the most significant flood events, and the SSC was plotted against discharge with a 30 min time step. Detailed information about instrument calibration is reported by Gentile et al. [28]. Over the study period, several gaps in continuous measurements of SSC were recorded due to problems with the powering. The percentage of SSC missing data was 21.7% (20 gaps in 2007; 165 in 2008; 21 in 2010; and 112 in 2011).
SSC and Q were monitored at the Celone river at the M. Pirro gauge (Figure 3) for a year (July 2010 to June 2011). Discrete samplings for SSC determination were carried out by using an automatic sampler (ISCO model 6712FS; with 24 bottles; pumped volume 1 L). The instrument was connected to a Flow Module (ISCO 750 Area Velocity) for continuous measurements of Q. The sensor provided continuous (5 min) measurements of flow velocity and stream water stage. These values were converted to Q by using a stage-discharge rating curve based on the river cross-section, which had a regular and permanent shape. Therefore, by using a template (Excel worksheet), the cross-sectional area corresponding to each water stage was calculated. Q was determined by multiplying flow velocity by the corresponding cross-sectional area. Several tests were completed to verify the sensor measurements.
The automatic sampler was set for two different programs. A regular protocol was established for timed samplings to ensure periodic sample collection at biweekly or monthly intervals during the arid season (from July to October). Subsequently, as the season shifted from November to June, the sampling frequency escalated to once or twice a week. The second program was oriented to monitor flood events. Specifically, it was based on fluctuations in water level during the hydrograph rising limb and flow velocity variations during the recession phase. The sampling intervals within the rising limb ranged from 15 min to 2 h, while in the recession limb, they varied from 2 h to 1 day. Over the course of the study, a comprehensive total of 216 samples were meticulously collected, encompassing all hydrological conditions. The IRSA-CNR laboratory conducted the analysis of SSCs using the esteemed APAT-IRSA analytical standard method. More details about instruments and monitoring plans are reported in [3,29].

3.2. Developing Sediment Rating Curves

SRCs were created to fill the gaps in the SSC recorded dataset at the Carapelle monitoring station, and for quantifying the SSC for those days during which no measurements were available at the Celone gauge.
The SRC is a regression equation determined by using a log-transformed least squares regression (Equation (1)), where the Q is the independent variable and SSC′ is the dependent variable.
L o g   S S C = log a + b log Q
The result of Equation (1) is needed in the original units. The back-transformation to the original scale by exponentiation introduces a bias that is an underestimation of the mean value on the original scale [30,31]. Several attempts have been carried out to enhance the SSCQ relationships by introducing a bias correction factor [30,32,33,34]. In the present work, the bias correction factor proposed by Duan [33], the so-called Smearing Estimator (CF), was adopted (Equation (2)). The CF does not require any assumptions about the distribution of residuals.
C F = 1 N 10 ε i   N
where N is the number of measurements, εi is the residual (Equation (3)).
ε i = l o g   S S C i l o g ( S S C i )
where SSCi is the observed concentration and SSCi′ is the predicted values obtained through regression.
To improve the estimation of SSC′, several authors proposed to develop SRC for subsets of data defined on a seasonal basis, or on classes of Q rather than the entire available data set [23,35]. De Girolamo et al. [12] highlighted that for intermittent rivers, using subsets of data based on the flow regime provides higher accuracy than seasonal data stratification when estimating SSC′ and load with SRCs. In this research, three distinct datasets were identified based on classes of Q: high flow, normal flow, and low flow. These datasets were utilized to construct logarithmically transformed linear functions. To identify the sub-sets, the Flow Duration Curve (FDC) was used. FDC represents graphically the percentage of time (X-axis) in which a specific value of flow (Y-axis) is equalled or exceeded. All the flow conditions are represented in FDC, with lower percentages corresponding to high flows (i.e., floods) and higher percentages corresponding to low discharges (i.e., low flows) [36]. This methodology allows representation of the hydrologic response of a river basin and, therefore the Q variability [37,38].
The following three data stratifications were adopted: R1 (0–5%; 5–70%; 70–100%), R2 (0–10%; 10–70%; 70–100%), and R3 (0–20%; 20–70%; 70–100%), by using different thresholds for high-flow conditions. Specifically, the flex point observed at 70% of FDC was used to set the low flow class, which is the same for all the stratifications (70–100%). This range is associated with low-flow conditions [39]. For high flow instead, three different ranges were considered 0–5, 0–10%, and 0–20%. The values of 5%, 10%, and 20% are associated with flood and high-flow conditions [8,11].
The mean error (E) (Equation (4)) was calculated for each dataset as a percentage of the variances between SSCi and SSCi′ [21],
E   % = 1 N S S C i S S C i S S C i N × 100
after evaluating the SSC′, specific SS loads (t ha−1 yr−1) were computed both at the Carapelle gauge and at the Celone gauge at daily, and yearly time scales by the integration of the product of SSC and Q.

4. Results

4.1. Monitoring Streamflow and SSC

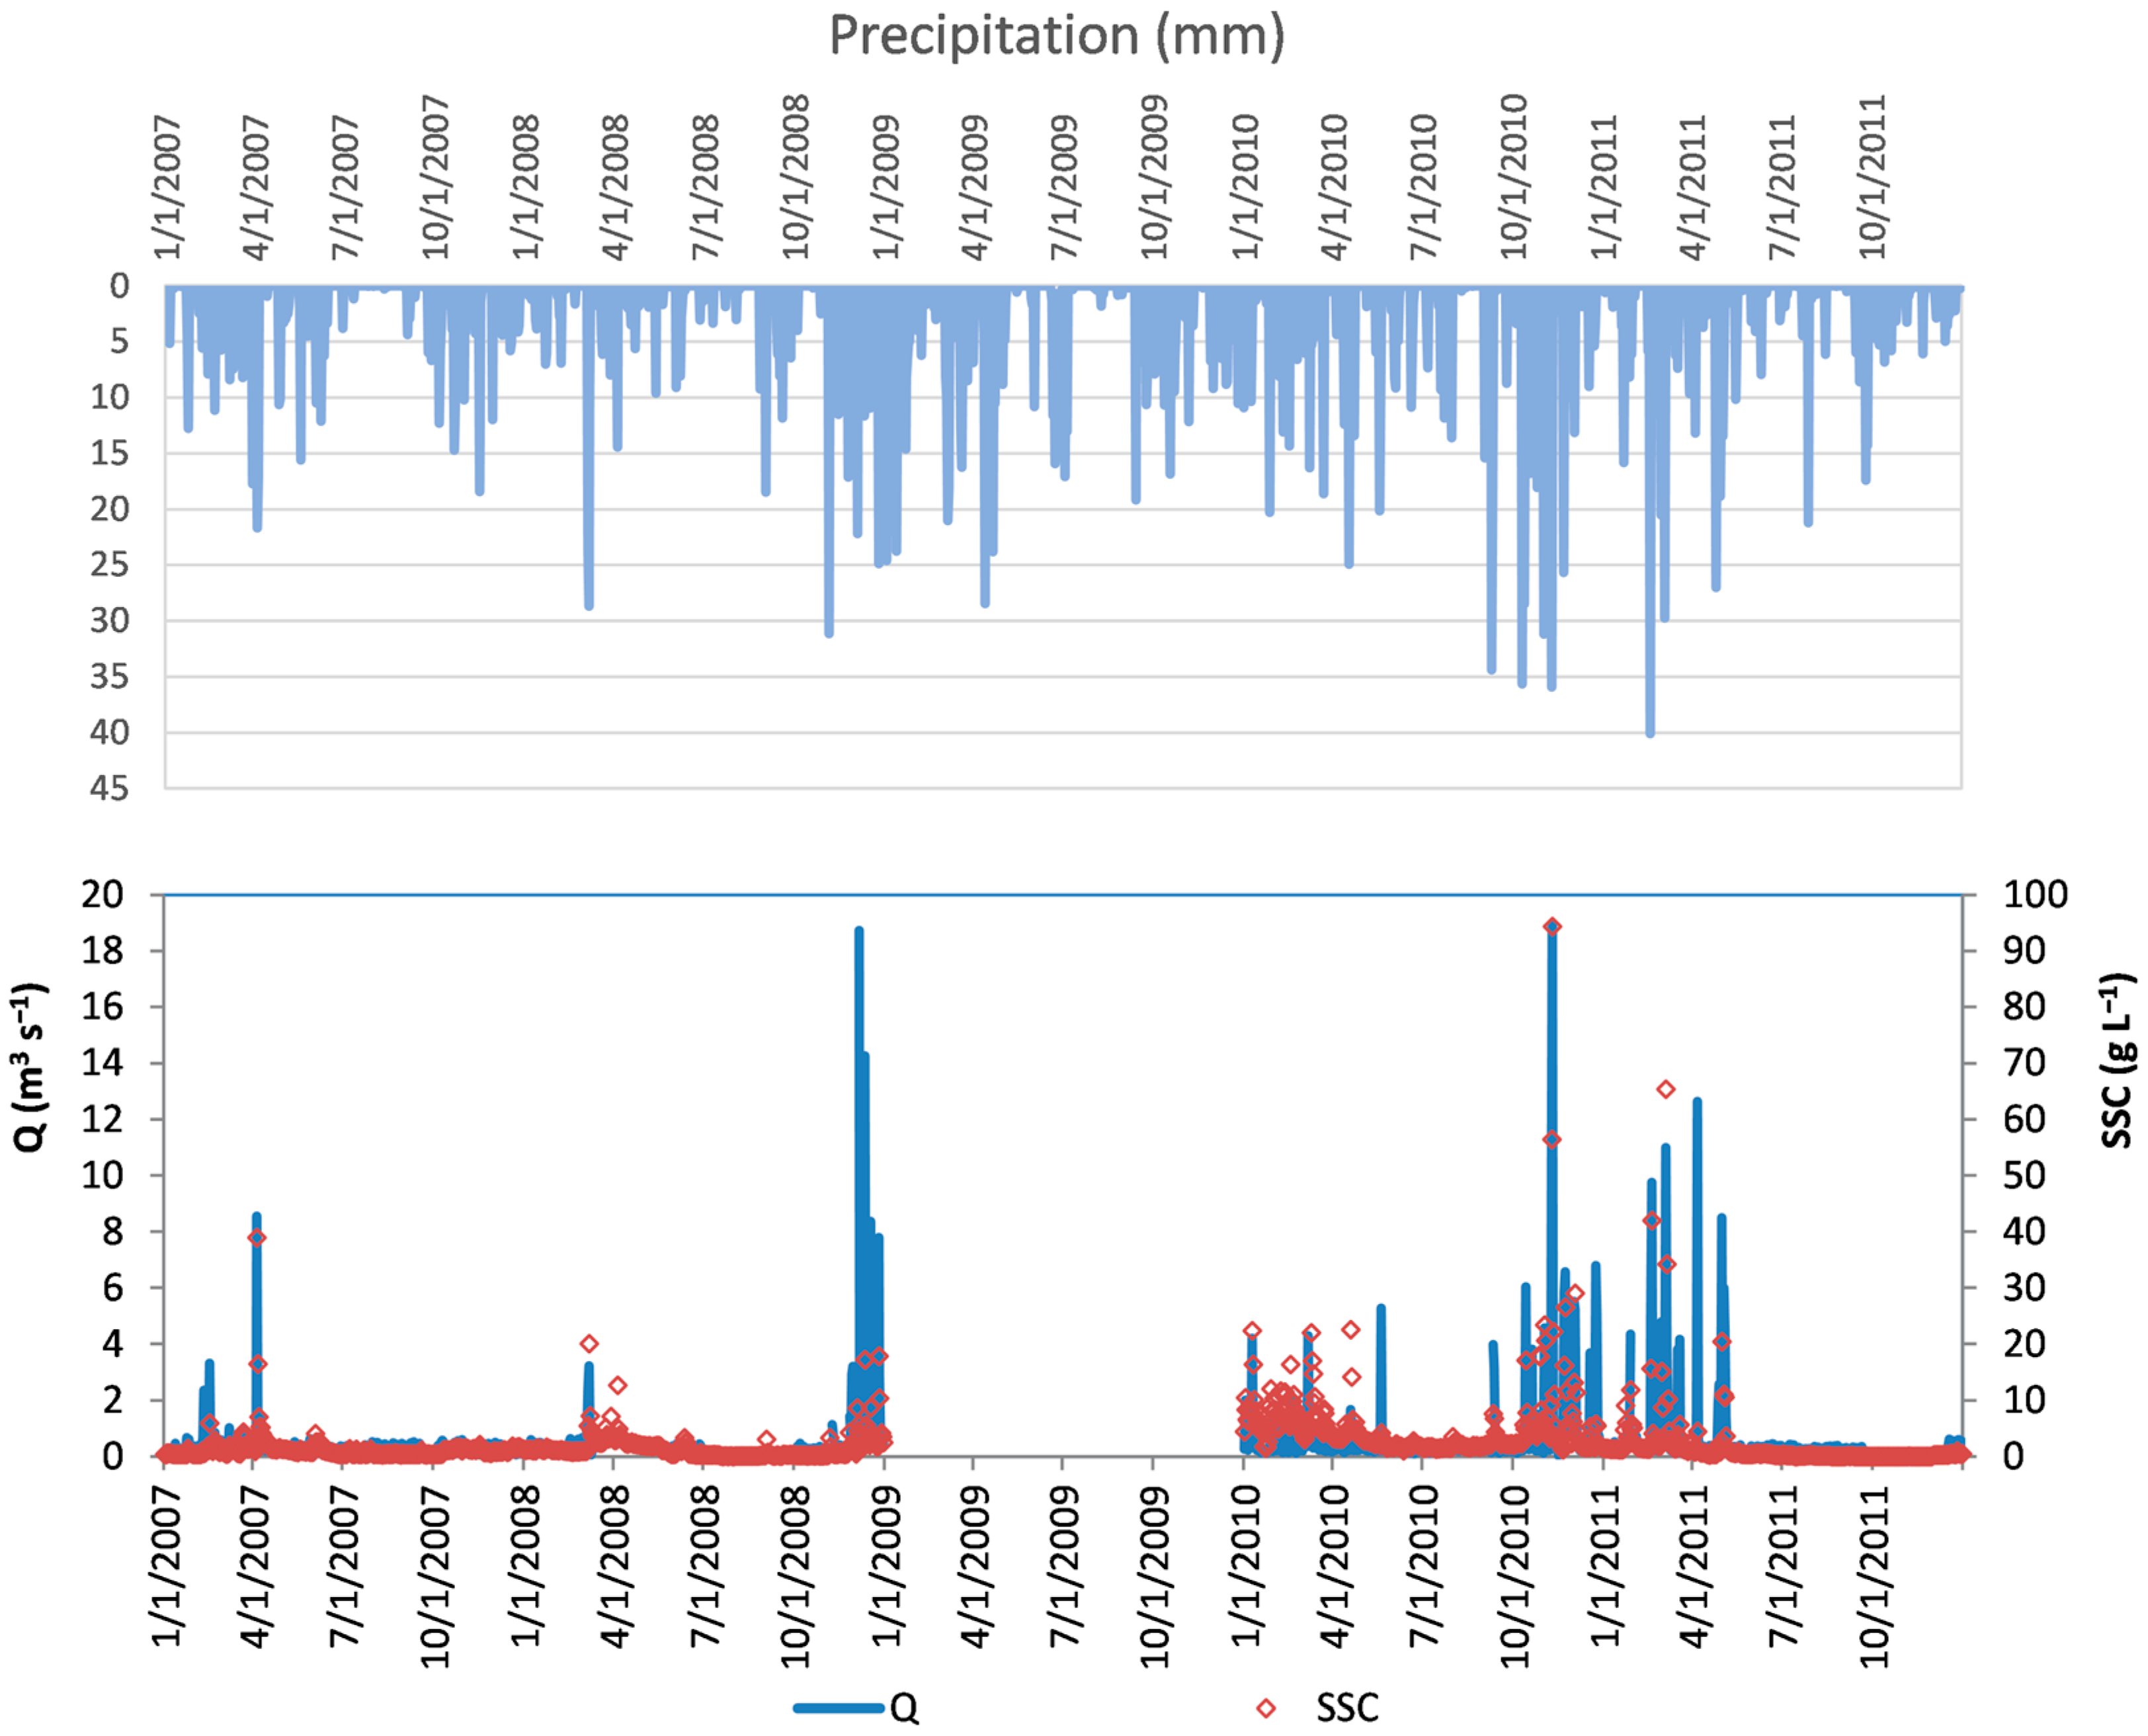
The transport of SS is greatly influenced by the flow regime of the rivers (Figure 4 and Figure 5). It is characterized by a long period (summer) of extremely low flow and a wet period (winter–spring) with continuous flow and floods. The pattern of SSC strictly follows the hydrograph for both rivers.
At the Carapelle gauge, the highest Q value (94.4 m3 s−1) was registered on 10 November 2010 when also the highest SSC value (18.92 g L−1) was recorded. In the wet season, the largest flood can generate a high value of SSC due to the whole basin contributing to sediment generation [8]. Low values of Q (0.005 m3 s−1) and SSC (<0.05 g L−1) are generally recorded in late summer. In the study period, the absence of flow was not recorded at the Ordona bridge. However, as reported in the historical time series of Q there are several years with zero flow conditions and the river is classified as a temporary river [8]. Different SSC magnitudes were recorded for equal discharge peaks, for instance, the floods recorded on 3 November 2010 (22.19 m3 s−1; 1.53 g L−1), and 10 March 2010 (22.03 m3 s−1; 0.52 g L−1). The observed behaviour can be attributed to various factors, including the impact of vegetation, spatial variability of precipitation, and variations in antecedent soil moisture content. Indeed, lands with the main crop production (wheat) in the area are unprotected in November, meanwhile, they are completely covered by vegetation in March.
In the case of the Celone river, it is noteworthy that similar peak values of Q resulted in a range of magnitudes of SSC, as depicted in Figure 5. For instance, on 30 November (10.83 m3 s−1; 3.92 g L−1) and 16 May (10.44 m3 s−1; 0.81 g L−1), it is evident that the interplay of vegetation, potential variations in rainfall patterns, and variations in antecedent soil moisture content plays a significant role in soil erosion and the transport of SS. The maximum SSC recorded in the wet season was 7.13 g L−1, associated with a streamflow value of 23.5 m3 s−1 (5 March 2011). In summer, flash flood events may be critical for SS transport. Particularly, on 21 July 2010, during a period of intense precipitation (Faeto gauge recorded 73.6 mm h−1), the recorded SSC was 37.60 g L−1, accompanied by a Q value of 5.95 m3 s−1. This event marked the highest ratio of SSC to Q observed throughout the study period. In summer, flash floods characterized by high SSC despite low Q, are frequent. This is caused by the fact that in summer most of the wheat fields are harvested and, therefore, the soils in the basin are bare [12]. In this case, if an intense rainfall event occurs, infiltration excess is the dominant process that generates the overland flow, therefore, Q increase and decrease quickly and a large amount of SS can be transported into the river including the sediment accumulated on the river bed [11].
As described by De Girolamo et al. [12] flash floods were considered outliers, therefore, they were not included in the dataset for developing the SRC.
Based on the dataset presented in this study, at the Carapelle gauge, SSC and Q are significantly correlated (r = 0.69). The coefficient of determination (R2 = 0.48) shows that the variance of SSC may be explained for 48% by Q, meanwhile, other factors such as rainfall factors (i.e., intensity, spatial distribution), vegetation cover, and tillage may hold for the 52% of the variance (Figure 6b). At the Celone gauge, after excluding four outliers, Q and SSC data from the monitoring campaign (July 2010 to June 2011) were significantly correlated. The coefficient of determination (R2 = 0.66) designates that the variance of SSC may be explained for 66% by Q (Figure 6a).

4.2. Developing Sediment Rating Curves

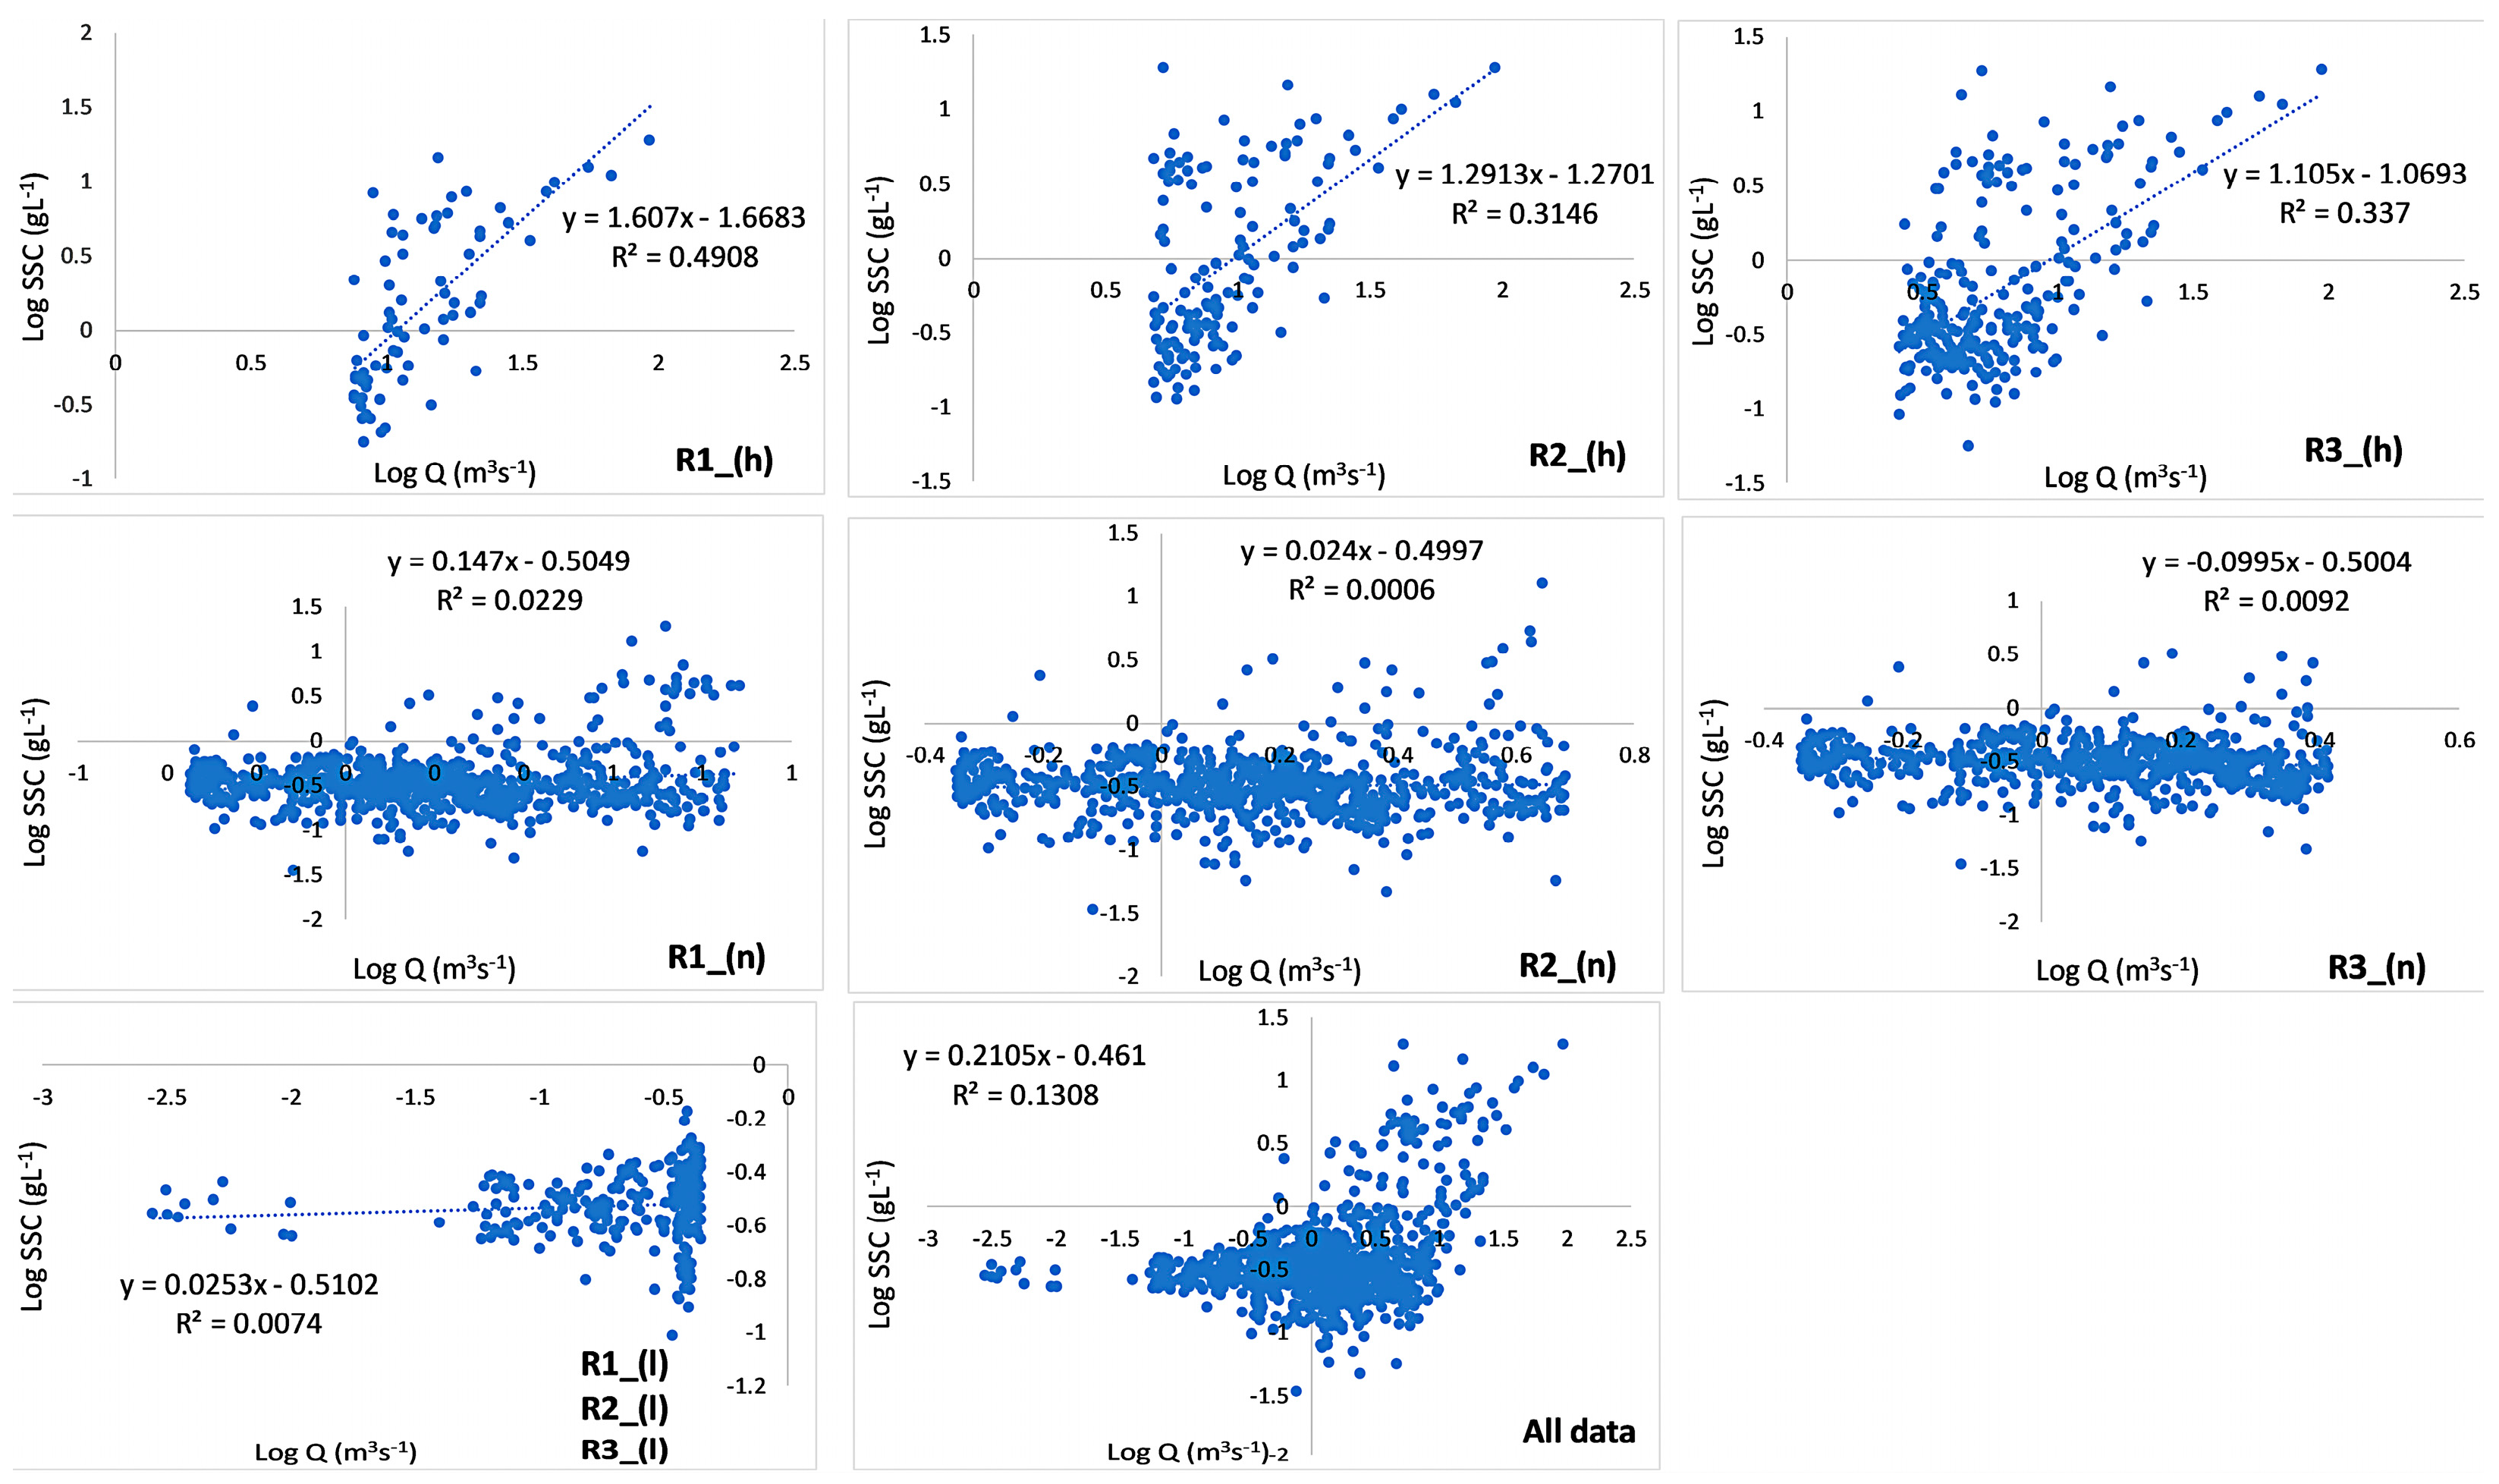
To identify the subsets of data for developing SRC, the FDC was used. For both rivers, SSC values resulted scattered, especially in high-flow conditions (Figure 7a,b) indicating that for the same value of Q, different values of SSC were recorded. At the Celone gauge, the coefficient of variation (CV) for SSC ranged from 109 (low flow) to 251 (high flow; 0–20%). The data stratification R1 showed the lowest CV in high-flow conditions. At the Carapelle gauge, the CV varied from 28 (70–100%) to 204 (5–70%). R1 showed the lowest CV for the high-flow conditions compared with R2 and R3. Log-transformed linear equations were derived to construct SRCs for the previously mentioned data stratifications (Figure 8 and Figure 9).
The CF values computed for high-flow conditions were higher than the values recorded in normal- and low-flow conditions for all the stratification data sets (Table 1) at the Carapelle gauge. This result indicates that the differences between measured and modelled values are higher in high flow than in the other conditions. At the Celone gauge, the highest values of CF were detected for the normal-flow condition clearly indicating very high residuals in this flow condition. The number of observations and their distribution among the flow conditions may have influenced the CF values. The latter hypotheses could also explain the fact that at the Celone gauge the CF values were higher than those recorded at the Carapelle gauge. High variability was also detected in the values assumed by E (%) among the datasets R1, R2, and R3 for both rivers (Table 2). High values of E (%) were detected for the Celone river, especially for normal- and low-flow conditions. This result is due to the different monitoring strategies adopted in the two catchments, discrete and continuous.

4.3. Sediment Loads

The annual specific SS load estimated for the Carapelle catchment showed a high inter-annual variability (Table 3), from 0.878 (2007) to 7.452 t ha−1 yr−1 (2010). Specifically, its mean annual value ranged from 3.30 to 3.34 t ha−1 yr−1, computed without and with CF, respectively. Slight differences among the three data stratifications (R1, R2, and R3) resulted in specific SS loads (Table 2). In addition, upon analysis, slight variations were observed in the results when considering the back-transformation correction CF, compared to the results obtained without its consideration (i.e., 1.479 t ha−1 yr−1 and 1.542 t ha−1 yr−1, respectively) (Table 3).
As previously described, the whole data set of the Celone river was limited to one year (from July 2010 to June 2011), hence, no investigations were carried out regarding the inter-annual variability. On a yearly basis, the specific SS load, computed by using the three data stratifications spanned in the interval 2.400 to 2.610 t ha−1 yr−1 (Table 3). A wide difference in specific SS loads was detected when using the CF (5.200 to 6.060 t ha−1 yr−1). Therefore, the actual value of specific SS load could vary in the interval 2.610–6.060 t ha−1 yr−1 showing a large uncertainty in the estimation.
SS load was mainly delivered during high flow in both catchments. Specifically, the suspended material transported during the low flow accounts for less than 0.1% of the total suspended material with slight differences between the basins. More than 80% is transported in high-flow conditions. Indeed, approximately 94% and 93% were delivered in the high-flow conditions (>20% of exceedance) in the Carapelle and Celone rivers, respectively (Table 4).

5. Discussion

This study showed that among the factors influencing the SS load determination are the duration of the sampled period and its characteristics (i.e., dry, wet conditions). Indeed, substantial year-to-year fluctuations were recorded for the Carapelle catchment, where the specific SS load ranged from 0.9 to 7.45 t ha−1 yr−1 (2007–2011). Also, monitoring strategies such as the frequency, the type of instrument (i.e., automated water sampling, turbidity monitoring), and the methodological approach adopted for estimating loads proved to influence the SS load computation. At the Celone M. Pirro, the specific SS load ranged from 2.40 to 6.06 t ha−1 yr−1 (from July 2010 to June 2011) depending on the computation method.
The present study identified the flow regime as the primary factor influencing SS delivery in mountainous catchments. Therefore, it is essential to carefully design monitoring plans that consider the streamflow behaviour.
Regarding discrete SSC samplings, it is essential to carefully determine the samplings timing and frequency. This ensures that the temporal variations in SSC are adequately captured, allowing for a representation of the complete range of Q conditions [40]. Both steady and sporadic measurements of Q and SSC offer distinct advantages and disadvantages. Steady continuous measurement of SSC offers the advantage of closely tracking the variations in Q, thereby facilitating the determination of sediment loads. However, this approach can be expensive and pose challenges, particularly when conducting measurements over extended periods of time. Infrared-based turbidity probes offer the advantage of providing continuous measurements of SSC. However, the use of these probes presents certain challenges. Some of the identified issues include the sensitivity of the probe’s output to environmental conditions and the variability in particle size, shape, and colour. To improve measurements, particle size could be further analysed using laser diffraction [41]. However, a cross-calibration with laboratory determinations is required. Furthermore, it should be noted that these turbidity probes have a limited operational range. Consequently, during situations with extreme variations in particle composition, there is a possibility of underestimating the SSC, particularly in conditions with very high values of SSC [42]. Automatic samplers offer the advantage of collecting regular samples and the ability to operate also in flood events. However, it is important to note that their usage can be costly. A limitation in their use is that the number of bottles available (typically 24) may not be sufficient to adequately cover certain floods, especially those of extended duration. In addition, in the case of discrete measurements of SSC, the SS load estimation may be affected by a high uncertainty level depending on the method used for its computation.
In this study, SRCs were formulated and employed to estimate SSC. This methodology was selected considering its ease of use, and its possibility to be applied in semi-arid regions characterized by data scarcity [11,43,44]. Indeed, other complex hydrological and morphodynamics models may be used, but they require a large input dataset to be implemented and a tough training phase [2,11,45,46]. Prior research has pointed out that SRCs underestimate high concentrations and overestimate low concentrations of SSC [9,11,12,21,23,31,47]. Hence, to enhance the accuracy of the SRCs, in this study, the complete dataset was split into subsets, based on the flow regime using FDC. This methodology allows us to generally assess the characteristics of Q and of a specific river basin, through a comparison between the magnitude and frequency [37]. On the other hand, one of the limits associated with this methodology is that the seasonality of the flow cannot be considered. Indeed, since all the data were plotted excluding the date of occurrence, the time-dependent information is lost [48]. Consequently, when FDC is associated with rating curves for the SS load estimation the accuracy can be low due to the non-linear relationship between Q and SSC [37]. This issue could be accentuated in Mediterranean rivers, in which, due to several factors (i.e., rainfall regime, the shape of the basin, and the location of the sediment sources), the peak of the SSC may occur before or after the peak of Q [8,49]. Moreover, flash floods in the dry season may be characterized by high SSC and low Q [11]. One solution which can be adopted to improve the accuracy is to develop FDC using sub-daily data [50].
The application of CF was then employed to address the error associated with the back-transformation process. The results in terms of annual specific SS loads are included in a very short interval when using the three data stratifications at the Carapelle gauge. Also, the use of CF showed slight differences in specific SS loads on a yearly basis (<0.3%).
For the Celone river, differences in specific SS load estimations among the three data stratifications were detected (i.e., 2.40 t ha−1 yr−1 and 2.61 t ha−1 yr−1). In contrast with the Carapelle catchment, a large interval was detected in the SS load estimated by using the CF at the Celone catchment (for instance 2.61 t ha−1 yr−1 and 6.01 t ha−1 yr−1, for the R1 data stratification). These results were due to the fact that at the Carapelle gauge the SRCs were used only for filling the gaps, which in some cases were limited to a few dozen (20 data in 2007, and 21 in 2010), therefore the difference among the three data stratification was deemed negligible, as well as the use of the CF. In the case of the Celone catchment, it was observed that the number of measurements and the specific methodology employed for computing the sediment load had a significant impact on the results. Furthermore, these factors contributed to a notable level of uncertainty associated with the findings [12]. Consistent with expectations, a substantial portion of the SS load was observed to be transported during high-flow conditions, accounting for over 80% of the total load in both the Carapelle and the Celone catchments. Similarly, Benselama et al. [51] highlighted that flood can contribute approximately 64%, and that in wet season almost 78% of SS load was recorded. In contrast, during low-flow conditions, the SS load was significantly lower, comprising less than 0.7% in the Celone catchment and approximately 0.4% in the Carapelle catchment. High variability was also detected in the values assumed by E (%) among the datasets R1, R2, and R3 for both rivers. Data stratification R1 showed the lowest E (%) in the high-flow condition compared with R2 and R3. Considering that most of the SS load was transported during the high flow, R1 is the best data stratification strategy for assessing SS load. The values of specific SS load (t ha−1 yr−1) observed in the Mediterranean areas are extremely variable [8]. Liquete et al. [52], for different river basins located in Spain, reported specific SS load values ranging from 0.004 to 2.00 t ha−1 yr−1. A slightly higher value (2.94 t ha−1 yr−1) was indicated for the Wadi El Maleh basin (Algeria) [51]. Estrany et al. [43] reported an SS load ranging from 2.20 to 4.50 t ha−1 yr−1. In Italy, within an analysis involving 40 different basins, Van Rompay et al. [53] observed a range between 0.20–19.6 t ha−1 yr−1. A higher value (32 t ha−1 yr−1) was evidenced for a basin located in central Apennine [54]. The values obtained for the two studied basins were similar to what is reported here for Mediterranean environment and, also in line with the average value of 6.73 t ha−1 yr−1 reported in Vanmaercke et al. [55].
Several studies that analysed the soil formation rates clearly indicated that soil formation is highly variable [56,57]. Alewell et al. [58] reported an average soil production rate in alpine areas ranging between 0.54 and 1.13 t ha−1 yr−1 for old soils and between 1.19 and 2.48 t ha−1 yr−1 for young soils. Similarly, soil loss tolerance (SLT) can assume different rates based on environmental factors (i.e., soil type, soil depth, and climate) [59,60]. Europe’s environment assessment [61] reported SLT in the range 1–5 t ha−1 yr−1 (shallow sandy soils and deep soils, respectively). However, over the long period, it is clear that annual soil loss higher than 1 t ha−1 yr−1 may produce irreversible soil damage if the soil formation rate is low [62]. The European Commission [63] recommended that the Member States adopt SLT values suitable to guarantee soil functions and sustainable soil use. Currently, SLTs of 0.3–2 t ha−1 yr−1 are adopted in Europe depending on the soil formation rate. This study highlighted that both in the Carapelle and the Celone catchments the specific SS load is higher than SLT, and confirms other studies carried out in neighbouring areas [47]. We argue that soil erosion values are higher than STL in the entire mountainous area of “Monti della Daunia”, hence, in both catchments, a program of mitigation or conservation measures is needed to reduce soil losses.

6. Conclusions

The annual variation in specific suspended sediment (SS) load in a catchment is influenced by factors such as wet or dry conditions and sediment load estimation methods. This study emphasizes the importance of monitoring streamflow and suspended sediment concentration (SSC) to assess soil loss. The findings reveal that both the Carapelle and Celone catchments experience soil losses exceeding the rate of soil formation.
The study demonstrates the effectiveness of sediment rating curves (SRCs) for estimating SSCs and filling data gaps. However, accurate SRCs require a comprehensive dataset covering diverse hydrological conditions, including flood events. The study implemented a data stratification approach based on flow regimes to enhance sediment load estimation by developing and testing multiple sediment rating curves.
These findings are valuable for water resource managers in quantifying suspended sediment loads. Further research should investigate the relationship between agricultural management practices, soil erosion, and suspended sediment loads. Identifying effectively the best management practices to reduce soil losses in the Carapelle and Celone catchments is crucial. These studies can contribute to strategies for mitigating sediment transport and improving water resources management in the area.

Author Contributions

Conceptualization, A.M.D.G.; Data curation, A.M.D.G., G.F.R. and F.M.; Formal analysis, A.M.D.G., G.F.R., F.M. and A.M.N.; Funding acquisition, A.M.D.G., A.L.P. and F.G.; Investigation, A.M.D.G., G.F.R. and F.M.; Methodology, A.M.D.G.; Supervision, A.M.D.G. and F.G.; Validation, A.M.D.G.; Visualization, A.M.D.G., G.F.R. and O.M.M.A.; Writing—original draft, A.M.D.G., G.F.R. and O.M.M.A.; Writing—review and editing, A.M.D.G., A.L.P. and F.G. All authors have read and agreed to the published version of the manuscript.

Funding

The data concerning the Celone river were collected within the EU FP7 MIRAGE Project (Contr. no. 211732) by the Water Research Institute—National Research Council (IRSA-CNR). The data concerning the Carapelle river were collected by the University of Bari (Principal Investigator F. Gentile) within the projects PRIN2010 “National network for monitoring, modeling and sustainable management of erosion processes in agricultural, hilly and mountainous territories” funded by the Italian Ministry of Education, University and Research and “Soil Erosion in Apulia: Monitoring, Modelling and Control Strategies” funded by the River Basin Authority of the Apulia Region. This study was carried out within the AGRARSENSE (Project: 101095835; HORIZON-KDT-JU-2021-1-IA) by IRSA-CNR and the Agritech National Research Center and received funding from the European Union Next-Generation EU (PIANO NAZIONALE DI RIPRESA E RESILIENZA (PNRR)—MISSIONE 4 COMPONENTE 2, INVESTIMENTO 1.4—D.D. 1032 17/06/2022, CN00000022). This manuscript reflects only the authors’ views and opinions, neither the European Union nor the European Commission can be considered responsible for them.

Data Availability Statement

The data presented in this study are available on request.

Acknowledgments

The authors gratefully acknowledge Angelantonio Calabrese and Giuseppe Pappagallo from IRSA—CNR and Giovanni Romano from DiSSPA—UNIBA for collaborating in field activities and analytical determinations of SSC. The authors gratefully acknowledge the anonymous reviewers for their valuable comments which contributed to improving the quality of the research article.

Conflicts of Interest

The authors declare no conflict of interest.

Appendix A

Figure A1. Relation between measured turbidity (NTU) and gravimetric SSC. Reprinted with permission from Gentile et al. [28].
Water 15 02715 g0a1
Figure A2. Relation between measured SSC and gravimetric SSC. Reprinted with permission from Gentile et al. [28].
Water 15 02715 g0a2
Figure A3. Relation between measured turbidity (NTU) and gravimetric SSC (Original wet and dry batches). Reprinted with permission from Gentile et al. [28].
Water 15 02715 g0a3

References

  1. Jones, A.; Panagos, P.; Barcelo, S.; Bouraoui, F.; Bosco, C.; Dewitte, O.; Gardi, C.; Erhard, M.; Hervás, J.; Hiederer, R.; et al. State of Soil in Europe; European Commission: Brussels, Belgium, 2012. [Google Scholar] [CrossRef]
  2. Ricci, G.F.; D’Ambrosio, E.; De Girolamo, A.M.; Gentile, F. Efficiency and Feasibility of Best Management Practices to Reduce Nutrient Loads in an Agricultural River Basin. Agric. Water Manag. 2022, 259, 107241. [Google Scholar] [CrossRef]
  3. Di Pillo, R.; De Girolamo, A.M.; Lo Porto, A.; Todisco, M.T. Detecting the Drivers of Suspended Sediment Transport in an Intermittent River: An Event-Based Analysis. CATENA 2023, 222, 106881. [Google Scholar] [CrossRef]
  4. López-Tarazón, J.A.; Estrany, J. Exploring Suspended Sediment Delivery Dynamics of Two Mediterranean Nested Catchments. Hydrol. Process 2017, 31, 698–715. [Google Scholar] [CrossRef]
  5. Pagano, S.G.; Rainato, R.; García-Rama, A.; Gentile, F.; Lenzi, M.A. Analysis of Suspended Sediment Dynamics at Event Scale: Comparison between a Mediterranean and an Alpine Basin. Hydrol. Sci. J. 2019, 64, 948–961. [Google Scholar] [CrossRef]
  6. De Girolamo, A.M.; Spanò, M.; D’Ambrosio, E.; Ricci, G.F.; Gentile, F. Developing a Nitrogen Load Apportionment Tool: Theory and Application. Agric. Water Manag. 2020, 226, 105806. [Google Scholar] [CrossRef]
  7. Bazzoffi, P.; Abbatista, F.; Vanino, S.; Napoli, R.; Fais, A.; Nino, P. Loss of Water Storage Capacity of Reservoirs in Southern Italy: Economic Implicances of Sedimentation. In Proceedings of the OECD Workshop on Agriculture and Water: Sustainability, Markets and Policies, Adelaide, Australia, 14–18 November 2005. [Google Scholar]
  8. Fortesa, J.; Ricci, G.F.; García-Comendador, J.; Gentile, F.; Estrany, J.; Sauquet, E.; Datry, T.; De Girolamo, A.M. Analysing Hydrological and Sediment Transport Regime in Two Mediterranean Intermittent Rivers. CATENA 2021, 196, 104865. [Google Scholar] [CrossRef]
  9. Ricci, G.F.; De Girolamo, A.M.; Gentile, F. Monitoring Suspended Sediment Transport in Two Moutainous River Basins: The Carapelle and the Celone (Apulia, Italy). In Proceedings of the 2022 IEEE Workshop on Metrology for Agriculture and Forestry (MetroAgriFor), Perugia, Italy, 3–5 November 2022; pp. 277–281. [Google Scholar] [CrossRef]
  10. Ricci, G.F.; Romano, G.; Leronni, V.; Gentile, F. Effect of Check Dams on Riparian Vegetation Cover: A Multiscale Approach Based on Field Measurements and Satellite Images for Leaf Area Index Assessment. Sci. Total Environ. 2019, 657, 827–838. [Google Scholar] [CrossRef]
  11. De Girolamo, A.M.; Pappagallo, G.; Lo Porto, A. Temporal Variability of Suspended Sediment Transport and Rating Curves in a Mediterranean River Basin: The Celone (SE Italy). CATENA 2015, 128, 135–143. [Google Scholar] [CrossRef]
  12. De Girolamo, A.M.; Di Pillo, R.; Lo Porto, A.; Todisco, M.T.; Barca, E. Identifying a Reliable Method for Estimating Suspended Sediment Load in a Temporary River System. CATENA 2018, 165, 442–453. [Google Scholar] [CrossRef]
  13. Moatar, F.; Meybeck, M. Compared Performances of Different Algorithms for Estimating Annual Nutrient Loads Discharged by the Eutrophic River Loire. Hydrol. Process 2005, 19, 429–444. [Google Scholar] [CrossRef]
  14. Letcher, R.A.; Jakeman, A.J.; Merritt, W.S.; McKee, L.J.; Eyre, B.D.; Baginska, B. Review of Techniques to Estimate Catchment Exports. Environ. Prot. Auth. 1999. Available online: https://s3-ap-southeast-1.amazonaws.com/ap-st01.ext.exlibrisgroup.com/61SCU_INST/storage/alma/46/23/CF/BC/A4/41/B1/C4/37/90/C5/4E/CF/06/BC/40/fulltext.pdf?response-content-type=application%2Fpdf&X-Amz-Algorithm=AWS4-HMAC-SHA256&X-Amz-Date=20230726T153307Z&X-Amz-SignedHeaders=host&X-Amz-Expires=119&X-Amz-Credential=AKIAJN6NPMNGJALPPWAQ%2F20230726%2Fap-southeast-1%2Fs3%2Faws4_request&X-Amz-Signature=52411230030f2f472e4d1b11f6bc67fb3eea1e357b9987fae64ac71ae0212b15 (accessed on 20 June 2023).
  15. Borrelli, P.; Alewell, C.; Alvarez, P.; Anache, J.A.A.; Baartman, J.; Ballabio, C.; Bezak, N.; Biddoccu, M.; Cerdà, A.; Chalise, D.; et al. Soil Erosion Modelling: A Global Review and Statistical Analysis. Sci. Total Environ. 2021, 780, 146494. [Google Scholar] [CrossRef] [PubMed]
  16. Abdelwahab, O.M.M.; Bingner, R.L.; Milillo, F.; Gentile, F. Evaluation of Alternative Management Practices with the AnnAGNPS Model in the Carapelle Watershed. Soil Sci. 2016, 181, 293–305. [Google Scholar] [CrossRef]
  17. Ferro, V.; Porto, P. Sediment Delivery Distributed (SEDD) Model. J. Hydrol. Eng. 2000, 5, 411–422. [Google Scholar] [CrossRef] [Green Version]
  18. Bagarello, V.; Ferro, V.; Pampalone, V.; Porto, P.; Todisco, F.; Vergni, L. Predicting Soil Loss in Central and South Italy with a Single USLE-MM Model. J. Soils Sediments 2018, 18, 3365–3377. [Google Scholar] [CrossRef]
  19. De Girolamo, A.M.; Cerdan, O.; Grangeon, T.; Ricci, G.F.; Vandromme, R.; Lo Porto, A. Modelling Effects of Forest Fire and Post-Fire Management in a Catchment Prone to Erosion: Impacts on Sediment Yield. CATENA 2022, 212, 106080. [Google Scholar] [CrossRef]
  20. Lewis, J. Turbidity-Controlled Suspended Sediment Sampling for Runoff-Event Load Estimation. Water Resour. Res. 1996, 32, 2299–2310. [Google Scholar] [CrossRef]
  21. Horowitz, A.J. An Evaluation of Sediment Rating Curves for Estimating Suspended Sediment Concentrations for Subsequent Flux Calculations. Hydrol. Process 2003, 17, 3387–3409. [Google Scholar] [CrossRef]
  22. Jansson, M.B. Estimating a Sediment Rating Curve of the Reventazón River at Palomo Using Logged Mean Loads within Discharge Classes. J. Hydrol. 1996, 183, 227–241. [Google Scholar] [CrossRef]
  23. Asselman, N.E.M. Fitting and Interpretation of Sediment Rating Curves. J. Hydrol. 2000, 234, 228–248. [Google Scholar] [CrossRef]
  24. Aquilino, M.; Novelli, A.; Tarantino, E.; Iacobellis, V.; Gentile, F. Evaluating the Potential of GeoEye Data in Retrieving LAI at Watershed Scale. Remote Sens. Agric. Ecosyst. Hydrol. XVI 2014, 9239, 590–600. [Google Scholar] [CrossRef]
  25. Novelli, A.; Tarantino, E.; Fratino, U.; Iacobellis, V.; Romano, G.; Gentile, F. A Data Fusion Algorithm Based on the Kalman Filter to Estimate Leaf Area Index Evolution in Durum Wheat by Using Field Measurements and MODIS Surface Reflectance Data. Remote Sens. Lett. 2016, 7, 476–484. [Google Scholar] [CrossRef]
  26. Bisantino, T.; Gentile, F.; Milella, P.; Liuzzi, G.T. Effect of Time Scale on the Performance of Different Sediment Transport Formulas in a Semiarid Region. J. Hydraul. Eng. 2010, 136, 56–61. [Google Scholar] [CrossRef]
  27. Sadar, M.J.; Hach, C.C. Turbidity Science: Technical Information Series; Hach Company: Loveland, CO, USA, 1998. [Google Scholar]
  28. Gentile, F.; Bisantino, T.; Corbino, R.; Milillo, F.; Romano, G.; Liuzzi, G.T. Monitoring and Analysis of Suspended Sediment Transport Dynamics in the Carapelle Torrent (Southern Italy). CATENA 2010, 80, 1–8. [Google Scholar] [CrossRef]
  29. De Girolamo, A.M.; Balestrini, R.; D’Ambrosio, E.; Pappagallo, G.; Soana, E.; Lo Porto, A. Antropogenic Input of Nitrogen and Riverine Export from a Mediterranean Catchment. The Celone, a Temporary River Case Study. Agric. Water Manag. 2017, 187, 190–199. [Google Scholar] [CrossRef]
  30. Koch, R.W.; Smillie, G.M. Bias in Hydrologic Prediction Using Log-Transformed Regression Models. J. Am. Water Resour. Assoc. 1986, 22, 717–723. [Google Scholar] [CrossRef]
  31. Ferguson, R.I. River Loads Underestimated by Rating Curves. Water Resour. Res. 1986, 22, 74–76. [Google Scholar] [CrossRef]
  32. Bradu, D.; Mundlak, Y. Estimation in Lognormal Linear Models. J. Am. Stat. Assoc. 1970, 65, 198–211. [Google Scholar] [CrossRef]
  33. Duan, N. Smearing Estimate: A Nonparametric Retransformation Method. J. Am. Stat. Assoc. 1983, 78, 605–610. [Google Scholar] [CrossRef]
  34. Gilroy, E.J.; Hirsch, R.M.; Cohn, T.A. Mean Square Error of Regression-Based Constituent Transport Estimates. Water Resour. Res. 1990, 26, 2069–2077. [Google Scholar] [CrossRef]
  35. Walling, D.E.; Webb, B.W. Erosion and Sediment Yield: Global and Regional Perspectives. In Proceedings of the International Symposium, Exeter, UK, 15–19 July 1996. [Google Scholar]
  36. Kannan, N.; Anandhi, A.; Jeong, J. Estimation of Stream Health Using Flow-Based Indices. Hydrology 2018, 5, 20. [Google Scholar] [CrossRef] [Green Version]
  37. Vogel, R.M.; Fennessey, N.M. Flow Duration Curves Ll: A Review of Applications in Water Resources Planning. Water Resour. Bull. 1995, 31, 1029–1039. [Google Scholar] [CrossRef]
  38. Ganora, D.; Claps, P.; Laio, F.; Viglione, A. An Approach to Estimate Nonparametric Flow Duration Curves in Ungauged Basins. Water Resour. Res. 2009, 45. [Google Scholar] [CrossRef]
  39. Smakhtin, V.U. Low Flow Hydrology: A Review. J. Hydrol. 2001, 240, 147–186. [Google Scholar] [CrossRef]
  40. Harmel, R.D.; Cooper, R.J.; Slade, R.M.; Haney, R.L.; Arnold, J.G. Cumulative Uncertainty in Measured Streamflow and Water Quality Data for Small Watersheds. Trans. ASABE 2006, 49, 689–701. [Google Scholar] [CrossRef]
  41. Di Stefano, C.; Ferro, V.; Mirabile, S. Comparison between Grain-Size Analyses Using Laser Diffraction and Sedimentation Methods. Biosyst. Eng. 2010, 106, 205–215. [Google Scholar] [CrossRef]
  42. Clifford, N.J.; Richards, K.S.; Brown, R.A.; Lane, S.N. Laboratory and Field Assessment of an Infrared Turbidity Probe and Its Response to Particle Size and Variation in Suspended Sediment Concentration. Hydrol. Sci. J. 1995, 40, 771–791. [Google Scholar] [CrossRef] [Green Version]
  43. Estrany, J.; Garcia, C.; Batalla, R.J. Suspended Sediment Transport in a Small Mediterranean Agricultural Catchment. Earth Surf. Process Landf. 2009, 34, 929–940. [Google Scholar] [CrossRef]
  44. Rulot, F.; Dewals, B.J.; Erpicum, S.; Archambeau, P.; Pirotton, M. 6.13—Long-Term Sediment Management for Sustainable Hydropower. In Comprehensive Renewable Energy; Elsevier: Amsterdam, The Netherlands, 2012; pp. 355–376. ISBN 9780080878737. [Google Scholar]
  45. Wright, S.A.; Topping, D.J.; Rubin, D.M.; Melis, T.S. An Approach for Modeling Sediment Budgets in Supply-Limited Rivers. Water Resour. Res. 2010, 46. [Google Scholar] [CrossRef]
  46. Harrington, S.T.; Harrington, J.R. An Assessment of the Suspended Sediment Rating Curve Approach for Load Estimation on the Rivers Bandon and Owenabue, Ireland. Geomorphology 2013, 185, 27–38. [Google Scholar] [CrossRef]
  47. Walling, D.E.; Webb, B.W. The Reliability of Rating Curve Estimates of Suspended Sediment Yield: Some Further Comments. In Proceedings of the Porto Alegre Meeting, Porto Alegre, Brazil, 14–21 December 1988. [Google Scholar]
  48. Guo, X.; Xu, L.; Su, L.; Deng, Y.; Yang, C. Comparing Flow Duration Curves and Discharge Hydrographs to Assess Eco-Flows. Water Resour. Manag. 2021, 35, 4681–4693. [Google Scholar] [CrossRef]
  49. Walling, D.E. Limitations of the Rating Curve Technique for Estimating Suspended Sediment Loads, With Particular Reference to The Use of Cs-137 and Pb-210 Measurements for the Assessment of Soil Erosion and Sedimentation in the Riva Basin (Istanbul, NW Turkey) View Project. Available online: https://www.researchgate.net/profile/Des-Walling/publication/253921527_Limitations_of_the_Rating_Curve_Technique_for_Estimating_Suspended_Sediment_Loads_With_Particular_Reference_to_British_Rivers/links/53edb5bb0cf23733e80ad89d/Limitations-of-the-Rating-Curve-Technique-for-Estimating-Suspended-Sediment-Loads-With-Particular-Reference-to-British-Rivers.pdf (accessed on 20 June 2023).
  50. Chen, L.; Schumer, R.; Knust, A.; Forsee, W. Impact of Temporal Resolution of Flow-Duration Curve on Sediment Load Estimation. J. Am. Water Resour. Assoc. 2012, 48, 145–155. [Google Scholar] [CrossRef]
  51. Benselama, O.; Mazour, M.; Hasbaia, M.; Djoukbala, O.; Mokhtari, S. Analysis of the Suspended Sediment Yield at Different Time Scales in Mediterranean Watershed, Case of Wadi El Maleh (North-West of Algeria). J. Mediterr. Earth Sci. 2019, 11, 3–13. [Google Scholar] [CrossRef]
  52. Liquete, C.; Canals, M.; Ludwig, W.; Arnau, P. Sediment Discharge of the Rivers of Catalonia, NE Spain, and the Influence of Human Impacts. J. Hydrol. 2009, 366, 76–88. [Google Scholar] [CrossRef]
  53. Van Rompaey, A.; Bazzoffi, P.; Jones, R.J.A.; Montanarella, L. Modeling Sediment Yields in Italian Catchments. Geomorphology 2005, 65, 157–169. [Google Scholar] [CrossRef] [Green Version]
  54. Borrelli, P.; Märker, M.; Panagos, P.; Schütt, B. Modeling Soil Erosion and River Sediment Yield for an Intermountain Drainage Basin of the Central Apennines, Italy. CATENA 2014, 114, 45–58. [Google Scholar] [CrossRef]
  55. Vanmaercke, M.; Poesen, J.; Verstraeten, G.; de Vente, J.; Ocakoglu, F. Sediment Yield in Europe: Spatial Patterns and Scale Dependency. Geomorphology 2011, 130, 142–161. [Google Scholar] [CrossRef] [Green Version]
  56. Alexander, E.B. Rates of Soil Formation: Implications for Soil-Loss Tolerance. Soil Sci. 1988, 145, 37–45. [Google Scholar] [CrossRef]
  57. Verheijen, F.G.A.; Jones, R.J.A.; Rickson, R.J.; Smith, C.J. Tolerable versus Actual Soil Erosion Rates in Europe. Earth Sci. Rev. 2009, 94, 23–38. [Google Scholar] [CrossRef] [Green Version]
  58. Alewell, C.; Egli, M.; Meusburger, K. An Attempt to Estimate Tolerable Soil Erosion Rates by Matching Soil Formation with Denudation in Alpine Grasslands. J. Soils Sediments 2015, 15, 1383–1399. [Google Scholar] [CrossRef] [Green Version]
  59. Bazzoffi, P. Soil Erosion Tolerance and Water Runoff Control: Minimum Environmental Standards. Reg. Environ. Chang. 2009, 9, 169–179. [Google Scholar] [CrossRef]
  60. Di Stefano, C.; Ferro, V. Establishing Soil Loss Tolerance: An Overview. J. Agric. Eng. 2016, 47, 127–133. [Google Scholar] [CrossRef] [Green Version]
  61. Europe’s Environment: The Second Assessment—European Environment Agency. Available online: https://www.eea.europa.eu/publications/92-828-3351-8 (accessed on 31 May 2023).
  62. Di Stefano, C.; Nicosia, A.; Pampalone, V.; Ferro, V. Soil Loss Tolerance in the Context of the European Green Deal. Heliyon 2023, 9, e12869. [Google Scholar] [CrossRef] [PubMed]
  63. Soil and Land. Available online: https://environment.ec.europa.eu/topics/soil-and-land_en (accessed on 31 May 2023).
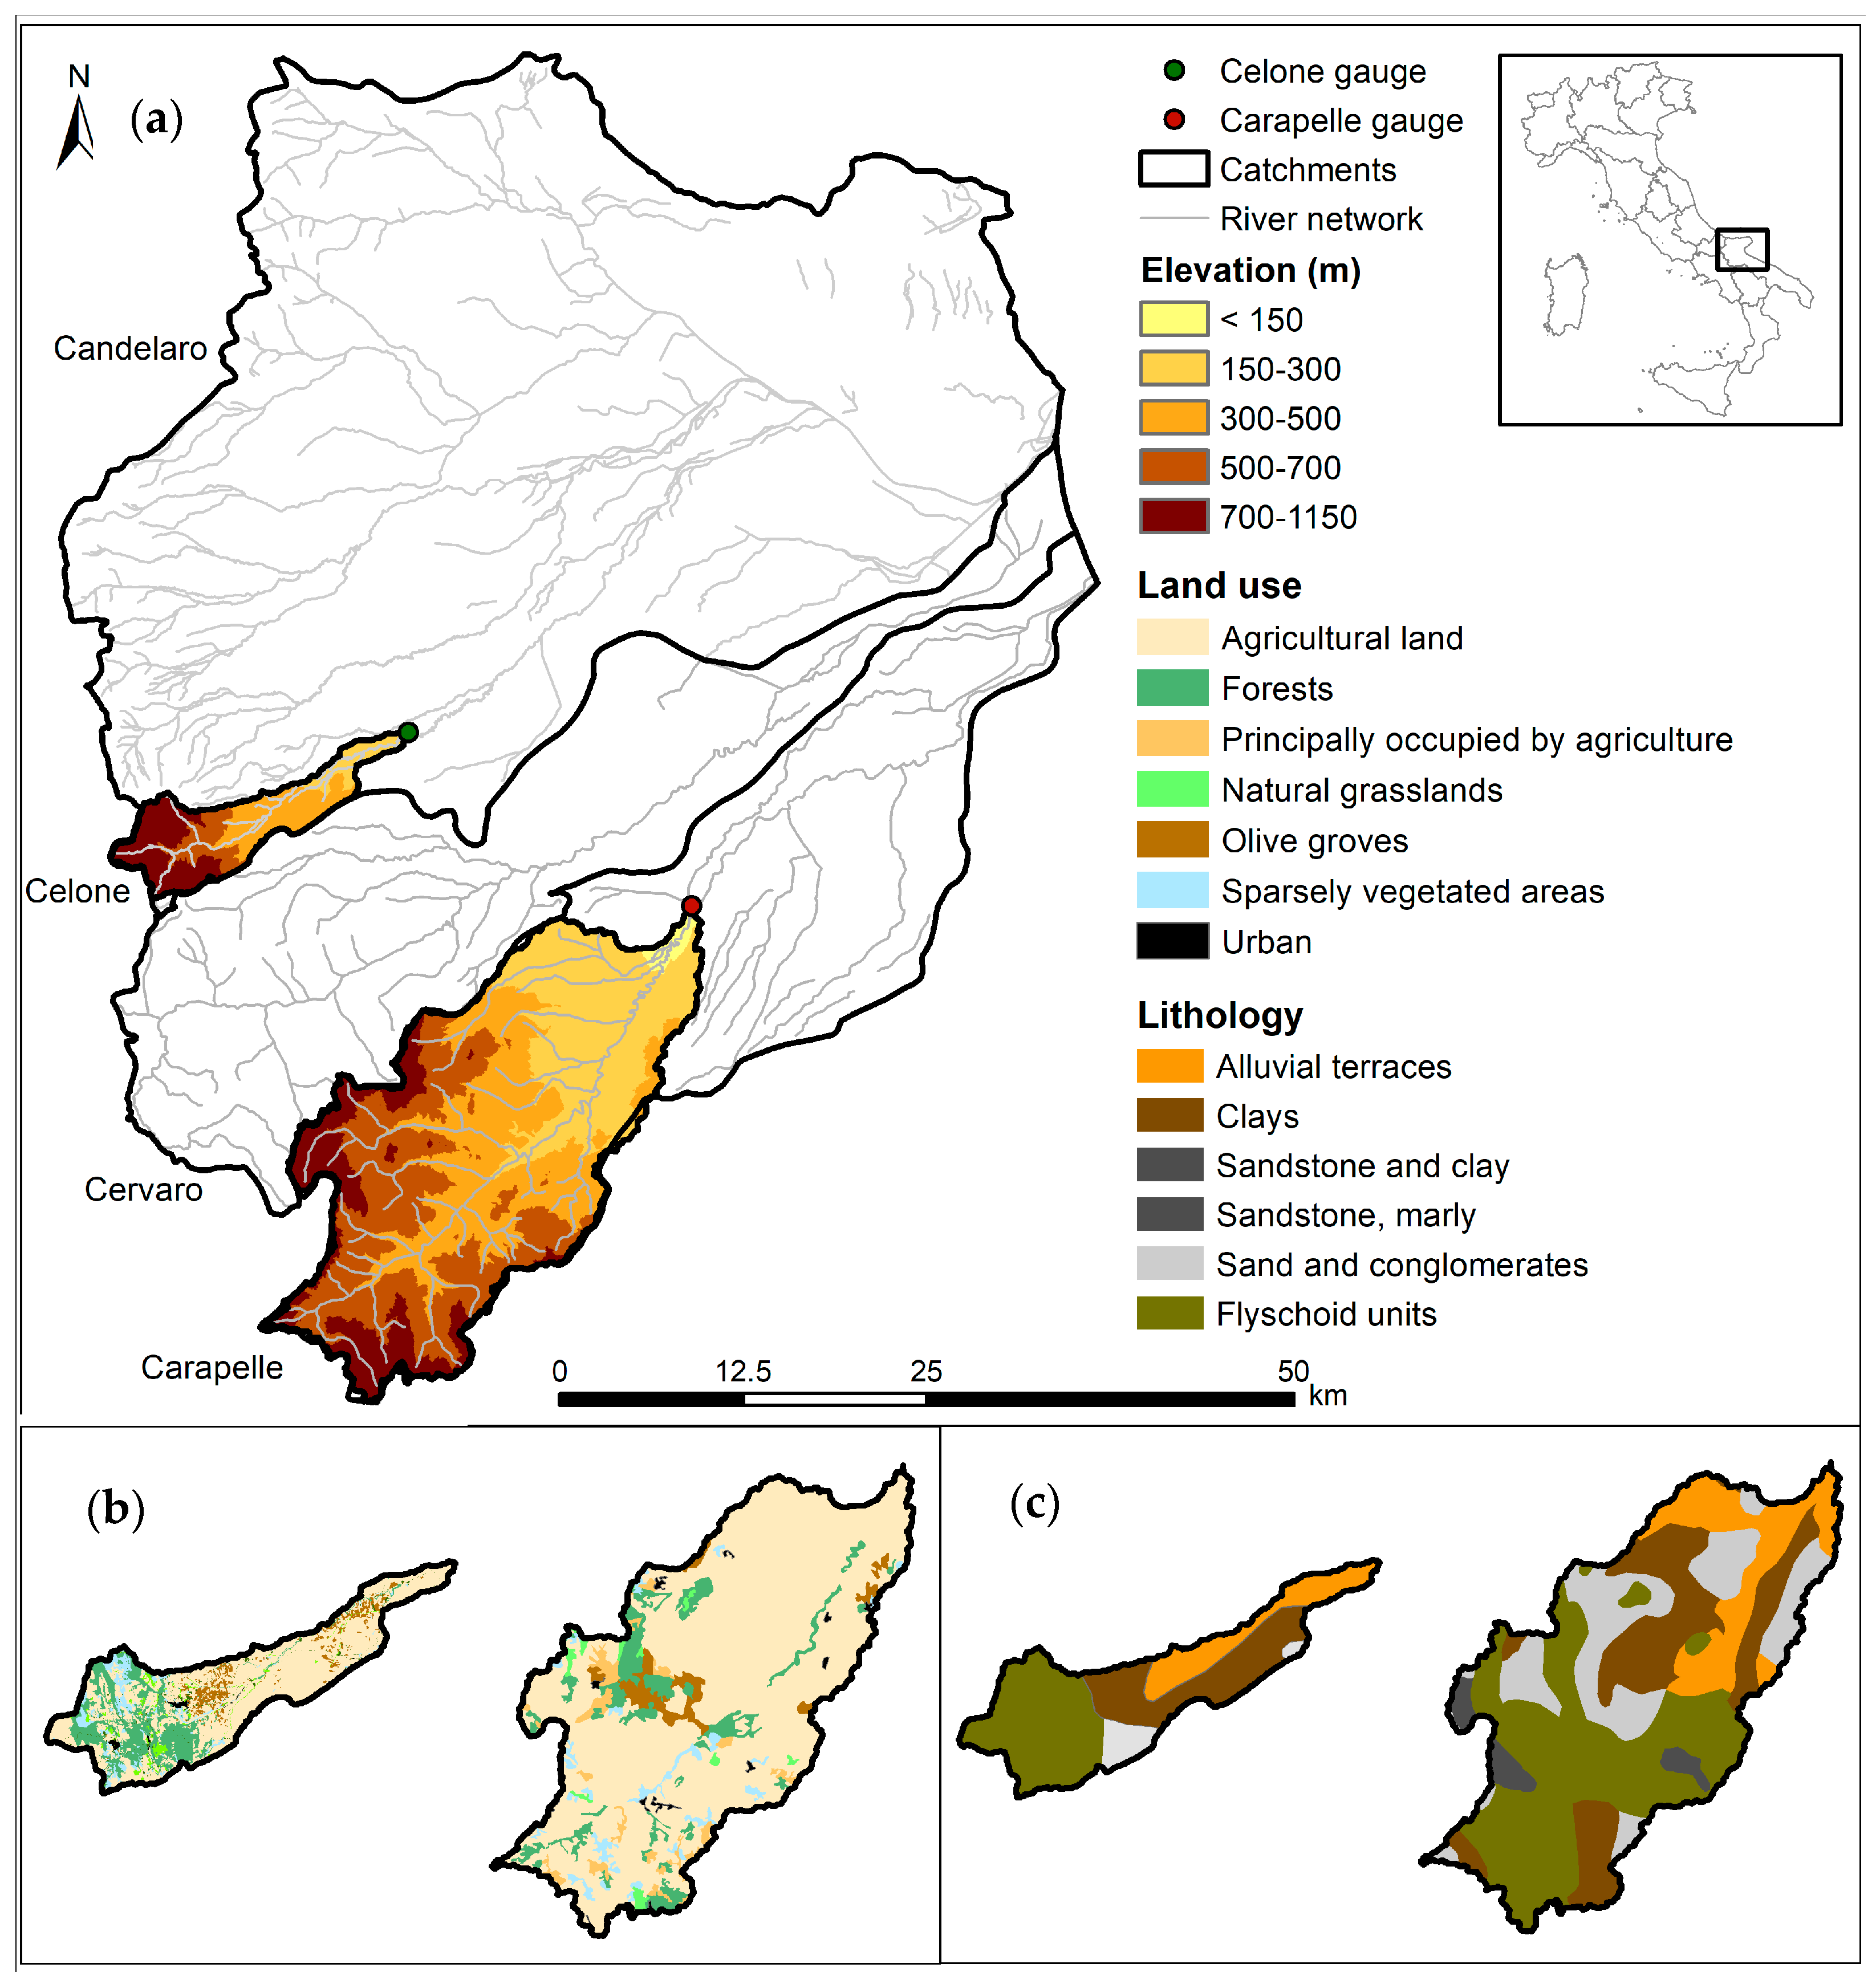
Figure 1. Study area: Celone catchment and Carapelle catchment (Apulia, Italy). (a) Elevation; (b) Land Use; and (c) Lithology. Green and red dots represent the position of the gauging stations of the Celone and of the Carapelle, respectively.
Water 15 02715 g001
Figure 2. Gauging station at the Ordona bridge (view from upstream), Carapelle river (Apulia Region, Italy). (a) View from upstream of the gauging station, (b) shelter tube and cage of data acquisition (from upstream), (c) data acquisition instruments, and (d) side view of the probe sheltered within the tube. The sensor is submerged at 20 cm.
Water 15 02715 g002
Figure 3. Gauging station and data acquisition system at the Celone M. Pirro, Celone river (Apulia Region, Italy). The red arrow shows the flow direction.
Water 15 02715 g003
Figure 4. Observed flow (Q), observed suspended sediment concentrations (SSC), and observed precipitation at the Carapelle Ordona bridge gauge. The year 2009 was not included in this study due to the lack of data caused by the maintenance of the gauging station.
Water 15 02715 g004
Figure 5. Observed flow (Q), observed suspended sediment concentrations (SSC), and observed precipitation at the Celone M. Pirro gauge. The period between the end of October and the beginning of November 2010 was not considered in this study due to a malfunctioning of the gauge station.
Water 15 02715 g005
Figure 6. Measured flow (Q) and observed suspended sediment concentrations (SSC) at the Celone M. Pirro gauge (a), and at the Carapelle Ordona bridge gauge (b).
Water 15 02715 g006
Figure 7. Flow duration curve (FDC) and measured suspended sediment concentration (SSC, red circles): (a) Celone M. Pirro gauge; (b) Carapelle Ordona bridge gauge. The X-axes and Y-axes are on a logarithmic scale.
Water 15 02715 g007
Figure 8. Sediment rating curves (SRC) developed at the Celone M. Pirro gauge. The Y-axes are on a logarithmic scale. Statistical significance: p-value < 0.01.
Water 15 02715 g008
Figure 9. Model fitting of sediment rating curves (SCR) for the Carapelle river. The Y-axes are on a logarithmic scale. Statistical significance: p-value < 0.01.
Water 15 02715 g009
Table 1. Duan’s Correction Factor (CF) computed for the classes of flow (Q) at the Celone gauge and Carapelle gauge. R1 is for the data stratification 0–5%, 5–70%, 70–100%; R2 is for the data stratification 0–10%, 10–70%, 70–100%; R3 is for the data stratification 0–20%, 20–70%, 70–100%.
Celone RiverCarapelle River
R1R2R3R1R2R3
High flow2.042.122.201.642.061.87
Normal flow4.693.623.131.411.251.16
Low flow1.241.241.241.041.041.04
Table 2. Percentage error, E (%), computed for the classes of flow (Q) at the Celone gauge and Carapelle gauge. R1 is for the data stratification 0–5%, 5–70%, 70–100%; R2 is for the data stratification 0–10%, 10–70%, 70–100%; R3 is for the data stratification 0–20%, 20–70%, 70–100%.
Celone RiverCarapelle River
R1R2R3R1R2R3
High flow19.1029.6135.5236.6459.9840.08
Normal flow98.94191.49126.3919.9815.5313.15
Low flow99.9799.9799.974.674.674.67
Table 3. Annual specific suspended sediment (SS) loads (t ha−1 yr−1) evaluated by applying three different data stratifications (R1; R2; and R3) and with the back-transformation correction (R1_CF; R2_CF; and R3_CF) at the Carapelle gauge and Celone gauge.
R1R1_CFR2R2_CFR3R3_CF
Carapelle
20070.8780.8810.8780.8800.8780.879
20081.4791.5421.4751.5431.4741.565
20107.4267.4377.4307.4527.4317.449
20113.4203.4393.4243.4593.4293.465
Celone
2010–20112.6106.0602.5505.7802.4005.200
Table 4. Average specific suspended (SS) sediment loads (t ha−1 yr−1) evaluated for high, normal, and low flow by using three different data stratification (R1; R2; and R3) and with the back-transformation correction (R1_CF; R2_CF; and R3_CF) at the Carapelle gauge and Celone gauge.
R1
(t ha−1 yr−1)
%R1_CF
(t ha−1 yr−1)
%R2
(t ha−1 yr−1)
%R2_CF
(t ha−1 yr−1)
%R3
(t ha−1 yr−1)
%R3_CF
(t ha−1 yr−1)
%
Carapelle
High Flow2.7483.22.7582.83.0091.03.0290.83.1495.23.1795.0
Normal Flow0.5416.50.5616.90.298.70.308.90.154.50.154.6
Low Flow0.010.40.010.40.010.40.010.40.010.40.010.4
Celone
High Flow2.2385.64.9181.12.2789.24.8383.52.2794.34.6288.8
Normal Flow0.3613.71.1218.50.2610.10.9316.10.264.90.5610.7
Low Flow0.020.70.020.40.020.70.020.40.020.70.020.4
Disclaimer/Publisher’s Note: The statements, opinions and data contained in all publications are solely those of the individual author(s) and contributor(s) and not of MDPI and/or the editor(s). MDPI and/or the editor(s) disclaim responsibility for any injury to people or property resulting from any ideas, methods, instructions or products referred to in the content.