Article

Use of Logs Downed by Wildfires as Erosion Barriers to Encourage Forest Auto-Regeneration: A Case Study in Calabria, Italy

by
Giuseppe Bombino
1,*,
Giuseppe Barbaro
2,
Pedro Pérez-Cutillas
3,
Daniela D’Agostino
1,
Pietro Denisi
1,
Giandomenico Foti
2 and
Santo Marcello Zimbone
1
1
Agriculture Department, Mediterranea University of Reggio Calabria, 89122 Reggio Calabria, Italy
2
Department of Civil Engineering, Energy, Environment and Matherials, Mediterranea University of Reggio Calabria, 89122 Reggio Calabria, Italy
3
Department of Geography, University of Murcia, 3001 Murcia, Spain
*
Author to whom correspondence should be addressed.
Water 2023, 15(13), 2378; https://doi.org/10.3390/w15132378
Submission received: 5 June 2023 / Revised: 23 June 2023 / Accepted: 25 June 2023 / Published: 27 June 2023
(This article belongs to the Special Issue Soil Erosion Measurement Techniques and Field Experiments)

Abstract

:
The easy implementation of ecologically-sound remediation measures for the prompt stabilisation of burned areas may be crucial in Mediterranean forest environments. Manual in situ contour redirection of burned felled logs could aid in soil erosion control and facilitate forest self-regeneration. In this study, a plot-scale runoff/sediment yield survey was conducted in Calabria, Italy, within a Mediterranean pine forest that was affected by an extreme wildfire spanning over 15,000 hectares in the summer of 2021. The hydrological response to 24 rainfall events was analysed after one year of monitoring using nine Wischmeier and Smith 20% sloping plots, which were distributed into three plot-blocks representing different conditions (forested, burned with randomly directed fallen logs, and burned with fallen logs manually redirected along contour lines). The post-fire condition (with felled logs in random positions) exhibited a consistent overall increase (approximately four times) in runoff and sediment yield compared to the pre-fire situation. This degradation effect was mitigated by approximately 30% through the manual redirection of burned logs, which promoted early (three to five weeks) vegetation regeneration (including tree emergence) and enhanced coverage as vegetation spread from the log positions. The results obtained so far provide encouraging insights and warrant further research on steeper slopes and complementary aspects (regulatory, biological, mechanical, economic, etc.).

1. Introduction

Mediterranean forest fires have a long history [1] and represent a relevant ecological factor [2]. Since the early 1960s, the expansion of the wildland–urban interface, rural depopulation, and the abandonment of land management practices have dramatically increased the frequency and extent of wildfires [3].
While wildfires are widely classified according to their intensity [4,5,6] and severity [7,8,9], the scientific literature shows a wide terminological variability in the definition of forest fires depending on the fire characterization criteria (e.g., fire size or burnt area distinguishing “large/mega/giga/tera-fires”, fire behaviour, fire resistance to control, descending socio-economic, environmental, or human impacts). However, the differentiation between “ordinary” and “extreme” wildfire events is easy and intuitive to perceive. Extreme events of high intensity and severity can certainly produce devastating effects on the forest ecosystem. Approximately 65,000 fires take place every year in the European region, burning an average of approximately half a million forested hectares. In the EU Mediterranean area, approximately 85% of wildfires affect approximately 300,000 to almost one million ha y−1, with an average burnt area of approximately 550,000 ha y−1 (data updated to 2021 [10,11,12]). Of these fires, 95% are of human origin, with arson accounting for 55.8% of cases. In the Mediterranean basin, extreme events are fortunately rare (less than 3%), but they are responsible for over 50% of the total burned area, as observed in Portugal, Spain, and Greece [13]. High-intensity and severity extreme wildfires have been relatively frequent [11] in recent decades and recur every two to three years. These extreme events often manifest as simultaneous fires that can affect large areas (more than 10,000 ha, as occurred in Italy in 2021), exhibiting extraordinary characteristics in terms of size and complexity, which usually escape human control operations.
In the European Mediterranean region, large areas have been reforested with monospecific tree species (e.g., conifers) that are more vulnerable to fire. The ongoing changes in socio-economic and climate scenarios [14] could favour the diffusion and magnitude of wildfires [15,16,17,18].
Among others, the worst consequences of high-intensity and severity wildfires are: (i) the loss of biodiversity [19,20,21,22], and (ii) the degradation of the physical–chemical properties of soil due to high heating effects [2]. Fire causes a decrease in soil porosity and an increase in bulk density due to prolonged and elevated temperatures. High-intensity fires also alter organic matter and produce ash, which forms a hydrophobic coating on the soil surface. This coating reduces soil moisture and infiltration capacity, increasing runoff propension and soil erodibility [2]. The chemical properties of the soil show changes in pH in the top soil horizons, an increase in electrolyte concentration, a decrease in cation exchange capacity and sodium adsorption ratio, and pronounced leaching of nutrients caused by precipitation. These factors result in a reduced infiltration rate, increased runoff, and soil erosion [2].
After a wildfire, the soil protection provided by forest cover is weakened [23,24,25]. The bare soil is exposed to the action of raindrop impact, leading to enhanced runoff and erosion processes [26,27,28,29,30]. In the Mediterranean area, summer wildfires can be followed by frequent and high-intensity rains [2]. Studies have measured runoff volume and sediment yield ranging from 1–4 orders of magnitude higher in burnt areas of several Mediterranean countries (e.g., [2,31,32,33,34,35,36,37]), both at the plot scale and to a lesser extent at the watershed level.
A high-intensity/severity fire can easily move upward, spreading through tree crowns (known as a crown fire), causing trees to fall either during the event or later (when weakened are felled by the weather). Trees felled by extreme fires may slide downstream, particularly on steep slopes. As they slide down, the logs can reach the hydrographic network, where they may (i) obstruct channel water sections, and (ii) compromise the hydraulic functionality of river works and infrastructure that interact with watercourses.
The need to restore the protective action of the forest is especially felt in the semi-arid Mediterranean area (e.g., in morphologically complex territories such as Calabria). In these regions, hydro-geomorphological, climatic, and anthropic factors accentuate erosive phenomena and hydrogeological instability [38].
Many techniques are available for the stabilisation of areas damaged by wildfires, commonly classified as “bioengineering techniques”. The objective of these techniques is to trigger the protective action of the vegetation cover after the adverse event. However, these techniques have a certain level of invasiveness. Among them, log erosion barriers (LEBs) show a lower ecological impact coupled with relative affordability. The use of logs (including logs fallen by wildfires), along contour lines as a post-fire measure to control erosion processes and trigger natural forest auto-regeneration capacity, has been widely investigated by several authors [2,13,39,40,41,42,43,44,45]. There are few (if any) experiences in Italy, especially in the South (which is characterised by a semi-arid Mediterranean climate).
The standard installation technique involves felling burned trees and laying them on the ground along the slope contour [44,46]. Each log is anchored in place and gaps between the log and the soil surface are filled with soil to create a storage basin on the upslope side of the log. This configuration obstructs overland flow and traps sediments. The LEBs are usually laid out in staggered tiers designed to eliminate long uninterrupted flows paths [44]. A number of experiences with LEBs have been conducted in Mediterranean environments, providing highly variable (though generally positive) results across a wide range of slopes tested (25–60%) [41,47,48,49,50]. The effectiveness of LEBs depends on climatic conditions, soil characteristics, forest type, and the timing of intervention. However, Raftoyannis and Spanos [49] reported a limited post-fire ecosystem recovery, specifically regarding the regeneration of Quercus coccifera, which is a notoriously non-pioneer species. The slope gradient seems to have a significant influence on the effectiveness of this measure, which tends to decrease above a 30% gradient [13,42,43,44]. Moreover, LEBs appear ineffective for rain events with larger return periods [44]. This reclamation measure emulates the philosophy of other more common and well-tested bioengineering techniques (e.g., brush barriers, live palsied, fascines, live branches, wattles/bundles, the use of logs as construction elements, etc.) [51]. However, these measures, which can be relatively labour-intensive and not always implemented manually, do not consider the utilization of landed burnt logs as an ecological tool.
In Italy, the current legislation on forest fires (Law n. 353/2000) prohibits, among other actions, “…reforestation and environmental engineering activities supported with public financial resources…” in areas affected by fire, except for areas with “documented hydrogeological instabilities …” (Art. 10 par. 1). The law’s main objective is to discourage any form of speculation on fire-damaged areas. It may be administratively difficult to quickly document hydrological instabilities (as the lawmaker suggests), especially potential instabilities linked to the disappearance of the forest’s protective action. Environmental engineering activities would require the installation of a worksite, which could further disturb the already fragile ecosystem due to mechanised operations (e.g., soil compaction, removal of new/young plants, etc.). Even the simple removal of collapsed logs (e.g., skidding) is very expensive [52] (approximately up to 15–20 € m−3, depending on local condition such a slope steepness and a 28–40 cm log diameter), and it can have significant impacts [53]. On the other hand, fallen logs can play an important ecological role as they degrade and add organic matter to the soil [54].
A feasible mitigation action that complies with the different constraints is the in situ use of collapsed burned logs, which are manually redirected along the contour lines. This elementary operation (i) appears to comply with the law, (ii) requires minimal workforce and is cost-effective, (iii) can be implemented quickly (a few weeks after the fire), (iv) is ecologically sustainable, and (v) can contribute to slope stabilization and ecosystem auto-regeneration. The implementation of this measure could also facilitate the prompt registration of forest fires, as required by the law but only in partially enforced. In this context, the aim of this work is to evaluate, the effectiveness of the in situ use of collapsed burned logs redirected along the contour lines to control erosive phenomena (in terms of runoff volume and sediment yield) and trigger a stabilisation effect that supports ecosystem auto-regeneration through a case study in Calabria, Italy.

2. Materials and Methods

2.1. Description of the Extreme Fire Events in Summer 2021 in Aspromonte Massif, Southern Calabria, Italy

In the summer of 2021, Italy, particularly the southern part of the country, was affected by extreme wildfires in terms of intensity and severity [13]. In the southernmost part of the Calabria region (Aspromonte massif), 14,840 ha were burned, with 5600 ha located within the Aspromonte National Park (data measured through ground surveys and satellite imagery, Copernicus Emergency Management Service). These wildfires resulted in the loss of two lives, several hundred livestock, and ruinous damage to many buildings and farms. The extraordinary wildfires, some of which started simultaneously, affected even the most remote areas of the Aspromonte Massif, including the centuries-old beech forest (known as “Valle infernale”, a UNESCO World Heritage and site) and the pine forest (known as “Acatti” and “Afreni” woods, which are old-growth forests of more than 500 years old). Among the most affected areas by that wildfire was Roccaforte del Greco, a mountain village within the well-known “Greek island” within the Aspromonte National Park. Within a few days (approximately ten), a high-intensity/severity crown-fire destroyed hundreds of hectares of forest (mostly pine reforestations from the 1950s), resulting in the felling of thousands of trees (Scheme 1). This provided the occasion to implement the experimental monitoring site and campaign described herein.

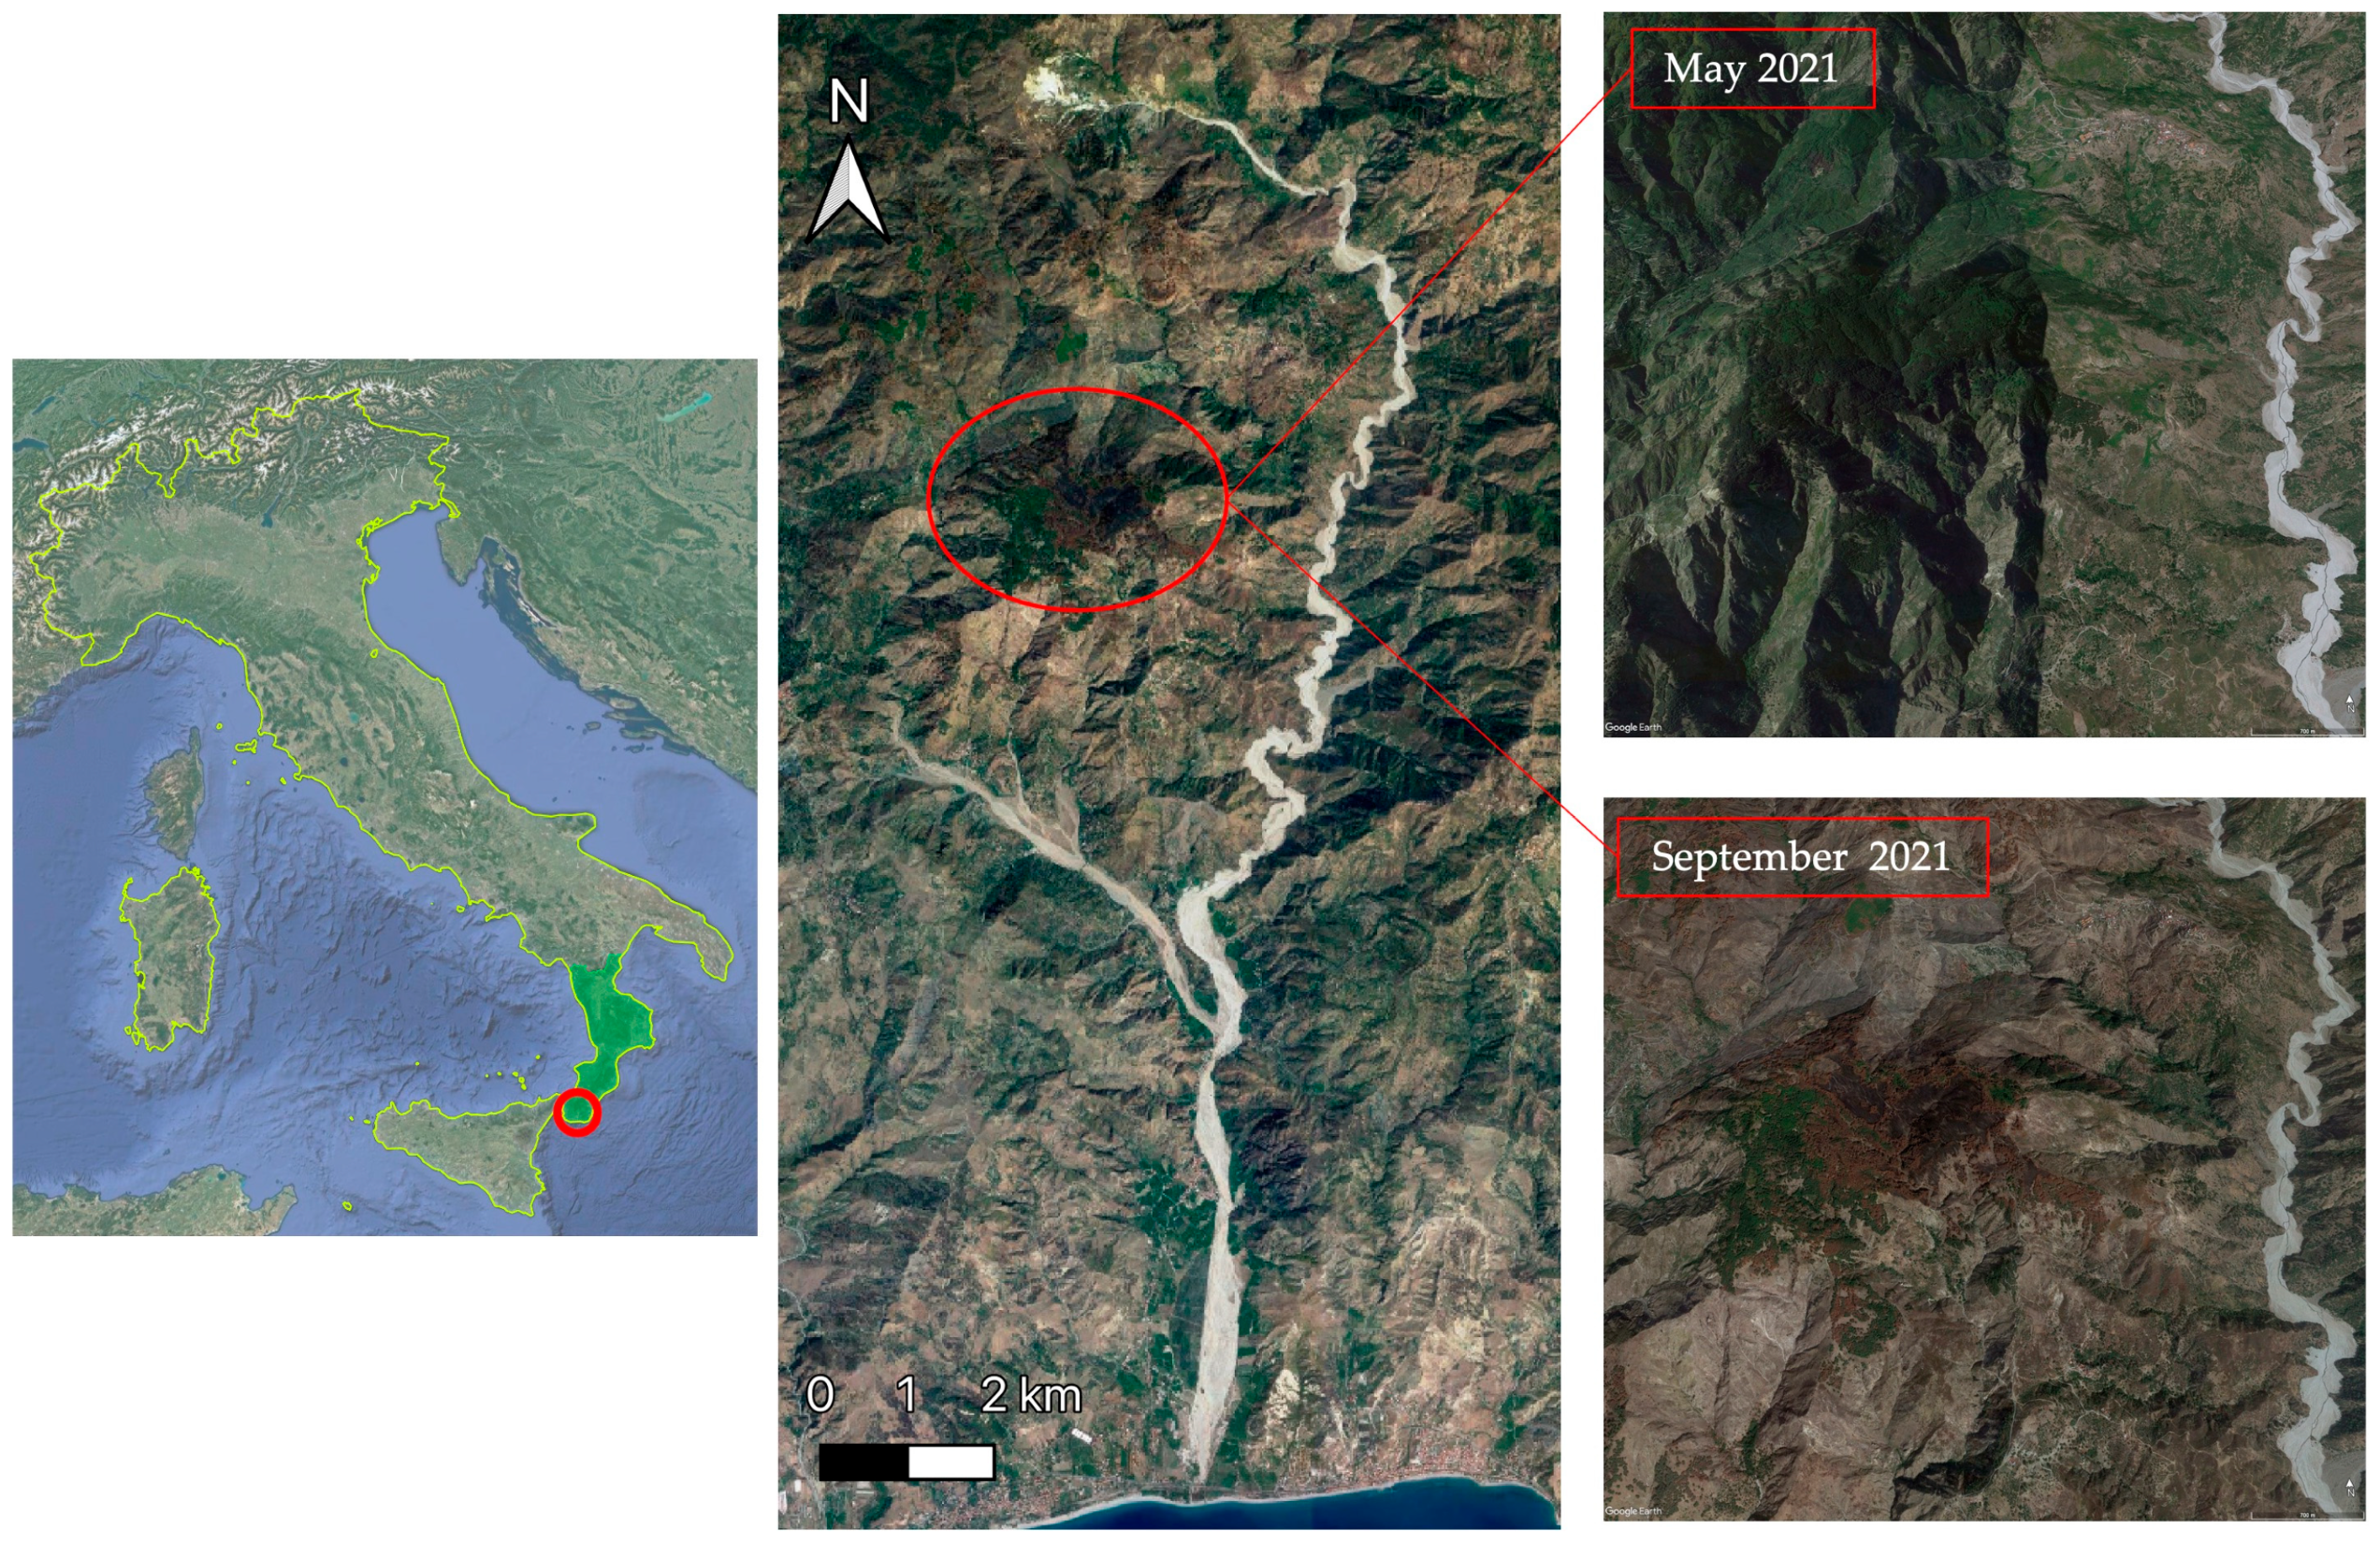
2.2. Study Area Description

The study area is located in the southernmost part of the Calabria (Southern Italy, Figure 1), specifically within the mountain municipality of Roccaforte del Greco (Aspromonte, Metropolitan area of Reggio Calabria, Figure 1). It is located at the headwaters of the fiumara Amendolea watershed (150.4 km2), with an average hillslope gradient of 97.2%. The hydro-geomorphological, ecological, and climatic conditions in this region are typical of Southern Italy [55]. The headwater areas consist of igneous and metamorphic rocks, with sequences of grey and black biotite schist [56,57]. High-magnitude erosion processes are common after heavy storms, and large amounts of coarse material are transported to the valley reach of the fiumara Amendolea, which has a large riverbed (up to 1 km) [55]. These hydro-geomorphological activities result in significant land instability and vulnerability, which are subject to specific regulatory hydro-geological restrictions that cover a large part of the Aspromonte Massif. The environment is characterised by dense Mediterranean scrub and forests with a wide variety of trees, both deciduous and evergreen. Coniferous reforestation projects have been implemented since the middle of the last century to control erosion phenomena. In the experimental area, the vegetation cover mainly consists of Pinus subsp. Afforestation, with Pinus radiata, an exotic species from the west coast of North America, being the dominant species. This species was imported to address the shortage of native conifers [58]. No specimens survived to the wildfires that occurred in 2021. The climate and forest characteristics of the study area are reported in Table 1.

2.3. Experimental Scheme

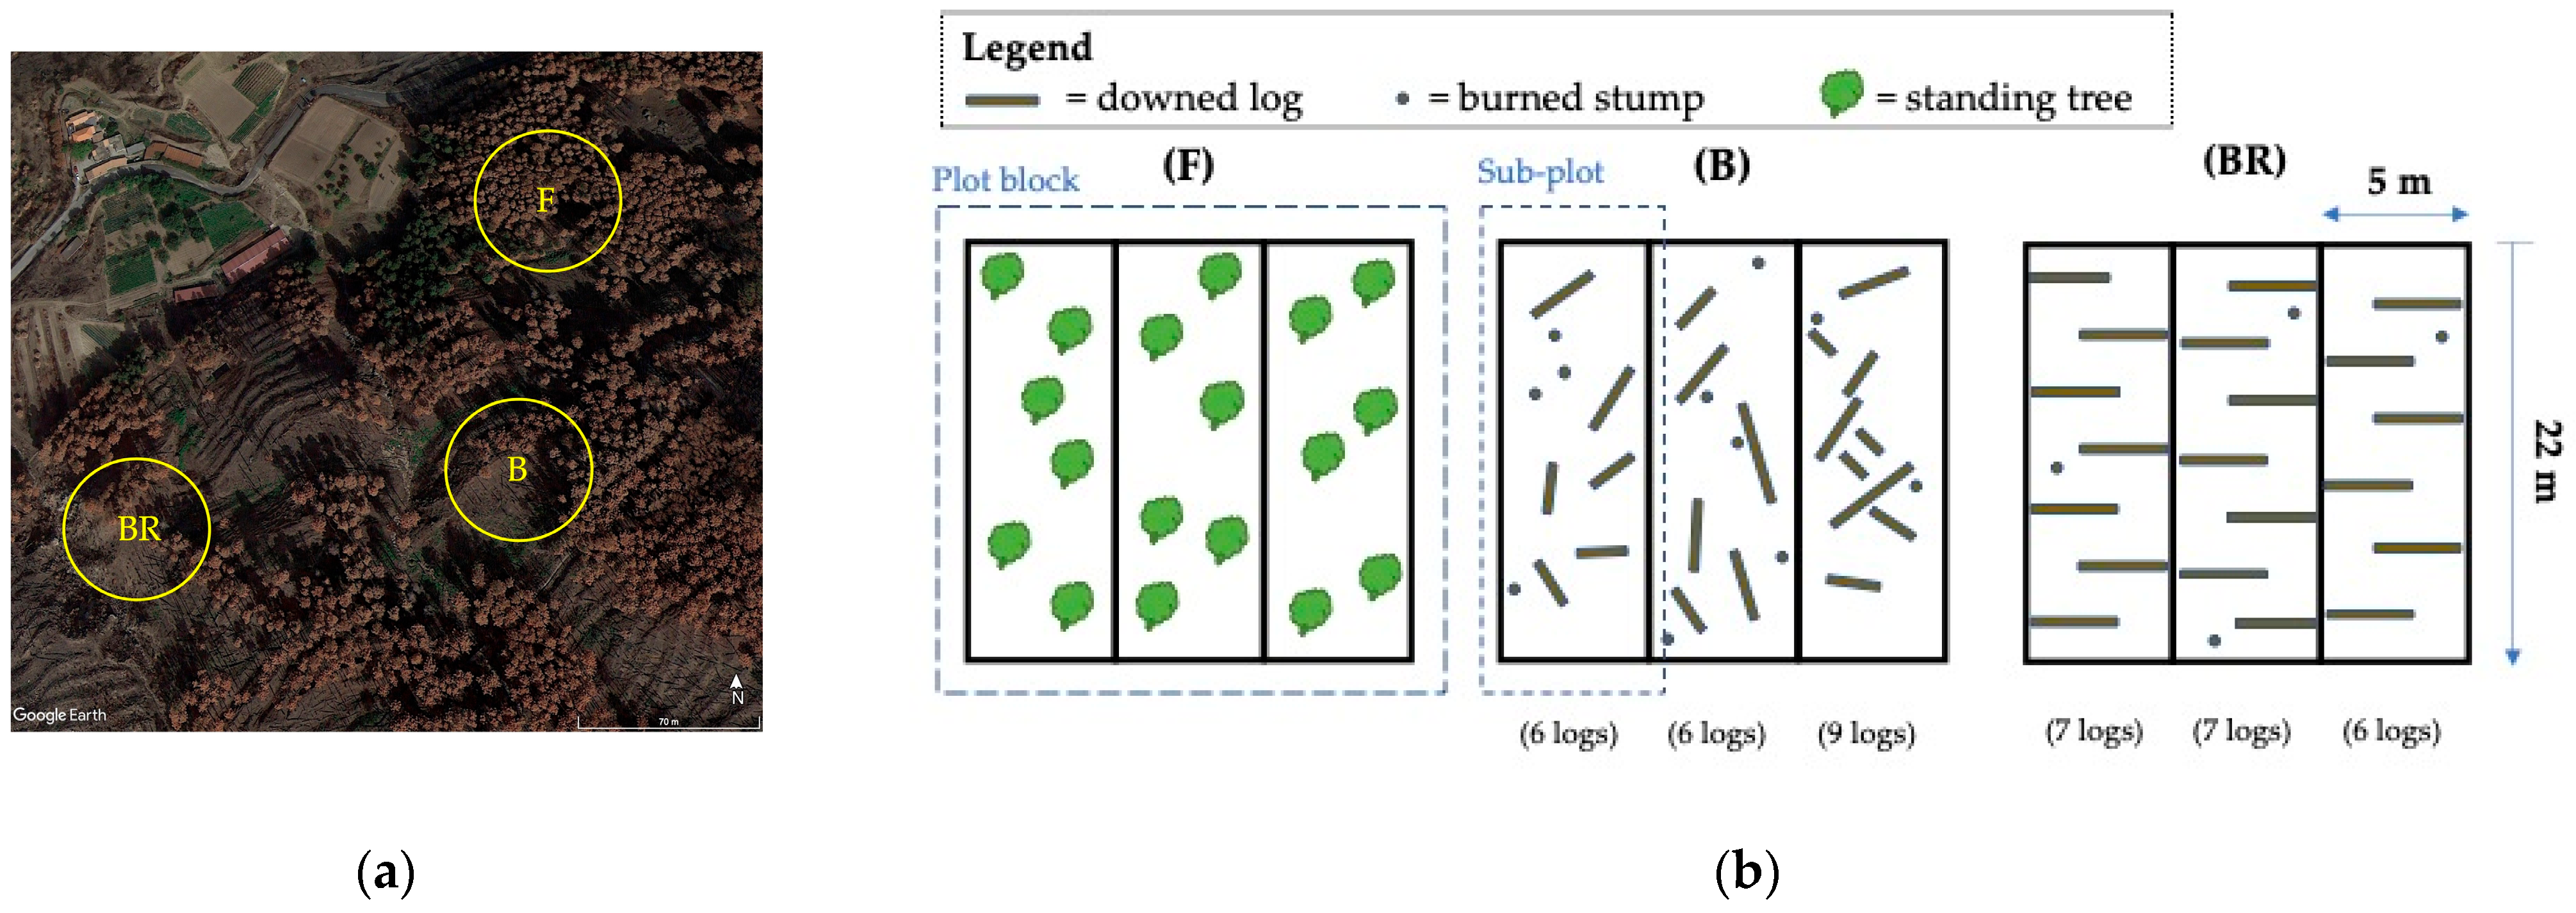
Three plot-blocks (up to 120 m apart) were established in the north-facing study area in September 2021, with a down slope of 20% ± 2% (Figure 2a). Each plot-block represented a specific condition as follows (Figure 2b):
  • “Forested” (F): representative of the pre-fire condition;
  • “Burned” (B): casually directed downed logs, representative of the post-fire asset;
  • “Burned and rearranged” (BR): contour-redirected downed logs, resembling log erosion barriers.
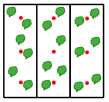
Each plot-block was further divided into three 22 × 5 m sub-plots of the Wischmeier and Smith type (Figure 2b). These sub-plots were hydraulically isolated using aluminium foil embedded into the soil to a depth of 20 cm.
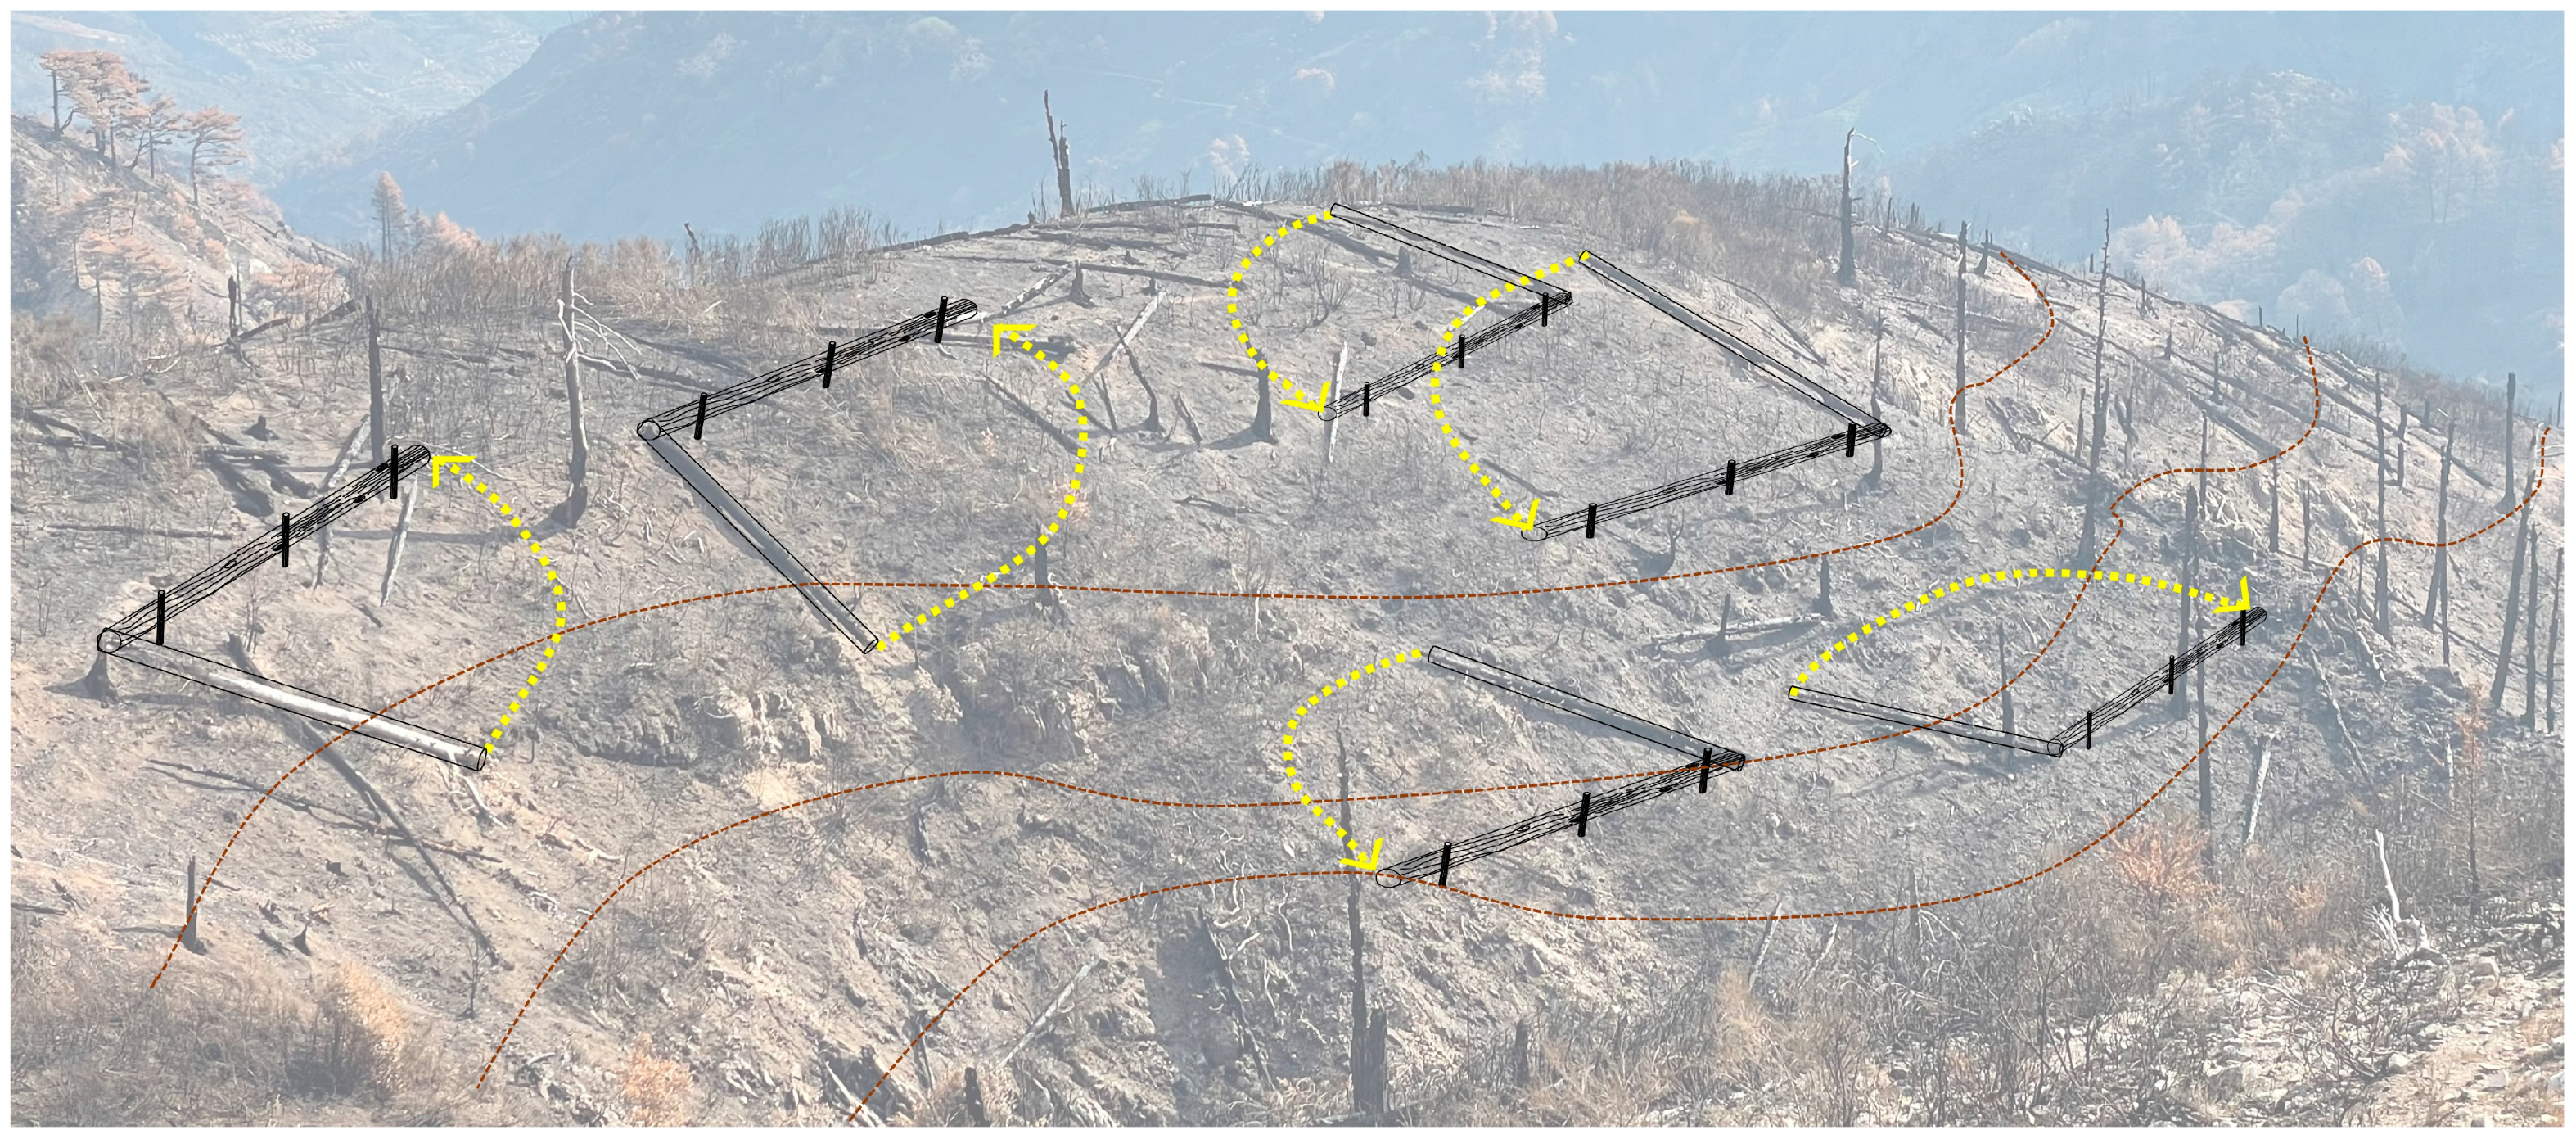
In the B sub-plots, there were casually directed downed logs, with lengths ranging between 1.5 and 4 m. Two cases had 6 logs, while one case had 9 logs (Figure 2b). In the BR plot-block, the downed logs were manually redirected (by a local rotation) along the contour lines within each sub-plot (Figure 3). The number of downed logs redirected within the BR sub-plots was 7 in 2 cases and 6 in one case. The logs, approximately 4 m long with an average diameter of 33 cm (ranging from 21 to 49 cm), were reallocated at an average downslope distance of 4 m, resulting in partial fragmentation of the slope path (Scheme 2a). The rotation and locking of the logs only required manual work and light equipment (hammer) to fix the wooden stakes (Scheme 2b,c). The ratio between the sub-plot area (110 m2) and the total length of the contour logs was within the range of 3.9–4.6 m.
The necessary manpower for the in situ manual redirection of the felled logs can be extrapolated at 4 days ha−1 for two operators.

2.4. Data Collection and Processing

The experimental campaign took place from September 2021 (approximately 1 month after the wildfire ended and before the first autumn rains) to September 2022, covering a period of 13 months.

2.4.1. Soil

Within the 5 cm of the topsoil, 27 soil samples (3 × 9 sub-plot) were collected, located at the top, middle, and bottom of the nine sub-plots along their median axis (Table 2).
Soil texture was measured using the hydrometer method with sodium hexametaphosphate as a dispersant [60] and classified using the USDA triangle method.
pH values were measured using a soil/water suspension ratio of 1/2.5 (w/v) with a glass electrode.
Electrical conductivity (EC) was determined in distilled water using a 1/5 residue/water suspension. The suspension was mechanically agitated at 15 rpm for 1 h to dissolve soluble salts, and EC was then measured using a Hanna conductivity meter.
Organic carbon (C) content was determined using the dichromate oxidation method according to Walkley and Black [61] and titration with iron sulphate (FeSO4, 0.2 N).
Total nitrogen (N) was measured using the method described by Kjeldahl [62].
Water infiltration rate (IR) was determined using an Eijkelkamp® portable rainfall simulator [63].
Soil water repellency (SWR) was estimated using the Water Drop Penetration Test (WDPT) method [64], conducted in the vicinity (approximately 0.25 m) of the IR measurement point. In this test, 15 drops of distilled water were released on the soil surface using a pipette. The time taken for the droplets to penetrate the soil was measured to estimate the WDPT.
Before measuring IR and SWR, the litter was removed, and the soil surface was lightly levelled.
Soil aggregate stability (AS) was determined using the rain simulator method (working with an intensity of 6 mm min−1). One sample per sub-plot was tested for the three size fractions (0.25–0.50, 0.5–1.0, 1.0–2.0 mm), following the method described by Roldán et al. [65] based on the method of Benito et al. [66].
According to the USDA Soil Texture Classification System, the analyzed soil falls into the sandy-loamy category (Table 2). It is acid, low in organic matter, and exhibits a high infiltration rate and a moderate aggregate stability.

2.4.2. Rainfall

Rainfall data were continuously recorded at the meteorological station located in Roccaforte del Greco (approximately 3 km away from the plot-blocks). In addition, cumulative rainfall depth was gauged within each plot-block. Due to logistical limitations (mountainous context, distance), it was generally not possible to collect runoff volume and sediment yield immediately after each rainfall event. Consequently, rainfall data were cumulated (except in one case) in 24 rainfall event groups.

2.4.3. Runoff

Runoff volume was measured on 24 occasions using a tank connected to a plastic gutter (with a 2% gradient towards the outlet) at the bottom of each sub-plot. The collected volume was then divided by the sub-plot area.

2.4.4. Sediment Yield

Sediment dry weight was measured by collecting sediment from the plastic gutter at the bottom of each sub-plot and sampling the sediment concentration in the stored runoff volume. Sediments in the plastic gutters were collected at the same frequency as the runoff volume. The wet sediment samples were weighed and dried in an oven at 105 °C for 24 h. Organic matter was removed from the samples using the LOI Method (at approximately 375 °C for 16 h [67]), and the dried samples were weighed. Sediment concentrations were collected by mixing the stored volume in the tank and taking three successive samples, totalling approximately 0.5 L. The dried sediment from the samples was weighed and related to the sample volume in order to evaluate the sediment concentration. The sediment concentration was multiplied by the runoff volume to estimate the dissolved sediment yield component. Finally, the sediment yield was obtained by adding to the amount of sediment deposited in the plastic gutter (averaging 10% ± 6 of the total).

2.4.5. Vegetation Cover

The vegetation cover in each B and BR sub-plot was monitored twice a month using the grid method [68] with a 0.75 × 0.75 m square. The abundance–dominance index of each species collected within the sub-plots was determined according to the Braun–Blanquet method [69]. In order to assess the effect on vegetation development, the degree of vegetation cover in plot-blocks B and BR was compared, and the relationships between vegetation cover, runoff volume, and sediment yield were investigated.

2.4.6. Statistical Analysis

The statistical analyses of runoff volume and sediment yield data were carried out using Jamovi v.2.3.21 (2022). A descriptive assessment was first carried out to determine whether the data set was normally distributed using the Shapiro–Wilk test. Based on this result, a correlation matrix was applied using Spearman’s correlation coefficient to determine the degree of relationship between the “runoff” and “sediment” measures with the “rainfall depth” and “rainfall intensity” factors.
In order to assess the differences between the variables recorded in the “runoff” and “sediment” data collection plots, a repeated measures ANOVA was applied using Friedman’s method (non-parametric). Pairwise comparisons were obtained using the Durbin–Conover test, which was employed to determine the differences between treatments in the analysed plots with a confidence interval of 95%.
Furthermore, the effects of rainfall depth and intensity on runoff volume and sediment yield were evaluated using a factorial analysis. A One-Way ANOVA following the Kruskal–Wallis test (non-parametric) was performed, with three categories used as grouping variables based on the following parameters: rainfall depth—first category: values between 0–35 mm, second category: values between 35–70 mm, third category: values greater than 70 mm; rainfall intensity—first category: values between 0–10 mm h−1, second category: values between 10–30 mm h−1, third category: values greater than 30 mm h−1. Pairwise comparisons of the categories were carried out using the Steel–Dwass–Critchlow–Fligner method, with a 95% confidence interval used to establish the thresholds of change in the effect of the variables analysed. Finally, the existence of statistical differences between the average values of the degree of vegetation cover in the two different burned plot-blocks (B and BR) was verified.

3. Results and Discussion

3.1. General View of Plot Hydrological Responses

The recorded rainfall data for the 13-months monitoring period are reported in Table A1 in Appendix A. There were a total of 88 rainy days, and the 24 rainfall event groups ranged in depth from 14 mm (April 2022) to 249.4 mm (October 2021). The maximum 5-min intensity varied from 2.2 mm h−1 (April 2022) to 35.4 mm h−1 (August 2022). The consequent total annual rainfall sum (10 September 2021 to August 2022) was 1278.6 mm, which was significantly above the mean historical annual depth. This higher value was within the range of variability observed in the historical series (variation coefficient of 29%). The cumulative rainfall measured within the plot-blocks was systematically lower, likely due to lower altitude (with respect to the main meteorological station) and the location of the rain gauges at the base of the slope. Except for plot-block F, which experienced expected canopy interference, the average rainfall deficit compared to the Roccaforte del Greco station was 3.09% and 2.92% for B and BR, respectively. Since there were no statistical differences between the rainfall values recorded at the meteorological station (Roccaforte del Greco) and those collected in the plot-blocks (except for F), the subsequent analysis of the plot’s hydrological response was based on the Roccaforte del Greco data set, which also provided maximum intensity data. The summary values of runoff volumes and sediment yields measured for each event group are reported in Table 3.
Two particularly severe events occurred during the observation period (Table A1):
  • Event no. 7, which occurred in November 2021, had a cumulative rainfall depth of 249.4 mm and a maximum 5-min rainfall intensity of 30.6 mm h−1. This event occurred over the plots that were only partially covered by vegetation, producing the highest values of runoff volume (15.77 mm) and sediment yield (2076.25 g) from plot-block B.
  • Event no. 23, which occurred in August 2022 (105.4 mm, 35.4 mm h−1), generated a runoff volume of 7.03 mm and a sediment yield of 403.65 g (plot-block B).
Nevertheless, the absolute highest sediment value (2.434 kg corresponding to 0.022 kg m−2, plot B) was recorded after event no. 1, despite its relatively moderate characteristics (36.4 mm, 18.0 mm h−1). This event occurred immediately after the wildfire when the ground was completely bare. For the same events, slightly lower values of runoff volume and sediment yield (33% ± 12% and 76% ± 80% on average, respectively) were observed in plot-block BR.
The correlation analysis conducted between rainfall and runoff/sediment data showed statistically significant relationships in every sub-plot (Table 4). The Spearman’s correlation coefficient indicated that the highest values for runoff were observed between rainfall depth and intensity. Regarding the sediment data, the correlation was stronger with intensity data compared to rainfall depth.
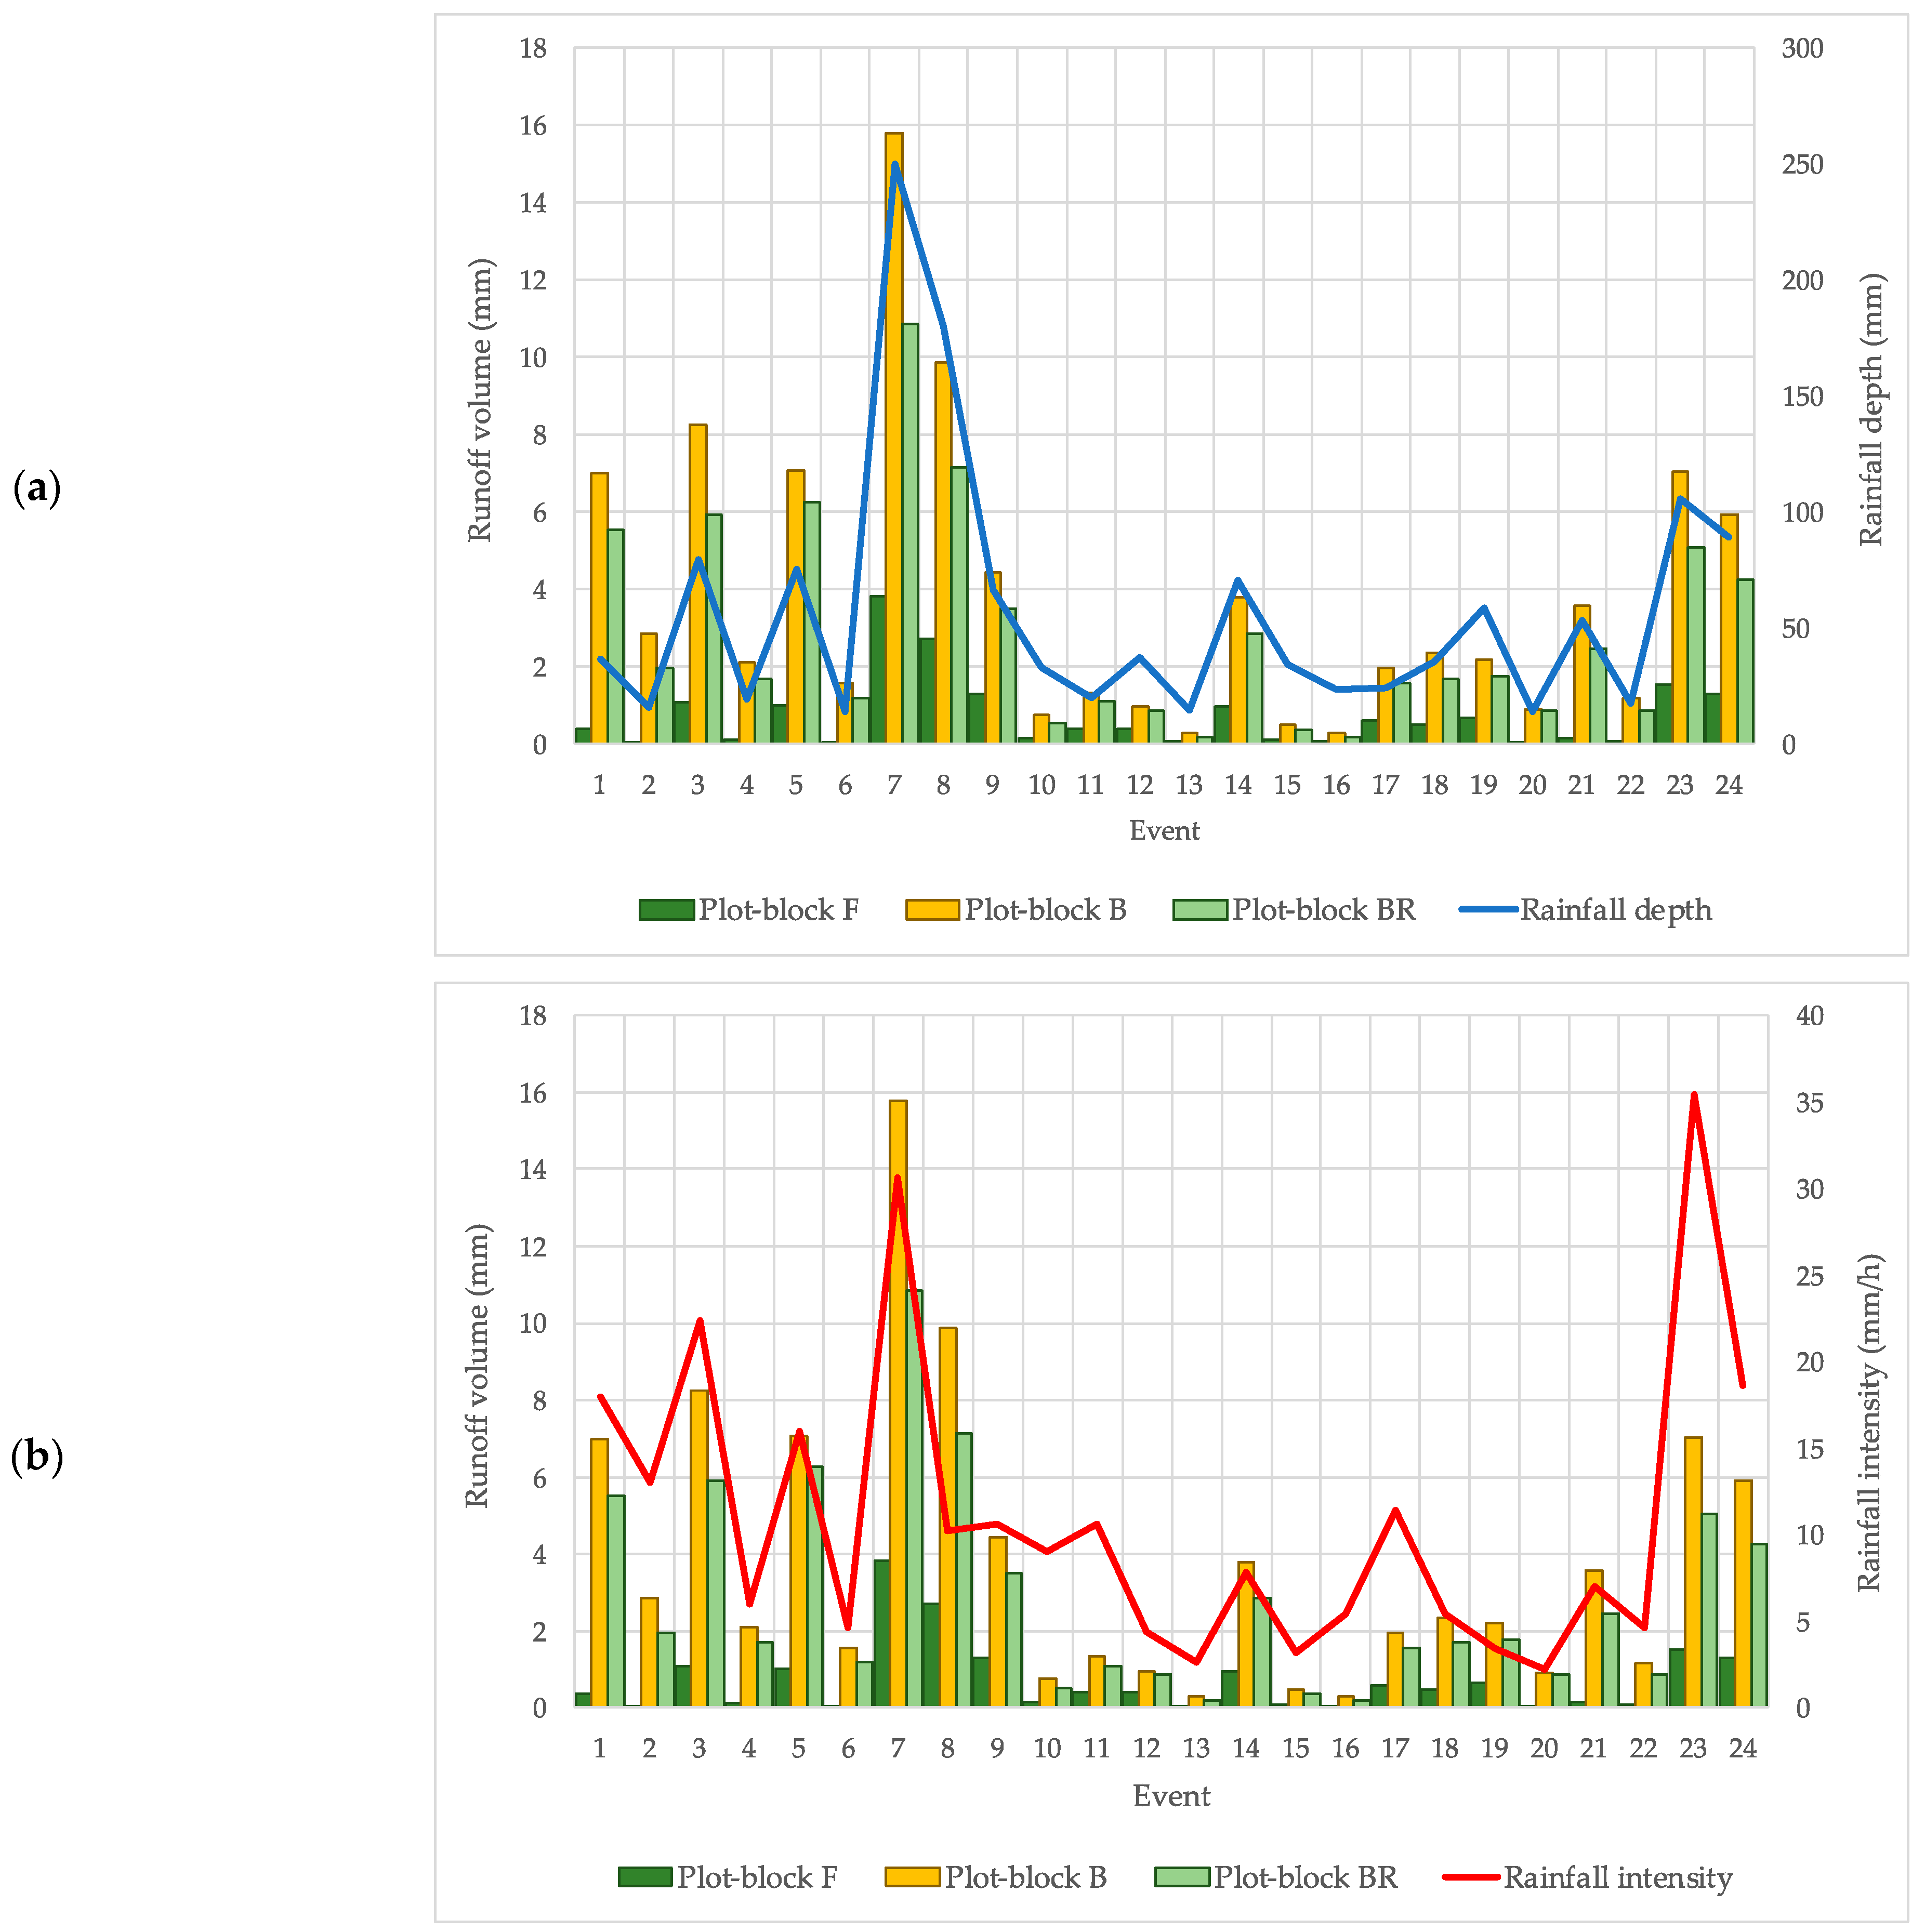
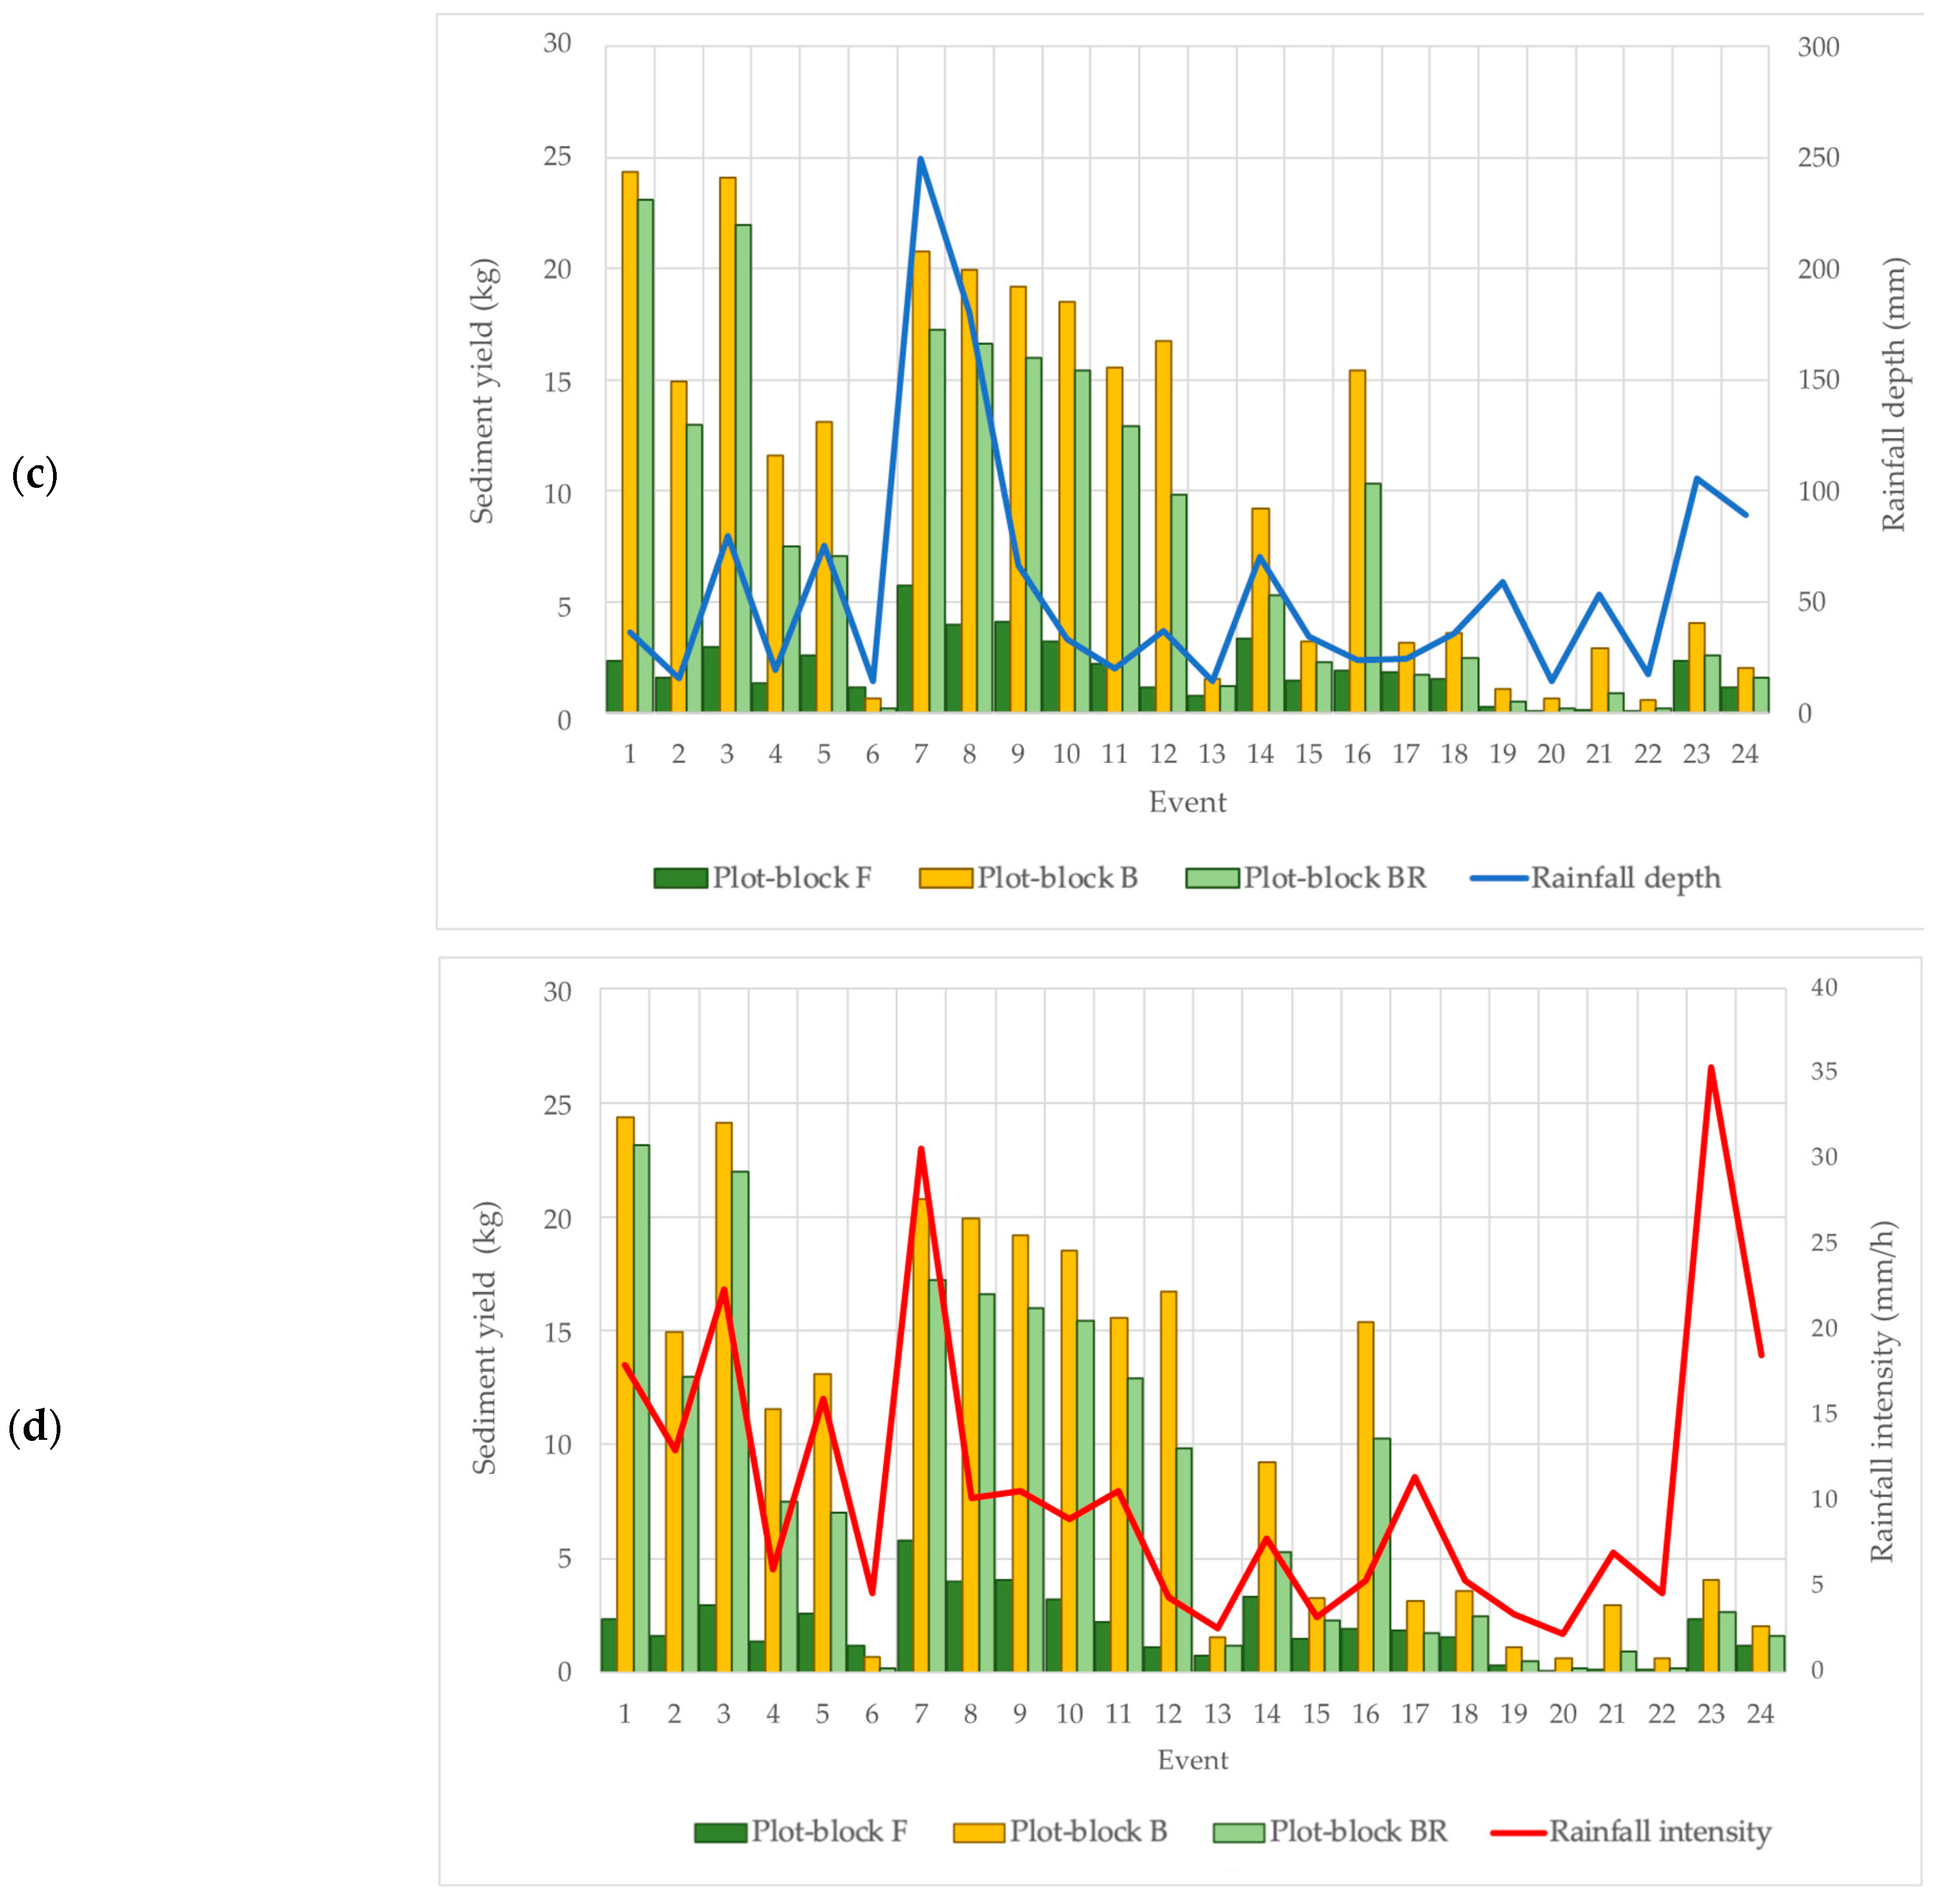
A direct relationship between runoff and rainfall volumes was observed (Figure 4a). In contrast, sediment yield was more closely associated with rainfall intensity (Figure 4d), although no cohesive trend was observed. The recorded data showed an increase in runoff volume and sediment yield depending on the loss of forest vegetation coverage. This effect was somewhat mitigated by the redirection of burned logs in plot-block BR. The decreasing distribution of sediment yield, regardless of the rainfall or intensity patterns reported in the rainfall events, suggests the possibility of studying how the presence of additional factors may explain the evolution of erosion processes.

3.2. Relations between Vegetation Cover Evolution, Runoff, and Sediment Yield after Wildfire

The analysis of the values shown in Figure 4 (Table A1) highlights that the runoff volume and sediment yield were always lower in the BR plots compared to the B plots, with an average (n = 24) reduction of approximately 30% (standard deviation of 80%, which includes events with differences ranging from 5% in event 1 to values greater than 200% in events 6, 20, 22, 23) and 29% (±14%), respectively. However, the minor differences occured in the first three events. The first rains immediately after the wildfire encountered soil without vegetation and covered by a blanket of ash (Table 2), leading to a drastic reduction in soil infiltration [70]. In the first three events, the hydrological response of the BR and B plots appeared high, even though the rainfall characteristics (rainfall depth and intensity) were not particularly severe. A significant reduction in runoff and sediment yield in the BR plots was recorded from the fourth rainfall event. On the other hand, the absence of tree cover resulted in accentuated insolation; this encouraged the entry and development of wild vegetation (mainly bracken and bramble), which tends to cover the plots within a short time. Monitoring (twice a month) of the ground cover exerted by spontaneous vegetation showed consistently higher values (35% on average; n = 48) in the BR plots [71]. The combined effect of redirected logs and vegetation became evident from the 13th event onwards, with a drastic decrease in runoff volume and sediment yield even during the heaviest rainfall events (for example, see events 17, 19, 23, and 24 in Figure A1).
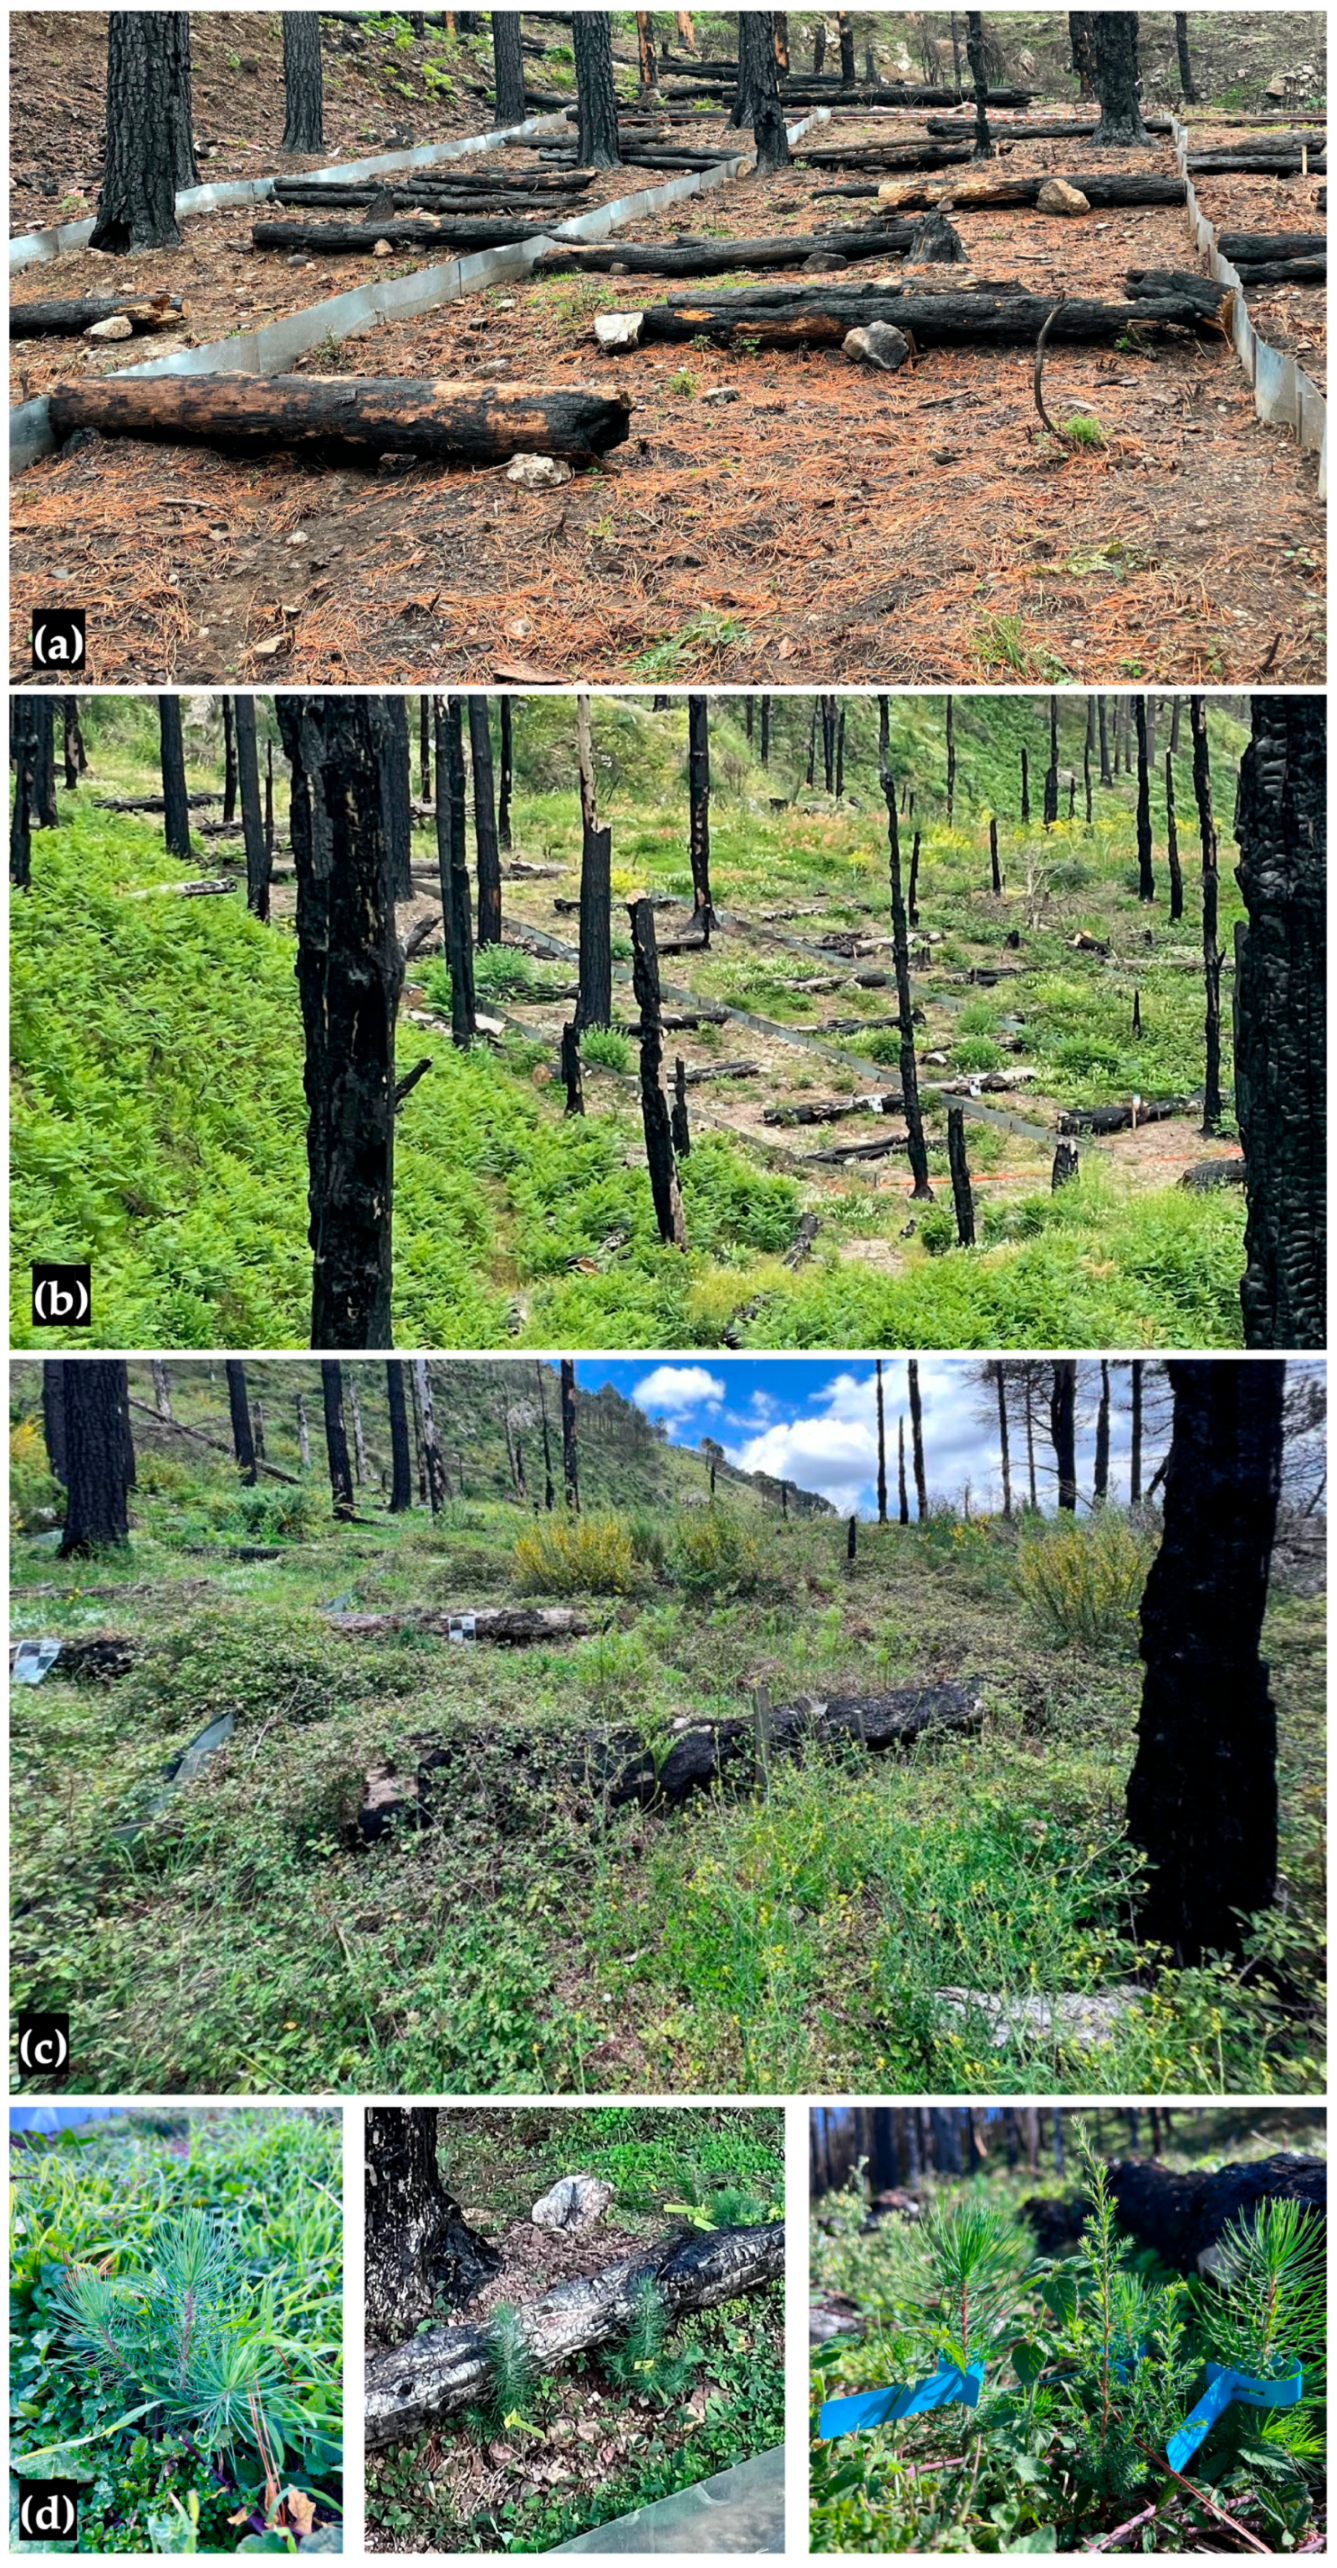
The mean values (n = 3) of vegetation cover were consistently higher in the BR plots, where the vegetation settled and established itself immediately upstream of the logs (Scheme 3b). From there, it gradually spread, occupying larger areas until it uniformly covered the entire plot (Scheme 3c). This phenomenon (although less pronounced) was also observed in the B plots.
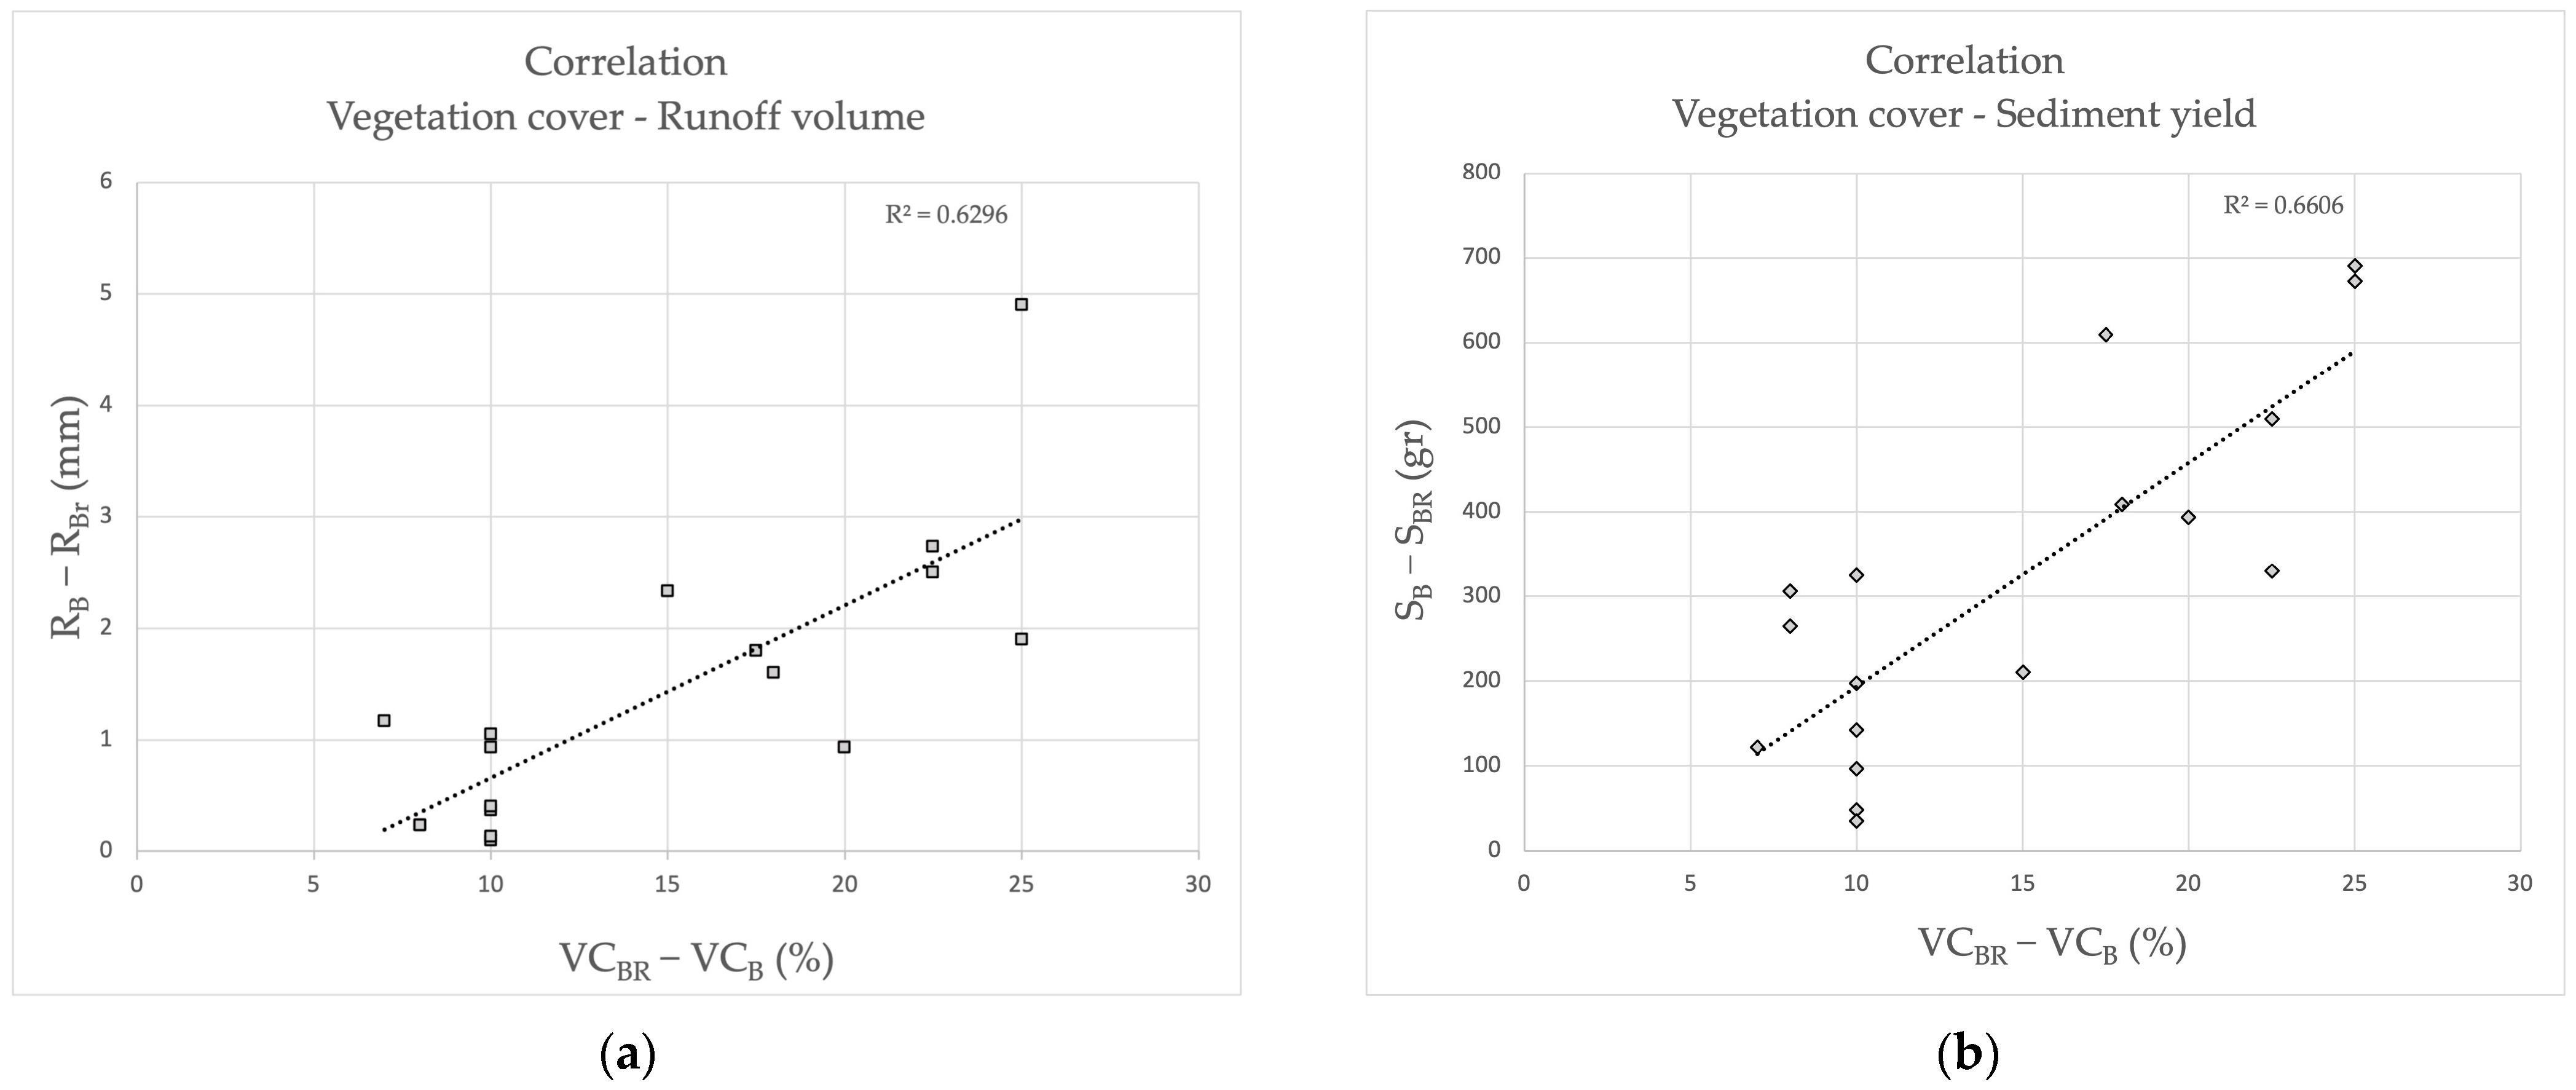
The positive effects of the vegetation were quantified by correlating the differences in vegetation cover (VCBR − VCB) with those of runoff volume (RB − RBR) and sediment yield (SB − SBR) for each rainfall event group. The analysis showed that the increased stage of vegetation cover in the BR plots contributed to the reduction in both runoff volume (R2 = 0.63) and sediment yield (R2 = 0.66) (Figure 5).
This observation highlights the positive control action of the redirected contour logs, which stabilize the slope and promote the rapid colonization of herbaceous vegetation (Rubus ulmifolius L., Pteridium aquilinum L., Cytisus villosus L., Lolium sp. pl., Hypochaeris achyrophorus L., Hypochaeris laevigata L., Geranium robertianum L., and Myosotis arvensis L., as indicated by their abundance–dominance value). This vegetation quickly protects the soil after the fire. This propitious action creates favourable conditions for the auto-regeneration of the wood, as demonstrated by the presence of young pine seedlings (Scheme 3d).
This result can be explained by the partial “breaking effect” of the slope length due to the contour-directed logs. The presence of contour logs, which fragment the slope path, limits the runoff velocity (which also encourages infiltration and runoff volume control) and reduces the detach/transport capacity of sediments. These effects arise as the result of complex interacting processes and representative relationships [72,73]. This effect is influenced by the incomplete logging of the transversal section, which results in the presence of zig-zag overland flow between logs, log overflow, underpass, and local sediment trapping. The effect is partially appreciable in the case of casually directed burned logs (B plot-block) and may be somewhat linked to the extent of their geometric contour projection (maximized in the case of contour-directed logs).

3.3. Comparative Analysis of Runoff and Sediment Yields

The results obtained from the repeated measures ANOVA revealed evidence of differences among all plots in terms of hydrological aspects. Pairwise comparisons showed significant differences between plots F vs. B, F vs. BR, and B vs. BR, which indicates a high variability in the runoff results. The analysis of the effect of rainfall depth and intensity provided by the one-way ANOVA showed significant differences in all plots, highlighting a greater effect of rainfall (Table 5).
Furthermore, differences in runoff volume were observed among plots across all ranges of rainfall, highlighting the strong correlation between runoff and rainfall volume (Table 6). On the other hand, rainfall intensity only provided differences in all plots within the 0–10 mm h−1 range. Beyond that range, the runoff data recorded in plots B and BR dd not show significant differences, except for plot F at rainfall intensities above 30 mm h−1. This finding can be explained by the interception effect of the canopy cover as well as by the wetting processes of the vegetation, which can store significant volumes of rainfall. The decrease in runoff occurs at low rainfall intensities, whereas lower vegetation coverage at higher rainfall intensities decreases the water retention effect [74].
Compared to the F plot-block, the B plot-block shows an average increase in sediment equal to an order of magnitude (about five times higher). In comparison to the B plot-block, the BR plot-block demonstrated a control effect of approximately 20% (Table 3). This distinction is evident from the average plot-block sediment yield of 0.196 kg (corresponding to 0.002 kg m−2 and to 0.40 ton ha−1 y−1 in the F plot-block), 0.791 kg (0.007 kg m−2; 2.07 ton ha−1 y−1 in the B plot-block) and 1.028 kg (0.009 kg m−2; 1.59 ton ha−1 y−1 in the BR plot-block). Similar sediment yields to those produced by the F plot-block were found in Spain, Israel, and Italy by other authors [33,37,75,76,77,78] under similar climatic conditions.
In order to analyse the aspects related to soil erosion, a repeated measures ANOVA was used to determine the variances among the plots under study. The results showed the existence of significant differences between all three cases, as confirmed by Durbin–Conover pairwise comparisons. To establish the effect of rainfall depth and intensity on each plot, a more detailed study was carried out by applying a one-way ANOVA based on the Kruskal–Wallis test. The results showed that the effect of rainfall was not involved in plots B and BR, whereas rainfall intensity was a determining factor (Table 7).
The factorial analysis results made it possible to determine the thresholds at which soil loss was affected, in which changes were only observed for plot F when rainfall increased considerably (pairwise comparison of Category 1 vs. Category 3). The effect of intensity on sediment production was higher, revealing significant differences between categories 1 and 2 in all three analysed plots (p values: 0.033, 0.047, and 0.027 for plots F, B, and BR, respectively). However, for the rest of the pairwise comparisons, there were no differences (Table 8). Therefore, rainfall intensities below 10 mm h−1 determined differences in sediment yield depending on the rainfall events. However, higher rainfall intensity resulted in erosion processes to varying degrees in every plot due to the rise in kinetic energy of raindrops [79].

4. Conclusions

The results of the plot-scale experimental investigation conducted after the extreme wildfires in August 2021 in Calabria, Italy, generally support the effectiveness of the in situ contour re-direction of felled burned logs, inspired by log erosion barriers, in terms of runoff and sediment yield control. This approach shows promise as a means of promptly stabilizing topsoil and triggering forest auto-regeneration.
The reference forest asset (F) with Pinus radiata shows a runoff volume and sediment yield conservative control under natural rainfall (about 1300 mm in one year from 24 event groups of 14 to about 250 mm) similar to that previously found in Spain, Israel, and Italy. However, the presence of randomly felled burned logs (B plot-block) following the high-intensity/severity wildfire exacerbates the hydrological response, resulting in approximately five times higher runoff volume and sediment yield. The implemented remediation measure in September 2021, targeting the 20% sloping plots, showed an overall significant reduction in runoff volume and sediment yield (30% and 29%, respectively, compared to condition B). A direct relationship linked the runoff and rainfall volume, while the sediment yield was more dependent on the maximum 5-min rainfall intensity (ranging from 2.2 to 35.4 mm h−1). With respect to the existing post-fire situation conditions (bare soil with randomly directed fall-down burned logs) and the pre-fire Pinus radiata asset, a prompt colonization of spontaneous herbaceous vegetation was observed three weeks after the treatment. This was followed by the establishment of natural forest renewal within five weeks. There was a positive correlation between the increased vegetation cover stage in the areas behind the re-directed logs and the reduction in both runoff volume and sediment yield. The implemented measure was exclusively manual and has the potential to be economically/environmentally sustainable. It also complies with the stringent Italian law on burned forests, making it well-suited for timely intervention in hydrogeologically fragile contexts.
An extended monitoring period and further in-depth research are required to further understand the effects of the treatment at higher rainfall intensities and operational slopes (e.g., 30% or more), as well as to explore other aspects (e.g., regulatory, biological, mechanical, economic. These efforts aim to establish a comprehensive framework that is effective in developing protocols and facilitating the dissemination of this measure.

Author Contributions

Conceptualization, G.B. (Giuseppe Bombino); methodology, G.B. (Giuseppe Bombino) and S.M.Z.; field surveys and data collection, G.B. (Giuseppe Bombino), P.D. and D.D.; validation, G.B. (Giuseppe Bombino) and S.M.Z.; data curation, P.P.-C., P.D., G.B. (Giuseppe Barbaro), G.F. and D.D.; formal analysis, G.B. (Giuseppe Bombino), P.P.-C. and S.M.Z.; writing—original draft preparation, G.B. (Giuseppe Bombino), P.P.-C. and S.M.Z.; writing—review and editing, G.B. (Giuseppe Bombino), D.D. and S.M.Z.; supervision, G.B. (Giuseppe Bombino), P.P.-C. and S.M.Z.; project funding, G.B. (Giuseppe Bombino) and S.M.Z. All authors have read and agreed to the published version of the manuscript.

Funding

This work was funded by the Next Generation EU—Italian NRRP, Mission 4, Component 2, Investment 1.5, specifically the call for the creation and strengthening of ‘Innovation Ecosystems’ and the building of ‘Territorial R&D Leaders’ (Directorial Decree n. 2021/3277). The project Tech4You—technologies for climate change adaptation and quality of life improvement, was assigned the identification n. ECS0000009. This work reflects only the authors’ views and opinions and do not necessarily reflect those of the Ministry for University and Research or the European Commission, who can be considered responsible for them.

Data Availability Statement

Not applicable.

Acknowledgments

The authors are grateful to the Francesco Saccà agro-forestry farm in Roccaforte del Greco for providing access to the experimental system and logistic support. The authors also extend their thanks to the research fellow Giuseppina Lofaro for her insights on the regulatory aspects.

Conflicts of Interest

The authors declare no conflict of interest.

Appendix A

Table A1. Main characteristics of rainfall events recorded by the meteorological station located in Roccaforte del Greco, Southern Calabria, Italy.
MonthEvent GroupNumber of Rainy DaysCumulated
Rainfall Depth
(mm)
Maximum 5-min
Rainfall Intensity
(mm h−1)
September 20211236.418.0
2315.813.0
November3679.622.4
4319.46.0
5375.216.0
6214.04.6
75249.430.6
85180.210.2
November9566.410.6
10233.49.0
11220.010.6
12437.24.4
December13514.42.6
14570.47.8
15334.23.2
January 202216623.85.4
February17324.411.4
18235.65.4
March19558.83.4
April20314.02.2
May21453.27.0
June22117.44.6
August 2022237105.435.4
September 2021–August 2022
(12 months)
861278.6-
September 202224289.018.6
Overall period24881367.6(2.2–35.4)
Figure A1. Evolution of vegetation cover in relation to runoff volume (a) and sediment yield (b).
Water 15 02378 g0a1aWater 15 02378 g0a1b

References

  1. Carrión, J.S.; Sánchez-Gómez, P.; Mota, J.F.; Yll, R.; Chaín, C. Holocene Vegetation Dynamics, Fire and Grazing in the Sierra de Gádor, Southern Spain. Holocene 2003, 13, 839–849. [Google Scholar] [CrossRef] [Green Version]
  2. Hosseini, M.; Keizer, J.J.; Pelayo, O.G.; Prats, S.A.; Ritsema, C.; Geissen, V. Effect of Fire Frequency on Runoff, Soil Erosion, and Loss of Organic Matter at the Micro-Plot Scale in North-Central Portugal. Geoderma 2016, 269, 126–137. [Google Scholar] [CrossRef]
  3. Fernandez-Anez, N.; Krasovskiy, A.; Müller, M.; Vacik, H.; Baetens, J.; Hukić, E.; Kapovic Solomun, M.; Atanassova, I.; Glushkova, M.; Bogunović, I.; et al. Current Wildland Fire Patterns and Challenges in Europe: A Synthesis of National Perspectives. Air Soil Water Res. 2021, 14, e117862212110281. [Google Scholar] [CrossRef]
  4. Whelan, R.J. The Ecology of Fire; Cambridge University Press: Cambridge, UK, 1995. [Google Scholar]
  5. Morgan, P.; Hardy, C.C.; Swetnam, T.W.; Rollins, M.G.; Long, D.G. Mapping Fire Regimes across Time and Space: Understanding Coarse and Fine-Scale Fire Patterns. Int. J. Wildland Fire 2001, 10, 329–342. [Google Scholar] [CrossRef] [Green Version]
  6. DeBano: Fire Effects on Ecosystems—Google Scholar. Available online: https://scholar.google.com/scholar_lookup?hl=en&publication_year=1998&pages=%00empty%00&author=LF+De+Bano&author=DG+Neary&author=PF+Ffolliott&isbn=%00null%00&title=Fire%27s+Effects+on+Ecosystems (accessed on 25 May 2023).
  7. Neary, D.G.; Klopatek, C.C.; DeBano, L.F.; Ffolliott, P.F. Fire Effects on Belowground Sustainability: A Review and Synthesis. For. Ecol. Manag. 1999, 122, 51–71. [Google Scholar] [CrossRef]
  8. Key, C.H.; Benson, N.C. Post-Fire Assessment by Remote Sensing on National Park Service Lands. In Proceedings of the Second U.S. Geological Survey Wildland Fire Workshop, Los Alamos, NM, USA, 31 October–3 November 2000. [Google Scholar]
  9. Smith, A.M.S.; Hudak, A.T.; Smith, A.M.S.; Hudak, A.T. Estimating Combustion of Large Downed Woody Debris from Residual White Ash. Int. J. Wildland Fire 2005, 14, 245–248. [Google Scholar] [CrossRef] [Green Version]
  10. Ascoli, D.; Marchetti, M. Territorio, bioeconomia e gestione degli incendi: Una sfida da raccogliere al più presto. For.-J. Silvic. For. Ecol. 2018, 15, 71. [Google Scholar]
  11. San-Miguel-Ayanz, J.; Durrant, T.; Boca, R.; Maianti, P.; Libertá, G.; Artés-Vivancos, T.; Oom, D.; Branco, A.; de Rigo, D.; Ferrari, D.; et al. Forest Fires in Europe, Middle East and North Africa 2021; Publications Office of the European Union: Luxembourg, 2022. [Google Scholar]
  12. Shakesby, R. Post-Wildfire Soil Erosion in the Mediterranean: Review and Future Research Directions. Earth-Sci. Rev. 2011, 105, 71–100. [Google Scholar] [CrossRef]
  13. Dimitrakopoulos, A.; Gogi, C.; Stamatelos, G.; Mitsopoulos, I. Statistical Analysis of the Fire Environment of Large Forest Fires (>1000 Ha) in Greece. Pol. J. Environ. Stud. 2011, 20, 327–332. [Google Scholar]
  14. Cos, J.; Doblas-Reyes, F.; Jury, M.; Marcos, R.; Bretonnière, P.-A.; Samsó, M. The Mediterranean Climate Change Hotspot in the CMIP5 and CMIP6 Projections. Earth Syst. Dynam. 2022, 13, 321–340. [Google Scholar] [CrossRef]
  15. Bowman, D.M.; Balch, J.K.; Artaxo, P.; Bond, W.J.; Carlson, J.M.; Cochrane, M.A.; D’Antonio, C.M.; DeFries, R.S.; Doyle, J.C.; Harrison, S.P. Fire in the Earth System. Science 2009, 324, 481–484. [Google Scholar] [CrossRef]
  16. Mavsar, R.; Varela, E.; Corona, P.; Barbati, A.; Marsh, G. Economic, Legal and Social Aspects of Post-Fire Management. In Post-Fire Management and Restoration of Southern European Forests; Springer: Dordrecht, The Netherlands, 2012; pp. 45–78. [Google Scholar]
  17. Diakakis, M.; Xanthopoulos, G.; Gregos, L. Analysis of Forest Fire Fatalities in Greece: 1977–2013. Int. J. Wildland Fire 2016, 25, 797–809. [Google Scholar] [CrossRef]
  18. Elia, M.; Giannico, V.; Spano, G.; Lafortezza, R.; Sanesi, G. Likelihood and Frequency of Recurrent Fire Ignitions in Highly Urbanised Mediterranean Landscapes. Int. J. Wildland Fire 2020, 29, 120–131. [Google Scholar] [CrossRef]
  19. Barbati, A.; Arianoutsou, M.; Corona, P.; De Las Heras, J.; Fernandes, P.; Moreira, F.; Papageorgiou, K.; Vallejo, R.; Xanthopoulos, G. Post-Fire Forest Management in Southern Europe: A COST Action for Gathering and Disseminating Scientific Knowledge. iForest-Biogeosci. For. 2010, 3, 5. [Google Scholar] [CrossRef] [Green Version]
  20. Francos, M.; Úbeda, X.; Tort, J.; Panareda, J.M.; Cerdà, A. The Role of Forest Fire Severity on Vegetation Recovery after 18 Years. Implications for Forest Management of Quercus Suber L. in Iberian Peninsula. Glob. Planet. Chang. 2016, 145, 11–16. [Google Scholar] [CrossRef]
  21. Caon, L.; Vallejo, V.R.; Ritsema, C.J.; Geissen, V. Effects of wildfire on soil nutrients in Mediterranean ecosystems. Earth-Sci. Rev. 2014, 139, 47–58. [Google Scholar] [CrossRef]
  22. Robinne, F.-N.; Hallema, D.W.; Bladon, K.D.; Buttle, J.M. Wildfire Impacts on Hydrologic Ecosystem Services in North American High-Latitude Forests: A Scoping Review. J. Hydrol. 2020, 581, 124360. [Google Scholar] [CrossRef]
  23. Scrinzi, G.; Gregori, E.; Giannetti, F.; Galvagni, D.; Zorn, G.; Colle, G.; Andrenelli, M. Un Modello Di Valutazione Della Funzionalità Protettiva Del Bosco per La Pianificazione Forestale: La Componente Stabilità Dei Versanti Rispetto Ai Fenomeni Franosi Superficiali. For.-J. Silvic. For. Ecol. 2006, 3, 98. [Google Scholar] [CrossRef] [Green Version]
  24. Corona, P.; Barbati, A.; Ferrari, B.; Portoghesi, L. Pianificazione Ecologica Dei Sistemi Forestali: 2a Edizione; Compagnia delle Foreste Srl: Arezzo, Italy, 2019. [Google Scholar]
  25. Portoghesi, L.; Iovino, F.; Certini, G.; Travaglini, D. II Bosco e La Custodia Del Territorio: II Ruolo Della Selvicoltura. L’Italia For. E Mont. 2019, 74, 263–276. [Google Scholar] [CrossRef] [Green Version]
  26. Cerdà, A.; Borja, M.E.L.; Úbeda, X.; Martínez-Murillo, J.F.; Keesstra, S. Pinus Halepensis M. versus Quercus Ilex subsp. Rotundifolia L. Runoff and Soil Erosion at Pedon Scale under Natural Rainfall in Eastern Spain Three Decades after a Forest Fire. For. Ecol. Manag. 2017, 400, 447–456. [Google Scholar] [CrossRef] [Green Version]
  27. Ebel, B.A.; Moody, J.A. Synthesis of Soil-Hydraulic Properties and Infiltration Timescales in Wildfire-Affected Soils. Hydrol. Process. 2017, 31, 324–340. [Google Scholar] [CrossRef]
  28. García-Comendador, J.; Fortesa, J.; Calsamiglia, A.; Calvo-Cases, A.; Estrany, J. Post-Fire Hydrological Response and Suspended Sediment Transport of a Terraced Mediterranean Catchment. Earth Surf. Process. Landf. 2017, 42, 2254–2265. [Google Scholar] [CrossRef]
  29. Cavalli, M.; Vericat, D.; Pereira, P. Mapping Water and Sediment Connectivity. Sci. Total Environ. 2019, 673, 763–767. [Google Scholar] [CrossRef] [PubMed]
  30. Shakesby, R.A.; Doerr, S.H. Wildfire as a Hydrological and Geomorphological Agent. Earth-Sci. Rev. 2006, 74, 269–307. [Google Scholar] [CrossRef]
  31. Béguin, P.; Millet, J.; Aubert, J.-P. Cellulose Degradation by Clostridium Thermocellum: From Manure to Molecular Biology. FEMS Microbiol. Lett. 1992, 100, 523–528. [Google Scholar] [CrossRef]
  32. Lasanta, T.; Cerdà, A. Long-Term Erosional Responses after Fire in the Central Spanish Pyrenees: 2. Solute Release. CATENA 2005, 60, 81–100. [Google Scholar] [CrossRef]
  33. Inbar, M.; Wittenberg, L.; Tamir, M. Soil Erosion and Forestry Management after Wildfire in a Mediterranean Woodland, Mt. Carmel, Israel. Int. J. Wildland Fire 1997, 7, 285–294. [Google Scholar] [CrossRef]
  34. Inbar, M.; Tamir, M.I.; Wittenberg, L. Runoff and Erosion Processes after a Forest Fire in Mount Carmel, a Mediterranean Area. Geomorphology 1998, 24, 17–33. [Google Scholar] [CrossRef]
  35. Badía, D.; Martí, C. Plant Ash and Heat Intensity Effects on Chemicaland Physical Properties of Two Contrasting Soils. Arid Land Res. Manag. 2003, 17, 23–41. [Google Scholar] [CrossRef]
  36. Gimeno-García, E.; Andreu, V.; Rubio, J.L. Influence of Vegetation Recovery on Water Erosion at Short and Medium-Term after Experimental Fires in a Mediterranean Shrubland. Catena 2007, 69, 150–160. [Google Scholar] [CrossRef] [Green Version]
  37. Mayor, A.G.; Bautista, S.; Llovet, J.; Bellot, J. Post-Fire Hydrological and Erosional Responses of a Mediterranean Landscpe: Seven Years of Catchment-Scale Dynamics. Catena 2007, 71, 68–75. [Google Scholar] [CrossRef]
  38. Bedia, J.; Herrera, S.; Camia, A.; Moreno, J.M.; Gutiérrez, J.M. Forest Fire Danger Projections in the Mediterranean Using ENSEMBLES Regional Climate Change Scenarios. Clim. Chang. 2014, 122, 185–199. [Google Scholar] [CrossRef] [Green Version]
  39. Robichaud, P.R.; Ashmun, L.E.; Sims, B.D. Post-Fire Treatment Effectiveness for Hillslope Stabilization; Gen. Tech. Rep. RMRS-GTR-240; U.S. Department of Agriculture, Forest Service, Rocky Mountain Research Station: Fort Collins, CO, USA, 2010; Volume 240, 62p. [Google Scholar] [CrossRef] [Green Version]
  40. Figueiredo, T.D.; Fonseca, F.; Lima, E.; Fleischfresser, L.; Hernandez Hernandez, Z. Assessing Performance of Post-Fire Hillslope Erosion Control Measures Designed for Different Implementation Scenarios in NE Portugal: Simulations Applying USLE. In Wildfires: Perspectives, Issues and Challenges of the 21st Century; Nova Science Publisher: New York, NY, USA, 2017; pp. 201–227. [Google Scholar]
  41. Fernández-García, V.; Fulé, P.Z.; Marcos, E.; Calvo, L. The Role of Fire Frequency and Severity on the Regeneration of Mediterranean Serotinous Pines under Different Environmental Conditions. For. Ecol. Manag. 2019, 444, 59–68. [Google Scholar] [CrossRef]
  42. Robichaud, P.R.; Lewis, S.A.; Wagenbrenner, J.W.; Brown, R.E.; Pierson, F.B. Quantifying Long-Term Post-Fire Sediment Delivery and Erosion Mitigation Effectiveness. Earth Surf. Process. Landf. 2020, 45, 771–782. [Google Scholar] [CrossRef]
  43. Robichaud, P.R.; Wagenbrenner, J.W.; Lewis, S.A.; Ashmun, L.E.; Brown, R.E.; Wohlgemuth, P.M. Post-Fire Mulching for Runoff and Erosion Mitigation Part II: Effectiveness in Reducing Runoff and Sediment Yields from Small Catchments. Catena 2013, 105, 93–111. [Google Scholar] [CrossRef]
  44. Robichaud, P.R.; Wagenbrenner, J.W.; Brown, R.E.; Wohlgemuth, P.M.; Beyers, J.L. Evaluating the Effectiveness of Contour-Felled Log Erosion Barriers as a Post-Fire Runoff and Erosion Mitigation Treatment in the Western United States. Int. J. Wildland Fire 2008, 17, 255–273. [Google Scholar] [CrossRef]
  45. Rey, F.; Bifulco, C.; Bischetti, G.B.; Bourrier, F.; De Cesare, G.; Florineth, F.; Graf, F.; Marden, M.; Mickovski, S.B.; Phillips, C. Soil and Water Bioengineering: Practice and Research Needs for Reconciling Natural Hazard Control and Ecological Restoration. Sci. Total Environ. 2019, 648, 1210–1218. [Google Scholar] [CrossRef]
  46. USDA Forest Service, C. Emergency Stabilization—Burned-Area Emergency Response (BAER). In Forest Service Manual FSM 2500, Watershed and Air Management; USDA Forest Service: Washingotn, DC, USA, 2004. [Google Scholar]
  47. Gómez-Sánchez, E.; Lucas-Borja, M.E.; Plaza-Álvarez, P.A.; González-Romero, J.; Sagra, J.; Moya, D.; De Las Heras, J. Effects of Post-Fire Hillslope Stabilisation Techniques on Chemical, Physico-Chemical and Microbiological Soil Properties in Mediterranean Forest Ecosystems. J. Environ. Manag. 2019, 246, 229–238. [Google Scholar] [CrossRef]
  48. López-Vicente, M.; Kramer, H.; Keesstra, S. Effectiveness of Soil Erosion Barriers to Reduce Sediment Connectivity at Small Basin Scale in a Fire-Affected Forest. J. Environ. Manag. 2021, 278, 111510. [Google Scholar] [CrossRef]
  49. Raftoyannis, Y.; Spanos, I.; Raftoyannis, Y.; Spanos, I. Evaluation of Log and Branch Barriers as Post-Fire Rehabilitation Treatments in a Mediterranean Pine Forest in Greece. Int. J. Wildland Fire 2005, 14, 183–188. [Google Scholar] [CrossRef]
  50. Fernández, C.; Vega, J.A.; Jiménez, E.; Fonturbel, T.; Fernández, C.; Vega, J.A.; Jiménez, E.; Fonturbel, T. Effectiveness of Three Post-Fire Treatments at Reducing Soil Erosion in Galicia (NW Spain). Int. J. Wildland Fire 2011, 20, 104–114. [Google Scholar] [CrossRef] [Green Version]
  51. Preti, F.; Capobianco, V.; Sangalli, P. Soil and Water Bioengineering (SWB) Is and Has Always Been a Nature-Based Solution (NBS): A Reasoned Comparison of Terms and Definitions. Ecol. Eng. 2022, 181, 106687. [Google Scholar] [CrossRef]
  52. Proto, A.R.; Bernardini, V.; Cataldo, M.F.; Zimbalatti, G. Whole Tree System Evaluation of Thinning a Pine Plantation in Southern Italy. Ann. Silvic. Res. 2020, 45, 44–52. [Google Scholar]
  53. de Pagter, T.; Lucas-Borja, M.E.; Navidi, M.; Carra, B.G.; Baartman, J.; Zema, D.A. Effects of Wildfire and Post-Fire Salvage Logging on Rainsplash Erosion in a Semi-Arid Pine Forest of Central Eastern Spain. J. Environ. Manag. 2023, 329, 117059. [Google Scholar] [CrossRef] [PubMed]
  54. Lucas-Borja, M.E.; Heydari, M.; Miralles, I.; Zema, D.A.; Manso, R. Effects of Skidding Operations after Tree Harvesting and Soil Scarification by Felled Trees on Initial Seedling Emergence of Spanish Black Pine (Pinus Nigra Arn. Ssp. Salzmannii). Forests 2020, 11, 767. [Google Scholar] [CrossRef]
  55. Bombino, G. A (New) Suggestive Hypothesis about the Origin of the Term Fiumara (Seasonally-Flowing and High Hazard Streams of Southern Italy). Mediterr. Chron. 2020, 10, 163–173. [Google Scholar]
  56. Ibbeken, H.; Schleyer, R. Source and Sediment, a Case Study of Provenance and Mass Balance at an Active Plate Margin (Calabria); Springer Science & Business Media: Berlin/Heidelberg, Germany, 1991. [Google Scholar]
  57. Sorriso-Valvo, M. Natural Hazards and Natural Heritage—Common Origins and Interference with Cultural Heritage. Geogr. Fis. E Din. Quat. 2008, 31, 231–237. [Google Scholar]
  58. Palmeri, V.; Pulvirenti, A.; Zappalà, L. La Processionaria Dei Pini Nei Boschi Della Dorsale Appenninica Della Calabria. For.-J. Silvic. For. Ecol. 2005, 2, 345. [Google Scholar] [CrossRef] [Green Version]
  59. Kottek, M.; Grieser, J.; Beck, C.; Rudolf, B.; Rubel, F. World Map of the Köppen-Geiger Climate Classification Updated. Meteorol. Z. 2006, 15, 259–263. [Google Scholar] [CrossRef]
  60. Bouyoucos, G.J. Hydrometer Method Improved for Making Particle Size Analyses of Soils1. Agron. J. 1962, 54, 464–465. [Google Scholar] [CrossRef]
  61. Walkley, A.; Black, I.A. An Examination of the Degtjareff Method for Determining Soil Organic Matter, and A Proposed Modification of the Chromic Acid Titration Method. Soil Sci. 1934, 37, 29. [Google Scholar] [CrossRef]
  62. Kjeldahl, J. Neue Methode zur Bestimmung des Stickstoffs in organischen Körpern. Z. Für Anal. Chem. 1883, 22, 366–382. [Google Scholar] [CrossRef] [Green Version]
  63. Tomaščík, M.; Németová, Z.; Danacova, M. Analysis of Factors Influencing the Intensity of Soil Water Erosion. Acta Hydrol. Slovaca 2021, 22, 70–77. [Google Scholar] [CrossRef]
  64. Tinebra, I.; Alagna, V.; Iovino, M.; Bagarello, V. Comparing Different Application Procedures of the Water Drop Penetration Time Test to Assess Soil Water Repellency in a Fire Affected Sicilian Area. Catena 2019, 177, 41–48. [Google Scholar] [CrossRef]
  65. Roldán, A.; García-Orenes, F.; Lax, A. An Incubation Experiment to Determine Factors Involving Aggregation Changes in an Arid Soil Receiving Urban Refuse. Soil Biol. Biochem. 1994, 26, 1699–1707. [Google Scholar] [CrossRef]
  66. Benito Rueda, E.; Gomez Ulla, A.; Diaz Fierros, F. Descripción de Un Simulados de Lluvia Para Estudios de Erodabilidad Del Suelo y Estabilidad de Los Agregados al Agua. An. Edafol. Agrobiol 1986, 45, 1115–1126. [Google Scholar]
  67. Ball, D.F. Loss-on-Ignition as an Estimate of Organic Matter and Organic Carbon in Non-Calcareous Soils. J. Soil Sci. 1964, 15, 84–92. [Google Scholar] [CrossRef]
  68. Vogel, K.P.; Masters, R.A. Frequency Grid-a Simple Tool for Measuring Grassland Establishment. J. Range Manag. 2001, 54, 653–655. [Google Scholar] [CrossRef]
  69. Braun-Blanquet, J. Zur Kenntnis Der Vegetationsverhältnisse Des Grossen Atlas; Buchdruckerei Gebr. Fretz AG: Zürich, Switzerland, 1928. [Google Scholar]
  70. Keesstra, S.D.; Maroulis, J.; Argaman, E.; Voogt, A.; Wittenberg, L. Effects of Controlled Fire on Hydrology and Erosion under Simulated Rainfall. Cuad. Investig. Geográfica 2014, 40, 269–294. [Google Scholar] [CrossRef] [Green Version]
  71. Lucas-Borja, M.E.; Van Stan II, J.T.; Heydari, M.; Omidipour, R.; Rocha, F.; Plaza-Alvarez, P.A.; Zema, D.A.; Muñoz-Rojas, M. Post-Fire Restoration with Contour-Felled Log Debris Increases Early Recruitment of Spanish Black Pine (Pinus Nigra Arn. ssp. Salzmannii) in Mediterranean Forests. Restor. Ecol. 2021, 29, e13338. [Google Scholar] [CrossRef]
  72. Ferro, V. Evaluating Overland Flow Sediment Transport Capacity. Hydrol. Process. 1998, 12, 1895–1910. [Google Scholar] [CrossRef]
  73. Pampalone, V.; Carollo, F.G.; Nicosia, A.; Palmeri, V.; Di Stefano, C.; Bagarello, V.; Ferro, V. Measurement of Water Soil Erosion at Sparacia Experimental Area (Southern Italy): A Summary of More than Twenty Years of Scientific Activity. Water 2022, 14, 1881. [Google Scholar] [CrossRef]
  74. Mendes, T.A.; Alves, R.D.; Gitirana, G.D.F.N., Jr.; Pereira, S.A.D.S.; Rebolledo, J.F.R.; da Luz, M.P. Evaluation of Rainfall Interception by Vegetation Using a Rainfall Simulator. Sustainability 2021, 13, 5082. [Google Scholar] [CrossRef]
  75. Wittenberg, L.; Inbar, M. The Role of Fire Disturbance on Runoff and Erosion Processes—A Long-Term Approach, Mt. Carmel Case Study, Israel. Geogr. Res. 2009, 47, 46–56. [Google Scholar] [CrossRef]
  76. Rulli, M.C.; Spada, M.; Bozzi, S.; Bocchiola, D.; Rosso, R. Erosion and Runoff Generation from Fire Disturbed Mediterranean Forest Area. Ph.D. Thesis, Colorado State University, Fort Collins, CO, USA, 2005. [Google Scholar] [CrossRef]
  77. Rubio, J.L.; Forteza, J.; Andreu, V.; Cerni, R. Soil Profile Characteristics Influencing Runoff and Soil Erosion after Forest Fire: A Case Study (Valencia, Spain). Soil Technol. 1997, 11, 67–78. [Google Scholar] [CrossRef]
  78. Campo, J.; Andreu, V.; Gimeno-García, E.; González, O.; Rubio, J.L. Occurrence of Soil Erosion after Repeated Experimental Fires in a Mediterranean Environment. Geomorphology 2006, 82, 376–387. [Google Scholar] [CrossRef] [Green Version]
  79. Li, L.; Yang, J.; Wu, J. A Method of Watershed Delineation for Flat Terrain Using Sentinel-2A Imagery and DEM: A Case Study of the Taihu Basin. ISPRS Int. J. Geo-Inf. 2019, 8, 528. [Google Scholar] [CrossRef] [Green Version]
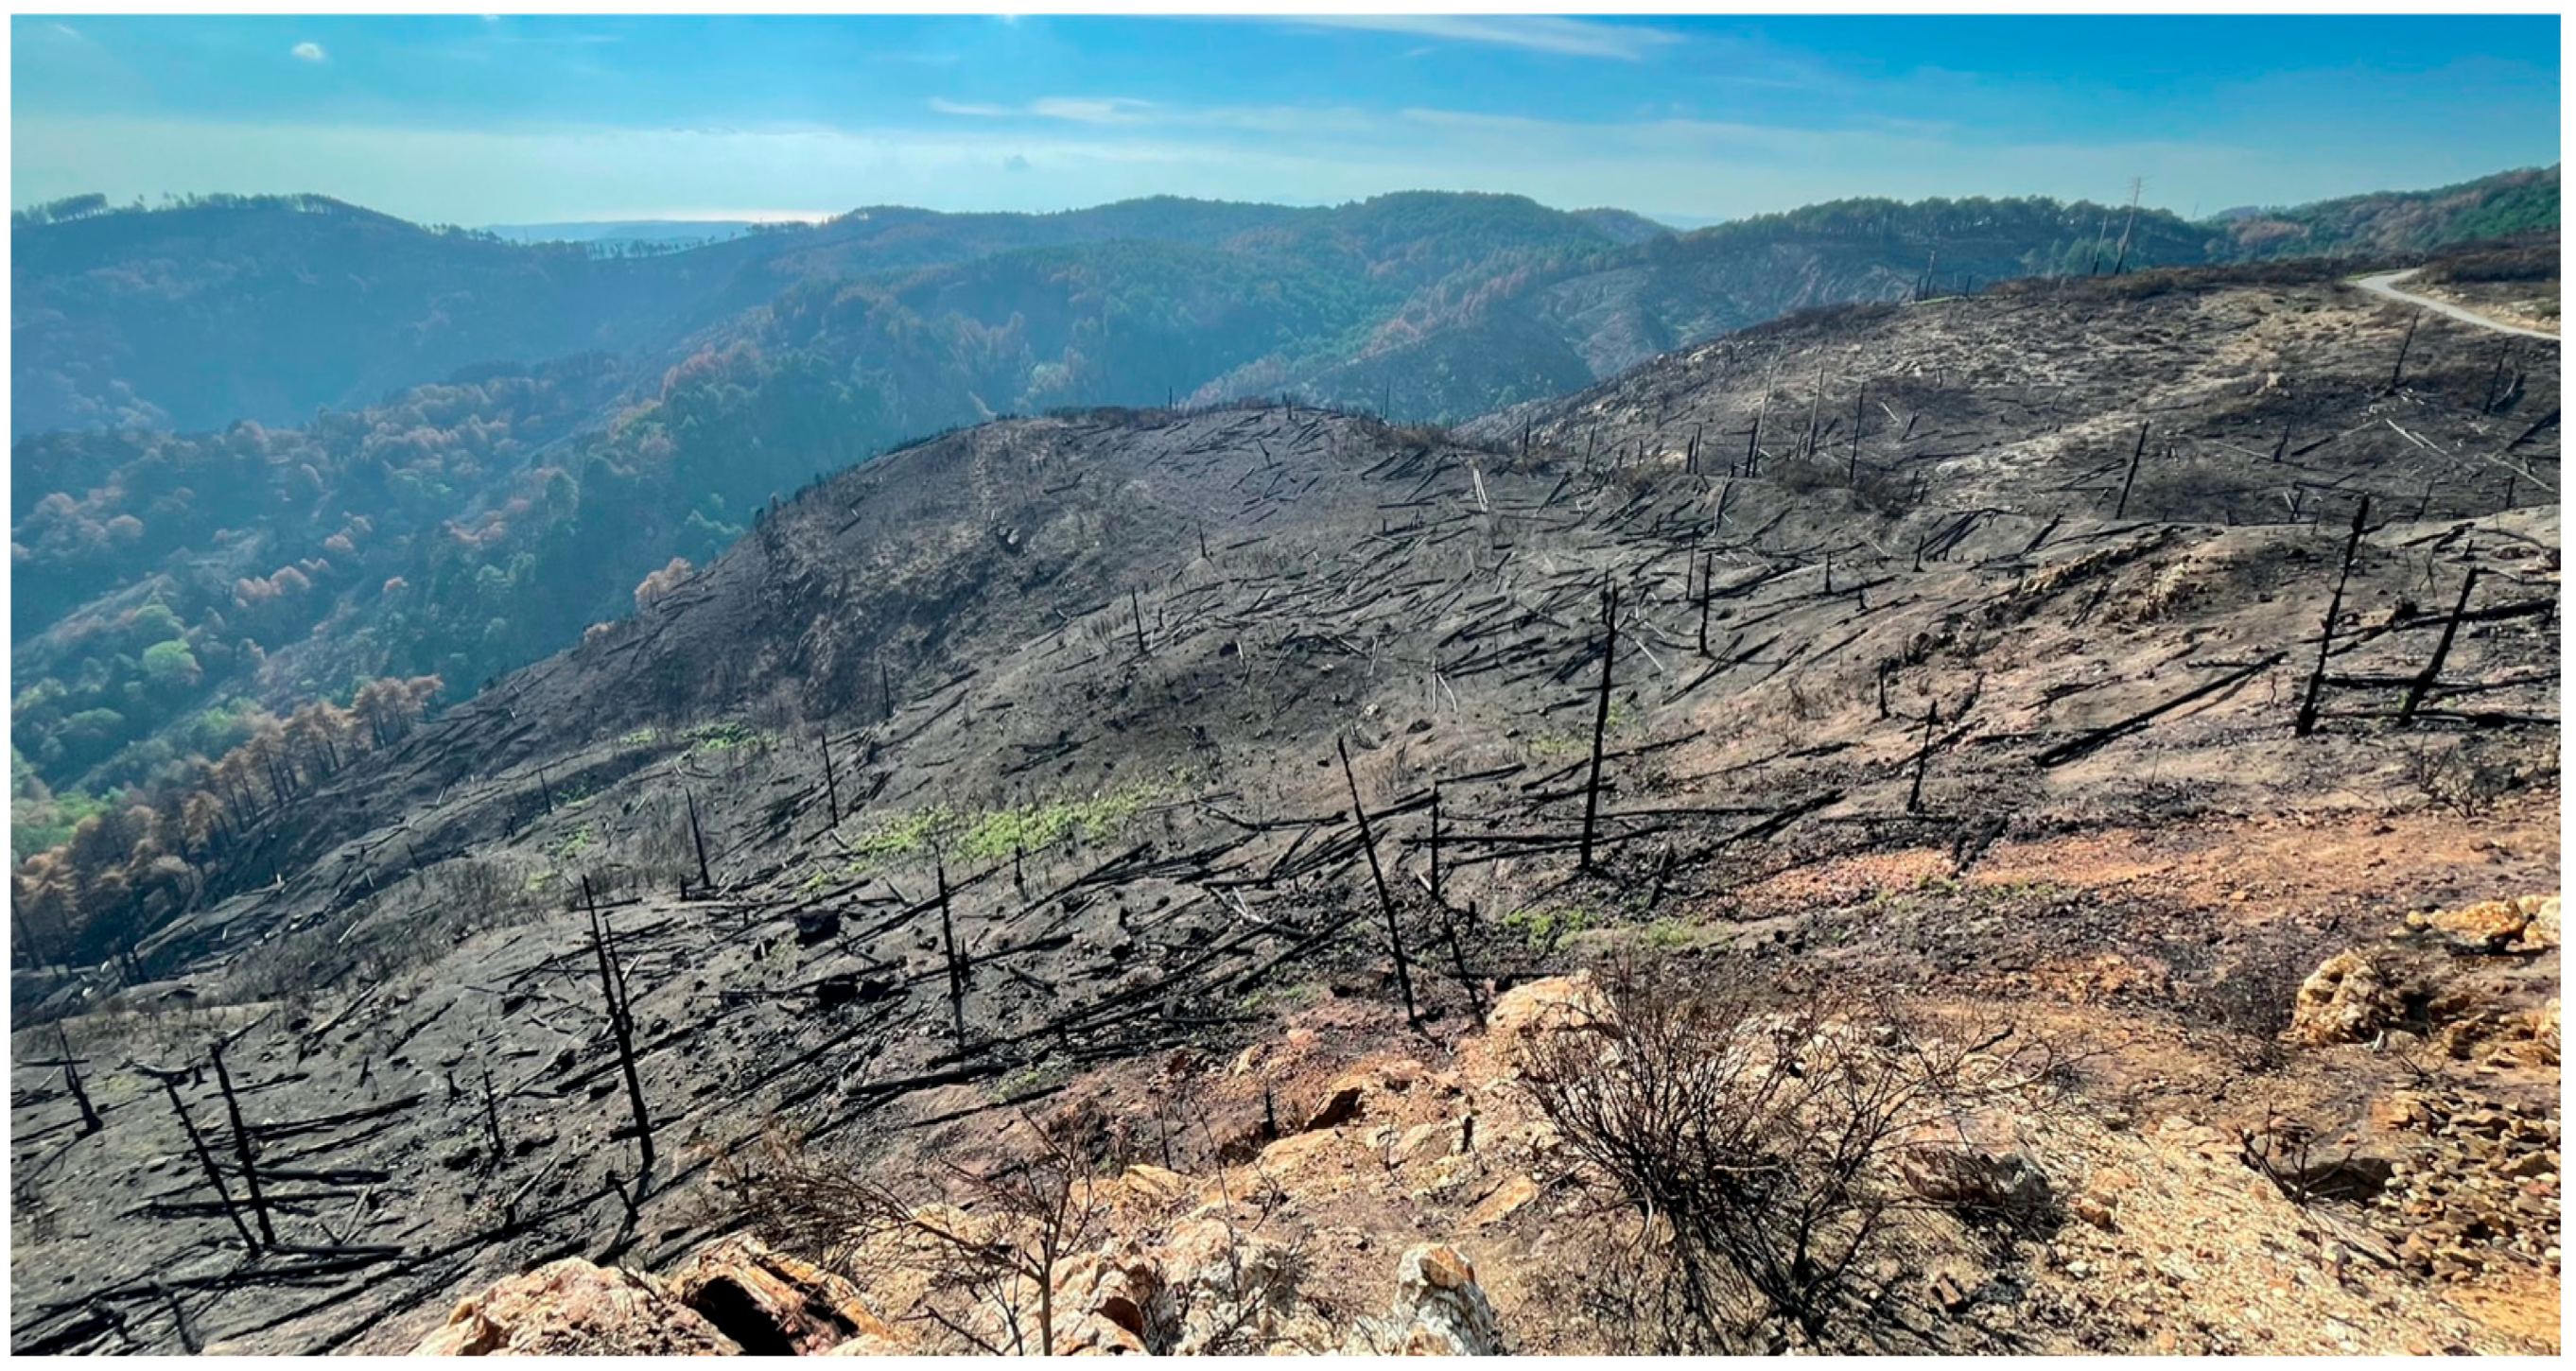
Scheme 1. Representative photo of the Aspromonte areas affected by the wildfires in the summer of 2021.
Water 15 02378 sch001
Figure 1. The study area located within the territory of Aspromonte Massif, Metropolitan Area of Reggio Calabria, Southern Calabria, Italy. Satellite imagery provided by Google Earth Pro shows the study area (red circle) before and after the wildfire that occurred in August 2021 (territory of Roccaforte del Greco).
Water 15 02378 g001
Figure 2. (a) Location of the three plot-blocks in Roccaforte del Greco, Southern Calabria, Italy; (b) experimental sketch showing the three conditions studied: F, forested; B, burned with casually directed downed logs; BR, burned rearranged with manually redirected downed logs along contour lines.
Water 15 02378 g002
Figure 3. Sketch of the manual redirection along the contour lines (brown lines) and hammering of downed burned logs (dashed yellow lines indicate the rotation of logs).
Water 15 02378 g003
Scheme 2. (a) Overall view of the BR sub-plots under construction (in orange, plastic gutters), (b) view of the burned log hammering, and (c) rearranged burned sub-plots (BR).
Water 15 02378 sch002
Figure 4. Evolution of mean values (n = 3), runoff volumes (a,b), and sediment yields (c,d) in sub-plots related to rainfall depth and maximum 5-min intensity.
Water 15 02378 g004aWater 15 02378 g004b
Figure 5. Correlation between the differences in the values of vegetation cover (VCBR − VCB) and runoff volume (RB − RBR) (a) and sediment yield (SB − SBR) (b) for each event group.
Water 15 02378 g005
Scheme 3. View of (a) the BR sub-plot during initial setup, (b) vegetation established immediately upstream of the contour logs after a few months, (c) vegetation cover spreading, and (d) young pine seedlings.
Water 15 02378 sch003
Table 1. Main characteristics of the study area within the territory of Roccaforte del Greco (Aspromonte, Calabria, Italy).
OrographyCoordinates38°03′ N; 15°54′ E
Altitude970 m a.s.l.
AspectNorth
ClimateCondition (according to the Köppen classification [59])Csa 1
Mean monthly air temperature *5 °C (January)–23 °C (August)
Mean annual rainfall depth *1036 mm
Mean monthly rainfall depth range *13.7 mm (July)–153 mm (December)
ForestsettingSpeciesPinus radiata
Density800–1000 per ha
Height14–20 m
Crown diameter4–7.5 m
Notes: 1 Hot Mediterranean climate and semiarid conditions. * Database ARPACAL, meteorological station of Roccaforte del Greco (time series covering the period 1940–2022, n = 57, variation coefficient = 29%).
Table 2. Main physical–chemical characteristics of the soil in the three plot-blocks.
Physical/Chemical Features Plot-Block
FBBR
Water 15 02378 i001 Water 15 02378 i002Water 15 02378 i003Water 15 02378 i004
Silt(%)9.4 ± 1.1
Clay(%)11.7 ± 0.1
Sand(%)78.9 ± 0.94
pH 5.76 ± 0.26.19 ± 0.36.21 ± 0.3
EC1:1 (dS/m) 0.199 ± 0.0430.202 ± 0.0310.274 ± 0.047
Organic matter(%)3.382.982.96
C(%)1.96 ± 0.21.72 ± 0.11.71 ± 0.1
N(%)0.79 ± 0.10.83 ± 0.00.83 ± 0.0
C:N 22.825.326.1
Mean infiltration rate(mm h−1)23.816.115.8
Soil water repellency 39.693.694.3
Ash cover(%)0.047.0 ± 4.846.6 ± 5.1
AS
(n = 3)
Size
fraction (mm)
0.25–0.50(%)78 ± 1.072 ± 1.372 ± 1.2
0.50–1.083 ± 1.476 ± 1.476 ± 1.3
1.0–2.031 ± 1.428 ± 1.228 ± 1.3
Table 3. Descriptive values (n = 24) of sub-plot runoff volume and sediment yields. The Shapiro–Wilk test shows the assumption of normality at p values > 0.05.
Runoff Volume (mm)Sediment Yield (kg)
Plot FPlot BPlot BRPlot FPlot BPlot BR
Mean0.733.842.870.1961.0280.791
Median0.402.291.730.1711.0400.615
Standard deviation0.933.772.700.1410.8380.746
Minimum0.020.300.200.0070.0600.018
Maximum3.8415.8210.870.5752.4342.312
Shapiro–Wilk p<0.001<0.0010.0020.1990.0070.007
Table 4. Correlation matrix of runoff and sediment with precipitation and intensity using Spearman’s correlation coefficient.
RunoffSediments
Plot FPlot BPlot BRPlot FPlot BPlot BR
Rainfall depthSpearman Rho0.93 ***0.79 ***0.78 ***0.57 **0.47 *0.43 *
p value< 0.001< 0.001<0.00100.020.04
Rainfall intensitySpearman Rho0.66 ***0.78 ***0.77 ***0.67 ***0.58 **0.6 **
p value<0.001<0.001<0.001<0.00100
Note: * p < 0.05, ** p < 0.01, *** p < 0.001.
Table 5. Runoff analysis on rainfall depth and intensity using a one-way ANOVA following the Kruskal–Wallis test (non-parametric).
Kruskal-WallisRainfall DepthRainfall Intensity
χ2glpε2χ2glpε2
Plot F16.62<0.0010.72410.420.0050.453
Plot B16.62<0.0010.72312.320.0020.537
Plot BR16.22<0.0010.70612.220.0020.530
Notes: Bold p values show statistically significant relationships greater than a 95% confidence interval.
Table 6. Pairwise comparison of runoff volume for different categories of rainfall depth and intensity using the Dwass–Steel–Critchlow–Fligner method. Rainfall depth: 1st category, values between 0–35 mm; 2nd category, values between 35–70 mm; 3rd category, values greater than 70 mm. Rainfall intensity: 1st category, values between 0–10 mm h−1; 2nd category, values between 10–30 mm h−1; 3rd category, values greater than 30 mm h−1.
Pairwise Comparisons
(Dwass Steel Critchlow-Fligner)
Rainfall DepthRainfall Intensity
Plot FPlot BPlot BRPlot FPlot BPlot BR
WpWpWpWpWpWp
Category 1Category 23.630.0283.560.0323.500.0363.590.0304.300.0074.300.007
Category 1Category 34.940.0014.930.0014.940.0013.130.0693.130.0703.140.068
Category 2Category 33.540.0333.640.0273.430.0402.670.1422.000.3341.670.466
Notes: Bold p values show statistically significant relationships greater than a 95% confidence interval.
Table 7. Sediment statistic analysis on rainfall depth and intensity using a one-way ANOVA following the Kruskal–Wallis test (Non-parametric). Bold values show statistically significant relationships greater than a 95% confidence interval.
PlotRainfall DepthRainfall Intensity
χ2glpε2χ2dfpε2
Plot F6.3420.0420.2768.3620.0150.364
Plot B3.1220.2110.1356.3520.0420.276
Plot BR2.4420.2950.1067.2620.0270.316
Notes: Bold p values show statistically significant relationships greater than a 95% confidence interval.
Table 8. Rainfall depth and intensity category pairwise comparison in sediments using the Dwass–Steel–Critchlow–Fligner method. Rainfall depth: 1st category, values between 0–35 mm; 2nd category, between 35–70 mm; 3rd category, greater than 70 mm. Rainfall intensity: 1st category, values between 0–10 mm h−1; 2nd category, between 10–30 mm h−1; 3rd category, greater than 30 mm h−1.
Pairwise Comparisons
(Dwass Steel Critchlow-Fligner)
Rainfall DepthRainfall Intensity
Plot FPlot BPlot BRPlot FPlot BPlot BR
WpWpWpWpWpWp
Category 1Category 20.1420.9941.7060.4501.140.7013.540.0333.350.0473.640.027
Category 1Category 33.5220.0342.2410.2522.110.2942.640.1481.920.3631.920.363
Category 2Category 32.4240.2000.8080.8361.010.7551.330.6140.001.0000.001.000
Notes: Bold p values show statistically significant relationships greater than a 95% confidence interval.
Disclaimer/Publisher’s Note: The statements, opinions and data contained in all publications are solely those of the individual author(s) and contributor(s) and not of MDPI and/or the editor(s). MDPI and/or the editor(s) disclaim responsibility for any injury to people or property resulting from any ideas, methods, instructions or products referred to in the content.