Article

Damage Evolution and Failure Mechanism of Red-Bed Rock under Drying–Wetting Cycles

1
School of Geosciences, Yangtze University, Wuhan 430100, China
2
Badong National Observation and Research Station of Geohazards, China University of Geosciences, Wuhan 430074, China
3
Jiacha County Branch of Hubei Yangtze University Technology Development Co., Ltd., Shannan 856499, China
*
Authors to whom correspondence should be addressed.
Water 2023, 15(15), 2684; https://doi.org/10.3390/w15152684
Submission received: 7 June 2023 / Revised: 3 July 2023 / Accepted: 20 July 2023 / Published: 25 July 2023
(This article belongs to the Special Issue Recent Research on Reservoir Landslide Stability)

Abstract

:
The rock mass on the bank slope of the Three Gorges Reservoir (TGR) area often suffers from a drying–wetting cycle (DWC). How the DWCs significantly affect the mechanical properties and the stability of the rock mass is worth comprehensively investigating. In this study, the influence of the DWC on the mechanical properties of red-bed rock, mainly purplish red argillaceous siltstone, is explored in detail. Triaxial compression tests were conducted on siltstones that were initially subjected to different DWCs. The results show that DWCs lead to a decrease in mechanical properties such as peak stress, residual stress, and elastic modulus, while an increase in confining pressure (CP) levels leads to an increase in these mechanical properties. Significant correlations are found between the energy parameters and the DWC or the CP. Notably, the total absorption energy (TAE) demonstrates a positive correlation with the CP, but the capability of siltstones to absorb energy shows a negative correlation with DWC. Moreover, the study also examines the damage evolution laws of rocks under different DWCs by proposing a damage variable (DV). Results demonstrate that the effect of the CP on the DV is more pronounced than that of DWCs. A novel brittleness index (BI) was also proposed for estimating rock brittleness through damage strain rate analysis. The effectiveness of the proposed BI is validated by evaluating the effects of DWCs and CP on rock brittleness. Finally, the failure mechanism of the rocks under water–rock interaction is revealed. The weakening of mechanical properties occurs due to the formation of microcracks in response to DWCs. These findings provide valuable guidance for the long-term stability assessment of bank slope engineering projects under DWCs.

1. Introduction

The rock mass in a reservoir bank slope is frequently exposed to rainfall and fluctuation in reservoir water level (RWL), which leads to alternating wet and dry states of the rock mass, accelerating the weathering of the rock mass and contributing to the instability of the reservoir bank slope [1,2,3,4,5,6]. Due to long-term exposure to a water-changing environment, the strength properties of the rock mass are comprehensively influenced by a DWC [7,8,9,10]. For instance, in the construction and operation of reservoir bank protection engineering, the bank slope constantly experiences periodic rises and falls in the RWL and periodic rainfall [11,12]. This experience is generally related to the DWC weathering of the rock mass in the bank slope, which comprehensively affects the stability of the engineering. Consequently, continuous attention has been paid to the mechanical properties of the rock mass subjected to the DWC weathering [13].
At present, the physical and mechanical properties of rock under DWC conditions have been extensively discussed in laboratory tests. Physical properties such as water absorption, gradually rise after drying–wetting treatment [14,15,16], whereas some physical properties, including P-wave velocity and bulk density, usually decrease [13,17,18]. The strength of the rock mass ultimately decreases to a relatively stabilized value once DWCs exceed a specific value [19,20]. Rock masses composed of different minerals have different properties. During a DWC, organic solutes inside the rock mass dissolve, and previous microcracks gradually expand. This leads to the frequent expansion and contraction of the particles and, ultimately, a decrease in the strength of the rock mass [21,22]. After the DWC, the microstructure of the rock mass is usually investigated by Scanning Electron Microscope technology. When the cycles increase, the number of the microcracks, their density, and their interconnectivity increase. Furthermore, the mineral particles are crushed, and the dense structure of the rock mass converts to a porous and cracked structure [22,23,24]. Concomitantly, only two methods, free immersion and pressure immersion, are generally used in the DWC process [7,8]. Although these methods are different from the previous studies, a consensus should be obtained that the physical and mechanical parameters follow the same variation laws. Both the DWC and the CP have significant influences on the physical and mechanical properties. Not accounting for these two factors results in a specific deviation between the test results and the model results.
Although many experimental studies have been conducted in recent decades, the underlying mechanism of how DWCs significantly affect the mechanical properties and the stability of the rock mass in a bank slope is still relatively obscure. Moreover, current research work shows that the damage mechanism of the rock mass in a reservoir area during a DWC is still not precise, which is very significant in understanding the failure mechanism of the rock mass under the DWC [25]. In this study, the influence of both the DWC and the CP on the mechanical properties, including the strength and deformation parameters, energy evolution, damage, and brittleness of the red-bed rocks in the TGR area, is experimentally investigated. Triaxial compression tests of the red-bed rocks at different DWCs and CPs are conducted, and the failure mechanism of the rocks is discussed.

2. Experimental Design

2.1. Rock Specimen Preparation

The normal RWL in the TGR area is 145–175 m after 2008, and the RWL variation is as high as 30 m, as shown in Figure 1. Under the condition of large-scale fluctuation in the RWL, the rock mass in the water level change zone is in a dynamic state of periodic drying and wetting. The effect of water on the rock mass is mainly manifested in the deterioration effect of water–rock interaction in the water level change zone, which can be regarded as the DWC effect on the rock mass. This results in the decline of meso strength and deformation parameters of the rock mass. Otherwise, the energy absorption capacity of the red-bed rocks declines. This kind of DWC will damage the mechanical properties of the rock mass. After repeated actions, the damaging effect of the rock mass will develop cumulatively, thus affecting the stability of the slope in the water level change zone. To accurately determine the mechanical properties of the red-bed rocks under the DWC, the rocks in the TGR area are collected from Badong County, Hubei Province, China. On this basis, the stability of rock engineerings, such as rock slopes and tunnels, can be evaluated. The rock specimens are cut from several rock blocks, and their diameter and height are 50 mm and 100 mm, respectively. To reduce the effects of the heterogeneity of the rock specimens on the test results, the rock specimens with significant differences are eliminated through acoustic tests.

2.2. Mineral Compositions

The red-bed rocks, mainly purplish-red argillaceous siltstones that are widely distributed in the TGR area, are selected as the primary rock type in this study. The water–rock interaction is regarded as the main reason for the landslides on the reservoir bank that occur during the periodic rise and fall in the RWL or the rainfall. The mineral compositions of the siltstones are quartz (52%), albite (28%), illite (7%), calcite (7%), chlorite (3%), and other minerals (less than 3%). The density of the rocks changes between 2.5 and 2.7 g/cm3, and the longitudinal wave velocity varies between 5000 and 5500 m/s.

2.3. Test Procedures

To simulate an environment where the RWL rises and falls periodically, red-bed rock specimens are collected for the DWC tests. Research indicates that the deterioration of the mechanical properties of the rocks is related to the DWCs and the immersion time [13,26]. The strength parameters of red mudstone and sandstone drop to a specific value, and then they remain relatively stable after continuous immersion for approximately 15 days. In addition, due to the disintegration property of the red-bed rocks, the sample with particle size greater than 10 mm disintegrates violently during the DWC tests. However, the disintegration of the rock samples mainly occurred in the first 15 cycles, and the samples stopped disintegrating after 20 cycles. Therefore, the maximum number of DWCs is determined as 20 in this study [5]. In this study, the DWCs at which measurements are taken are selected as 0, 1, 5, 10, 15, and 20. The DWC test procedures are as follows:
(a)
The specimens are saturated by free immersion. Firstly, the specimens are put into the water tank, and the water is injected to 1/4 of the specimen height. Afterward, the water is injected to 1/2 and 3/4 of the specimen height every 2 h. After 6 h, the specimens are immersed. Continuously, all the specimens are immersed in water for 48 h. The free water absorptions of the specimens are 2~3% through the saturation tests.
(b)
After continuous immersion of 48 h, the specimens are dislodged from the water tank.
(c)
Finally, the specimens are put into the oven for 48 h, and the drying temperature is set to 60 °C. After drying, we are sure that the moisture contents of the specimens are less than 0.1%.
The above three steps are considered a DWC. After running the specimens through 0, 1, 5, 10, 15, and 20 DWCs, the tests are conducted.
The design scheme of the triaxial compression tests is as follows:
(a)
After preparing the rock specimens according to the test requirements, the rocks are put into the center of the pressure plate, and the axial and lateral strain sensors are installed on the surface of the rocks.
(b)
Using the strain-controlled method, an axial load is imposed at a specific strain rate by setting the upper limit value of compressive strain. When the rocks are damaged or the limit value of the compressive strain is reached, the test is automatically terminated. The data are automatically collected by the computer during the whole test process.
(c)
After the tests, the data are sorted out, processed, and analyzed. Finally, the mechanical parameters are obtained.
A flowchart of the study is prepared to demonstrate the structural framework and the relevance of each part of the study, as shown in Figure 2.

3. Experimental Results

3.1. Mechanical Parameters

The axial stress–strain curves of the rocks are presented in Figure 3. The rocks have a brittle failure characteristic in the state that experienced different DWCs. Before peak stress (PS), the curves show similar growth trends, and even some overlapping areas appear in these curves. In addition, the typical strain–stress curves of the rocks can be divided into several stages, following the fundamental laws [27]. At the same DWC, the axial strain and stress increase with rise in the CP. At the same CP, the stress has a decreasing trend with rise in the DWC, while the axial strain still has an increasing trend.
Based on the test results, the mechanical parameters, such as the PS, peak strain, residual stress (RS), residual strain, elastic modulus, internal friction angle, and cohesion, are obtained. Figure 4 presents the relationships between the mechanical parameters and the CP at the different DWCs. As shown in Figure 4a, the areas enclosed under low CP are fewer than those under high CP, surrounded by closed rings under high CP. Therefore, the PS decreases with the DWCs while increasing with the CP. Obviously, the PS rapidly decreases when the rock undergoes 5 DWCs. Afterward, the decrease rate of the PS decreases with the increase in the cycles. This is because water is the most influential factor in the deterioration of the mechanical properties after the rock sample is saturated with water. As shown in Figure 4b, the areas enclosed under low CP are also basically fewer than those under high CP. The peak strain increases with the DWCs and increases with the CP. Furthermore, the peak strain has an increasing linear trend with the DWCs. Significantly, the peak strain under 4 MPa of CP is lower than that under 2 MPa of CP. As shown in Figure 4c, the areas enclosed under low CP are fewer than those under high CP, and the shapes formed under low CP are all surrounded by the shapes formed under high CP. Moreover, the figures of the RS under different CPs are similar to those of the PS. Therefore, the RS also decreases with the DWCs while increasing with the CP. Compared with 2 MPa of CP, the RS under 4 MPa of CP increases rapidly. Additionally, when the rock specimen is first immersed in water, the RS decreases obviously. As shown in Figure 4d, the residual strain has an increasing linear trend with the DWCs and a different variation trend with the CP. Significantly, under 4 MPa of CP, the residual strain is lower than 2 MPa with a low number of DWCs, but it is higher than 8 MPa at a higher number of cycles. In Figure 4e, the deformation modulus has no apparent variation law with the CP, while it decreases with the increase in the DWCs. When the rock sample is immersed in water, its ability to resist deformation decreases. If the number of the DWCs increases, the rock sample will have more significant deformation under the same load. The results show that under the action of the water, the mechanical properties, including the strength, the strain, and the deformation modulus, gradually deteriorate. The irreversible progressive damage to the rock specimen is caused under the DWC. Generally, the deterioration of the rock strength is substantial at the initial stage of the DWC. In conclusion, the deterioration of the rock strength decreases with increasing DWCs.
The shear strength parameters decrease gradually with the increase in the DWCs. When the rock sample is not subjected to a DWC, the cohesion is 25.62 MPa, and the internal friction angle is 31.68°. However, they are 17.97 MPa and 25.85° when the rock sample has undergone 20 DWCs. Compared with the initial state, the cohesion is reduced by 29.9%, and the internal friction angle is reduced by 18.4%. Figure 5 shows the relationship curves between shear strength parameters and the DWCs. They all have linear relationships with the cycles. Obviously, the cohesion values are all within 95% confidence intervals. Meanwhile, the values of the internal friction angle are basically within 95% confidence intervals. Significantly, the internal friction angle at 20 DWCs is outside 95% confidence intervals while within a 95% prediction band. The results show the reliability and accuracy of the test results.

3.2. Analysis of Characteristic Stresses

The characteristic stresses, including crack closure stress (CCS), crack initiation stress (CIS), crack damage stress (CDS), the PS, and the RS, are fundamental parameters to determine the generation, development, and coalescence of microcracks, which can be used to divide deformation evolutionary stages of a rock [28]. Noteworthy, the CIS and the CDS are regarded as the lower limit and the upper limit of the long-term strength, respectively. Therefore, the accurate evaluation of the CIS is very beneficial to revealing the progressive failure mechanism of the rock and structuring rock strength criterion [29]. Additionally, the determination of the CDS is also significant in analyzing the long-term stability of rock slopes. Generally, there exist several methods to determine the CIS and CDS. The methods to determine the CIS and CDS under compression depend on the measured strains. These methods determine the stresses based on the lateral strain or volumetric strain and occasionally the AE technique. In this study, combining the advantages of various methods, these strains are comprehensively used to determine the characteristic stresses.
Figure 6 presents normalized stress characteristic values under different DWCs. The bubble scale symbolizes the value of the characteristic stress, and the colors of the bubbles represent different DWCs. With increasing CP, the five characteristic stresses increase. At the same CP, both the normalized PS and the normalized RS have relatively close values in different DWCs. In contrast, the normalized CCS, the normalized CIS, and the normalized CDS have widening gaps in different DWCs. Additionally, the ratios of the other characteristic stresses to the PS are analyzed. Under high CPs (8 MPa and 16 MPa), the CCS/PS ratio ranges from 0.22 to 0.3. Nevertheless, the ratio ranges from 0.2 to 0.44 under low CPs (2 MPa and 4 MPa). Meanwhile, the CIS/PS ratio is about 0.5 under 4 MPa, 8 MPa, and 16 MPa of the CP, while the ratio is about 0.3 under 2 MPa of the CP. This difference may be caused by the fact that the rock specimens under 2 MPa of the CP are all taken from the same rock block, and the porosity, permeability, and other properties of this rock block are different from those under other CPs. The previous studies indicated that under triaxial compression, the CIS/PS ratio ranged from 0.5 to 0.55 [28,30]. Therefore, the feature in the previous studies is also reflected in the study’s results. For the CDS/PS ratio, it ranges from 0.6 to 0.9. Under high CPs, the ratio is relatively lower than that under low CPs. For the RS/PS ratio, it is between 0.43 to 0.56 under 4 MPa, 8 MPa, and 16 MPa of the CP, while the ratio is about 0.3 under 2 MPa of the CP.
To better reflect the distribution characteristics of the characteristic stresses under different DWCs, Figure 7 presents the box normal diagrams of the characteristic stresses. Different bars represent the characteristic stresses under different DWCS. The overall distribution of the data that are represented by upper boundary, 75% quantile, median, 25% quantile, and lower boundary is observed in the diagrams. A box diagram is generated by calculating these statistics. Most of the normal data are inside the box, while the abnormal data are outside the upper and lower boundaries of the box. The width of the box reflects the fluctuation in the data to some extent. The flatter the box is, the more centralized the data are. As shown in Figure 7, the characteristic stresses under different DWCs conform to the normal distribution law. Incredibly, both the CCS and the CIS are evenly distributed when the rock specimens are not immersed in water. Nevertheless, the distributions of the CCS and the CIS have a relative gap at the first cycle. In total, there are no abnormal data in the five characteristic stresses.

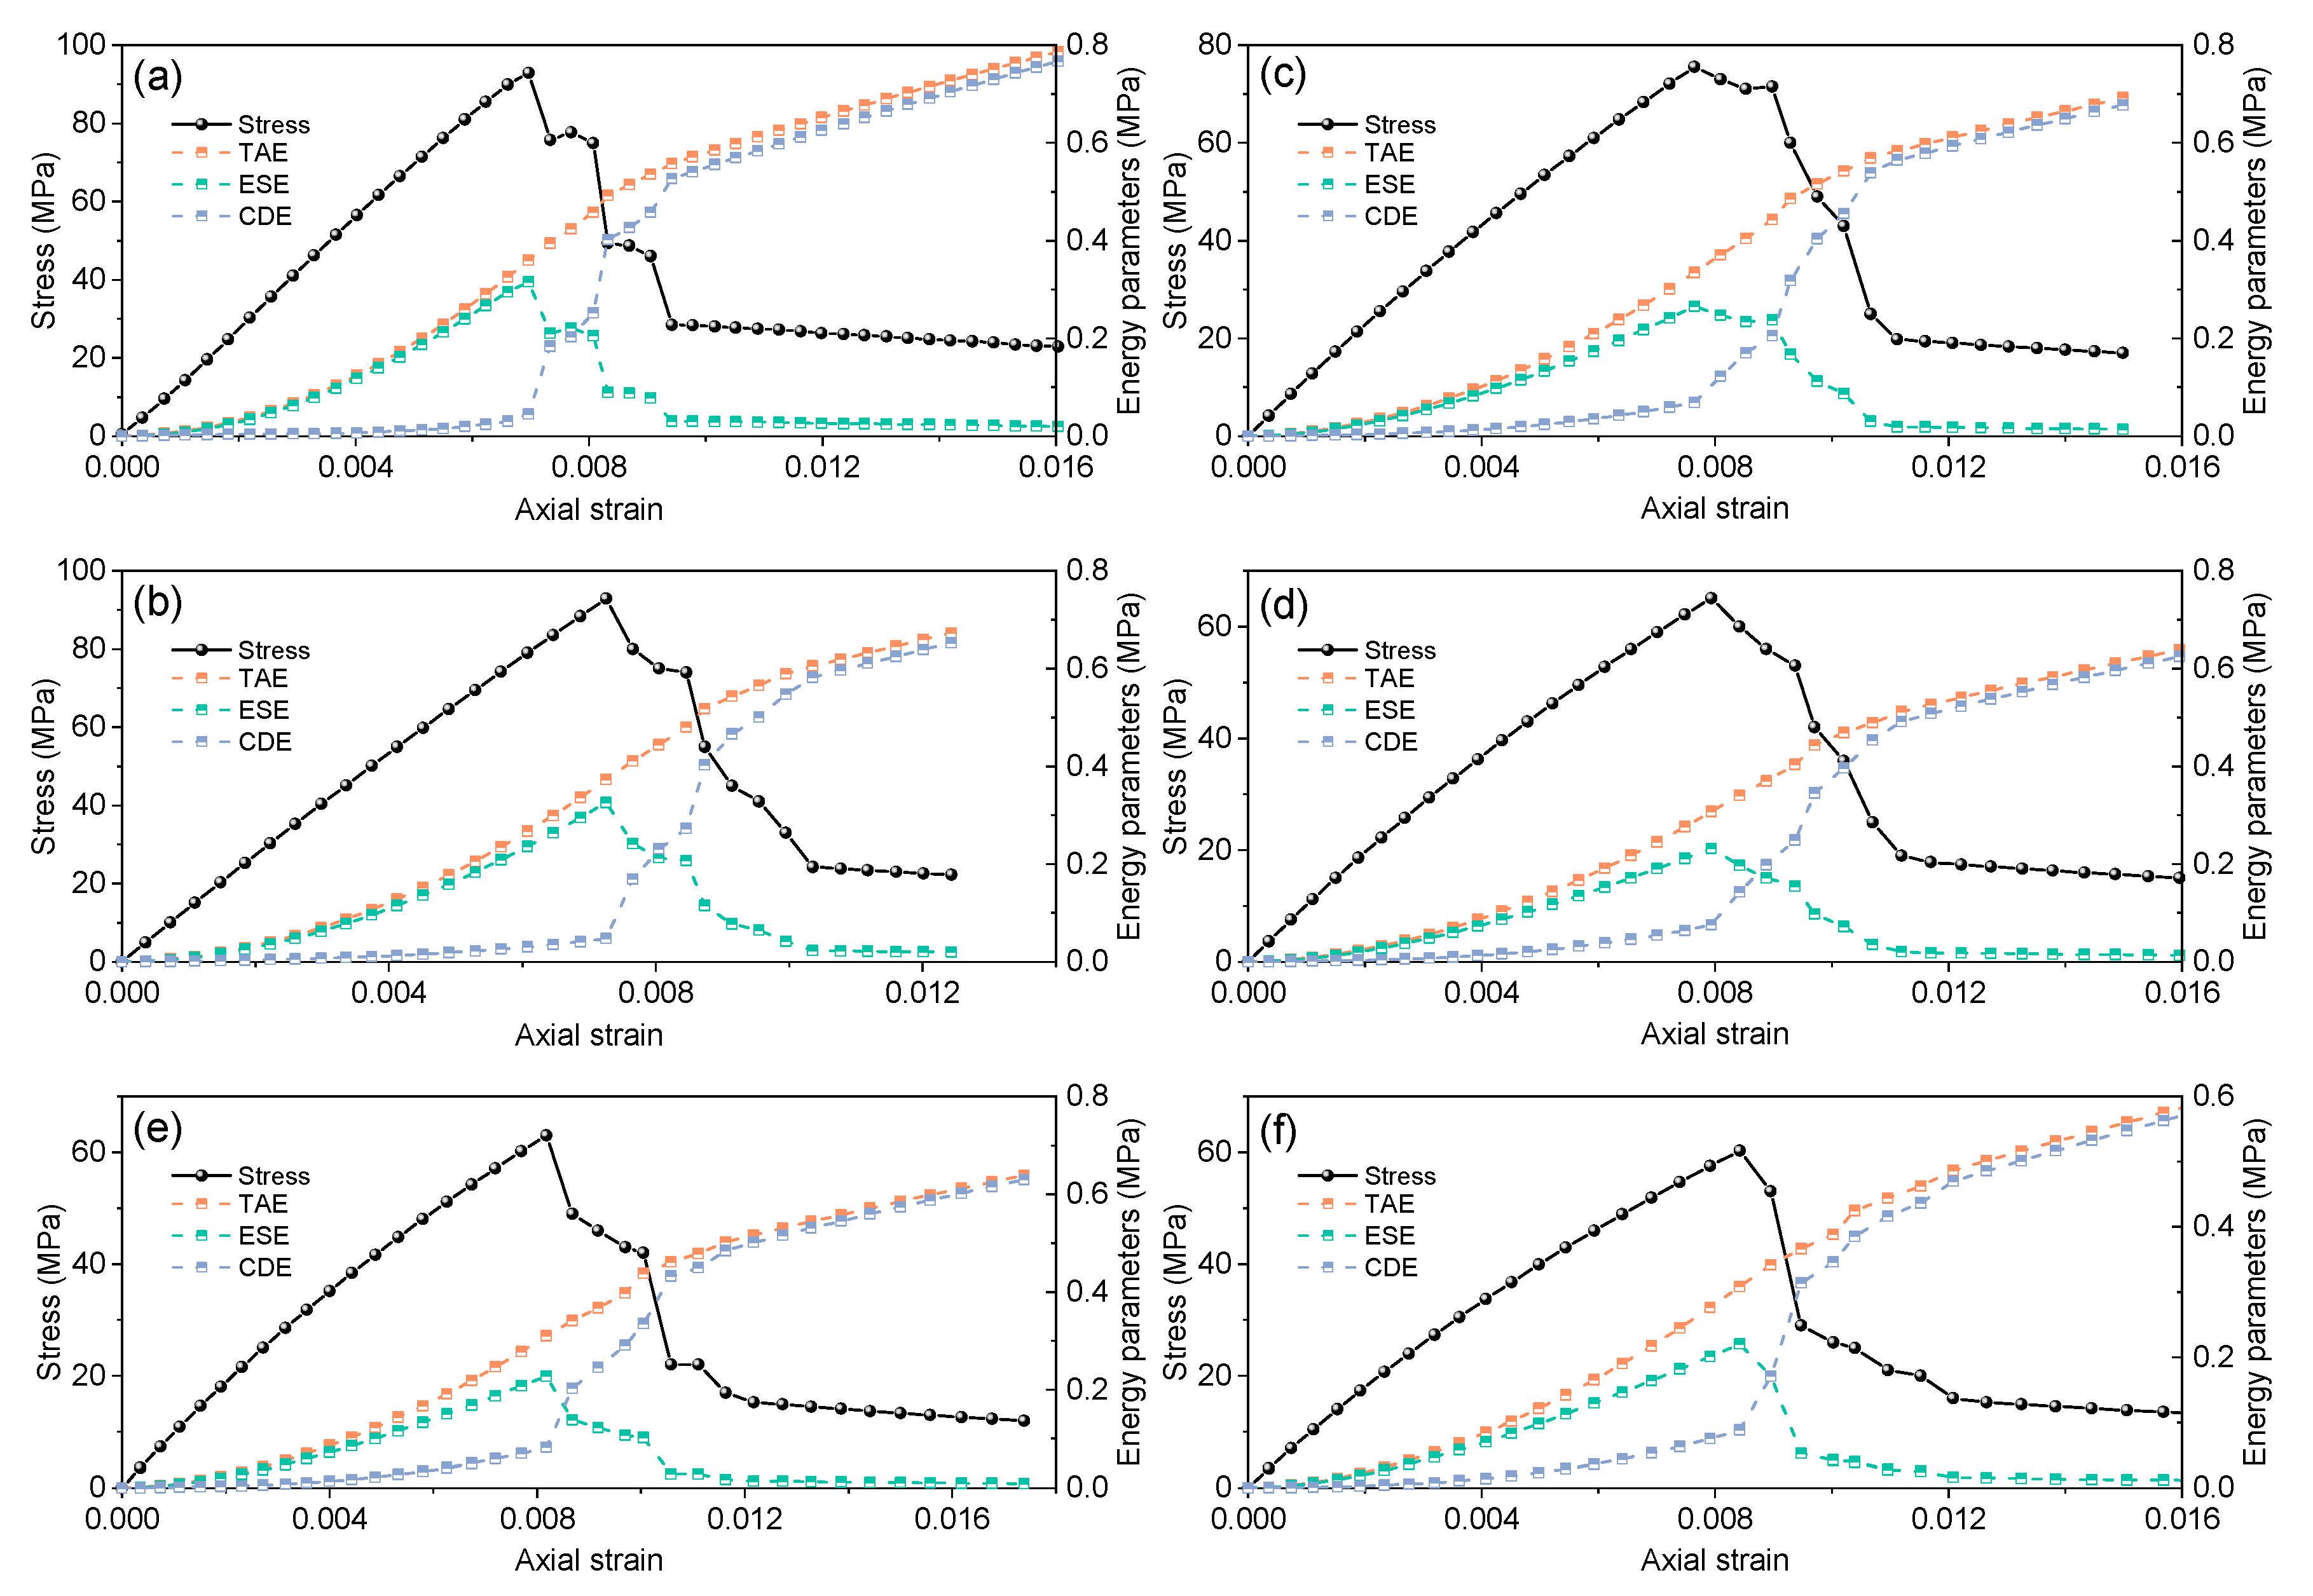
3.3. Energy Evolution Laws of the Rocks

Based on the stress–strain curves of the rocks under different DWCs, the energy parameters (including elastic strain energy (ESE), cumulative dissipation energy (CDE), and total absorption energy (TAE)) at a given stress state can be determined by the energy conservation theory. The calculation equations can be found in the previous literature [31,32]. Energy evolution laws of the rocks under different CPs have all of the same types of images, so only the energy evolution curve at 2 MPa of CP can be displayed. Figure 8 presents the energy evolution laws of the rocks under different DWCs at 2 MPa of CP. As shown in Figure 8, the ESE and the CDE increase with increasing the axial strain before the PS. After the PS, the CDE still increases, while the ESE gradually decreases. Due to the generation, development, and coalescence of the microcracks, more energy needs to be consumed. Especially in the post-peak stage, the rapid propagation of the microcracks leads to the destruction of intact rocks, which consumes a lot of energy. Additionally, the ESE/TAE ratio is significantly greater than the CDE/TAE ratio before the PS, especially in the elastic deformation stage. Nevertheless, the CDE/TAE ratio gradually increases after the PS to be even higher than the ESE/TAE ratio in the process of post-peak stress drop. In the residual deformation stage, the CDE/TAE ratio keeps unchanged. Similarly, the ESE/TAE ratio has the same change law. To further determine the energy evolution laws under different DWCs, the results at 2 MPa of CP are taken as an example, as shown in Figure 8. With an increase in the cycles, the TAE, the ESE, and the CDE decrease gradually. At the PS, the ESE/TAE ratio gradually decreases with increasing the cycles, while the CDE/TAE ratio gradually increases. Furthermore, the TAE and the ESE are reduced by 14.4% and 30.1% at the PS, respectively, while the CDE increases abruptly. The TAE and the ESE show a linear decline trend with increasing the DWCs, while the CDE presents a linear growth trend. The results imply that when the rock undergoes the DWCs, the rock’s ability to accumulate energy decreases, but the ability to transform ESE into dissipation energy increases, which makes the rock more prone to failure. The reason is that the hydrophilic minerals, soluble minerals, and water in the rock mass react to a certain extent after the rock mass is soaked, which increases the softening and dilution of the rock and reduces its strength.
At 4 MPa of CP, the energy evolution laws under different DWCs are also revealed. Similar to the condition of σ3 = 2 MPa, the TAE, the ESE, and the CDE decrease gradually with increasing the cycles at the PS. When the rock specimens are subjected to 20 DWCs, the TAE and the ESE are reduced by 12.7% and 20.2% at the PS, respectively, while the CDE increases abruptly. Simultaneously, the ESE/TAE ratio gradually decreases from 85.1% to 60.3% with the increase in the cycles at the PS, while the CDE/TAE ratio gradually increases from 17.5% to 65.8%. Furthermore, compared to the condition of σ3 = 2 MPa, the TAE and the ESE increase by 8.8% and 5.8% at the 0 cycle, respectively, and they increase by 10.9% and 20.9% at the 20th cycle, respectively. Moreover, compared to the condition of σ3 = 2 MPa, the ESE/TAE ratio decreases by 2.7% at the 0 cycle, and the CDE/TAE ratio increases by 22.5%. However, the ESE/TAE ratio decreases by 15.6% at the 20th cycle, and the CDE/TAE ratio increases by 64.6%.
At 8 MPa of CP, the energy evolution laws under different DWCs are also revealed. Similar to the conditions of σ3 = 2 MPa and σ3 = 4 MPa, the TAE, the ESE, and the CDE also decrease gradually with increasing the cycles at the PS. When the rock specimens are subjected to 20 DWCs, the TAE and the ESE are reduced by 5.8% and 24.3% at the PS, respectively, while the CDE also increases abruptly. Simultaneously, the ESE/TAE ratio gradually decreases from 72.3% to 58.1% with the increase in the cycles at the PS, while the CDE/TAE ratio gradually increases from 38.4% to 72.2%. Furthermore, compared to the condition of σ3 = 2 MPa, the TAE and the ESE increase by 79.1% and 47.9% at the 0 cycle, respectively, and they increase by 97.0% and 60.1% at the 20th cycle, respectively. Moreover, compared to the condition of σ3 = 2 MPa, the ESE/TAE ratio decreases by 17.4% at the 0 cycle, and the CDE/TAE ratio increases by 169.4%. However, the ESE/TAE ratio decreases by 18.7% at the 20th cycle, and the CDE/TAE ratio increases by 80.6%.
At 16 MPa of CP, the energy evolution laws under different DWCs are also revealed. Similar to the conditions of σ3 = 2 MPa, σ3 = 4 MPa, and σ3 = 8 MPa, the TAE, the ESE, and the CDE also decrease gradually with increasing the cycles at the PS. When the rock specimens are subjected to 20 DWCs, the TAE and the ESE are reduced by 5.0% and 18.1% at the PS, respectively, while the CDE also increases abruptly. Simultaneously, the ESE/TAE ratio gradually decreases from 75.3% to 64.9% with the increase in the cycles at the PS, while the CDE/TAE ratio gradually increases from 32.8% to 54.1%. Furthermore, compared to the condition of σ3 = 2 MPa, the TAE and the ESE increase by 202.7% and 160.4% at the 0 cycle, respectively, and they increase by 235.9% and 205.1% at the 20th cycle, respectively. Moreover, compared to the condition of σ3 = 4, the ESE/TAE ratio decreases by 14.0% at the 0 cycle, and the CDE/TAE ratio increases by 130.2%. However, the ESE/TAE ratio decreases by 9.2% at the 20th cycle, and the CDE/TAE ratio increases by 35.4%.
According to the above-mentioned results, the larger the CP is, the more energy will be absorbed inside the rock, and the more ESE will be converted into the CDE. Furthermore, at the same CP, the ability of the rock specimen to absorb the energy gradually decreases with the increase in the DWCs. The reason may be that in the process of the water–rock interaction, the mechanical parameters of the rock specimens have prominent deterioration trends. When the PS is reached, the corresponding strain gradually increases, and the rock specimens have a gradual softening tendency. Therefore, the microcracks in the rock increase progressively, so the ability to store the ESE is greatly reduced.

4. Discussion

4.1. Damage Evolution Process under Different DWCs

Based on what is mentioned above, the strength of the rocks undergoes irreversible deterioration under different DWCs. The DV is usually used to represent the degree of irreversible deterioration of the rock specimens. The definition of the DV proposes various parameters, including the elastic modulus, ultrasonic velocity, the RS, the PS, the CDE, and so on [31]. In this study, we select the dissipation energy to determine the DV [28]. The variable laws of the dissipation energy are presented in Section 3.3. Therefore, the variation laws of the DV under different DWCs are revealed. The results indicate that the damage evolution laws under different DWCs have similar characteristics. Figure 9 presents the typical damage evolution curve of the rock specimens. In Figure 9, there is a one-to-one correspondence between the damage evolution curve and the deformation stages of the rocks. For example, the initial reduction stage in the damage evolution curve corresponds to the upward concave part of the stress–strain curve, which is the compaction stage of rock deformation and failure that takes the CCS as the upper limit of the critical value and the initial loading point as the lower limit. After exceeding the CCS, the D = 0 part of the damage evolution curve corresponds to the elastic deformation stage that takes the CIS as the upper limit of the critical value and the CCS as the lower limit. Afterward, the upward concave part of the damage evolution curve corresponds to the crack propagation stage of the rock deformation and failure that takes the PS as the upper limit of the critical value and the CIS as the lower limit. Subsequently, the upward convex part of the damage evolution curve corresponds to the post-peak softening stage that takes the RS as the upper limit of the critical value and the PS as the lower limit. Finally, the D = 1 part in the damage evolution curve approximately corresponds to the residual deformation stage after exceeding the RS.
To further expose the damage evolution laws of the rocks under different DWCs, the DVs that correspond to the four stress threshold values, including initial stress, the CIS, the PS, and the RS, are determined, as shown in Figure 10. The values in the outer circle represent the DWCs, and the semidiameters in different circles represent the CP in Figure 10. The initial DV gradually decreases with increasing DWCs and also decreases with increasing CP. According to the contour map in Figure 10a, the initial DV varies greatly, which shows that both the CP and the cycles have significant influences on the initial DV. Significantly, under lower DWCs, the characteristic is exhibited more obviously. In Figure 10b, the DV at the CIS gradually increases with increasing DWCs and also increases with increasing CP. Herein, under low CPs or few cycles, the difference between the DV at the CIS and the initial DV is greater than that under high CPs or high number of cycles. The difference is because of different degrees of microcrack compaction and variable loading stress under other CPs. Generally, the occurrence of new microcracks decreases under low CP, and the CDE is relatively small, which leads to a relatively low difference. In Figure 10c, the DV at the PS gradually increases with increasing DWCs and also linearly increases with increasing CP. Compared to the DV at the CIS, the DV at the PS has almost increased by 1.5–2 times under different CPs. After the PS, the DV increases abruptly. In Figure 10d, the DV at the RS generally decreases with increasing CP, while having no apparent laws with the DWCs. At the residual deformation stage, the DV is up to 0.9–0.95, even almost 1. Finally, the DV remains virtually unchanged. Meanwhile, only a tiny amount of the ESE remains in the rock specimens, and most of the CDE is consumed in the process of the coalescence of the microcracks. In conclusion, although a large number of the micropores or the microcracks are formed due to the dissolution of organic matter, increasing internal defects, the mechanical properties of the rock specimens are not abruptly optimized due to the influence of the CP. Therefore, the effect of the CP on the DV is more significant than that on the DWCs.
According to what is mentioned above, the rock deformation enters the crack propagation stage after the CIS, the rock suffers irreversible damage, and the energy is consumed in this process. Therefore, the CIS is the starting point to analyze the damage strain rate proposed in this study. The damage strain rate in the pre-peak is defined as the increase in the DV divided by the increase in the axial strain during the period between the CIS and the PS. Similarly, the damage strain rate in the post-peak is defined as the increase in the DV divided by the increase in the axial strain during the period between the PS and the RS. The damage strain rates represent the increased rates of rock damage, which are expressed as follows.
D pre = ( D p D c i ) / ( ε p ε c i )
D post = ( D p D r ) / ( ε p ε r )
where Dpre and Dpost are the damage strain rates in the pre-peak and the post-peak, respectively; Dp, Dci, and Dr are the DV in the PS, the CIS, and the RS, respectively; and εp, εci, and εr are the axial strains in the PS, the CIS, and the RS, respectively.
Based on the results from the tests, the damage strain rates in the pre-peak and post-peak are deuced at different DWCs. Figure 11 shows the calculated damage strain rates. Except for the condition at the 20th cycle, the damage strain rate in the pre-peak nearly increases with the CP and then decreases. At the 20th cycle, the damage strain rate in the pre-peak decreases linearly with the CP, and it can be fitted accurately using a linear function. At the same CP, the damage strain rate in the pre-peak nearly increases with the DWCs. In a few cases, the change in the damage strain rate in the pre-peak has no obvious laws, such as the condition at the 20th cycle. Except for the conditions at the 10th and 20th cycle, the damage strain rate in the post-peak nearly increases with the CP, then decreases, and finally keeps relatively stable. At the 10th and 20th cycle, it firstly decreases with the CP, then increases, and finally keeps stable. This illustrates that the high CP has little effect on the damage strain rate in the post-peak. Moreover, at the same CP, the damage strain rate in the post-peak also nearly increases with the DWCs. Therefore, the DWC is more sensitive to the rock damage, while the CP is less sensitive to the rock damage.

4.2. Brittleness Evaluation of the Rocks

Rock brittleness is very important for evaluating rock failure characteristics [33,34,35]. Many practical engineering problems can be abstracted to corresponding rock brittleness. For example, the brittleness of shale is significant for assessing the fracturing ability of shale reservoirs. For the rocks in the TGR area, knowing the brittleness of the rocks is beneficial to evaluating the deformation and failure mechanism of rock. Therefore, a considerable understanding of the rock brittleness is crucial to accurately estimate the brittleness. A BI is an index that characterizes rock brittleness. Currently, many BIs are defined based on different expressions, including elastic parameters, mineral compositions, strain parameters, strength parameters, and energy parameters [36,37]. The relationships between damage evolution and rock brittleness are complex and interconnected. Damage evolution refers to the process by which internal damage, such as microcracks or fractures, progresses within a rock under external loading or stress. Rock brittleness, on the other hand, describes the tendency of a rock to undergo sudden and catastrophic failure when subjected to stress. According to the literature [36,37,38], the energy evolution characteristics in the pre-peak and post-peak stages are very crucial to the evaluation of the rock brittleness. Additionally, the damage strain rate is a parameter that is related to the energy parameters and the axial strain. Therefore, we select the damage strain rates in the pre-peak and post-peak in relation to the rock brittleness. On this basis, a novel BI, the BInew, is defined based on Dpre and Dpost, and the formula is as follows:
B I new = log ( D pre × D post )
To validate the applicability of the novel BI, three previous BIs that are defined by using the stress and strain are used for a comparative study with the BInew. According to the previous literature [36,37,39], the BIs that are utilized to compare with the BInew are expressed as follows:
B I 1 = ( ε r ε p ) / ε p
B I 2 = ( σ p σ r ) / σ p
B I 3 = ( σ p σ r ) / ( ε r ε p ) + ( σ p σ r ) ( ε r ε p ) / σ p ε p
where σp and σr are the PS and the RS, respectively, and εp and εr are the peak strain and the residual strain, respectively.
Figure 12 shows that the BIs that are calculated by different methods vary greatly. For instance, the BI1 is defined based on the axial strain, while the BI2 is defined based on the axial stress. However, the BI3 is determined by simultaneously using the axial strain and the axial stress. In Figure 12, the variation laws of these BIs after normalization (N-BI) with the CP and the DWCs are revealed. The normalization of BIs ranging from 0 to 1 is distinguished by different colors. For the N-BI1, it gradually increases with increasing the CP at the same DWC. Nevertheless, at the same CP, the N-BI1 has no linear change trend with the DWC. Under the same low CP, the value of the N-BI1 changes little. Significantly, under high CP, the value of the N-BI1 firstly increases and then decreases with the DWCs. Similarly, the N-BI2 also gradually increases with increasing the CP at the same DWC. However, under the same CP, the value of the N-BI2 firstly increases and then decreases with the DWCs. Obviously, the maximum N-BI2 corresponds to the N-BI2 at the 10th cycle and 4 MPa of CP, which can be seen in the projection graph in Figure 12b. In general, the variation law of the N-BI1 is almost the same as that of the N-BI2. Furthermore, both the N-BI1 and the N-BI2 are more sensitive to the CP than the DWC.
For N-BI3, its change trend is entirely different from those of the N-BI1 and the N-BI2, as shown in Figure 12c. The N-BI3 gradually increases with increasing the DWC at the same CP. Nevertheless, at the same DWC, the N-BI1 has no linear change trend with the CP and the DWC. Significantly, under the same high DWC, the value of the N-BI1 has changed little with increasing the CP. The N-BI3 can only reflect the influence of the presence or absence of the water on the rock brittleness, but it cannot distinguish the influence of the DWCs on the rock brittleness. Thus, the N-BI2 is more sensitive to the DWC than the CP. Finally, significant differences in the N-BInew determined by the damage strain rate can be observed in Figure 12d. These differences are majorly presented in the changing trend of the N-BInew with the CP and the DWCs. In general, the N-BInew gradually increases with increasing the CP at the same DWC. At certain points, the change laws vary. Nevertheless, at the same CP, the N-BInew has no linear change trend with the DWC. Even so, the N-BInew is more likely to reflect the brittleness property of the rock. For example, the N-BInew changes more hierarchically and regularly as the CP changes. The value of the N-BInew is different even with the same CP or DWC. The advantage is mainly attributed to adopting the damage strain rate in the proposed BI. The reason is probably that the definition of the BInew makes full use of the stress and strain curve, since the curve before and after the PS is used to determine the BInew. Other BIs mainly employ the parameters after the PS. Therefore, they can only partially characterize the brittleness property of the rocks, while the proposed BI is reliable and exhibits superiority.

4.3. Failure Mechanism of the Rocks under the DWCs

According to the above analysis, the energy evolution laws, the damage evolution laws, and the brittleness properties of the red-bed soft rocks at different DWCs and different CPs are revealed. On this basis, the mechanical properties of the red-bed rocks deteriorate gradually under the water–rock interaction. There is a mutual influence among the deformation and failure mechanisms, mechanical properties, and brittleness of rocks. The mechanical properties affect the stability and deformation capacity of rocks, damage evolution affects the stability and strength of rocks, and rock brittleness determines the mode of failure when rocks are subjected to stress. The failure mechanism of the rocks under the water–rock interaction can be summarized as follows, which can be explained in three parts, as shown in Figure 13:
(1)
In the wetting process
Firstly, the water that acts as a lubricant enters the rock mass through weak layers, reducing friction between the particles. The mineral particles of the red-bed soft rock include quartz, feldspar, calcite, dolomite, montmorillonite, illite, chlorite, and other clay minerals. Clay minerals also expand with the absorption of the water. Still, the expansion rate of their surface and volume is not entirely synchronized, resulting in tensile stress on the surface of the mineral particles. Thus, the surface of the clay minerals will produce microcracks. These microcracks provide a good channel for the water to react more fully with the mineral particles. Under the action of the water, the chemical reactions of the feldspar, the calcite, and the clay minerals produce new minerals or migrate and diffuse, thus changing the types of the minerals and the microstructure of rock mass.
(2)
In the drying process
Afterward, water-soluble minerals will evaporate and precipitate in the rock mass in the drying process. During the soaking, the water-soluble minerals flow along the fissure with water. After the water evaporation, the water-soluble minerals distributed around the insoluble minerals are left, which produces certain crystal pressure on the insoluble minerals. At the same time, the volume of the clay minerals will change with the water evaporation, resulting in further production of microcracks.
(3)
In the loading process
Finally, there are many microcracks inside the rock mass in the process of a DWC and loading. Under the action of axial and circumferential stresses, the microcracks inside the rock mass have more easily coalesced, and large cracks are produced under small stresses. With the increase in the DWCs, the rock damage gradually accumulates. The microcracks and micropores generated by a DWC may not be very obvious, but after many cycles, the microcracks and micropores inside the rocks accumulate and develop gradually. Afterward, these cracks and pores gradually develop into macrocracks and fissures, which can also be well verified by SEM photos and secondary porosity statistics of the rocks. In other words, the cracks and pores between the mineral particles gradually extend with the increase in the DWCs, and the secondary porosity of the rocks gradually increases. Therefore, the microstructure of the rocks gradually changes from a compact state to a loose state. In conclusion, it is the accumulation and development of these microstructures that leads to the deterioration of the macroscopic physical and mechanical properties of red-bed soft rocks.

5. Conclusions

(1)
Results reveal a decrease in PS, RS, and elastic modulus with increasing DWCs and an increase with increasing CP. Furthermore, the DWCs lead to progressive and irreversible damage to the rock specimens.
(2)
The study explores the variation laws of energy parameters under different CPs and DWCs. The TAE shows a positive correlation with CP, as more energy is absorbed by the rock specimen under loading. Additionally, the energy conversion ratio of the ESE into the CDE also increases with loading. However, the ability of the rock specimen to absorb energy gradually reduces with increasing DWCs.
(3)
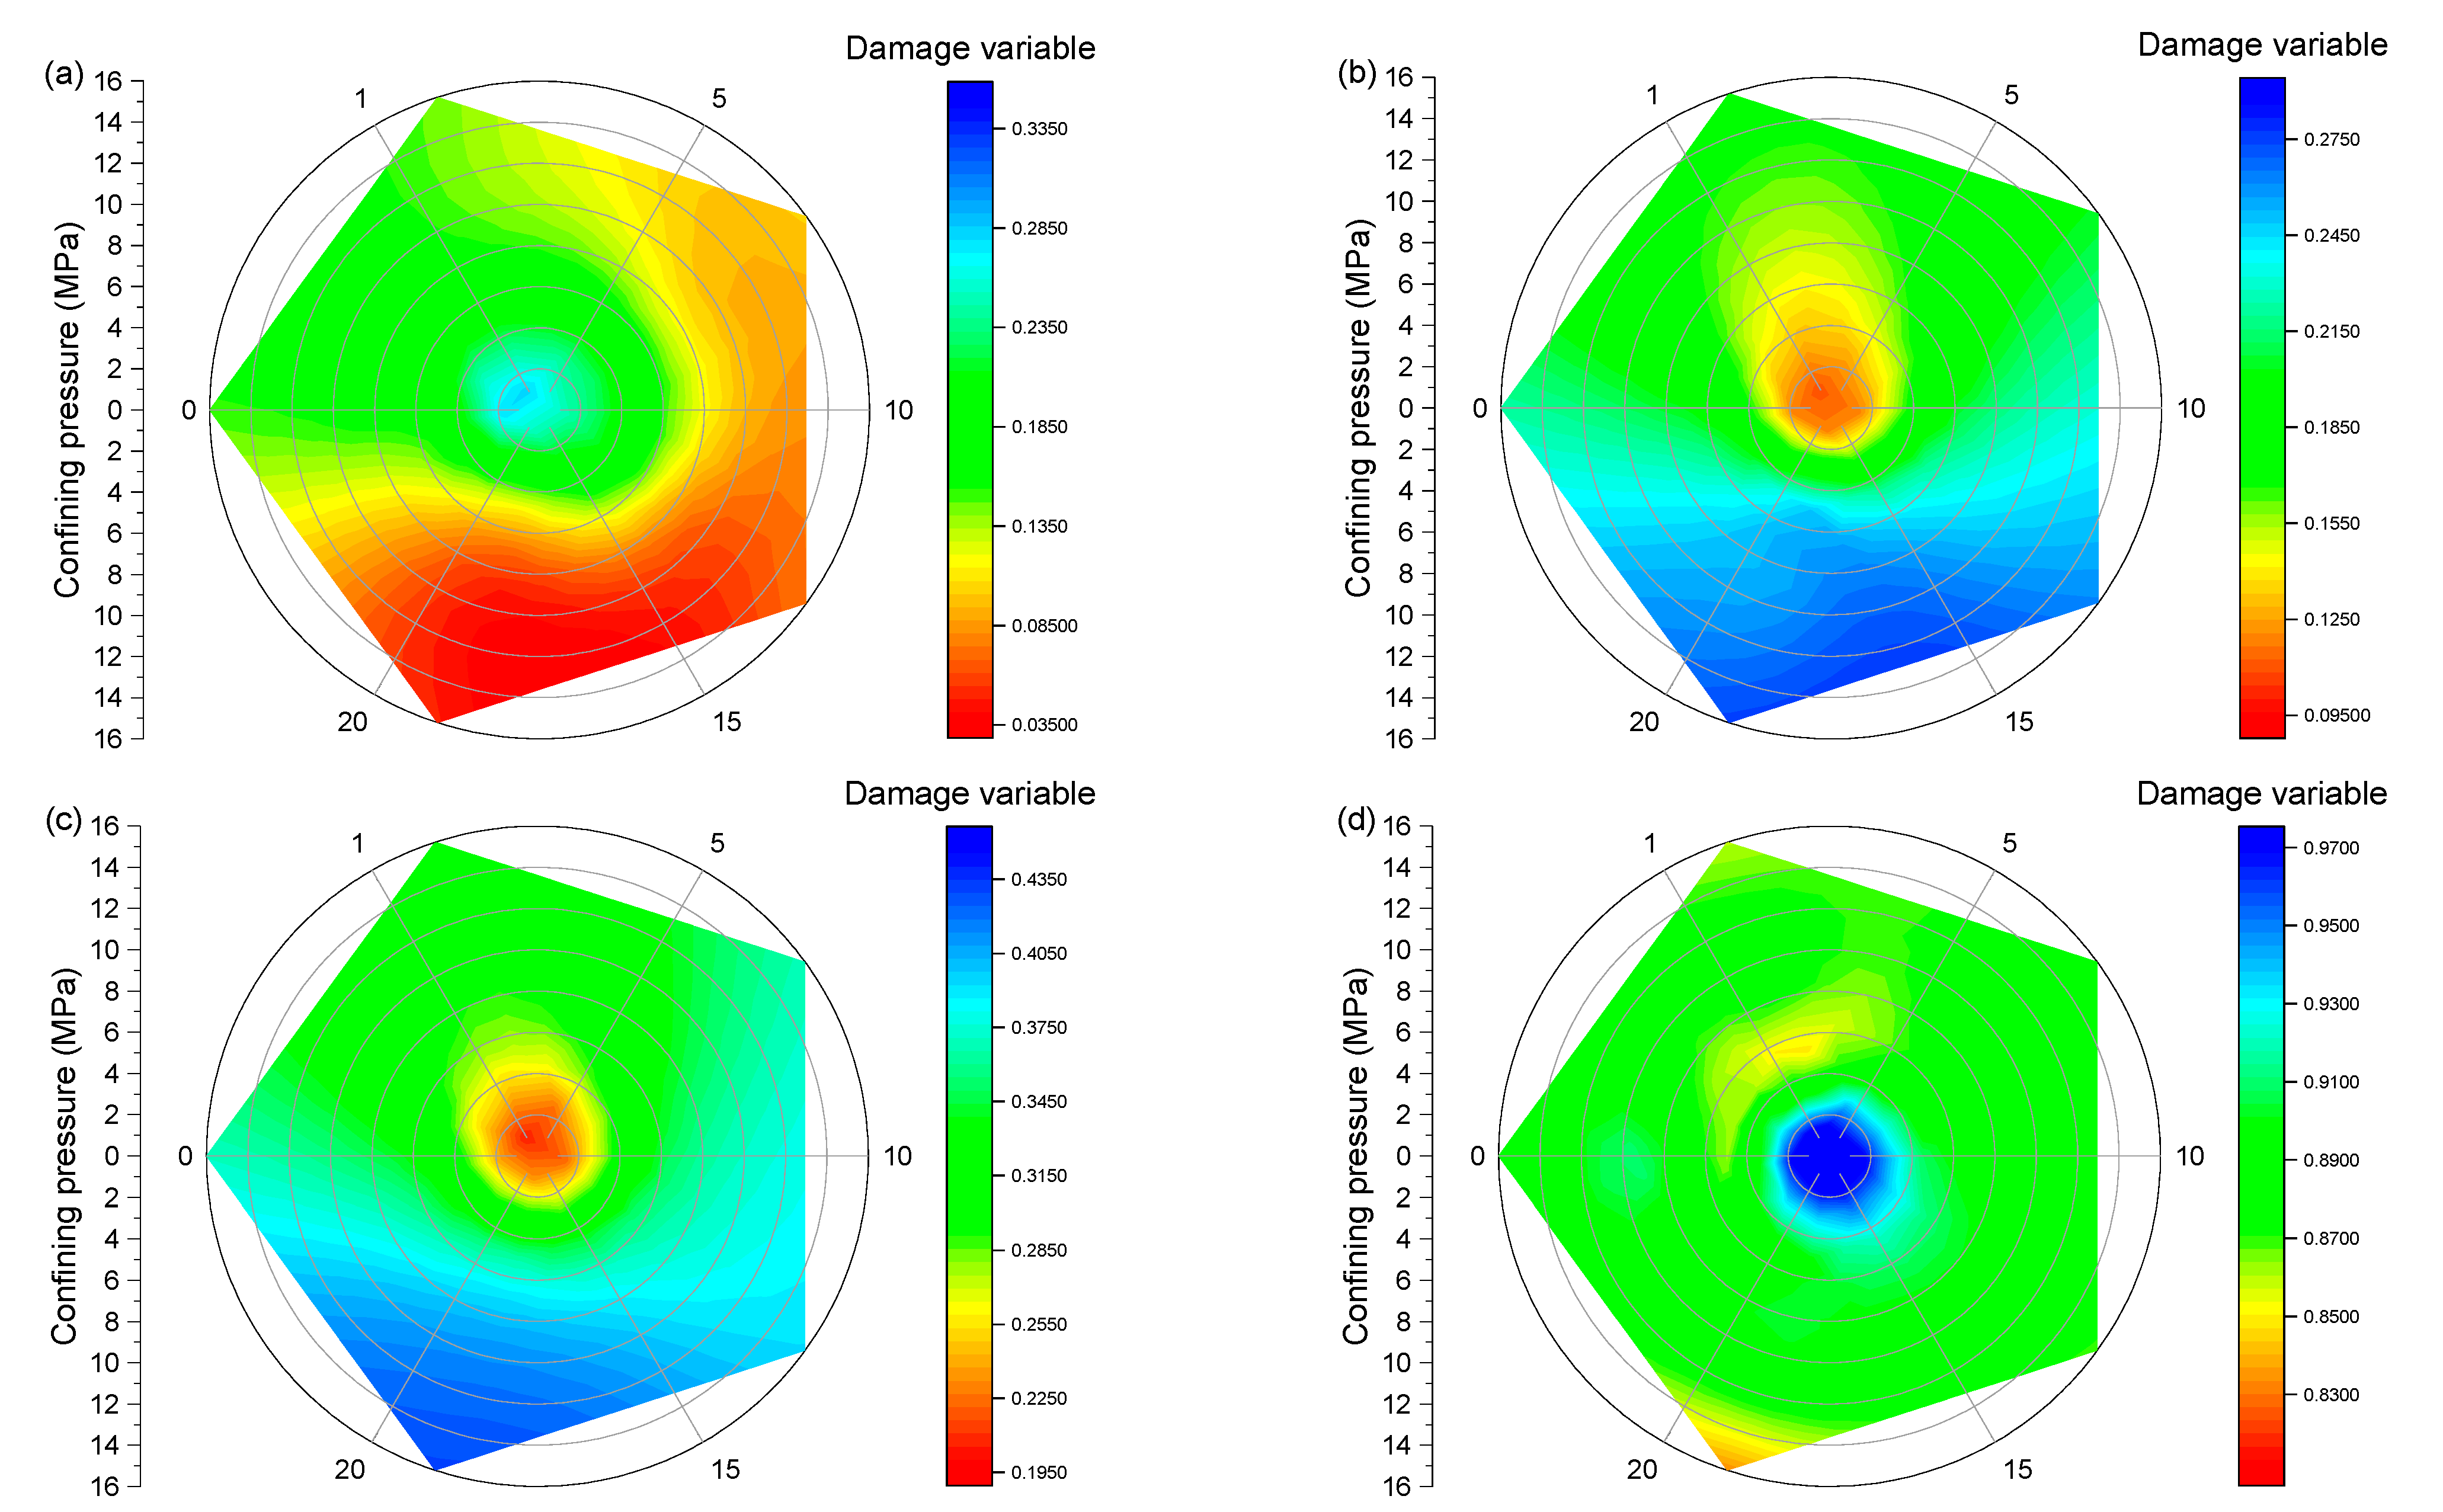
The study uses the damage variable (DV) to reveal the evolution laws of rock damage under different DWCs. Results illustrate that the CP has a more significant effect on the DV than DWCs. Furthermore, the study proposes damage strain rates in the pre-peak and post-peak stages of loading. Results show that high CP has little effect on the damage strain rates in the post-peak.
(4)
The study introduces a novel brittleness index (BI) for estimating rock brittleness, which considers pre- and post-PS energy evolution through damage strain rate analysis. The study demonstrates the effectiveness of the novel BI by examining the influence of DWC and CP on rock brittleness. Furthermore, a comparative evaluation with three previous indexes highlights the superiority of the novel index.
(5)
The failure mechanism of the rocks under the water–rock interaction can be summarized in three parts, namely the production of the microcracks in the wetting process, the drying process, and the accumulation and development of rock damage in the loading process.

Author Contributions

T.W.: Methodology, Formal analysis, Investigation, Validation, Writing—original draft. Y.W.: Methodology, Supervision. H.T.: Supervision, Project administration. J.Z.: Methodology. M.H.: Supervision, Project administration, Funding acquisition. All authors have read and agreed to the published version of the manuscript.

Funding

The work was funded by the National Natural Science Foundation of China (No. 42002268); Science and technology program of Tibet Autonomous Region (XZ202202YD0007C, XZ202301YD0034C); Open Fund of Badong National Observation and Research Station of Geohazards (No. BNORSG-202204); and Open Foundation of Engineering Research Center of Rock-Soil Drilling & Excavation and Protection, Ministry of Education (202211).

Data Availability Statement

The datasets generated during and/or analyzed during the current study are available from the corresponding author on reasonable request.

Conflicts of Interest

The authors declare no conflict of interest.

References

  1. Doostmohammadi, R.; Moosavi, M.; Mutschler, T.; Osan, C. Influence of cyclic wetting and drying on swelling behavior of mudstone in south west of Iran. Environ. Geol. 2009, 58, 999–1009. [Google Scholar] [CrossRef]
  2. Gholami, R.; Rasouli, V.; Sarmadivaleh, M.; Minaeian, V.; Fakhari, N. Brittleness of gas shale reservoirs: A case study from the north Perth basin, Australia. J. Nat. Gas Sci. Eng. 2016, 33, 1244–1259. [Google Scholar] [CrossRef] [Green Version]
  3. Gratchev, I.; Pathiranagei, S.V.; Kim, D.H. Strength properties of fresh and weathered rocks subjected to wetting-drying cycles. Geomech. Geophys. Geo-Energy Geo-Resour. 2019, 5, 211–221. [Google Scholar] [CrossRef] [Green Version]
  4. Hafhouf, I.; Bahloul, O.; Abbeche, K. Effects of drying-wetting cycles on the salinity and the mechanical behavior of sebkha soils. A case study from Ain M’Lila, Algeria. Catena 2022, 212, 106099. [Google Scholar] [CrossRef]
  5. Li, X.S.; Peng, K.; Peng, J.; Hou, D. Experimental investigation of cyclic wetting-drying effect on mechanical behavior of a medium-grained sandstone. Eng. Geol. 2021, 293, 106335. [Google Scholar] [CrossRef]
  6. Li, X.S.; Peng, K.; Peng, J.; Xu, H.H. Effect of cyclic wetting-drying treatment on strength and failure behavior of two Quartz-Rich sandstones under direct shear. Rock Mech. Rock Eng. 2021, 54, 5953–5960. [Google Scholar] [CrossRef]
  7. Liu, X.R.; Jin, M.H.; Li, D.L.; Zhang, L. Strength deterioration of a Shaly sandstone under dry-wet cycles: A case study from the Three Gorges Reservoir in China. Bull. Eng. Geol. Environ. 2018, 77, 1607–1621. [Google Scholar] [CrossRef]
  8. Ng, C.W.W.; Peprah-Manu, D. Pore structure effects on the water retention behaviour of a compacted silty sand soil subjected to drying-wetting cycles. Eng. Geol. 2023, 313, 106963. [Google Scholar] [CrossRef]
  9. Ngoc, T.P.; Fatahi, B.; Khabbaz, H. Impacts of drying-wetting and loading-unloading cycles on small strain shear modulus of unsaturated soils. Int. J. Geomech. 2019, 19, 04019090. [Google Scholar] [CrossRef]
  10. Nicksiar, M.; Martin, C.D. Crack initiation stress in low porosity crystalline and sedimentary rocks. Eng. Geol. 2013, 154, 64–76. [Google Scholar] [CrossRef]
  11. Rahimzadeh Kivi, I.; Zare-Reisabadi, M.; Saemi, M.; Zamani, Z. An intelligent approach to brittleness index estimation in gas shale reservoirs: A case study from a western Iranian basin. J. Nat. Gas Sci. Eng. 2017, 44, 177–190. [Google Scholar] [CrossRef]
  12. Rybacki, E.; Meier, T.; Dresen, G. What controls the mechanical properties of shale rocks?—Part II: Brittleness. J. Pet. Sci. Eng. 2016, 144, 39–58. [Google Scholar] [CrossRef] [Green Version]
  13. Özbek, A. Investigation of the effects of wetting-drying and freezing-thawing cycles on some physical and mechanical properties of selected ignimbrites. Bull. Eng. Geol. Environ. 2014, 73, 595–609. [Google Scholar] [CrossRef]
  14. Rahimzadeh Kivi, I.; Ameri, M.; Molladavoodi, H. Shale brittleness evaluation based on energy balance analysis of stress-strain curves. J. Pet. Sci. Eng. 2018, 167, 1–19. [Google Scholar] [CrossRef]
  15. Shen, P.W.; Tang, H.M.; Huang, L.; Wang, D.J. Experimental study of slaking properties of red-bed mudstones from the Three Gorges Reservoir area. Mar. Georesour. Geotechnol. 2019, 37, 891–901. [Google Scholar] [CrossRef]
  16. Shen, P.W.; Tang, H.M.; Tannant, D.D.; Ning, Y.B. Impact of cyclic wetting and drying on slate properties in the Miaowei Reservoir area, southwest China. Bull. Eng. Geol. Environ. 2022, 81, 145. [Google Scholar] [CrossRef]
  17. Sumner, P.D.; Loubser, M.J. Experimental sandstone weathering using different wetting and drying moisture amplitudes. Earth Surf. Process. Landf. 2008, 33, 985–990. [Google Scholar] [CrossRef]
  18. Tang, H.M.; Wasowski, J.; Juang, C.H. Geohazards in the three Gorges Reservoir Area, China-Lessons learned from decades of research. Eng. Geol. 2019, 261, 105267. [Google Scholar] [CrossRef]
  19. Tang, S.B.; Yu, C.Y.; Heap, M.J.; Chen, P.Z.; Ren, Y.G. The influence of water saturation on the short- and long-term mechanical behavior of red sandstone. Rock Mech. Rock Eng. 2018, 51, 2669–2687. [Google Scholar] [CrossRef]
  20. Wang, L.Q.; Yin, Y.P.; Huang, B.L.; Dai, Z.W. Damage evolution and stability analysis of the Jianchuandong Dangerous Rock Mass in the Three Gorges Reservoir Area. Eng. Geol. 2020, 265, 105439. [Google Scholar] [CrossRef]
  21. Wen, T.; Tang, H.M.; Wang, Y.K. Brittleness evaluation based on the energy evolution throughout the failure process of rocks. J. Pet. Sci. Eng. 2020, 194, 107361. [Google Scholar] [CrossRef]
  22. Wen, T.; Tang, H.M.; Ma, J.W.; Liu, Y.R. Energy analysis of the deformation and failure process of sandstone and damage constitutive model. KSCE J. Civ. Eng. 2019, 23, 513–524. [Google Scholar] [CrossRef]
  23. Wen, T.; Tang, H.M.; Huang, L.; Wang, Y.K.; Ma, J.W. Energy evolution: A new perspective on the failure mechanism of purplish-red mudstones from the Three Gorges Reservoir area, China. Eng. Geol. 2020, 264, 105350. [Google Scholar] [CrossRef]
  24. Wen, T.; Tang, H.M.; Ma, J.W.; Wang, Y.K. Evaluation of methods for determining crack initiation stress under compression. Eng. Geol. 2018, 235, 81–97. [Google Scholar] [CrossRef]
  25. Wen, T.; Tang, H.M.; Wang, Y.K.; Ma, J.W. Evaluation of methods for determining rock brittleness under compression. J. Nat. Gas Sci. Eng. 2020, 78, 103321. [Google Scholar]
  26. Wen, T.; Tang, H.M.; Wang, Y.K.; Ma, J.W.; Fan, Z.Q. Mechanical characteristics and energy evolution laws for red bed rock of badong formation under different stress paths. Adv. Civ. Eng. 2019, 2019, 8529329. [Google Scholar] [CrossRef]
  27. Whiteley, J.S.; Chambers, J.E.; Uhlemann, S.; Wilkinson, P.B.; Kendall, J.M. Geophysical monitoring of moisture-induced landslides: A review. Rev. Geophys. 2019, 57, 106–145. [Google Scholar] [CrossRef] [Green Version]
  28. Wu, Q.; Kulatilake, P.H.S.W. REV and its properties on fracture system and mechanical properties, and an orthotropic constitutive model for a jointed rock mass in a dam site in China. Comput. Geotech. 2012, 43, 124–142. [Google Scholar] [CrossRef]
  29. Wu, Q.; Meng, Z.; Tang, H.; Wang, X.; Huang, L.; Kang, J.; Liu, Y.; Wang, D.; Huo, X. Experimental investigation on weakening of discontinuities at the interface between different rock types induced by wetting and drying cycles. Rock Mech. Rock Eng. 2022, 55, 1179–1195. [Google Scholar] [CrossRef]
  30. Wu, Q.; Liu, Y.; Tang, H.; Kang, J.; Wang, L.; Li, C.; Wang, D.; Liu, Z. Experimental study of the influence of wetting and drying cycles on the strength of intact rock samples from a red stratum in the three Gorges Reservoir area. Eng. Geol. 2023, 314, 107013. [Google Scholar] [CrossRef]
  31. Xia, Y.J.; Li, L.C.; Tang, C.A.; Li, X.Y.; Ma, S.; Li, M. A new method to evaluate rock mass brittleness based on stress-strain curves of Class I. Rock Mech. Rock Eng. 2017, 50, 1123–1139. [Google Scholar] [CrossRef]
  32. Yang, X.J.; Wang, J.M.; Zhu, C.; He, M.C.; Gao, Y. Effect of wetting and drying cycles on microstructure of rock based on SEM. Environ. Earth Sci. 2019, 78, 183. [Google Scholar] [CrossRef]
  33. Yang, X.X.; Sun, D.K.; Jing, H.W. Morphological features of shear-formed fractures developed in a rock bridge. Eng. Geol. 2000, 278, 105833. [Google Scholar] [CrossRef]
  34. Yao, W.; Li, C.; Zhan, H.; Zhou, J.-Q.; Criss, R.E.; Xiong, S.; Jiang, X. Multiscale study of physical and mechanical properties of sandstone in three gorges reservoir region subjected to cyclic wetting-drying of Yangtze River water. Rock Mech. Rock Eng. 2020, 53, 2215–2231. [Google Scholar] [CrossRef]
  35. Ye, X.; Zhu, H.H.; Wang, J.; Zhang, Q.; Shi, B.; Schenato, L.; Pasuto, A. Subsurface multi-physical monitoring of a reservoir landslide with the fiber-optic nerve system. Geophys. Res. Lett. 2022, 49, e2022GL098211. [Google Scholar] [CrossRef]
  36. Zhang, S.; Xu, Q.; Hu, Z.M. Effects of rainwater softening on red mudstone of deep-seated landslide, Southwest China. Eng. Geol. 2016, 204, 1–13. [Google Scholar] [CrossRef]
  37. Zhang, L.; Cui, Y.; Zhu, H.; Wu, H.; Han, H.; Yan, Y.; Shi, B. Shear deformation calculation of landslide using distributed strain sensing technology considering the coupling effect. Landslides 2023, 20, 1583–1597. [Google Scholar] [CrossRef]
  38. Zhang, L.; Zhu, H.; Han, H.; Shi, B. Fiber optic monitoring of an anti-slide pile in a retrogressive landslide. J. Rock Mech. Geotech. Eng. 2023, 15, 1–11. [Google Scholar] [CrossRef]
  39. Zhao, Z.H.; Yang, J.; Zhang, D.F.; Peng, H. Effects of wetting and cyclic wetting-drying on tensile strength of sandstone with a low clay mineral content. Rock Mech. Rock Eng. 2017, 50, 485–491. [Google Scholar] [CrossRef]
Figure 1. Variation curve of the RWL in TGR area (2003.6–2017.12): (a) Variation curve of the RWL; (b) The actual RWL; (c) The study area; (d) The red-bed rocks under saturated condition.
Water 15 02684 g001
Figure 2. The flowchart of the study.
Water 15 02684 g002
Figure 3. Stress–strain curves of the rocks with different DWCs: (a) 0 cycles; (b) 1st cycle; (c) 5th cycle; (d) 10th cycle; (e) 15th cycle; (f) 20th cycle.
Water 15 02684 g003
Figure 4. The relationships between the mechanical parameters and the CP under different DWCs: (a) PS; (b) peak strain; (c) RS; (d) residual strain; (e) deformation modulus.
Water 15 02684 g004aWater 15 02684 g004b
Figure 5. The fitted results of the shear strength parameters and the DWCs: (a) cohesion; (b) internal friction angle.
Water 15 02684 g005
Figure 6. Normalized stress characteristic values under different DWCs: (a) CCS; (b) CIS; (c) CDS; (d) PS; (e) RS.
Water 15 02684 g006
Figure 7. The box normal diagrams of the characteristic stresses: (a) CCS; (b) CIS; (c) CDS; (d) PS; (e) RS.
Water 15 02684 g007
Figure 8. Energy evolution laws of the rocks under different DWCs at 2 MPa of CP: (a) 0 cycle; (b) 1st cycle; (c) 5th cycle; (d) 10th cycle; (e) 15th cycle; (f) 20th cycle.
Water 15 02684 g008
Figure 9. Typical damage evolution processes of the rock.
Water 15 02684 g009
Figure 10. Polar contour map of the DV under different DWCs: (a) initial DV; (b) DV at the CIS; (c) DV at the PS; (d) DV at the RS.
Water 15 02684 g010
Figure 11. Damage strain rates at different CPs.
Water 15 02684 g011
Figure 12. Comparison of different BIs after the normalization: (a) N-BI7; (b) N-BI12; (c) N-BI22; (d) N-BInew.
Water 15 02684 g012
Figure 13. Water–rock interaction process and its damage process under DWC.
Water 15 02684 g013
Disclaimer/Publisher’s Note: The statements, opinions and data contained in all publications are solely those of the individual author(s) and contributor(s) and not of MDPI and/or the editor(s). MDPI and/or the editor(s) disclaim responsibility for any injury to people or property resulting from any ideas, methods, instructions or products referred to in the content.

