Article

Research on Performance Test of the Optic-Electric Sensors for Reservoir Landslide Temperature Field Monitoring

1
School of Computer Science, North China Institute of Science and Technology, Beijing 101601, China
2
School of Earth Sciences and Engineering, Nanjing University, Nanjing 210023, China
3
Nanjing University High-Tech Institute at Suzhou, Suzhou 215123, China
4
State Key Laboratory of Geohazard Prevention and Geoenvironment Protection, Chengdu University of Technology, Chengdu 610059, China
5
School of Civil Engineering, Suzhou University of Science and Technology, Suzhou 215011, China
*
Authors to whom correspondence should be addressed.
Water 2023, 15(17), 3125; https://doi.org/10.3390/w15173125
Submission received: 1 August 2023 / Revised: 24 August 2023 / Accepted: 29 August 2023 / Published: 31 August 2023
(This article belongs to the Special Issue Recent Research on Reservoir Landslide Stability)

Abstract

:
In recent years, with the superposition of extreme climate, earthquakes, engineering disturbance and other effects, global landslide disasters occur frequently. Due to reservoir landslides being mostly in a multi-field coupling environment, the temperature field will impact the deformation and seepage fields, thereby affecting the stability of the reservoir landslide. The variation in the landslide’s surface temperature also directly affects the stress and deformation of deep rock masses. If hidden dangers are not detected in time, and corresponding measures are implemented, it is easy to cause landslide instability. In order to clarify the temperature measurement performance of different optic-electric sensors and the application characteristics of layout techniques, laboratory calibration tests of temperature sensors under different adhesives and attachment materials are carried out in this paper. It was found that the test data of the iron bar had the best effect among the four attachment materials overall. Therefore, the bar with a high-stiffness material should be preferred when selecting a pipe fitting as the fiber Bragg grating (FBG) temperature attachment in the borehole. However, considering the high requirements for the durability of sensors and layout techniques in on-site monitoring, the long-term stability of the adhesives used in actual monitoring needs to be improved. At the same time, it was found that the platinum 100 (PT100) temperature sensor has relatively higher testing accuracy (A: 0.15 + 0.002 × |t|; B: 0.30 + 0.005 × |t|), a larger temperature measurement range (−200~+850 °C) and better temperature measurement stability when compared to conventional sensors. Moreover, its resistance value has a good linear relationship with temperature. Finally, the Xinpu landslide in the Three Gorges Reservoir area was selected as the research object for on-site monitoring. There was a high correlation between the on-site monitoring results with the laboratory calibration test results. Therefore, through the performance test of optic-electric sensors in reservoir landslide temperature fields, more accurate solutions can be provided for selecting sensors and designing layout techniques to monitor the underground temperature field of landslides under different geological conditions. Thereby, grasping the real-time state information of the reservoir landslide temperature field is achieved accurately, providing an important reference for early warning, prediction, prevention and the control of reservoir landslide disasters.

1. Introduction

The global natural disaster situation has been complex and ever-changing in recent years, and extreme weather is multiple and frequent. Due to the combined effect of rainfall, earthquakes, engineering disturbances and other external factors, it is very easy to change the physical and mechanical properties of rock and soil masses inside a landslide, making the underground rock and soil masses unstable and unbalanced, thus inducing landslide disasters [1]. Once it occurs, it often causes significant casualties and property damage (Figure 1). China is one of the countries with the most severe natural disasters in the world, with a variety of types, wide distribution, high frequency of occurrence, and heavy losses, which significantly impact economic and social development as well as ecological environment protection. The annual distribution of precipitation in China is extremely uneven and greatly influenced by the seasons. The precipitation area gradually decreases from the southeast coast to the northwest inland, with the national average precipitation from June to August accounting for more than half of the total annual amount [2]. According to the relevant statistics, the country has approximately 290,000 geohazards distributed in mountainous areas, accounting for nearly 75% of the national territory. Among them, there are over 12,000 towns and villages, with approximately 35 million people threatened by geohazards. On average, about 600 people die from geohazards every year, and nearly 200,000 people are affected to varying degrees by geohazards. Direct economic losses reach from billions of yuan to ten billion yuan. According to the China Geological Disaster Report [3], from 2012 to 2021, there were a total of 89,618 geohazards and 2587 deaths in China, including 61,475 landslide disasters, accounting for approximately 68.6% of the total number of geohazards (Figure 2).
For a long time, monitoring and prediction have been essential for preventing and reducing landslide disasters, providing vital safety guarantees for effective landslide prevention and reduction. Numerous global scholars have conducted extensive research and engineering implementation on landslide monitoring, utilizing various monitoring methods to obtain real-time characteristic information, such as physical, chemical and other parameters on the surface and interior of landslides [4,5,6,7,8]. Early landslide monitoring often relied on qualitative methods, such as observing surface object deformation and animal and plant behavior, as well as anomalies of water, sound and gas [9,10]. In recent decades, landslide monitoring has mainly focused on laboratory and on-site tests around landslide deformation and instability. It has achieved a series of essential results [11,12,13,14]. Xu Qiang et al. [15] developed an adaptive, intelligent, variable frequency crack detector that automatically adjusts the sampling frequency based on landslide deformation, establishes a comprehensive warning model, accurately alerts landslide accidents, and avoids major casualties. Yang Chengye et al. [16] analyzed the temporal deformation characteristics of landslide disasters based on SBAS-InSAR technology and realized the refined deformation monitoring of landslide masses. Zhou Chunmei et al. [17] verified that the shear strength indicators of sliding zone soils with different water contents impact a slope’s stability through on-site tests. Huang Cong [18] conducted the influence of water content on slope stability through theoretical analysis, combined with laboratory tests and on-site investigation, concluding that the increase in water content will reduce the safety factor of the slope. Italian scholar Azadeh Hojat et al. [19] used electrical resistance tomography (ERT) technology to measure and analyze the water saturation of slopes, and finding that when the water saturation of the slope exceeds 45%, the slope begins to experience instability and imbalance. In recent years, landslide researchers have extensively researched the multi-field coupling effect, different types of landslide monitoring and warning indicators (displacement, groundwater variation, rainfall, temperature, etc.) [20,21,22,23,24]. Shi Bin and Zhu Honghu proposed the multi-field coupling mechanism of a landslide (Figure 3). They found that the temperature field impacts the deformation and seepage fields. On the one hand, the temperature field will affect the permeability coefficient of the landslide soil, thereby affecting the seepage velocity and range. On the other hand, the temperature field can change certain engineering properties of soil, especially for shallow soil with significant temperature differences. The periodic temperature variations in soil can affect the soil’s strength. In addition, research shows that variations in landslide surface temperature can also affect the stress and deformation of deep rock masses, leading to landslide instability [25,26]. Therefore, real-time monitoring of the landslide temperature field is an essential and critical step in achieving landslide disaster warning and prediction [27,28]. The temperature field is mainly composed of ground temperature, water temperature and air temperature, which is the representation of the seasonal change in the landslide’s external environment, the change in solar radiant energy, the temperature distribution inside the landslide and the heat conduction of rock and soil masses [29]. The change in temperature field will lead to thermal strain in the rock and soil mass, causing a change in the cracks, damage and shear strength of the rock and soil mass. At the same time, the shift in temperature can also induce variations in the hydraulic parameters, such as fluid density and viscosity within the soil, leading to thermal diffusion of the fluid. The temperature increase also affects the rate and stability of chemical reactions within the soil mass. Moreover, the temperature also changes the state of the internal stress and deformation fields of landslides by influencing factors such as phase-change, thaw collapse, and permeability characteristics in the soil [30,31].
Wang Zhirong et al. [33] used the Green-Ampt model to analyze the soil’s water infiltration under different temperature conditions. It was found that the water movement in the soil mainly depended on the saturated hydraulic conductivity and the matrix potential at the wetting front; the saturated hydraulic conductivity has a more significant humidity effect, where the higher the temperature, the greater the hydraulic conductivity. Mao Xuesong et al. [34], based on the control equation of the frozen soil temperature field, considered the impact of the phase-change effect of water conversion to ice on the instantaneous deformation and creep of soil. Niu Fujun [35] summarized the main types of slope instability in permafrost regions of the Tibetan Plateau as collapse type, creep type, mudflow terrace type, creep type of topsoil vegetation layer, and thermal melt collapse type. He pointed out that a thermal disturbance to permafrost is the main inducing factor for slope instability in permafrost regions of the Tibetan Plateau. Habibagahi [36] studied the effects of different parameters on landslides and found that the permeability coefficient increases with increasing temperature, attributed to the decrease in pore water viscosity. Gao Yanxi et al. [37] concluded that the shear strength of soil decreases linearly with increasing temperature, ignoring the temperature variations in the solid and liquid phases. Sun Yijie [38] used a fiber optic sensing system with quasi-distributed FBG and full-distributed Raman optical time-domain reflectometry (ROTDR) to implement the temperature field monitoring of the bank slope. Temperature sensors and sensing cables were arranged along the longitudinal and transverse directions of the slope at different positions, directions and depths to achieve complete coverage monitoring of the entire slope temperature field. The monitoring results visually show a clear seasonal fluctuation trend in the slope temperature of the shallow and deep layers. Related studies have indicated a good linear relationship between the Brillouin frequency shift of optical fibers and the temperature variation within a certain temperature range, represented by the temperature coefficient (MHz/°C) [39]. To study the temperature effect of sensing cables, Jiao Haoran [40] designed a free-state temperature change test for sensing cables and studied the laws and reasons for the temperature coefficient changes for optical fibers with different sheaths and coating layers under free-state conditions, the effects of heating and cooling. The test results show an excellent linear relationship between the measured temperature of several sensing cables and the Brillouin frequency shift. The temperature coefficient of sensing cables adhered to the substrate is determined by the temperature coefficient of bare fiber and the thermal expansion coefficient of the attached substrate and is not affected by other factors. The coating layer has little effect on the temperature coefficient of bare fiber, which can be ignored. In order to clarify the impact of different adhesives and attachment materials on the effect of landslide temperature field monitoring, this paper integrates optic-electronic sensing technology to conduct laboratory calibration tests to study the impact of different adhesives and attachment materials on the accuracy and performance of FBG-temperature sensing. An on-site test was carried out to solve the problem of high-precision acquisition for the landslide temperature field. The temperature monitoring accuracy can reach 0.1 °C, and the distance monitoring range can achieve 3 km. It realized a large-scale, fully distributed and refined temperature acquisition of the landslide masses, thus providing reliable information and an essential basis for the analysis, evaluation, early warning and prediction of landslide prevention and control correctly.

2. Laboratory Calibration Test of Optic-Electric Temperature Sensing Technology

2.1. Principles of Optic-Electric Temperature Sensing Technology

Fiber Bragg grating sensors, also known as FBGs, have a structure within their fiber core that periodically changes the refractive index of light [41]. When light waves of different wavelengths pass through FBG, the FBG will reflect a wavelength of light wave. This wave’s refractive index matches the fiber core’s refractive index. In addition, the remaining wavelengths of light waves will pass through the FBG without loss and continue to transmit forward. Thus, FBG can play a filtering role [42]. The wavelength of the light wave reflected in FBG is called the Bragg wavelength, and its value depends on the FBG grating pitch Λ and the effective refractive index of the fiber n, expressed as λB = 2 [43]. When FBG is affected by the external environment and undergoes strain or temperature variations, the grating pitch and effective refractive index will change accordingly, resulting in the Bragg wavelength reflected by FBG λB, which also undergoing simultaneous variations. It can be considered that the Bragg wavelength reflects variations in external environmental factors (strain or temperature) of FBG, and there is an excellent linear relationship between the Bragg wavelength in FBG and the variation in strain and temperature it produces. The formula can be expressed as:
ΔλB = η (εε0) + γ (TT0),
where ΔλB is the variation of the grating wavelength, η is the strain coefficient, (εε0) is the variation of strain, γ is the temperature coefficient, (TT0) is the variation of temperature. It indicates that FBG is sensitive to temperature. Landslide monitoring based on the FBG technology is a dual-parameter problem of monitoring strain and temperature, ultimately attributed to the interaction between the temperature and strain. If the deformation of the landslide is monitored separately, it will be affected by temperature interference. Therefore, it is necessary to carry out temperature compensation. The existing temperature compensation can be divided into external and internal temperature compensation methods [44,45]. The external temperature compensation method utilizes the external materials’ properties for temperature compensation. The internal temperature compensation method is based on the sensitivity difference of fiber Bragg grating to temperature and strain for temperature compensation. Chen Min and others [46] have designed and developed a temperature self-compensation sensor based on FBG technology. They adopted the double-layer metal tube packaging technique. The inner tube material has a high thermal expansion coefficient, and the outer tube material has a relatively low thermal expansion coefficient. The outer tube is thin, and the inner tube is thick. According to the difference between the thermal expansion coefficient of the inner and outer tubes, the strain caused by the thermal expansion of the grating and the photothermal effect is corrected. The test verifies that the sensor has a good temperature compensation effect.
During the development process of the landslide monitoring system, the project team found that wireless real-time data transmission is of great significance for landslide monitoring. On the one hand, wireless transmission overcomes the shortage of on-site manned operations that require multiple trips to the field. On the other hand, it also solves the problem of expensive, distributed monitoring equipment. Based on years of theoretical accumulation and practical application in the field of distributed temperature sensing technology, the project team has proposed a new fiber optic monitoring technology: ultra-weak fiber Bragg grating (UWFBG), which integrates the advantages of the FBG and Brillouin optical time-domain reflectometer (BOTDR) fiber optic sensing technologies. It has achieved densely distributed measurements of underground multi-fields and multi-parameters in landslides. The measurement principle is shown in Figure 4. UWFBG sensing technology has the advantages of high precision and dynamic measurement of FBG and can also realize high-density distributed measurements, an important development direction of high-precision distributed measurement technology [47,48]. Therefore, the project team has achieved high-precision and real-time monitoring of the underground temperature field, deformation field and seepage field of landslides through developing UWFBG sensing technology.
There are two main methods for demodulating the signals of landslide temperature fields based on UWFBG technology. One is to use a tunable pulse light source combined with optical time-domain positioning technology for demodulation, mainly for long-distance and low spatial resolution measurements. The other one is to use a tunable pulse scanning light source combined with optical frequency domain positioning technology for demodulation, mainly for short-distance and high-spatial resolution measurements. The system structure diagram of demodulation using a tunable pulse light source and optical time-domain positioning technology is shown in Figure 5. A tunable laser scans and outputs continuous light of different wavelengths, which undergoes pulse modulation and amplifying before entering a fiber etched with an identical weak fiber grating array. The high-speed photodetector collects the light reflected by the equally weak fiber grating array, locates and analyzes it in a time-domain manner, and obtains the spectral maps of the grating at each position.
PT100 temperature sensors use variations of conductor resistance with temperature to achieve accurate temperature measurements. When the resistance value changes, the working instrument will display the temperature value corresponding to the resistance value. Spring-loaded temperature sensing elements have advantages, such as good vibration resistance, accurate temperature measurement performance, high mechanical strength and excellent pressure resistance. The resistance value Rt of the platinum thermistor presents a nonlinear relationship with temperature t [49,50]:
Rt = R0 (1 + at + bt2) (t ∈ [0, 650]),
where a = 3.90802 × 10⁻³ °C−1, b = −5.80 × 10⁻⁷ °C−2, and Rt and R0 are the resistance values of the resistors at t °C and 0 °C, respectively. When the temperature is 0 °C, the resistance value of PT100 is 100 Ω. That is, R0 = 100 Ω. The commonly used temperature sensors in actual industrial production adopt a three-wire PT100 platinum thermistor as the temperature signal sampling device. The widely used three-wire wiring method is shown in Figure 6. Three wires must have the same material, diameter, length and operating temperature so that the resistance values of the three wires are the same, that is, RL1 = RL2 = RL3. Apply excitation current I to the thermal resistor through wires L1 and L2 and measure the potentials of V1, V2 and V3. Wire L3 is connected to a high-input impedance circuit, IL3 = 0.
Compared with conventional sensors, the PT100 temperature sensor has a relatively high measuring accuracy and a more extensive temperature measurement range, and its resistance value has a good linear relationship with temperature [51]. Li Qingchao et al. [52] used simulation software to simulate the temperature sensor circuit. By changing the temperature and comparing the theoretical temperature values corresponding to the current resistance value of PT100, the overall error of the simulation results was small, and the simulation effect was good. Therefore, PT100 is highly reliable and stable for temperature monitoring during engineering construction. The performance parameters of the optic-electric sensing technology and the technical indicators of commercial equipment are shown in Table 1.

2.2. Test Preparation and Process

In order to clarify the impact of the FBG layout technique and attachment materials on the monitoring of underground temperature fields in landslides and to achieve a large-range, fully distributed, high-precision, and real-time acquisition of the temperature field inside the landslide, this paper conducted multiple sets of FBG laboratory calibration tests to study the impact of different adhesives and attachment materials on the accuracy and performance of FBG temperature sensing. The test devices consisted of FBG, a temperature sensor, an FBG demodulator, a water bath box, four attachment materials (rubber bar, aluminum bar, PVC tube and iron bar), three types of adhesives (502 adhesive, AB adhesive and epoxy resin adhesive), a PT100 temperature patrol inspection instrument, etc. The FBG demodulator is produced by Suzhou Nanzee Sensing Technology Co., Ltd. (Suzhou, China). The water bath box is produced by Changzhou Jintan Liangyou Instrument Co., Ltd. (Changzhou, China). The patrol inspection instrument is produced by Yuyao Tenghui Temperature Control Instrument Factory (Yuyao, China). And the RC-4HC is produced by Jiangsu Jingchuang Electric Co., Ltd. (Xuzhou, China). The laboratory calibration test system is shown in Figure 7. The test was conducted in a laboratory constant temperature environment, and the water temperature was automatically controlled through a fully automatic water bath box. PT100 and RC-4 temperature sensors were simultaneously used to record the temperature variations in the water in the water bath box during the test. One end of the long tube for sticking FBG fiber optic strings with different adhesives was arranged in a water bath box, and the other end was connected to an FBG demodulator to acquire the FBG wavelength at different temperatures in real time.
Due to the significant differences in stiffness and performance among the four attachment materials used in the test and the different action mechanisms with the three types of adhesives, these factors will directly affect the temperature calibration test results of FBG optical fibers. Therefore, three different types of adhesives were used to stick FBG to four different materials of tubes in this test. The detailed layout and test processes are as follows: (1) Stick three FBGs on the tube along the longitudinal direction equidistantly (Figure 8). (2) After the adhesion, the FBG and attachment materials are fully coupled (standing for 24 h); arrange the tubes evenly in sequence in the water bath box. Make use of a fully automatic temperature control device to accurately control the water bath box’s temperature. The starting temperature of the water bath is to be set to 20.0 °C. (3) After the water temperature stabilizes for 5 min, the FBG demodulator is to be used to record the initial fiber optic data of the FBG. Then, the water bath temperature gradually increases (2.0 °C per stage). (4) After the water temperature rises to 40.0 °C, stop heating. Then, the water bath is to be naturally cooled, and the variations in FBG data throughout the cooling process are to be recorded.

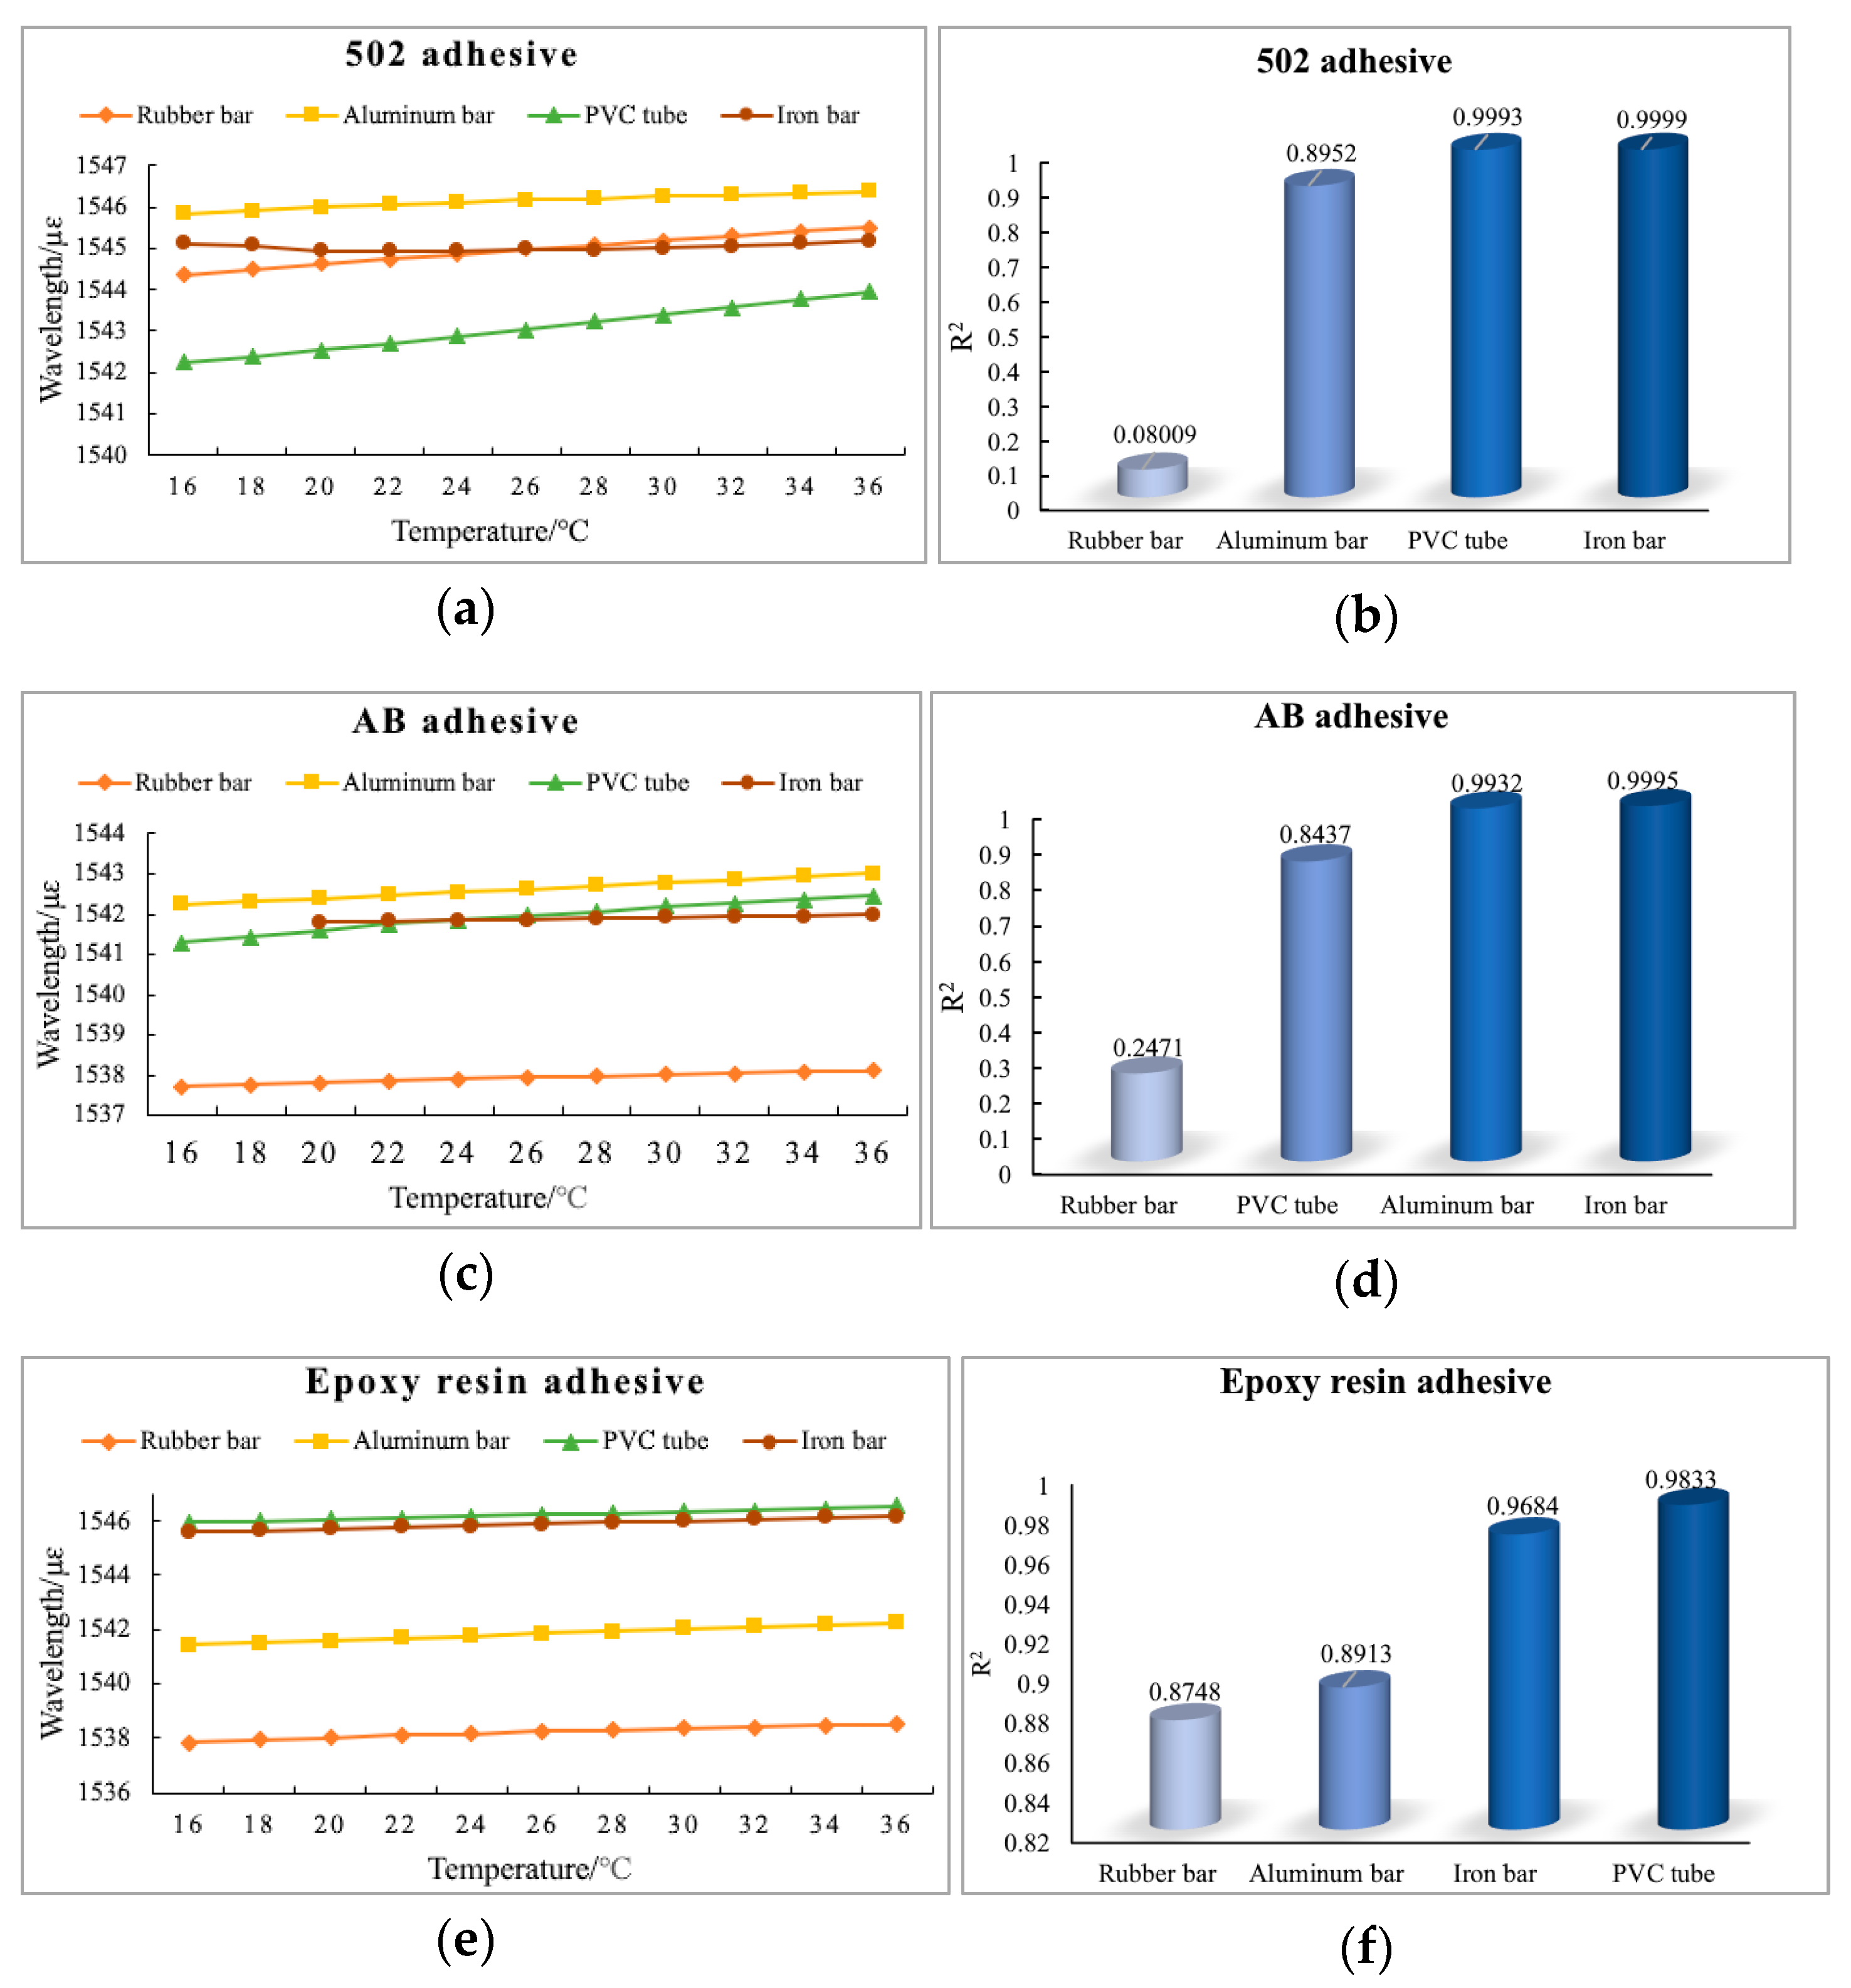
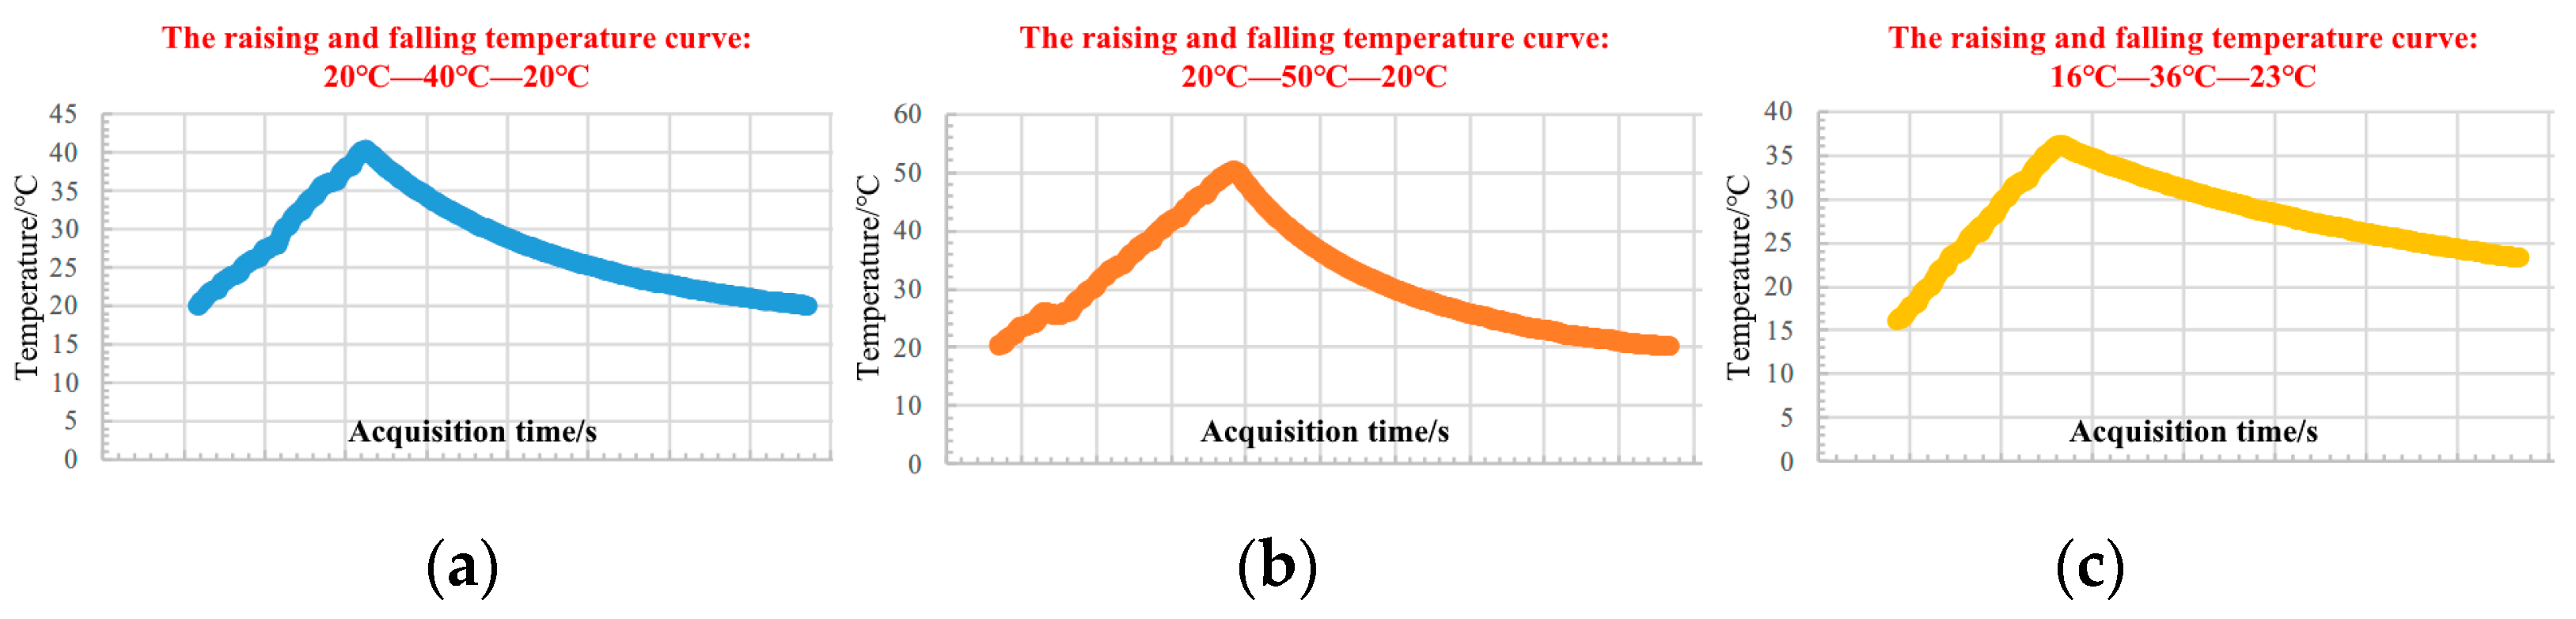
2.3. Test Results and Analysis

The authors collected and classified the FBG wavelength values during the heating process. The wavelength variation of the FBG under different adhesives and attachment materials are shown in Figure 9. Simultaneously, to accurately investigate the relationship between the wavelength and material at different temperatures, linear fitting was performed on the FBG wavelength and water bath temperature during the heating process. The fitting relationship between the wavelength and temperature under the action of three adhesives was obtained, and the corresponding R2 was calculated (Figure 10).
Based on the above results of the data analysis, it is obvious that the testing effect of epoxy resin is relatively stable; the best effect is when the FBG is stuck to an iron bar. The following conclusions can be drawn:
(1) When 502 and AB adhesives are used, the calibration data result of the FBG stuck on the iron bar is significantly better than those of the rubber bar, aluminum bar and PVC tube. When epoxy resin adhesive is used, the calibration data result of the FBG stuck on the PVC tube is better than those of rubber bar, aluminum bar and iron bar. Therefore, the 502 and AB adhesives are more suitable for FBG adhesion monitoring of pipe fittings with high-stiffness material. However, the test found that colloid detachment occurred when the 502 adhesive was immersed in water for some time, causing the FBG at the adhesive to separate from the pipe fittings. Therefore, once the FBG adhesive method was used to monitor data in long-term water-rich environments, the 502 adhesive should be carefully selected. During the test, it was found that the epoxy resin had good water resistance and showed a relatively stable testing effect in four materials. Therefore, it is recommended to choose epoxy resin adhesive as the binder in water-rich and humid environments.
(2) For FBG stuck to the rubber bar, the test results showed that the most effective adhesive is epoxy resin adhesive. When FBG is stuck to the iron bar and PVC tube, the test results of the 502 adhesive as a binder are optimal. When FBG is stuck to the aluminum bar, it is found that the most effective adhesive is the AB adhesive. Throughout the entire test and research process, FBG stuck to four types of pipe fittings (rubber bar, aluminum bar, PVC tube and iron bar) have all achieved a temperature monitoring accuracy of 0.1 °C; however, the overall effect of the calibration curve is the worst when FBG is stuck to a rubber bar, and the best effect is when FBG is stuck to an iron bar. Therefore, pipe fittings with high-stiffness material should be preferred when selecting attachment pipe fittings as the FBG temperature attachments in boreholes.
(3) As the water bath temperature gradually increases, the overall wavelength of FBG shows a linear change trend. For the attachment pipe fittings of four different materials, when 502 and AB adhesives are used as the binder, the linear fitting effect of FBG stuck to the iron bar is the best, where R2 reaches 0.9999 and 0.9995, respectively. Even with epoxy resin, R2 can still reach 0.9684. Therefore, in FBG adhesion monitoring, the iron bar is a good attachment pipe fitting. However, considering the cost and on-site layout environments, such as high salinity and humidity, the conditions of the monitoring target should be fully considered in the application process. When epoxy resin adhesive is used as the binder, the linear fitting effect of FBG stuck to the PVC tube is the best—R2 can reach 0.9833. When the 502 and AB adhesives are used as the binder, R2 is 0.9993 and 0.8437, respectively. Therefore, considering the economy, convenience, strong durability and corrosion resistance, PVC tube is mostly used as attachment pipe fittings in the current on-site monitoring of landslides. During the test process, it was found that the fitting effect of the rubber bar’s data was the worst for four different materials of attachment pipe fittings. Therefore, in the application of on-site underground rock and soil monitoring, the rubber should be carefully selected as the material of the attachment pipe fittings.
Two temperature sensors, PT100 and RC-4, were selected for the test to synchronously compare and calibrate the water bath temperature and heating process. The preliminary test data shows that the temperature test data of PT100 sensors arranged at different depths in the water bath box almost overlap, the temperature error is within 0.1 °C, and the temperature change curve trends are consistent during the three cycles of heating and cooling processes. It indicates that the PT100 sensor has relatively high measurement accuracy and stability, which can meet the temperature monitoring requirements of the interior of rock and soil in complex on-site tests. However, due to the regulation, quiescence and data acquirement processes involved in the heating process, there is a certain degree of fluctuation in the temperature change curve compared to the cooling process. Moreover, the curve’s overall smoothness and continuity are lower than the cooling curve (Figure 11). The RC-4 temperature sensor can accurately monitor the heating and cooling process of the water bath box with a temperature measurement accuracy of 0.1 °C. The temperature monitoring data showed that the three cycles of heating and cooling processes were recorded accurately and synchronously. The monitoring data was smoother, which formed a good comparison and verification with the monitoring results of the PT100 sensor (Figure 12).

3. On-Site Test of Temperature Field in Landslides

3.1. Test Scheme

In order to verify the applicability and accuracy of the laboratory calibration test, the Xinpu landslide (Figure 13) was selected as the research object for the on-site monitoring. The temperature field monitoring test of the landslide’s underground rock and soil mass was conducted. The Xinpu landslide, located in Anping Town, Fengjie County, Chongqing, China, is an ancient and massive landslide in the Three Gorges Reservoir area (landslide area: 0.86 km2; volume: 5.4 × 10⁷ m3; average inclination: 15~20°). The impoundment of the Three Gorges Reservoir and the abundant rainfall in the area lead to landslide disasters frequently, posing a threat to the safety of residents’ lives and property. Since 2006, the GNSS and slope tiltmeter have been used to monitor the landslide deformation of the surface and underground in this area. Based on the monitoring results of deformation, corresponding landslide prevention measures have been implemented; the landslide deformation in these areas has been effectively controlled and maintained in an overall stable state. In recent years, the landslide has held a gradual deformation, especially during the concentrated rainfall period from July to August each year, where local collapse events are more frequent within the landslide area. Therefore, selecting this landslide as the research object for real-time temperature field monitoring tests verifies the importance of temperature field monitoring for landslide prediction and early warning. Moreover, it is essential for the area’s landslide prevention and ecological stability.
During the test, based on the monitoring targets and testing requirements of the underground physical field in the landslide, three in situ boreholes were constructed—FBG sensors and PT100 temperature sensors were installed to build a three-dimensional network monitoring system for the landslide. The detailed layout scheme is shown in Figure 14. During the sensor layout processes, the lowering speed of the drill pipe was strictly controlled, and the layered method was used for drilling and backfilling. The detailed layout processes are shown in Figure 15.

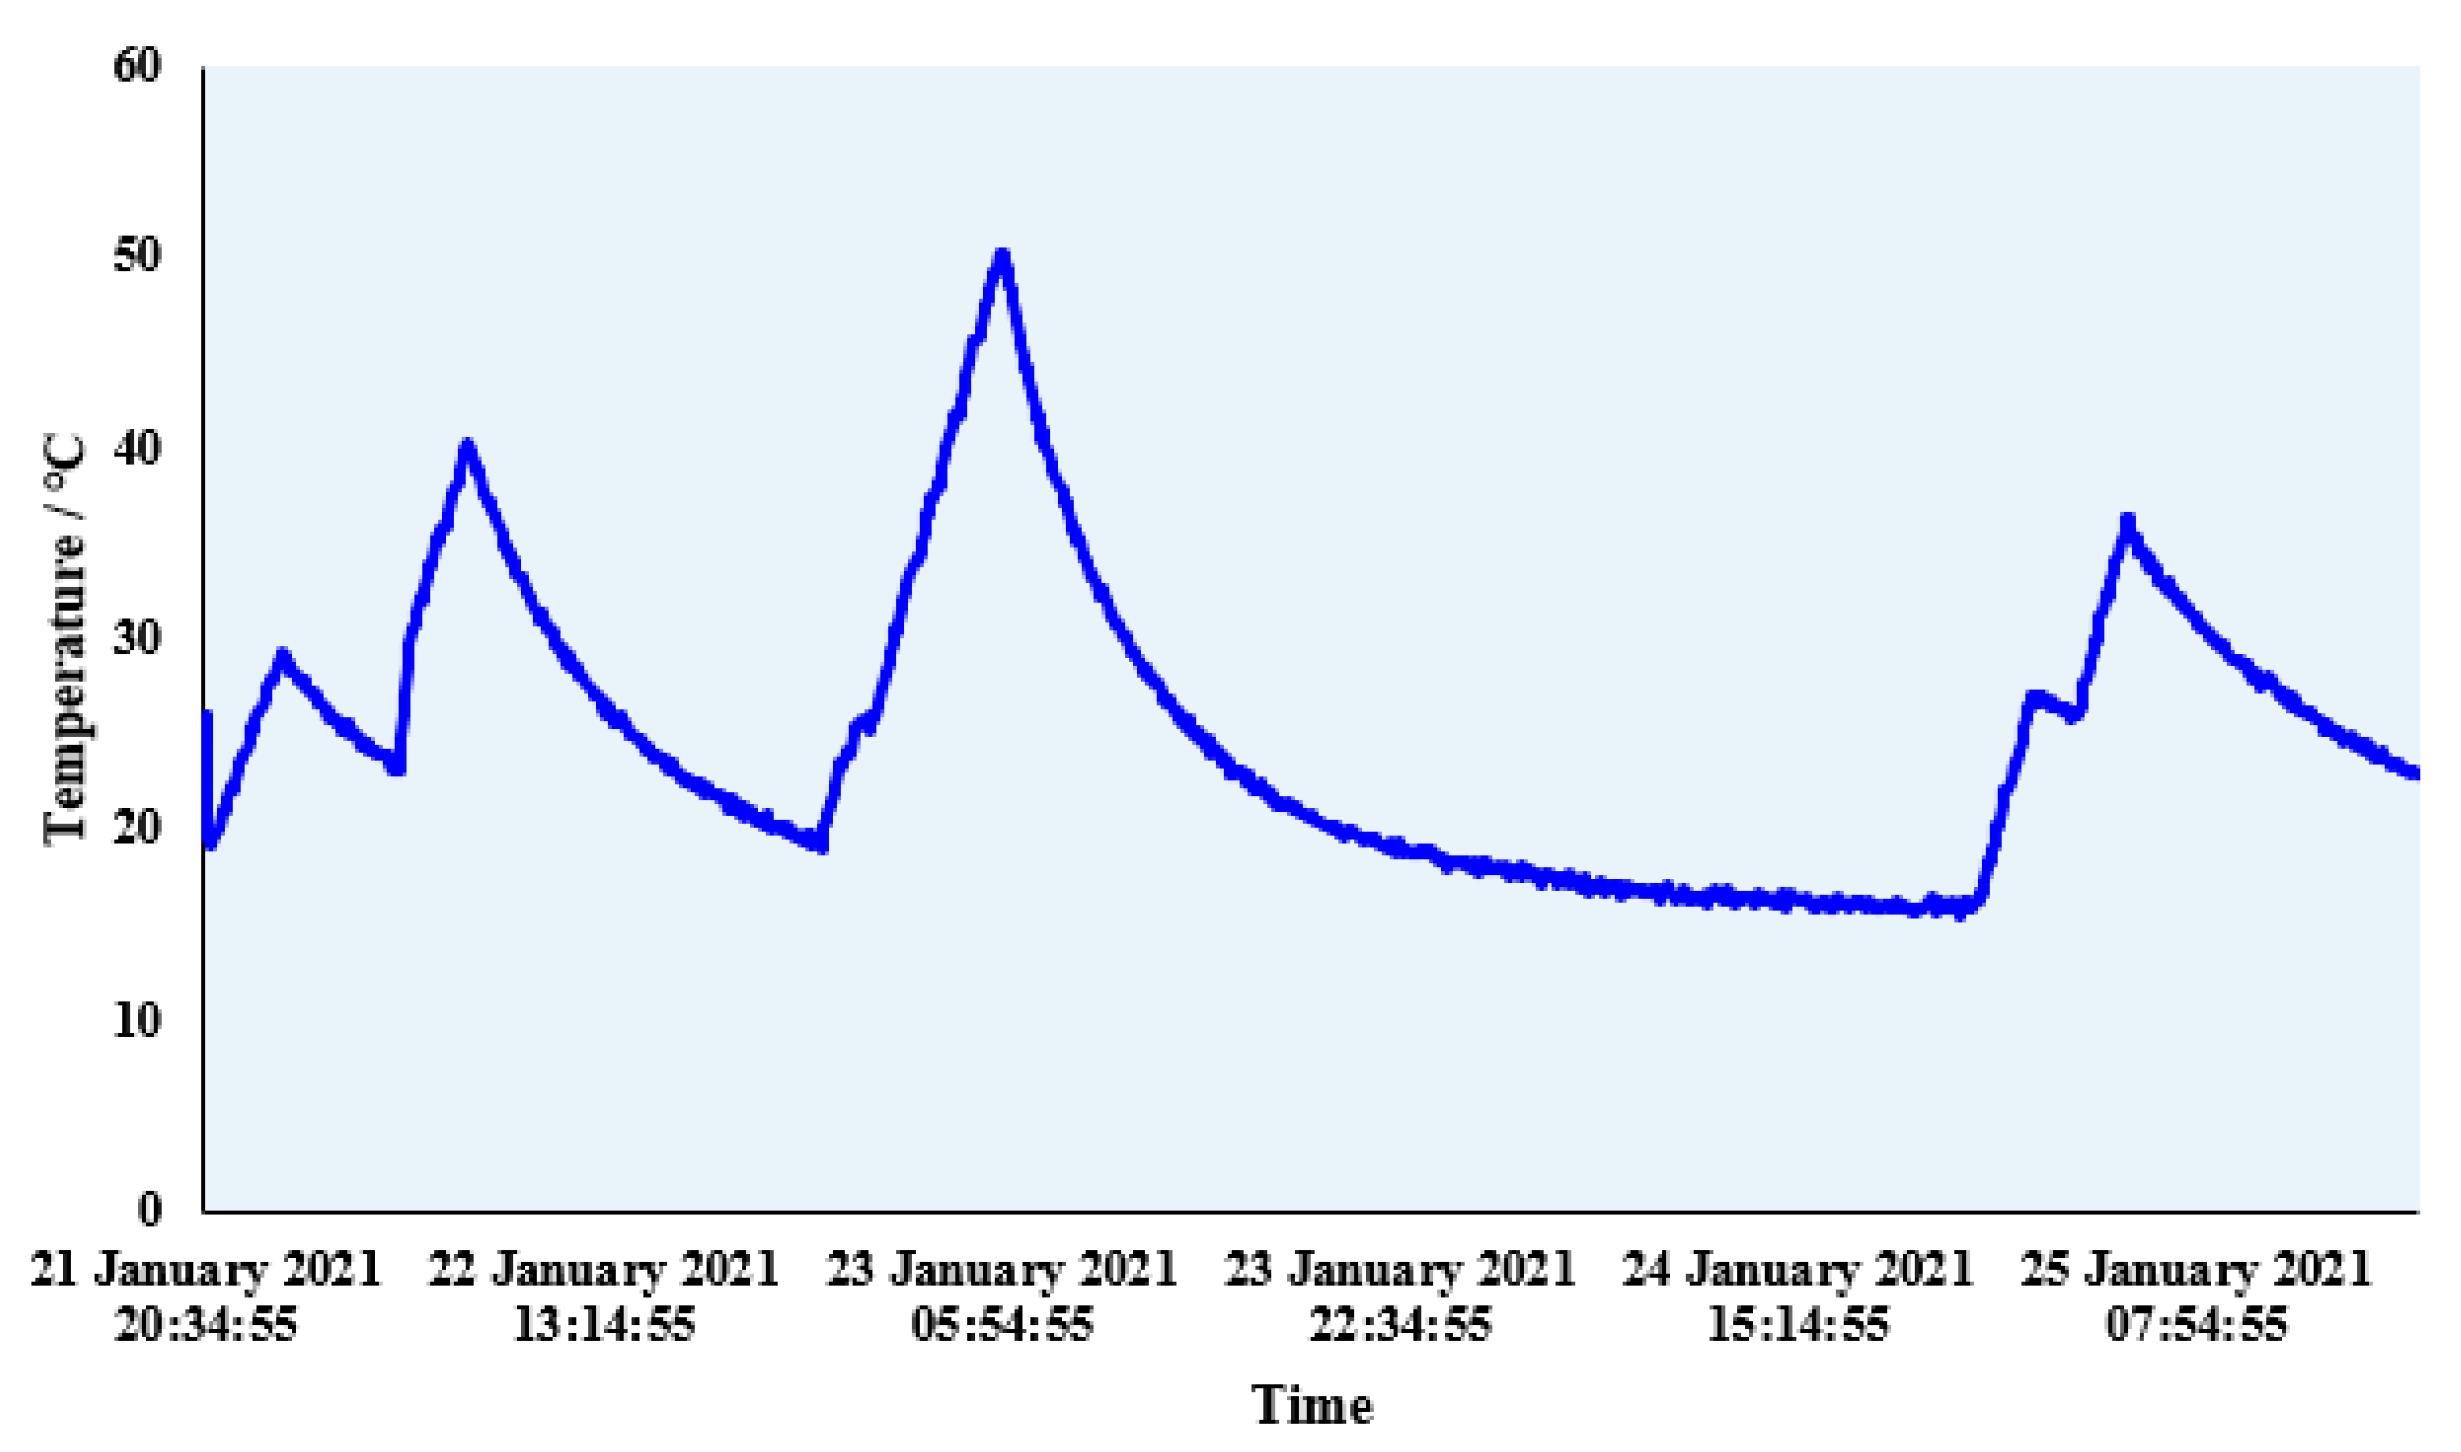
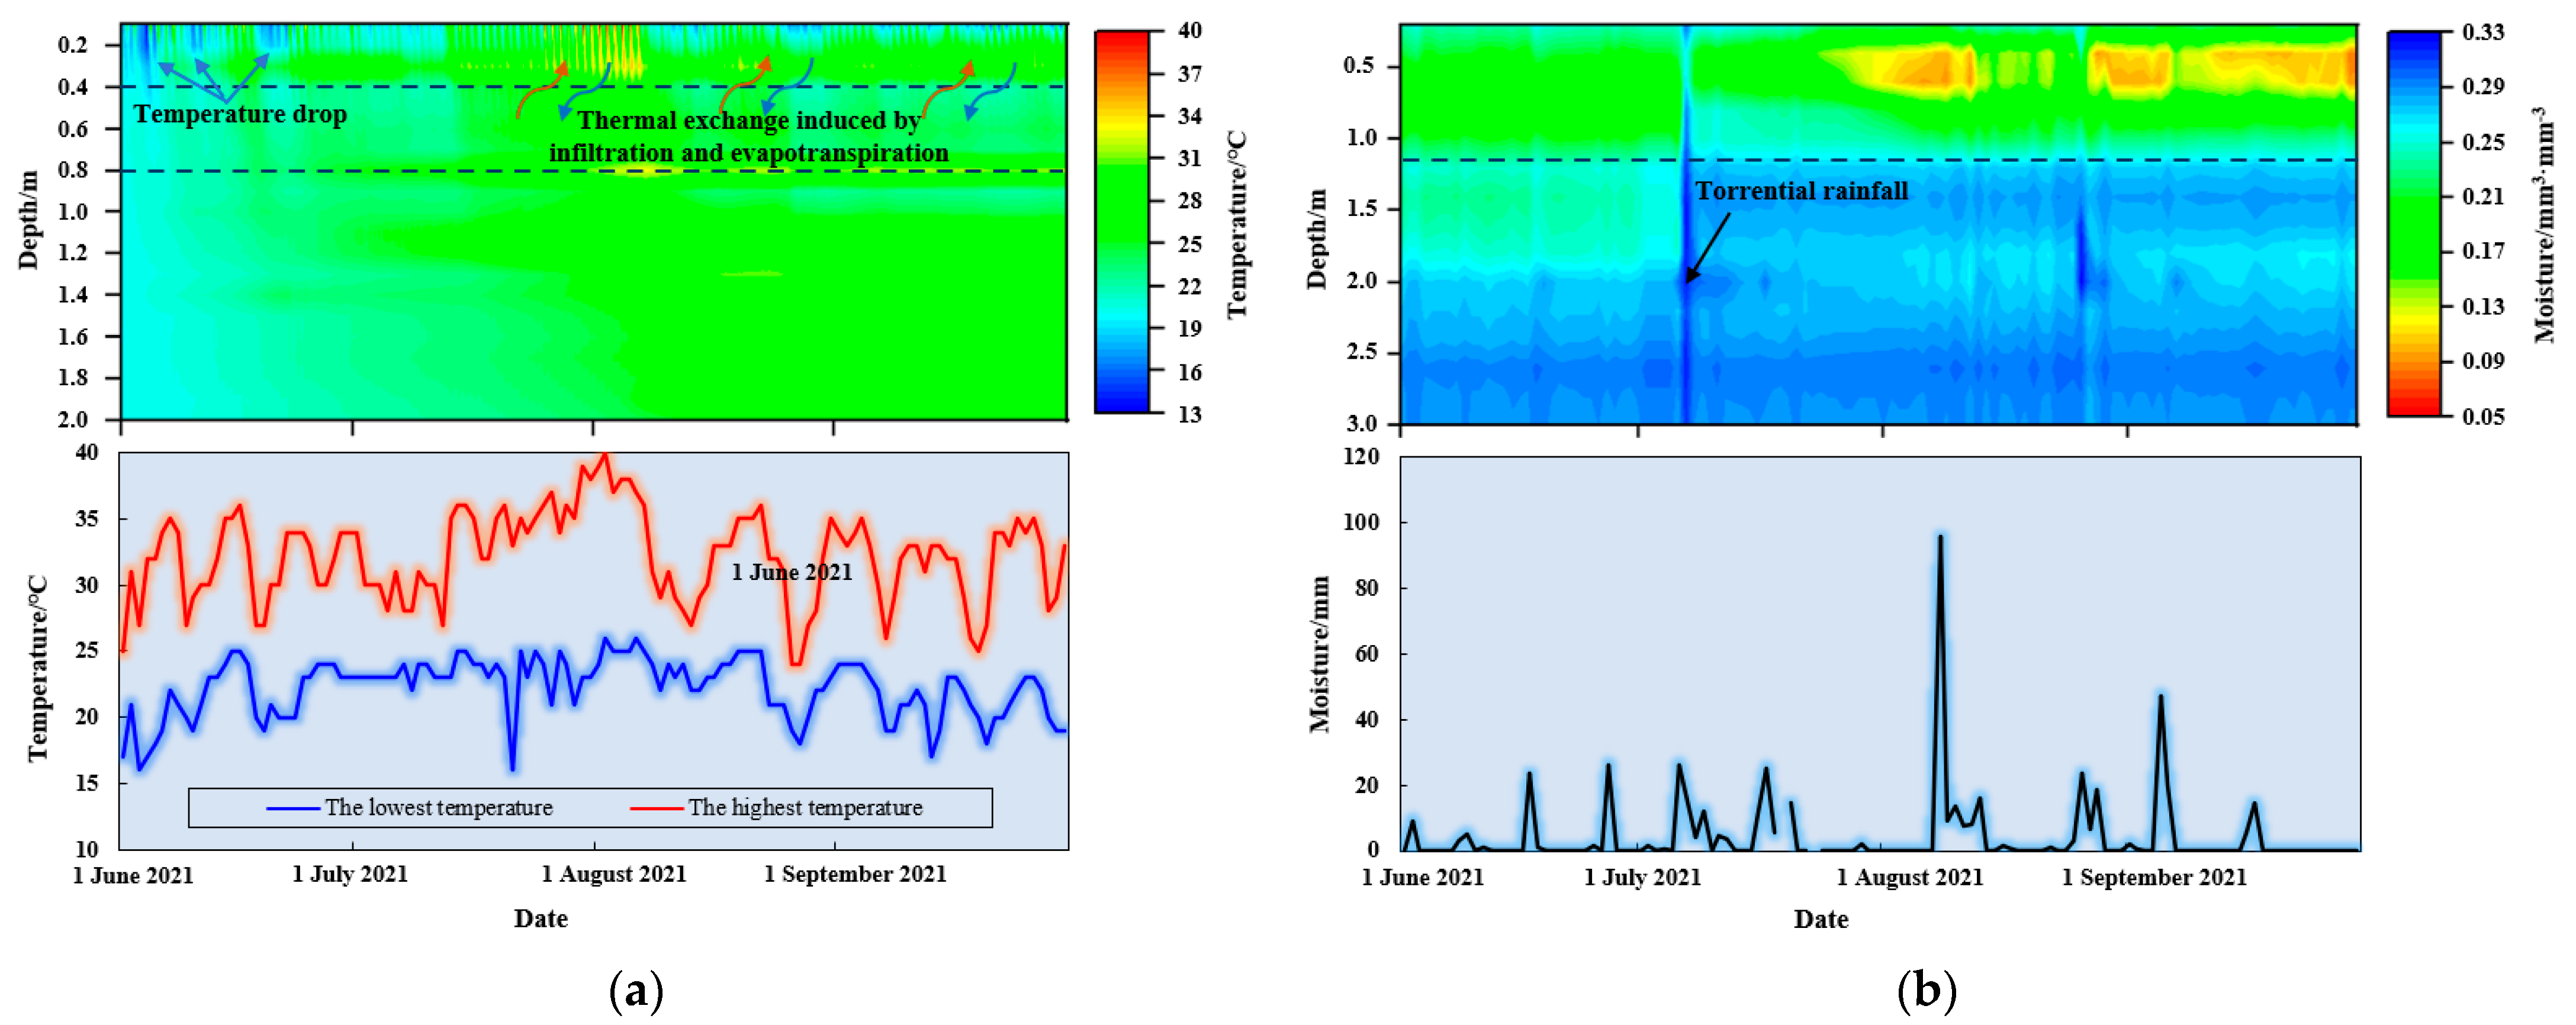
3.2. Test Results and Analysis

It was found that the temperature variation in shallow soil has good consistency with rainfall events through the test. During high-temperature weather monitoring, due to the influence of solar radiation, the moisture of shallow soil is significantly lower than at other times, and the evaporation effect of soil moisture is also significantly more severe. Figure 16 shows the monitoring results of the temperature and moisture of underground rock and soil in landslides. The detailed analysis of the test result is as follows: (1) Figure 16a indicates that the temperature of the rock and soil inside the landslide changes synchronously with the temperature of the external environment. The temperature profile clearly shows a temperature interface at 0.8 m, indicating that the temperature variation in shallow soil in landslides is more susceptible to meteorological factors. Among them, the underground rock and soil masses in the landslide within a depth of 0.4 m are subjected to direct sunlight, and the temperature effect changes more significantly. Moreover, the soil temperature at a depth of 0.1 m is consistent with the trend of environmental temperature variation. (2) Overall, the underground soil temperature in landslides decreases with increased depth. Based on the temperature test data and a geological profile analysis of the monitoring area, it is known that the boundary in the temperature profile is attributed to the differences in soil properties, which may be induced by the presence of silty clay with large particle gravel at this depth. Under it, the temperature variation range in the soil is maintained within a stable range of 20~25 °C. (3) To clarify the effect of soil moisture on the temperature field of underground rock and soil in landslides, the soil moisture was synchronously measured, and the precipitation at the same time was recorded during the test, as shown in Figure 16b. Based on the temperature and moisture monitoring data of underground rock and soil in landslides, it was found that the temperature variation in the shallow soil showed good consistency with the variation in soil moisture. Therefore, the distribution of the near-surface temperature field of landslides also reflects weather-related hydrological conditions. (4) In actual landslide disaster monitoring, it is necessary to integrate multi-field and multi-parameter sensing data, further analyze the relationship between multiple fields, and clarify the deformation, instability and evolution development characteristics of underground rock and soil in landslides to improve the accuracy of landslide prediction and early warning.

4. Discussion

4.1. Error Analysis

The accuracy of laboratory tests can reach 0.1 °C, whereas field-based assessments may yield diminished levels of accuracy. Comprehensive analysis reveals several potential factors contributing to this phenomenon: (1) the coupling performance between the sensor and the surrounding soil has a certain impact on the temperature measurement accuracy; (2) the inherent complexity of the on-site testing milieu, in comparison to the controlled conditions of the laboratory, introduces a plethora of uncontrollable variables that invariably influence the temperature measurement outcomes; (3) the laboratory test is conducted in a constant temperature environment, while with the on-site test, the temperature difference between day and night in the atmosphere is often significant. This dynamic thermal variance between day and night inevitably imparts a discernible impact on the resulting test measurements. Despite all this, the sensors and procedural methodologies employed in the laboratory examinations prove to be sufficiently robust in ascertaining the temperature profiles of underground rock and soil formations across substantial vertical extents. In the on-site test, it was found that there is a significant correlation between the temperature changes near the surface and rainfall events. After each rainfall, the soil humidity increases, and the soil temperature correspondingly decreases. Therefore, the variation in soil temperature can also reflect the soil’s humidity. Additionally, it is noteworthy to highlight that analogous investigations conducted in similar on-site contexts have yielded a consistent thermal plateau spanning a depth of 7 m within deeper boreholes [54]. The soil below 7 m in this borehole has a relatively constant temperature; the temperature of soil above 7 m fluctuates significantly, and the closer it is to the surface, the more similar it is to the atmospheric temperature. This discovery complements the research in this paper and provides reliable data support for clarifying the underground temperature field monitoring of landslides.

4.2. Indicators for Landslide Stability Prediction

Changes in soil temperature can lead to changes in soil shear strength, affecting landslides’ stability. Moritz et al. [55] simulated the changes in the properties of clayey soil under seasonal cycling and heating conditions through long-term on-site tests. The findings indicate that clayey soil has a propensity to undergo consolidation under elevated thermal circumstances. Concomitantly, heightened temperatures are observed to engender a reduction in soil moisture content, which, in turn, culminates in an augmentation of shear strength. Moreover, with the progression of temperature elevation, a non-monotonic pattern in the shear strength behavior of clayey soil is evident-initially experiencing attenuation, followed by subsequent escalation. Shao Yuxian et al. [56] selected Xiashu clayey soil from Nanjing University Pukou’s campus as the soil test sample and conducted laboratory direct-shear tests at different environmental temperatures. The test results indicate that temperature has a complex effect on the shear strength of clayey soil. When the moisture content is greater than about 18%, the shear strength of the soil decreases with the increase in temperature; when the moisture content is equal to or less than 18%, the shear strength of the soil is almost unaffected by temperature when the dry density is equal to 1.67 g·cm−3. However, when the dry density is less than 67 g·cm−3, the shear strength of the soil exhibits a positive correlation with escalating temperatures. Therefore, temperature monitoring of underground rock and soil masses in landslides can provide original theoretical data for landslide instability predictions.

4.3. Advantages and Limitations of Optical Fiber Technology

FBG has the advantages of distributed, real-time, and refined performance in measuring the temperature of underground rock and soil masses in landslides. UWFBG fully leverages its distributed advantages and can conduct densely distributed measurements of the measured target, obtaining temperatures at various points along the optical fiber. The Internet of Things (IoT) technology, based on wireless transmission, can achieve real-time acquisition and post back the temperature data; at the same time, its temperature measurement accuracy can reach 0.1 °C, and the distance measurement range is 3 km, which can achieve a distributed measurement along the optical fiber. However, this temperature measurement technology still has certain limitations. The installation and configuration procedures necessitate the incorporation of dedicated optical fiber sheathing to safeguard the holistic integrity of the optical fiber infrastructure, thereby obviating any inadvertent compromise to the veracity of the measurement regime. Especially in harsh monitoring environments, corresponding protective measures should be further taken, and the installation technique is cumbersome. Although temperature measurement is conducted, continuous deformation of landslides, to a certain extent, can cause broken fiber, resulting in a lack of temperature data and affecting the accuracy of landslide predictions and warnings.

5. Conclusions

In landslide monitoring, due to the limitations of conventional research for single physical field monitoring, it is often difficult to fully characterize the process of a landslide disaster occurrence, its development and evolution, which has a significant impact on landslide disaster prevention, reduction and response. This paper comprehensively considered the coupling relationship between temperature and other physical fields. It proposed a monitoring method for the underground temperature field of landslides based on optic-electric sensing technology. This method utilizes FBG sensors and PT100 temperature sensors to obtain real-time temperature data parameters of landslide underground rock and soil masses. Based on this, the variation law of the landslide underground temperature field was analyzed, the influence effect of the temperature field on the deformation field and seepage field was revealed, and the deformation evolution trend of landslide underground rock and soil masses was accurately grasped. Therefore, the prediction and early warning of landslide disasters were achieved accurately. The following conclusions are drawn:
(1) Based on the optic-electric sensing technology, laboratory calibration tests were conducted for FBG temperature monitoring, clarifying the effects of different adhesives and attachment materials on the FBG temperature monitoring results. When 502 adhesive and AB adhesive are used as binders, the calibration data of FBG stuck on an iron bar is the best. When epoxy resin adhesive is used as the binder, the calibration data of FBG stuck on PVC tube is the best. Therefore, 502 adhesive and AB adhesive are more suitable for the FBG adhesion monitoring of pipe fittings with high-stiffness material. Meanwhile, it was found that when the 502 adhesive was immersed in water for a period, the phenomenon of colloid detachment occurred, and the epoxy resin had good water resistance. As a result, in water-rich and humid environments, the 502 adhesive should be carefully selected as the binder, while epoxy resin adhesive can also be preferred. When FBG is stuck to a rubber bar, the overall calibration curve effect is the worst, while FBG, when stuck to an iron bar, has the best effect. Therefore, when selecting attachment pipe fittings as an FBG-temperature attachment in the borehole, pipe fittings with high-stiffness material should be preferred.
(2) The variation curve of the FBG wavelength with temperature was analyzed, showing a linear distribution law overall. When 502 adhesive and AB adhesive were used as the binder for the four different materials (rubber bar, aluminum bar, PVC tube and iron bar), the linear fitting effect of FBG stuck to the iron bar was the best; when epoxy resin adhesive was adopted, the linear fitting effect was second only to the PVC tube. R2 can still reach 0.9684. Therefore, in FBG adhesion monitoring, the iron bar is a good attachment pipe fitting. In the application process, the material selection of attachment pipe fittings should be fully considered, combined with the monitoring target condition, on-site layout environment, cost, etc. When epoxy resin adhesive is used as the binder, the linear fitting effect of FBG stuck to PVC tube is the best. The linear fitting effect is still good when the 502 adhesive and AB adhesive are used as binders. PVC tube has strong durability and corrosion resistance. In the current on-site monitoring of landslides, PVC tube is mostly used as attachment pipe fittings. Overall, the data fitting effect of the rubber bar is the worst for the four different materials of attachment pipe fittings. Therefore, in the application of on-site underground rock and soil monitoring, the rubber should be carefully selected as the material for attachment pipe fittings.
(3) The on-site test results indicate a good consistency between the temperature variations in shallow soil and the variations in rainfall as well as soil moisture. Meteorological factors greatly influence the soil temperature variation within a depth of 0.8 m. The underground rock and soil masses of the landslide within a depth of 0.4 m are subjected to direct sunlight, and the temperature effect changes significantly. The variation trend of soil temperature at a depth of 0.1 m is consistent with the environmental temperature. Overall, the soil temperature shows a decreasing trend with an increase in depth. Due to the presence of silty clay with large particle gravel at a depth of 0.8 m underground in the landslide, the temperature of the soil below 0.8 m is stable within the range of 20~25 °C. Meanwhile, according to the moisture monitoring data of underground rock and soil in landslides, it was found that the distribution of the near-surface temperature field of the landslide reflects the hydrological conditions related to weather. Therefore, it is necessary to integrate multi-field and multi-parameter sensing data and analyze the impact of the multi-field interaction on landslide stability.
Considering the solid superimposed effect of extreme weather conditions, such as thunderstorms and strong winds, on the deformation and instability of underground rock and soil in landslides, in the future, wavelet domain denoising and its association rules can be further utilized to optimize the multi-field and multi-parameter data (deformation, temperature, seepage and resistivity) of underground rock and soil in landslides. Machine learning, model optimization, cluster analysis other methods and technologies can be integrated to establish a prediction model based on the accumulated landslide deformation and instability data so that the landslide disaster risks can be predicted accurately and evaluated scientifically.

Author Contributions

G.C. and T.L. designed the overall framework and conceived the idea of this paper; Z.W., H.Z. and Q.Y. conducted tests and organized test information; G.C., Z.W. and J.W. completed the analyses and summary of the test progresses and results; B.S. provided some suggestions on the structure of the paper; G.C., Z.W. and Y.W. wrote the paper. All authors have read and agreed to the published version of the manuscript.

Funding

This research was funded by the Natural Science Foundation of Hebei Province, China (D2022508002); the Central Government Guided Local Science and Technology Development Fund (226Z5404G); the State Key Laboratory of Geohazard Prevention and Geoenvironment Protection (SKLGP2021K005); the Suzhou Science and Technology Plan Project (SYG202034); the National Key Research and Development Program of China (2018YFC1505104) and the Hebei IoT Monitoring Engineering Technology Innovation Center (21567693H).

Data Availability Statement

Not applicable.

Acknowledgments

The authors would like to thank Honghu Zhu and Xiao Ye for their assistance in designing the research plan and data processing.

Conflicts of Interest

The authors declare no conflict of interest.

References

  1. Thomas, J.; Gupta, M.; Prusty, G. Assessing global parameters of slope stability model using earth data observations for forecasting rainfall—Induced shallow landslides. J. Appl. Geophys. 2023, 212, 104994. [Google Scholar] [CrossRef]
  2. Yao, S.B.; Jiang, D.B.; Fan, G.Z. Seasonality of precipitation over China. Chin. J. Atmos. Sci. 2017, 41, 1191–1203. [Google Scholar]
  3. Cheng, G.; Wang, Z.X.; Li, G.Q.; Zhu, H.H.; Shi, B. Process and prospect of integrated full-dimensional monitoring and early warming technology for landslides. China Saf. Sci. J. 2023, 33, 105–114. [Google Scholar]
  4. Chae, B.G.; Park, H.J.; Catani, F.; Simoni, A.; Berti, M. Landslide prediction, monitoring and early warning: A concise review of state–of–the–art. Geosci. J. 2017, 21, 1033–1070. [Google Scholar] [CrossRef]
  5. Pecoraro, G.; Calvello, M.; Piciullo, L. Monitoring strategies for local landslide early warning systems. Landslides 2019, 16, 213–231. [Google Scholar] [CrossRef]
  6. Le Breton, M.; Bontemps, N.; Guillemot, A.; Baillet, L. Landslide monitoring using seismic ambient noise correlation: Challenges and applications. Earth–Sci. Rev. 2021, 216, 103518. [Google Scholar] [CrossRef]
  7. Zhang, S.; He, N.; Zhong, W.; Hu, K.H.; Yang, H.J. Review and prospect on landslide monitoring and prediction. J. China Three Gorges Univ. 2021, 43, 39–48. [Google Scholar]
  8. Fang, K.; Zhang, J.F.; Tang, H.M.; Hu, X.L.; Yuan, H.H.; Wang, X.T.; An, P.J.; Ding, B.D. A quick and low-cost smartphone photogrammetry method for obtaining 3D particle size and shape. Eng. Geol. 2023, 322, 107170. [Google Scholar] [CrossRef]
  9. Esposito, C.; Mastrantoni, G.; Marmoni, G.M.; Antonielli, B.; Caprari, P.; Pica, A.; Schilirò, L.; Mazzanti, P.; Bozzano, F. From theory to practice: Optimisation of available information for landslide hazard assessment in Rome relying on official, fragmented data sources. Landslides 2023, 1612–5118. [Google Scholar] [CrossRef]
  10. Tarchi, D.; Casagli, N.; Fanti, R.; Leva, D.D.; Luzi, G.; Pasuto, A.; Pieraccini, M.; Silvano, S. Landslide monitoring by using ground–based SAR interferometry: An example of application to the Tessina landslide in Italy. Eng. Geol. 2003, 68, 15–30. [Google Scholar] [CrossRef]
  11. Cheng, G.; Shi, B.; Zhu, H.H.; Zhang, C.C.; Wu, J.H. A field study on distributed fiber optic deformation monitoring of overlying strata during coal mining. J. Civ. Struct. Health Monit. 2015, 5, 553–562. [Google Scholar] [CrossRef]
  12. Ou, Y.C.; Zhang, P.S.; Wang, W. Study on the evolution rule of land damage based on electrical resistivity imaging technology in mining face. Geotech. Geol. Eng. 2019, 37, 4259–4268. [Google Scholar] [CrossRef]
  13. Horiguchi, T.; Shimizu, K.; Kurashima, T.; Tateda, M.; Koyamada, Y. Development of a distributed sensing technique using Brillouin–scattering. J. Light. Technol. 1995, 13, 1296–1302. [Google Scholar] [CrossRef]
  14. Fang, K.; Tang, H.M.; Li, C.D.; Su, X.X.; An, P.J.; Sun, S.X. Centrifuge modelling of landslides and landslide hazard mitigation: A review. Geosci. Front. 2023, 14, 101493. [Google Scholar] [CrossRef]
  15. Xu, Q.; Peng, D.L.; He, C.Y.; Qi, X.; Zhao, K.Y.; Xiu, D.H. Theory and method of monitoring and early warning for sudden loess landslide—A case study at Heifangtai terrace. J. Eng. Geol. 2020, 28, 111–121. [Google Scholar]
  16. Yang, C.Y.; Zhang, T.; Gao, G.; Bu, C.Y.; Wu, H. Application of SBAS–InSAR technology in monitoring of ground deformation of representative giant landslides in Jinsha river basin, Jiangda County, Tibet. Chin. J. Geol. Hazard Control 2022, 33, 94–105. [Google Scholar]
  17. Zhou, C.M.; Zhao, Z.P.; Lu, Y. The influence of water content on strength and deformation parameters of sliding zone and slope stability. J. Disaster Prev. Mitig. Eng. 2016, 36, 213–219. [Google Scholar]
  18. Huang, C. Shallow Landslide Stability Study Based on Water Content Change. Master’s Thesis, University of South China, Hengyang, China, March 2017. [Google Scholar]
  19. Hojat, A.; Diego, A.; Vladislav, I.I.; Laura, L.; Monica, P.; Marco, S.; Greta, T.; Luigi, Z. Geoelectrical characterization and monitoring of slopes on a rainfall–triggered landslide simulator. J. Appl. Geophys. 2019, 170, 103844. [Google Scholar] [CrossRef]
  20. Zhu, H.H.; Shi, B.; Zhang, C.C. FBG–based monitoring of geohazards: Current status and trends. Sensors 2017, 17, 452. [Google Scholar] [CrossRef]
  21. Han, H.M.; Shi, B.; Zhang, C.C.; Sang, H.W.; Huang, X.X.; Wei, G.Q. Application of ultra–weak FBG technology in real–time monitoring of landslide shear displacement. Acta Geotech. 2022, 18, 2585–2601. [Google Scholar] [CrossRef]
  22. Chen, J.; Cheng, F.; Xiong, F.; Zhang, S. Seepage monitoring method and calibrating test based on FBG–hydrothermal cycling integration system. Guangdianzi Jiguang J. Optoelectron. Laser 2016, 27, 479–485. [Google Scholar]
  23. Tan, D.J.; Han, B.; Li, L.L.; Liu, J.P. Study on the application of FBG technology in rainfall monitoring. Adv. Mater. Res. 2013, 668, 959–963. [Google Scholar] [CrossRef]
  24. Guo, Y.X.; Fu, J.J.; Li, L.Q.; Xiong, L. Fiber Bragg grating sensor–based monitoring strategy for slope deformation in centrifugal model test. Sens. Rev. 2019, 39, 71–77. [Google Scholar] [CrossRef]
  25. Gischig, V.S.; Moore, J.R.; Evans, K.F.; Amann, F.; Loew, S. Thermomechanical forcing of deep rock slope deformation: 2. The Randa rock slope instability. J. Geophys. Res. 2011, 116, F04011. [Google Scholar] [CrossRef]
  26. Watson, A.; Moore, D.; Stewart, T. Temperature influence on rock slope movements at Checkerboard Creek. Landslides: Evaluation and Stabilization. In Proceedings of the 9th International Symposium on Landslides; 2004; pp. 1293–1298. Available online: https://pascal-francis.inist.fr/vibad/index.php?action=getRecordDetail&idt=17394091 (accessed on 31 July 2023).
  27. Zhang, L.; Cui, Y.F.; Zhu, H.H.; Wu, H.; Han, H.M.; Yan, Y.; Shi, B. Shear deformation calculation of landslide using distributed strain sensing technology considering the coupling effect. Landslides 2023, 20, 1583–1597. [Google Scholar] [CrossRef]
  28. Prakasam, C.; Aravinth, R.; Kanwar, V.S.; Nagarajan, B. Design and Development of Real-time landslide early warning system through low cost soil and rainfall sensors. Mater. Today Proc. 2021, 45, 5649–5654. [Google Scholar]
  29. Shi, B. On fields and their coupling in engineering geology. J. Eng. Geol. 2013, 21, 673–680. [Google Scholar]
  30. Veveakis, E.; Vardoulakis, I.; Di, T.G. Thermoporomechanics of creeping landslides: The 1963 Vaiont slide, northern Italy. J. Geophys. Res. Earth Surf. 2007, 112. [Google Scholar] [CrossRef]
  31. Seguí, C.; Veveakis, M. Continuous assessment of landslides by measuring their basal temperature. Landslides 2021, 18, 3953–3961. [Google Scholar] [CrossRef]
  32. Zhu, H.H. Engineering geological interface: From multivariate characterization to evolution mechanism. Bull. Geol. Sci. Technol. 2023, 42, 1–19. [Google Scholar]
  33. Wang, Z.R.; Zhang, J.F.; Wang, W.Y.; Feng, B.P. Applicability of Gree–Ampt formula for infiltration affected by temperature. Shuili Xuebao 2002, 10, 46–50. [Google Scholar]
  34. Mao, X.S.; Li, N.; Wang, B.G.; Hu, C.S. Analysis model of stress and deformation of permafrost subgrade with phase changing. J. Traffic Transp. Eng. 2007, 1, 58–62. [Google Scholar]
  35. Niu, F.J.; Zhang, L.X.; Yu, Q.H.; Xie, Q. Study on slope types and stability of typical slopes in permafrost regions of the Tibetan Plateau. J. Glaciol. Geocryol. 2002, 5, 608–613. [Google Scholar]
  36. Habibagahi, K. Temperature effect and the concept of effective void ratio. Indian Geotech. J. 1977, 1, 14–34. [Google Scholar]
  37. Gao, Y.X.; Feng, Z.; Zheng, J.L. Temperature properties of sheer strength for unsaturated soil. J. Chang. Commun. Univ. 2002, 4, 68–71. [Google Scholar]
  38. Sun, Y.J. Bank Slope Multi–Fields Monitoring Based on Fiber Optic Sensing Technologies and Stability Evaluation Study. Doctor’s Thesis, Nanjing University, Nanjing, China, March 2015. [Google Scholar]
  39. Wan, S.P.; He, X.D.; Gao, Y.Q. Theoretical analysis of power–to–temperature coefficients of Brillouin signals. J. Test Meas. Technol. 2007, 21, 274–277. [Google Scholar]
  40. Jiao, H.R. Study on the Temperature Effects on Fiber Optic Cables (Sensors) Used for Geological and Geotechnical Monitoring. Master’s Thesis, Nanjing University, Nanjing, China, June 2019. [Google Scholar]
  41. Zhu, H.H.; Shi, B.; Yan, J.F.; Zhang, J.; Zhang, C.C.; Wang, B.J. Fiber Bragg grating–based performance monitoring of a slope model subjected to seepage. Smart Mater. Struct. 2014, 23, 1–12. [Google Scholar] [CrossRef]
  42. Zhang, L.; Zhu, H.H.; Han, H.M.; Shi, B. Fiber optic monitoring of an anti–slide pile in a retrogressive landslide. J. Rock Mech. Geotech. Eng. 2023; in press. [Google Scholar] [CrossRef]
  43. Zhu, H.H.; Shi, B.; Yan, J.F.; Zhang, J.; Wang, J. Investigation of the evolutionary process of a reinforced model slope using a fiber–optic monitoring network. Eng. Geol. 2015, 186, 34–43. [Google Scholar] [CrossRef]
  44. Xu, K.J. Sensors and Detective Technology; Publishing House of Electronics Industry: Beijing, China, 2016. [Google Scholar]
  45. Tian, F.F.; Cong, J.W.; Yun, B.F.; Cui, Y.P. A fiber Bragg grating current sensor with temperature compensation. Optoelectron. Lett. 2009, 5, 347–351. [Google Scholar] [CrossRef]
  46. Chen, M. Temperature Self–Compensated Fiber Bragg Grating Strain Sensor. Master’s Thesis, Kunming University of Science and Technology, Kunming, China, March 2010. [Google Scholar]
  47. Ai, F.; Li, H.; He, T.; Yan, Z.; Liu, D.; Sun, Q. Simultaneous distributed temperature and vibration measurement with UWFBG based coherent OTDR. In Optical Fiber Communication Conference; Optica Publishing Group: San Diego, CA, USA, 2018. [Google Scholar]
  48. Ilyushin, Y.; Afanaseva, O. Spatial distributed control system of temperature field: Synthesis and modeling. ARPN J. Eng. Appl. Sci. 2021, 16, 1491–1506. [Google Scholar]
  49. Sui, H.G. Application of PT100 temperature sensor to real–time temperature monitoring system. Comput. Dev. Appl. 2011, 24, 64–65. [Google Scholar]
  50. Zhang, X.T.; Hu, X.H.; Zhai, Y.F.; Qin, C.H.; Zhang, J.J. The design and experimental study of high precise temperature acquisition system based on PT100. Chin. J. Sens. Actuators 2010, 23, 812–815. [Google Scholar]
  51. Zhang, Y.F. High precision temperature acquisition system based on four–wire system PT100. J. Jiamusi Univ. 2023, 41, 162–165. [Google Scholar]
  52. Li, Q.C.; Liu, R.X.; Pan, P.Y.; Qiu, W. Design and simulation of a PT100–based unbalanced bridge temperature sensor. China Comput. Commun. 2022, 34, 114–116. [Google Scholar]
  53. Ye, X.; Zhu, H.H.; Cheng, G.; Pei, H.F.; Shi, B.; Schenato, L.; Pasuto, A. Thermohydro–poro–mechanical responses of a reservoir–induced landslide tracked by high–resolution fiber optic sensing nerves. J. Rock Mech. Geotech. Eng. 2023, in press. [Google Scholar] [CrossRef]
  54. Ye, X.; Zhu, H.H.; Wang, J.; Zhang, Q.; Shi, B.; Schenato, L.; Pasuto, A. Subsurface multi–physical monitoring of a reservoir landslide with the fiber–optic nerve system. Geophys. Res. Lett. 2022, 11, 49. [Google Scholar] [CrossRef]
  55. Moritz, L.; Gabrielsson, A. Temperature effect on the properties of clay. Soft Ground Technol. Conf. 2001, 304–314. [Google Scholar] [CrossRef]
  56. Shao, Y.X.; Shi, B.; Gao, L.; Gu, K.; Zhao, L.Z. Laboratory study on influence of temperature on shear strength of unsaturated clayey soil. Geol. J. China Univ. 2009, 15, 213–217. [Google Scholar]
Figure 1. Serious losses caused by landslide disasters.
Water 15 03125 g001
Figure 2. Composition of geohazard types from 2012 to 2021 in China.
Water 15 03125 g002
Figure 3. Multi-field coupling mechanism of landslide [32].
Water 15 03125 g003
Figure 4. Principles of UWFBG sensing technology.
Water 15 03125 g004
Figure 5. UWFBG demodulation system based on optical time-domain.
Water 15 03125 g005
Figure 6. Three-wire wiring method for PT100.
Water 15 03125 g006
Figure 7. Laboratory calibration test system: (a) sensor layout; (b) test devices.
Water 15 03125 g007
Figure 8. Adhesives and attachment materials used in the test.
Water 15 03125 g008
Figure 9. The wavelength variation of FBG under three adhesives: (a) 502 adhesive; (b) AB adhesive; (c) epoxy resin adhesive.
Water 15 03125 g009
Figure 10. Comparison of control variables for test results: (a) the fitting relationship between the wavelength and temperature under the action of 502 adhesive; (b) R2 under the action of 502 adhesive; (c) the fitting relationship between the wavelength and temperature under the action of AB adhesive; (d) R2 under the action of AB adhesive; (e) the fitting relationship between the wavelength and temperature under the action of epoxy resin adhesive; (f) R2 under the action of epoxy resin adhesive.
Water 15 03125 g010
Figure 11. Test results of PT100: (a) the first cycle: 20 °C-40 °C-20 °C; (b) the second cycle: 20 °C-50 °C-20 °C; (c) the third cycle: 16 °C-36 °C-23 °C.
Water 15 03125 g011
Figure 12. Test results of RC-4.
Water 15 03125 g012
Figure 13. Location of the study area [53].
Water 15 03125 g013
Figure 14. Layout scheme of on-site landslide monitoring.
Water 15 03125 g014
Figure 15. Layout processes: (a) borehole implement; (b) guiding hammer layout; (c) sensor installation; (d) system integration.
Water 15 03125 g015
Figure 16. Test results of on-site landslide monitoring: (a) temperature distribution of underground rock and soil; (b) moisture distribution of underground rock and soil.
Water 15 03125 g016
Table 1. Performance parameters of optic-electric sensing technology and the technical indicators of commercial equipment.
Fiber Optic Sensing TechnologyMeasurement RangeMeasurement PrecisionCommercial Equipment
DeviceTechnical Indicators
FBG
Water 15 03125 i001
The series length1 με/0.1 °CNZS-FBG-A01
Water 15 03125 i002
Wavelength range: 1528~1568 nm
Wavelength resolution: 1 pm
Repeatability: ±3 pm
Demodulation speed: ≤1 Hz
Dynamic range: 35 dB
Working temperature:
−20~50 °C
PT100
Water 15 03125 i003
−200~+850 °CA: 0.15 + 0.002 × |t|
B: 0.30 + 0.005 × |t|
(t is the current environment temperature)
WZP-PT100
Water 15 03125 i004
Temperature coefficient: Platinum nickel-plated wire
Specification: DIN EN60751
Chip size: 2.3 mm × 2.1 mm × 0.9 m
Vibration resistance level: 10~2000 Hz
Self-heating coefficient: 0.4 K/MW (0 °C)
Response time: [email protected] = 0.05st0.9 = 0.15 s; Air@2m/st0.5 = 3.0st0.5 = 10.0 s
RC-4
Water 15 03125 i005
−30~60 °C±1 °CRC-4HC
Water 15 03125 i006
Measuring range: −30~60 °C (Built-in probe); −40~85 °C (External probe)
Size: 84 mm × 44 mm × 20 mm
Measuring accuracy: ±0.5 °C (−20~40 °C); ±1 °C (−∞, −20) ∩ (40, + ∞)
Resolution: 0.1 °C
Disclaimer/Publisher’s Note: The statements, opinions and data contained in all publications are solely those of the individual author(s) and contributor(s) and not of MDPI and/or the editor(s). MDPI and/or the editor(s) disclaim responsibility for any injury to people or property resulting from any ideas, methods, instructions or products referred to in the content.

