Evaluation of Water Quality Index (WQI) in and around Dhaka City Using Groundwater Quality Parameters
Abstract
:1. Introduction
2. Methods
2.1. Study Area
2.2. Sample Collection
2.3. Data Collection
2.4. WQI Calculation
2.4.1. Calculation of Unit Weight
2.4.2. Calculation of Quality Rating
2.4.3. Formula of WQI
3. Results and Discussion
3.1. Groundwater Quality Parameters
3.2. Unit Weight of Water Quality Parameters
3.3. WQI of Groundwater Samples
4. Conclusions
Author Contributions
Funding
Data Availability Statement
Acknowledgments
Conflicts of Interest
Abbreviations
| COD | Chemical Oxygen Demand |
| DO | Dissolved Oxygen |
| ECR | Environment Conservation Rules |
| mg/L | Milligram per liter |
| TDS | Total Dissolved Solids |
| TS | Total Solids |
| TSS | Total Suspended Solids |
| WHO | World Health Organization |
| WQI | Water Quality Index |
Appendix A
| Sample No. | Parameters | Observed Values, Vn | Standard Values, Sn | Recommended Agency | Ideal Value, Vid | Unit Weight, Wn | Quality Rating, qn = (Vn − Vid)/(Sn − Vid) × 100 | Wnqn | ∑Wnqn | WQI = ∑Wn qn /∑Wn |
|---|---|---|---|---|---|---|---|---|---|---|
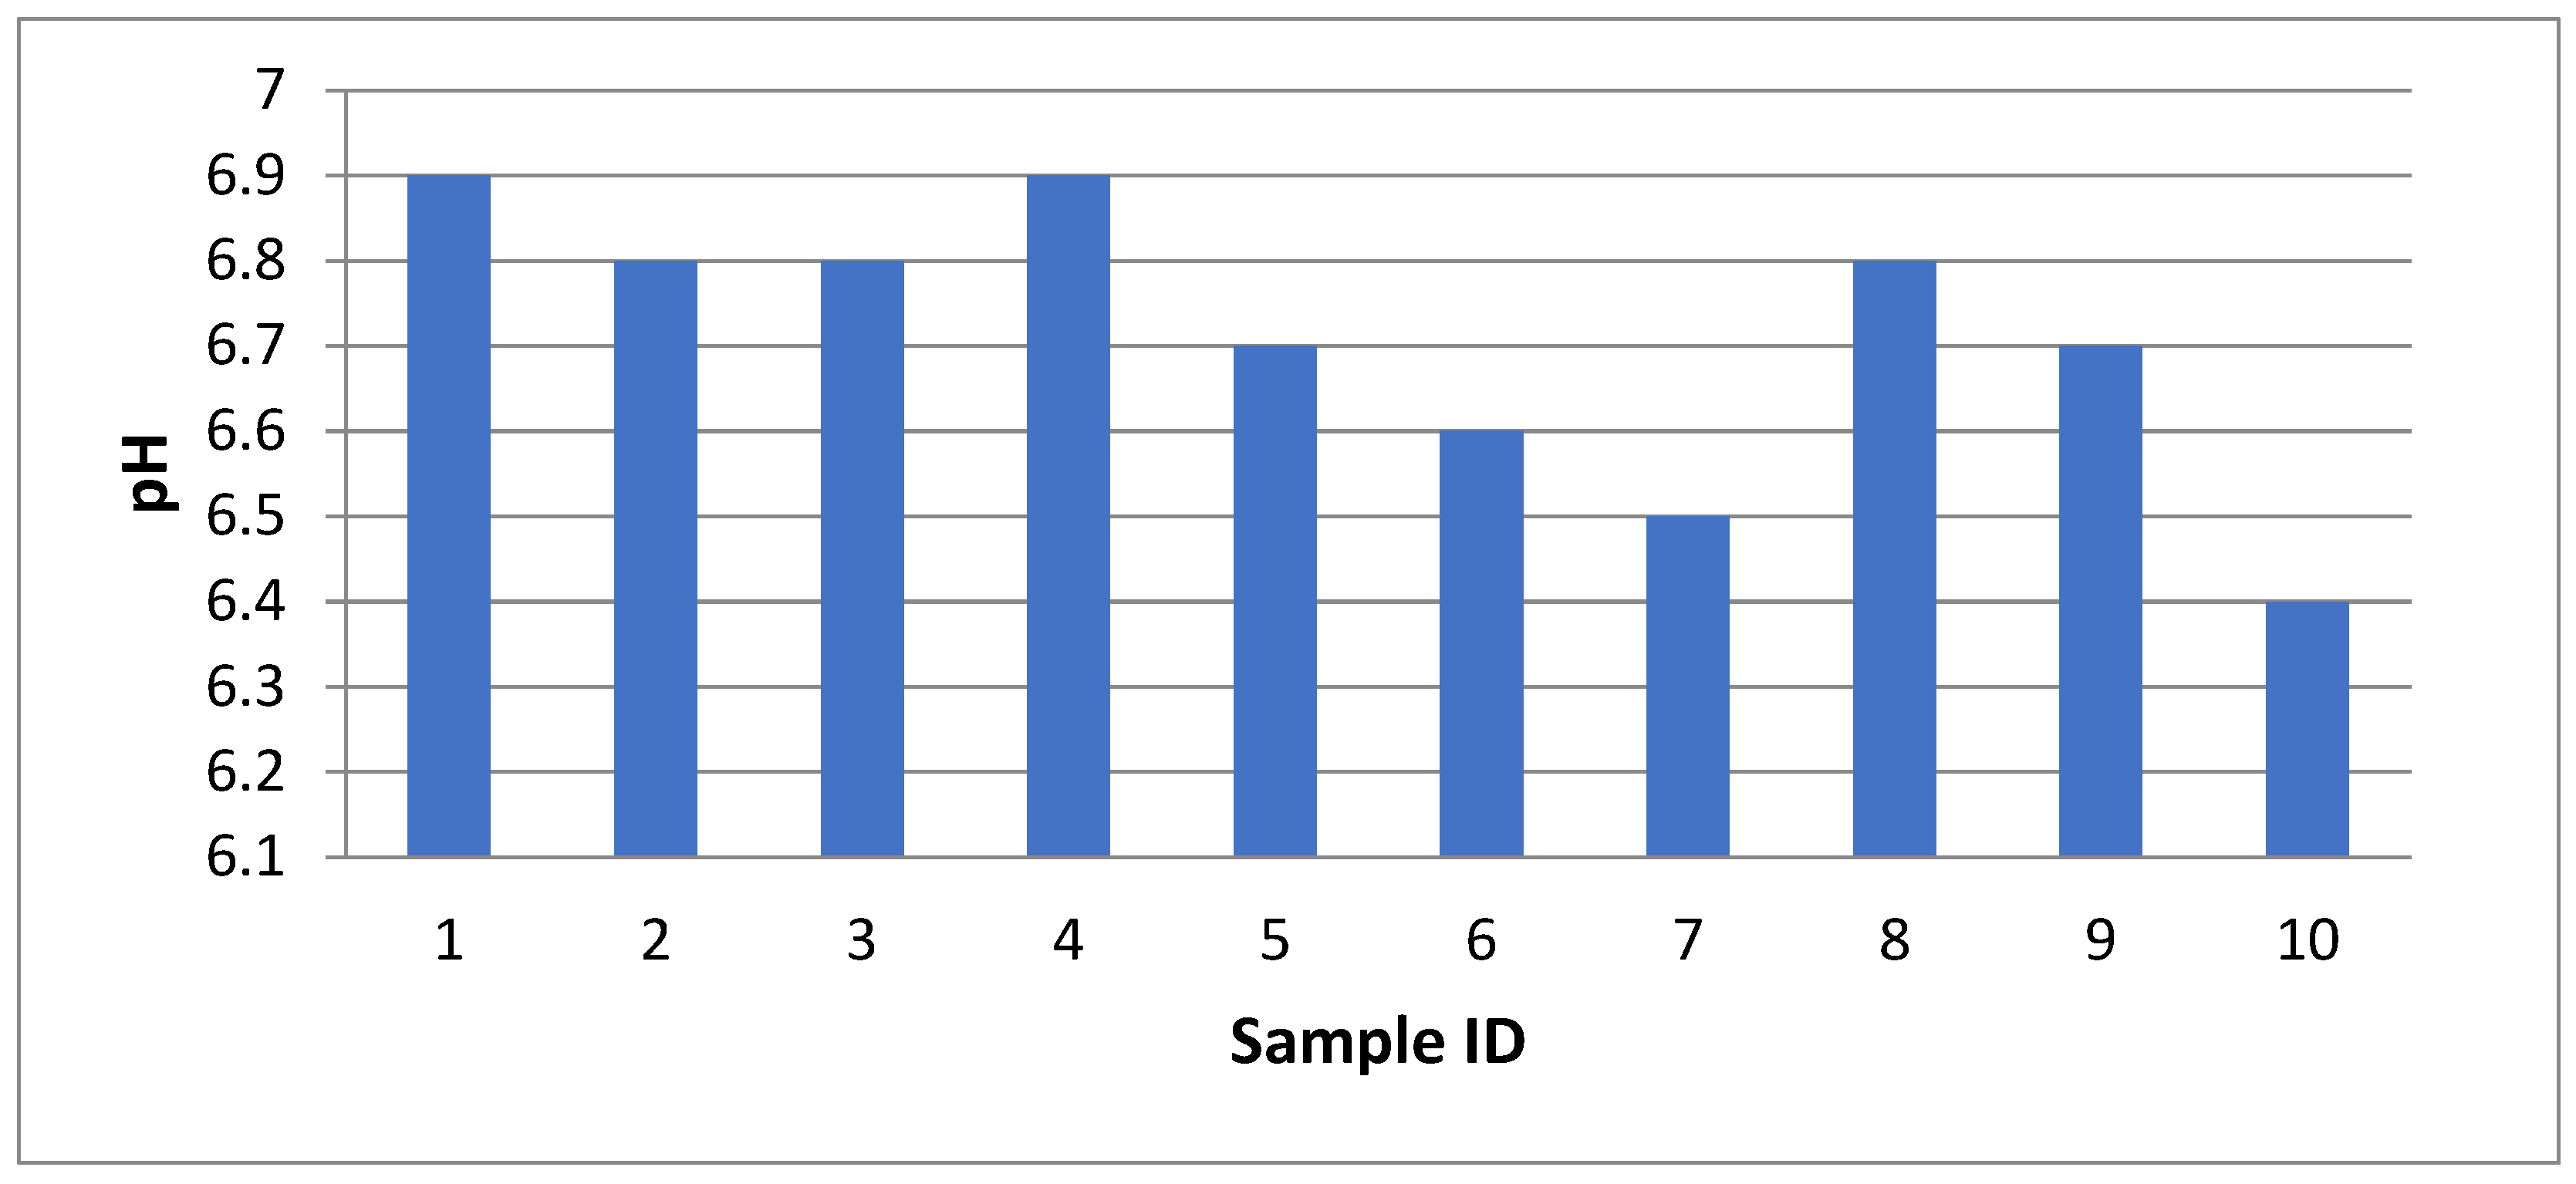
| 3 | pH | 6.8 | 8.5 | ECR [22] | 7 | 0.005729 | 13.333333 | 0.076383 | 0.164 | 0.164 |
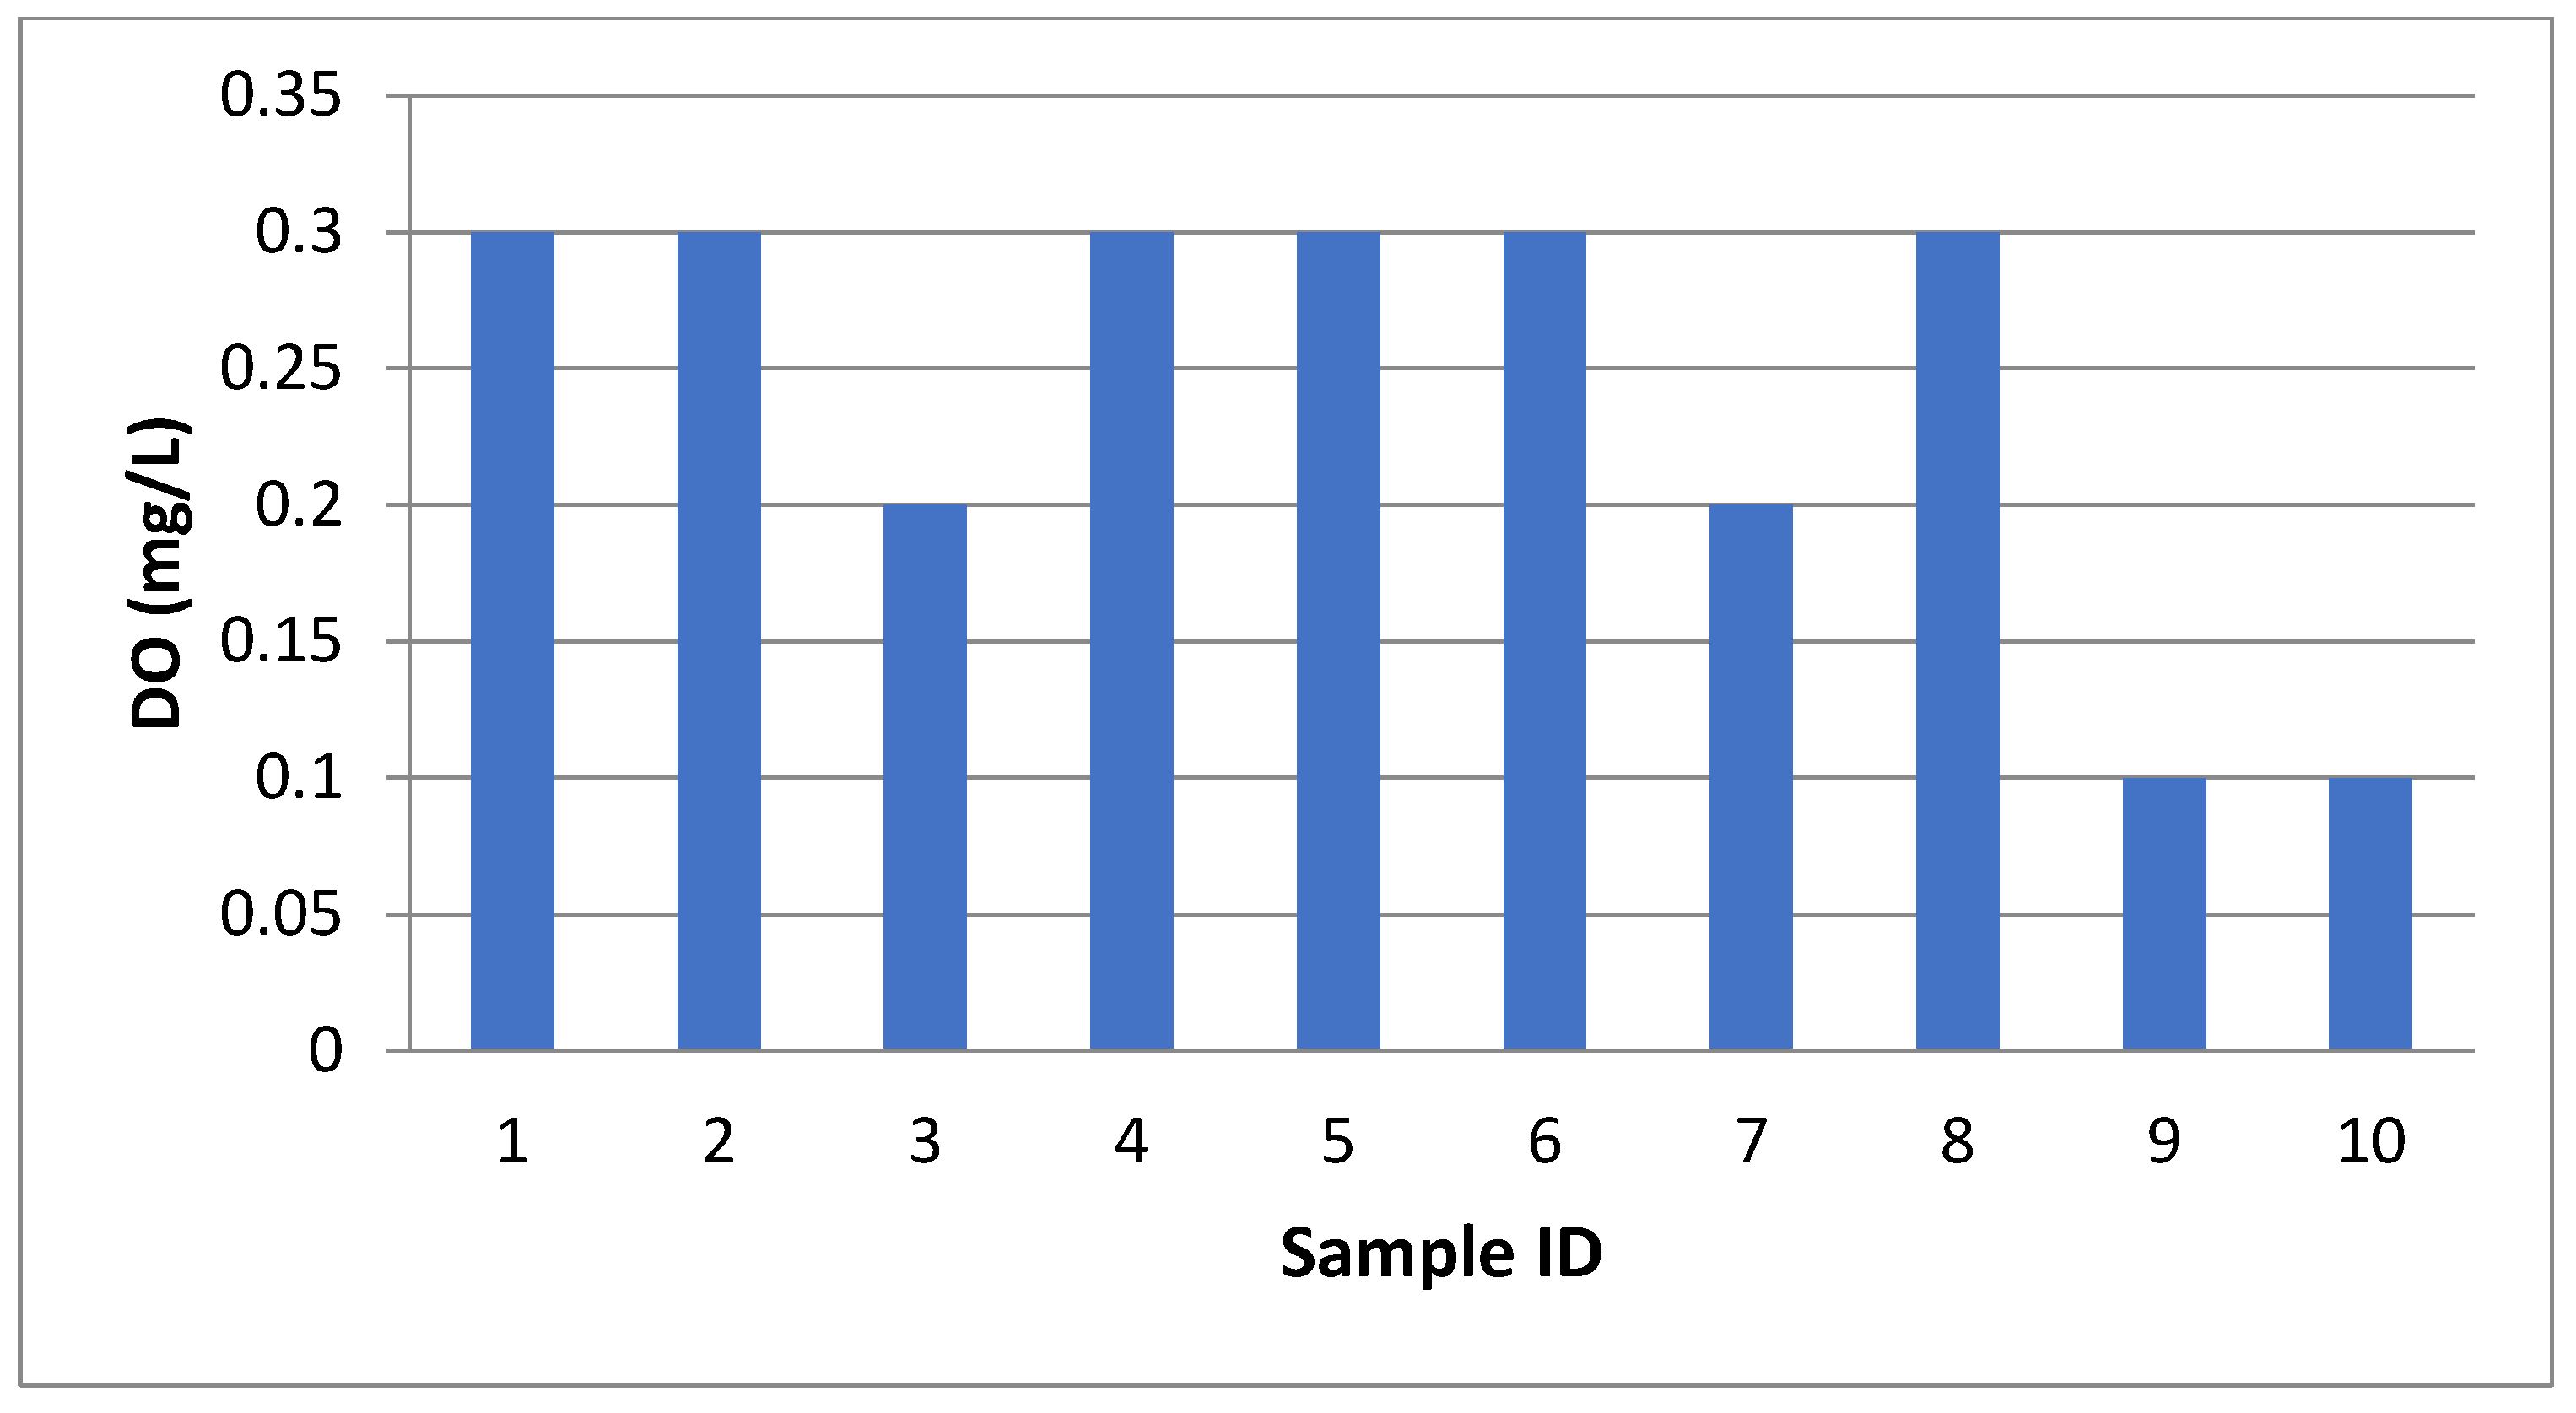
| DO (mg/L) | 0.2 | 6 | ECR [22] | 0 | 0.008116 | 3.333333 | 0.027052 | |||
| COD (mg/L) | 0.2 | 4 | ECR [22] | 0 | 0.012174 | 5.000000 | 0.060868 | |||
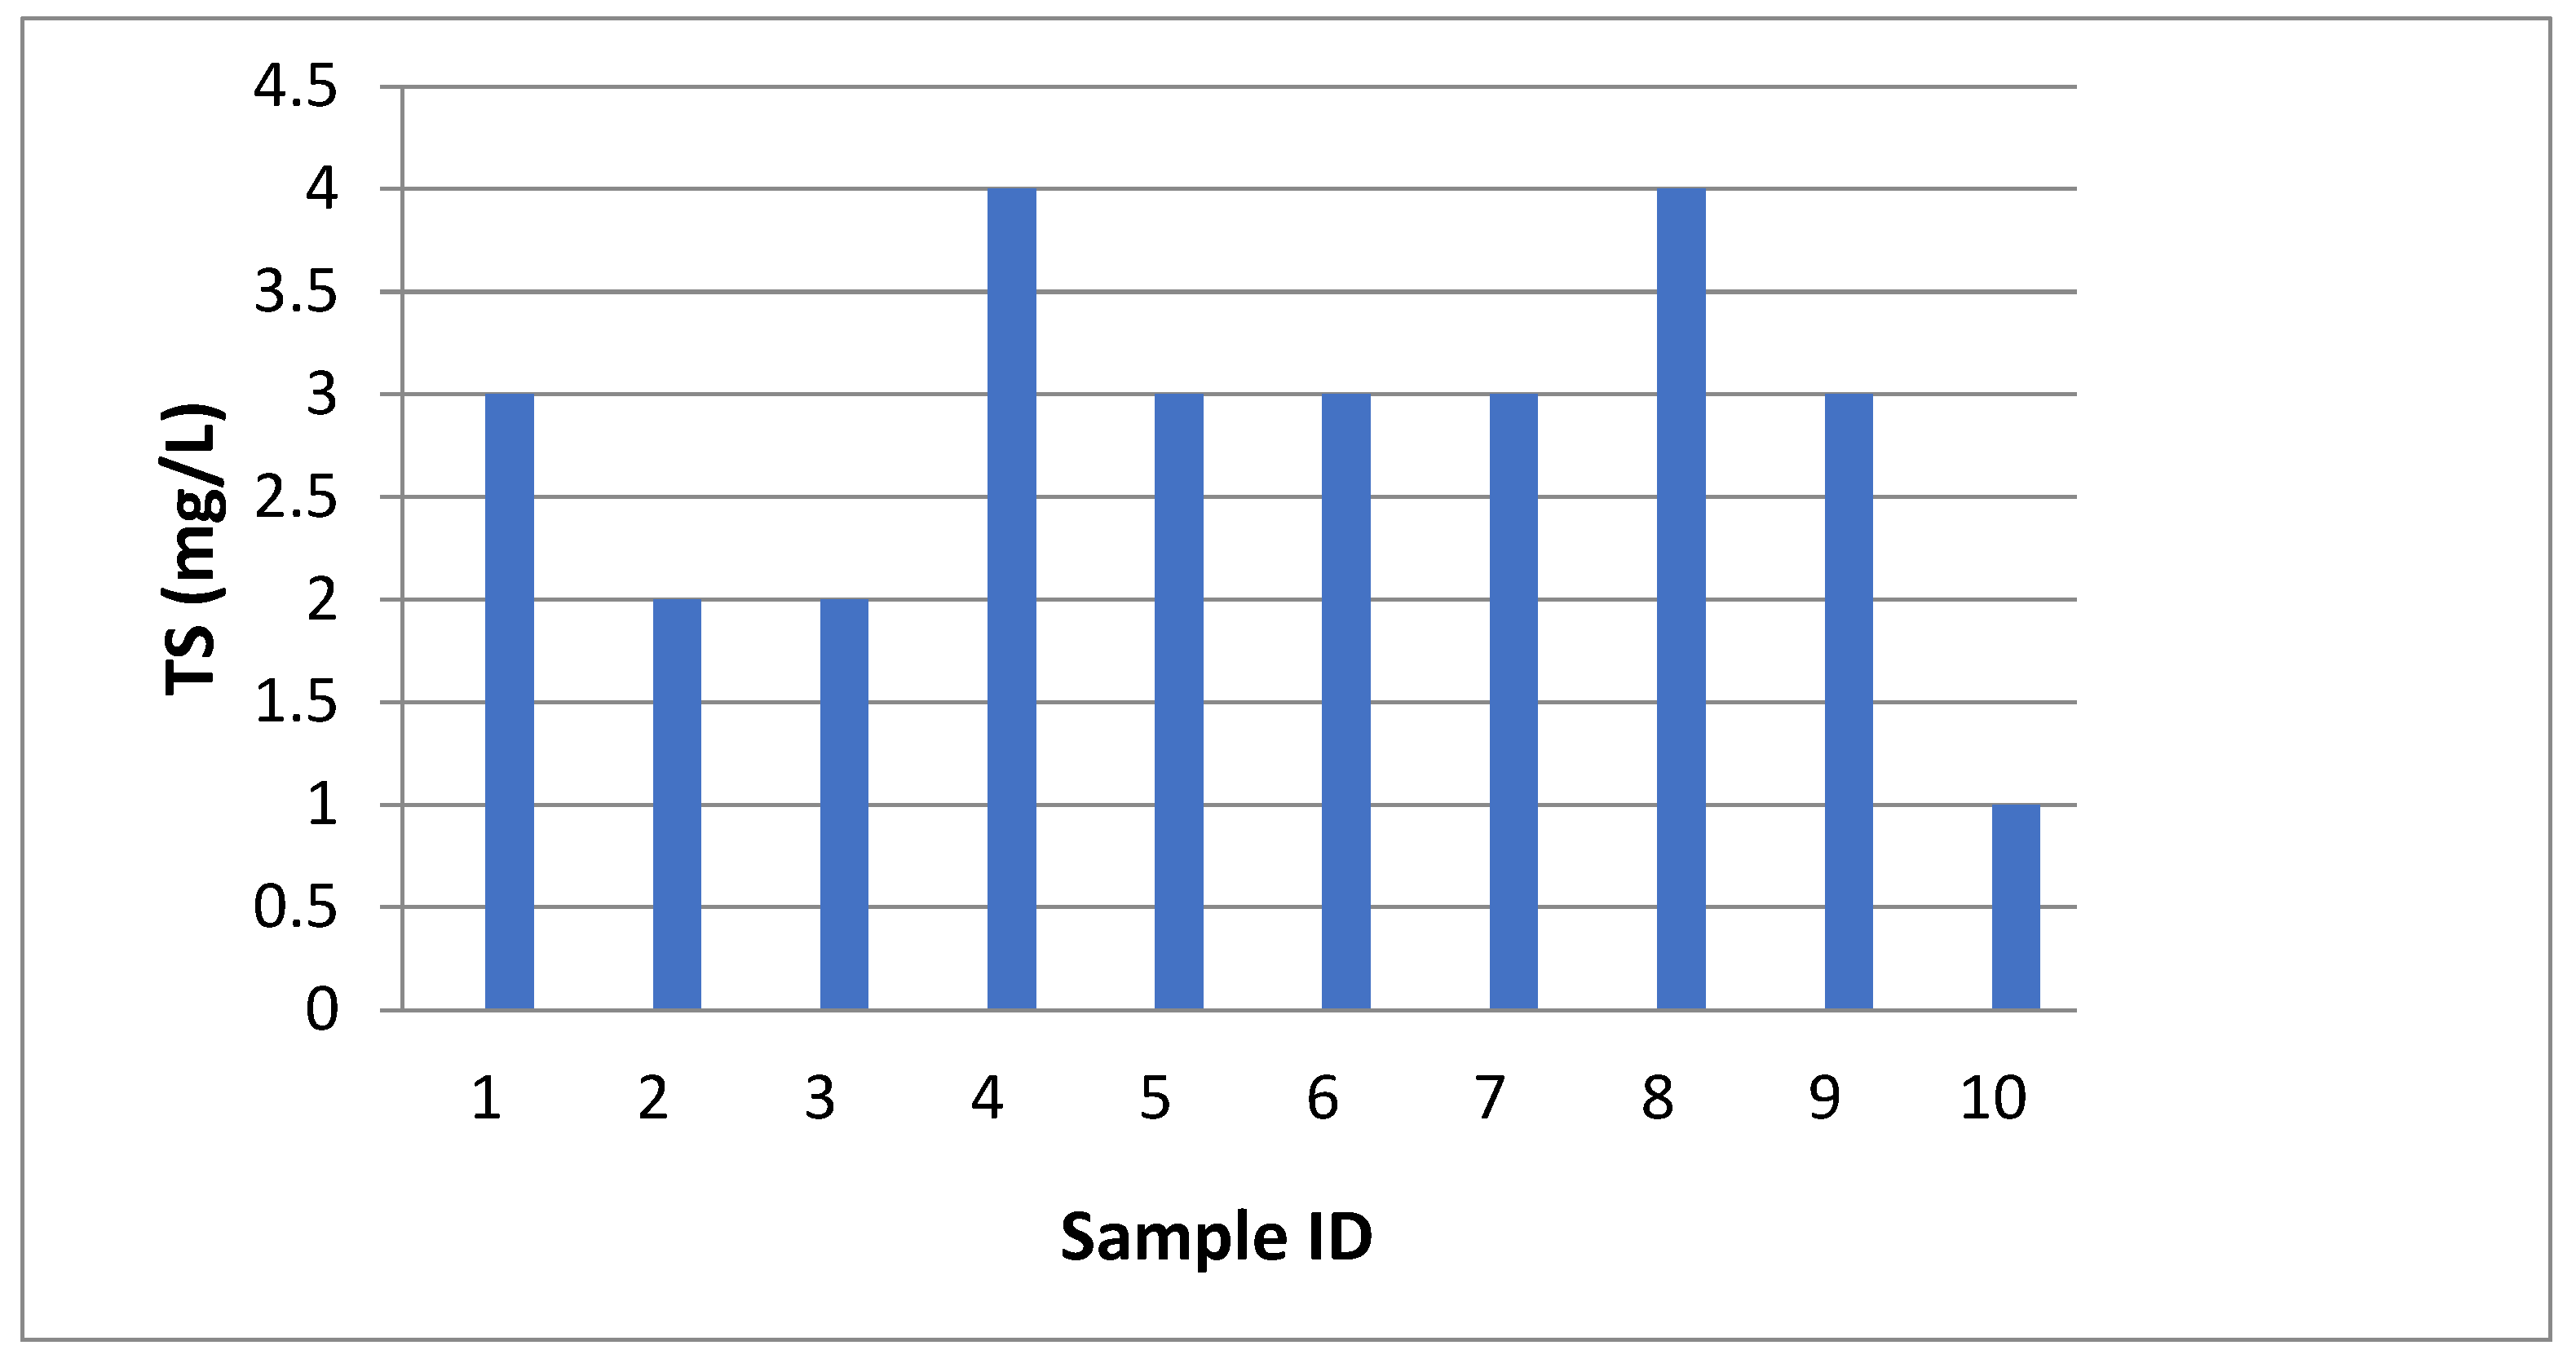
| TS (mg/L) | 2 | 1010 | ECR [22] | 0 | 0.000048 | 0.198020 | 0.000010 | |||
| TDS (mg/L) | 0.1 | 1000 | ECR [22] | 0 | 0.000049 | 0.010000 | 0.000000 | |||
| Arsenic (mg/L) | 0 | 0.05 | ECR [22] | 0 | 0.973885 | 0.000000 | 0.000000 | |||
| 4 | pH | 6.9 | 8.5 | ECR [22] | 7 | 0.005729 | 6.666667 | 0.038192 | 0.109 | 0.109 |
| DO (mg/L) | 0.3 | 6 | ECR [22] | 0 | 0.008116 | 5.000000 | 0.040579 | |||
| COD (mg/L) | 0.1 | 4 | ECR [22] | 0 | 0.012174 | 2.500000 | 0.030434 | |||
| TS (mg/L) | 4 | 1010 | ECR [22] | 0 | 0.000048 | 0.396040 | 0.000019 | |||
| TDS (mg/L) | 0.3 | 1000 | ECR [22] | 0 | 0.000049 | 0.030000 | 0.000001 | |||
| Arsenic (mg/L) | 0 | 0.05 | ECR [22] | 0 | 0.973885 | 0.000000 | 0.000000 | |||
| 5 | pH | 6.7 | 8.5 | ECR [22] | 7 | 0.005729 | 20.000000 | 0.114575 | 0.216 | 0.216 |
| DO (mg/L) | 0.3 | 6 | ECR [22] | 0 | 0.008116 | 5.000000 | 0.040579 | |||
| COD (mg/L) | 0.2 | 4 | ECR [22] | 0 | 0.012174 | 5.000000 | 0.060868 | |||
| TS (mg/L) | 4 | 1010 | ECR [22] | 0 | 0.000048 | 0.396040 | 0.000019 | |||
| TDS (mg/L) | 0.2 | 1000 | ECR [22] | 0 | 0.000049 | 0.020000 | 0.000001 | |||
| Arsenic (mg/L) | 0 | 0.05 | ECR [22] | 0 | 0.973885 | 0.000000 | 0.000000 | |||
| 6 | pH | 6.6 | 8.5 | ECR [22] | 7 | 0.005729 | 26.666667 | 0.152766 | 0.241 | 0.241 |
| DO (mg/L) | 0.2 | 6 | ECR [22] | 0 | 0.008116 | 3.333333 | 0.027052 | |||
| COD (mg/L) | 0.2 | 4 | ECR [22] | 0 | 0.012174 | 5.000000 | 0.060868 | |||
| TS (mg/L) | 3 | 1010 | ECR [22] | 0 | 0.000048 | 0.297030 | 0.000014 | |||
| TDS (mg/L) | 0.2 | 1000 | ECR [22] | 0 | 0.000049 | 0.020000 | 0.000001 | |||
| Arsenic (mg/L) | 0 | 0.05 | ECR [22] | 0 | 0.973885 | 0.000000 | 0.000000 | |||
| 7 | pH | 6.5 | 8.5 | ECR [22] | 7 | 0.005729 | 33.333333 | 0.190958 | 0.292 | 0.292 |
| DO (mg/L) | 0.3 | 6 | ECR [22] | 0 | 0.008116 | 5.000000 | 0.040579 | |||
| COD (mg/L) | 0.2 | 4 | ECR [22] | 0 | 0.012174 | 5.000000 | 0.060868 | |||
| TS (mg/L) | 4 | 1010 | ECR [22] | 0 | 0.000048 | 0.396040 | 0.000019 | |||
| TDS (mg/L) | 0.2 | 1000 | ECR [22] | 0 | 0.000049 | 0.020000 | 0.000001 | |||
| Arsenic (mg/L) | 0 | 0.05 | ECR [22] | 0 | 0.973885 | 0.000000 | 0.000000 | |||
| 8 | pH | 6.7 | 8.5 | ECR [22] | 7 | 0.005729 | 20.000000 | 0.114575 | 0.216 | 0.216 |
| DO (mg/L) | 0.3 | 6 | ECR [22] | 0 | 0.008116 | 5.000000 | 0.040579 | |||
| COD (mg/L) | 0.2 | 4 | ECR [22] | 0 | 0.012174 | 5.000000 | 0.060868 | |||
| TS (mg/L) | 4 | 1010 | ECR [22] | 0 | 0.000048 | 0.396040 | 0.000019 | |||
| TDS (mg/L) | 0.2 | 1000 | ECR [22] | 0 | 0.000049 | 0.020000 | 0.000001 | |||
| Arsenic (mg/L) | 0 | 0.05 | ECR [22] | 0 | 0.973885 | 0.000000 | 0.000000 | |||
| 9 | pH | 6.7 | 8.5 | ECR [22] | 7 | 0.005729 | 20.000000 | 0.114575 | 0.219 | 0.219 |
| DO (mg/L) | 0.1 | 6 | ECR [22] | 0 | 0.008116 | 1.666667 | 0.013526 | |||
| COD (mg/L) | 0.3 | 4 | ECR [22] | 0 | 0.012174 | 7.500000 | 0.091302 | |||
| TS (mg/L) | 3 | 1010 | ECR [22] | 0 | 0.000048 | 0.297030 | 0.000014 | |||
| TDS (mg/L) | 0.3 | 1000 | ECR [22] | 0 | 0.000049 | 0.030000 | 0.000001 | |||
| Arsenic (mg/L) | 0 | 0.05 | ECR [22] | 0 | 0.973885 | 0.000000 | 0.000000 | |||
| 10 | pH | 6.4 | 8.5 | ECR [22] | 7 | 0.005729 | 40.000000 | 0.229149 | 0.303 | 0.303 |
| DO (mg/L) | 0.1 | 6 | ECR [22] | 0 | 0.008116 | 1.666667 | 0.013526 | |||
| COD (mg/L) | 0.2 | 4 | ECR [22] | 0 | 0.012174 | 5.000000 | 0.060868 | |||
| TS (mg/L) | 1 | 1010 | ECR [22] | 0 | 0.000048 | 0.099010 | 0.000005 | |||
| TDS (mg/L) | 0.1 | 1000 | ECR [22] | 0 | 0.000049 | 0.010000 | 0.000000 | |||
| Arsenic (mg/L) | 0 | 0.05 | ECR [22] | 0 | 0.973885 | 0.000000 | 0.000000 |
References
- Gleick, P.H. An Introduction to Global Fresh Water Issues. In Water in Crisis; Gleick, P., Translator; Oxford University Press: New York, NY, USA, 1993; pp. 3–12. [Google Scholar]
- Gleick, P.H. Water Conflict Chronology. Pacific Institute for Studies in Development, Environment and Security. 2003. Available online: http://worldwater.org/wp-content/uploads/2013/07/ww8-red-water-conflict-chronology-2014.pdf (accessed on 1 June 2023).
- Raven, P.H.; Berg, L.R.; Johnson, G.B. Environment; Harcourt Brace College Publishers: Fort Worth, TX, USA, 1995; p. 569. [Google Scholar]
- Botkin, D.B.; Keller, E.A. Environmental Science. Earth as a Living Planet; John Wiley: Hoboken, NJ, USA, 2003; p. 688. [Google Scholar]
- Noutcha, M.; Damiete, O.; Johnny, M.; Ngozi, O.; Ezera, C.; Okiwelu, S. Quantity and Quality of Water Condensate from Air Conditioners and its Potential Uses at the University of Port Harcourt Nigeria. Adv. Appl. Sci. Res. 2016, 7, 45–48. [Google Scholar]
- Karim, M.; Das, S.K.; Paul, S.C.; Islam, M.F.; Hossain, M.S. Water quality assessment of Karrnaphuli river, Bangladesh using multivariate analysis and pollution indices. Asian J. Environ. Ecol. 2018, 7, 1–11. [Google Scholar] [CrossRef]
- Arnal, J.M.; Sancho, M.; Verd, G.; Lora, J. Design and installation of a decentralized drinking water system based on ultra filtration in Mozambique. Desalination 2010, 205, 613–617. [Google Scholar]
- Bhateria, R.; Jain, D. Water quality assessment of groundwater: A review. Sustain. Water Recourse. Manag. 2016, 2, 161–173. [Google Scholar] [CrossRef] [Green Version]
- Cohen, J.M.; Kamphake, L.J.; Harris, E.K.; Woodward, R.L. Taste threshold concentrations of metals in drinking water. J. Am. Water Work. Assoc. 1990, 52, 650–660. [Google Scholar] [CrossRef]
- Cox, D. Water Quality: pH and Alkalinity; University of Massachusetts: Armherst, MA, USA, 1975. [Google Scholar]
- Adimalla, N.; Qian, H. Groundwater quality evaluation using water quality index (WQI) for drinking purposes and human health risk (HHR) assessment in an agricultural region of Nanganur, south India. Ecotoxicol. Environ. Saf. 2019, 176, 153–161. [Google Scholar] [CrossRef] [PubMed]
- Doria, M.D.F. Factors influencing public perception of drinking water quality. Water Policy 2010, 12, 1–19. [Google Scholar] [CrossRef]
- Yohannes, B.G. Assessment of Physicochemical and Bacteriological Quality of Drinking Water from Sources and House Hold Water Samples in Abbaya Woreda, Southern Ethiopia. Ph.D. Thesis, Hawasssa University, Hawassa, Ethiopia, 2019. [Google Scholar]
- Wikipedia. Drinking Water Quality Standards. Available online: https://en.wikipedia.org/wiki/Drinking_water_quality_standards (accessed on 9 December 2022).
- Wong, Y.J.; Shimizu, Y.; He, K.; Nik Sulaiman, N.M. Comparison among different ASEAN water quality indices for the assessment of the spatial variation of surface water quality in the Selangor river basin, Malaysia. Environ. Monit. Assess. 2020, 192, 644. [Google Scholar] [CrossRef] [PubMed]
- Wong, Y.J.; Shimizu, Y.; Kamiya, A.; Maneechot, L.; Bharambe, K.P.; Fong, C.S.; Nik Sulaiman, N.M. Application of artificial intelligence methods for monsoonal river classification in Selangor river basin, Malaysia. Environ. Monit. Assess. 2021, 193, 438. [Google Scholar] [CrossRef] [PubMed]
- Ram, A.; Tiwari, S.K.; Pandey, H.K.; Chaurasia, A.K.; Singh, S.; Singh, Y.V. Groundwater quality assessment using water quality index (WQI) under GIS framework. Appl. Water Sci. 2021, 11, 46. [Google Scholar] [CrossRef]
- Varol, S.; Davraz, A. Evaluation of the groundwater quality with WQI (Water Quality Index) and multivariate analysis: A case study of the Tefenni plain (Burdur/Turkey). Environ. Earth Sci. 2015, 73, 1725–1744. [Google Scholar] [CrossRef]
- Mahmud, A.; Sikder, S.; Joardar, J.C. Assessment of groundwater quality in Khulna city of Bangladesh in terms of water quality index for drinking purpose. Appl. Water Sci. 2020, 10, 226. [Google Scholar] [CrossRef]
- Horton, R.K. An index number system for rating water quality. J. Water Pollut. 1965, 3, 300–305. [Google Scholar]
- Akter, T.; Jhohura, F.T.; Akter, F.; Chowdhury, T.R.; Mistry, S.K.; Dey, D.; Barua, M.K.; Islam, M.A.; Rahman, M. Water Quality Index for measuring drinking water quality in rural Bangladesh: A cross-sectional study. J. Health Popul. Nutr. 2016, 35, 4. [Google Scholar] [CrossRef] [PubMed] [Green Version]
- ECR. The Environmental Conservation Rules. Ministry of Environmental and Forest, The People’s Republic of Bangladesh. 1997. Available online: https://faolex.fao.org/docs/pdf/bgd19918.pdf (accessed on 1 June 2023).
- Huq, F.; Hossain, S.Z. Assessment of Groundwater Quality Parameters of Zone 6 of Dhaka City. UITS J. 2013, 2, 49–59. [Google Scholar]
- Sharmin, S.; Mia, J.; Miah, M.S.; Zakir, H.M. Hydrogeochemistry and heavy metal contamination in groundwaters of Dhaka metropolitan city, Bangladesh: Assessment of human health impact. HydroResearch 2020, 3, 106–117. [Google Scholar] [CrossRef]


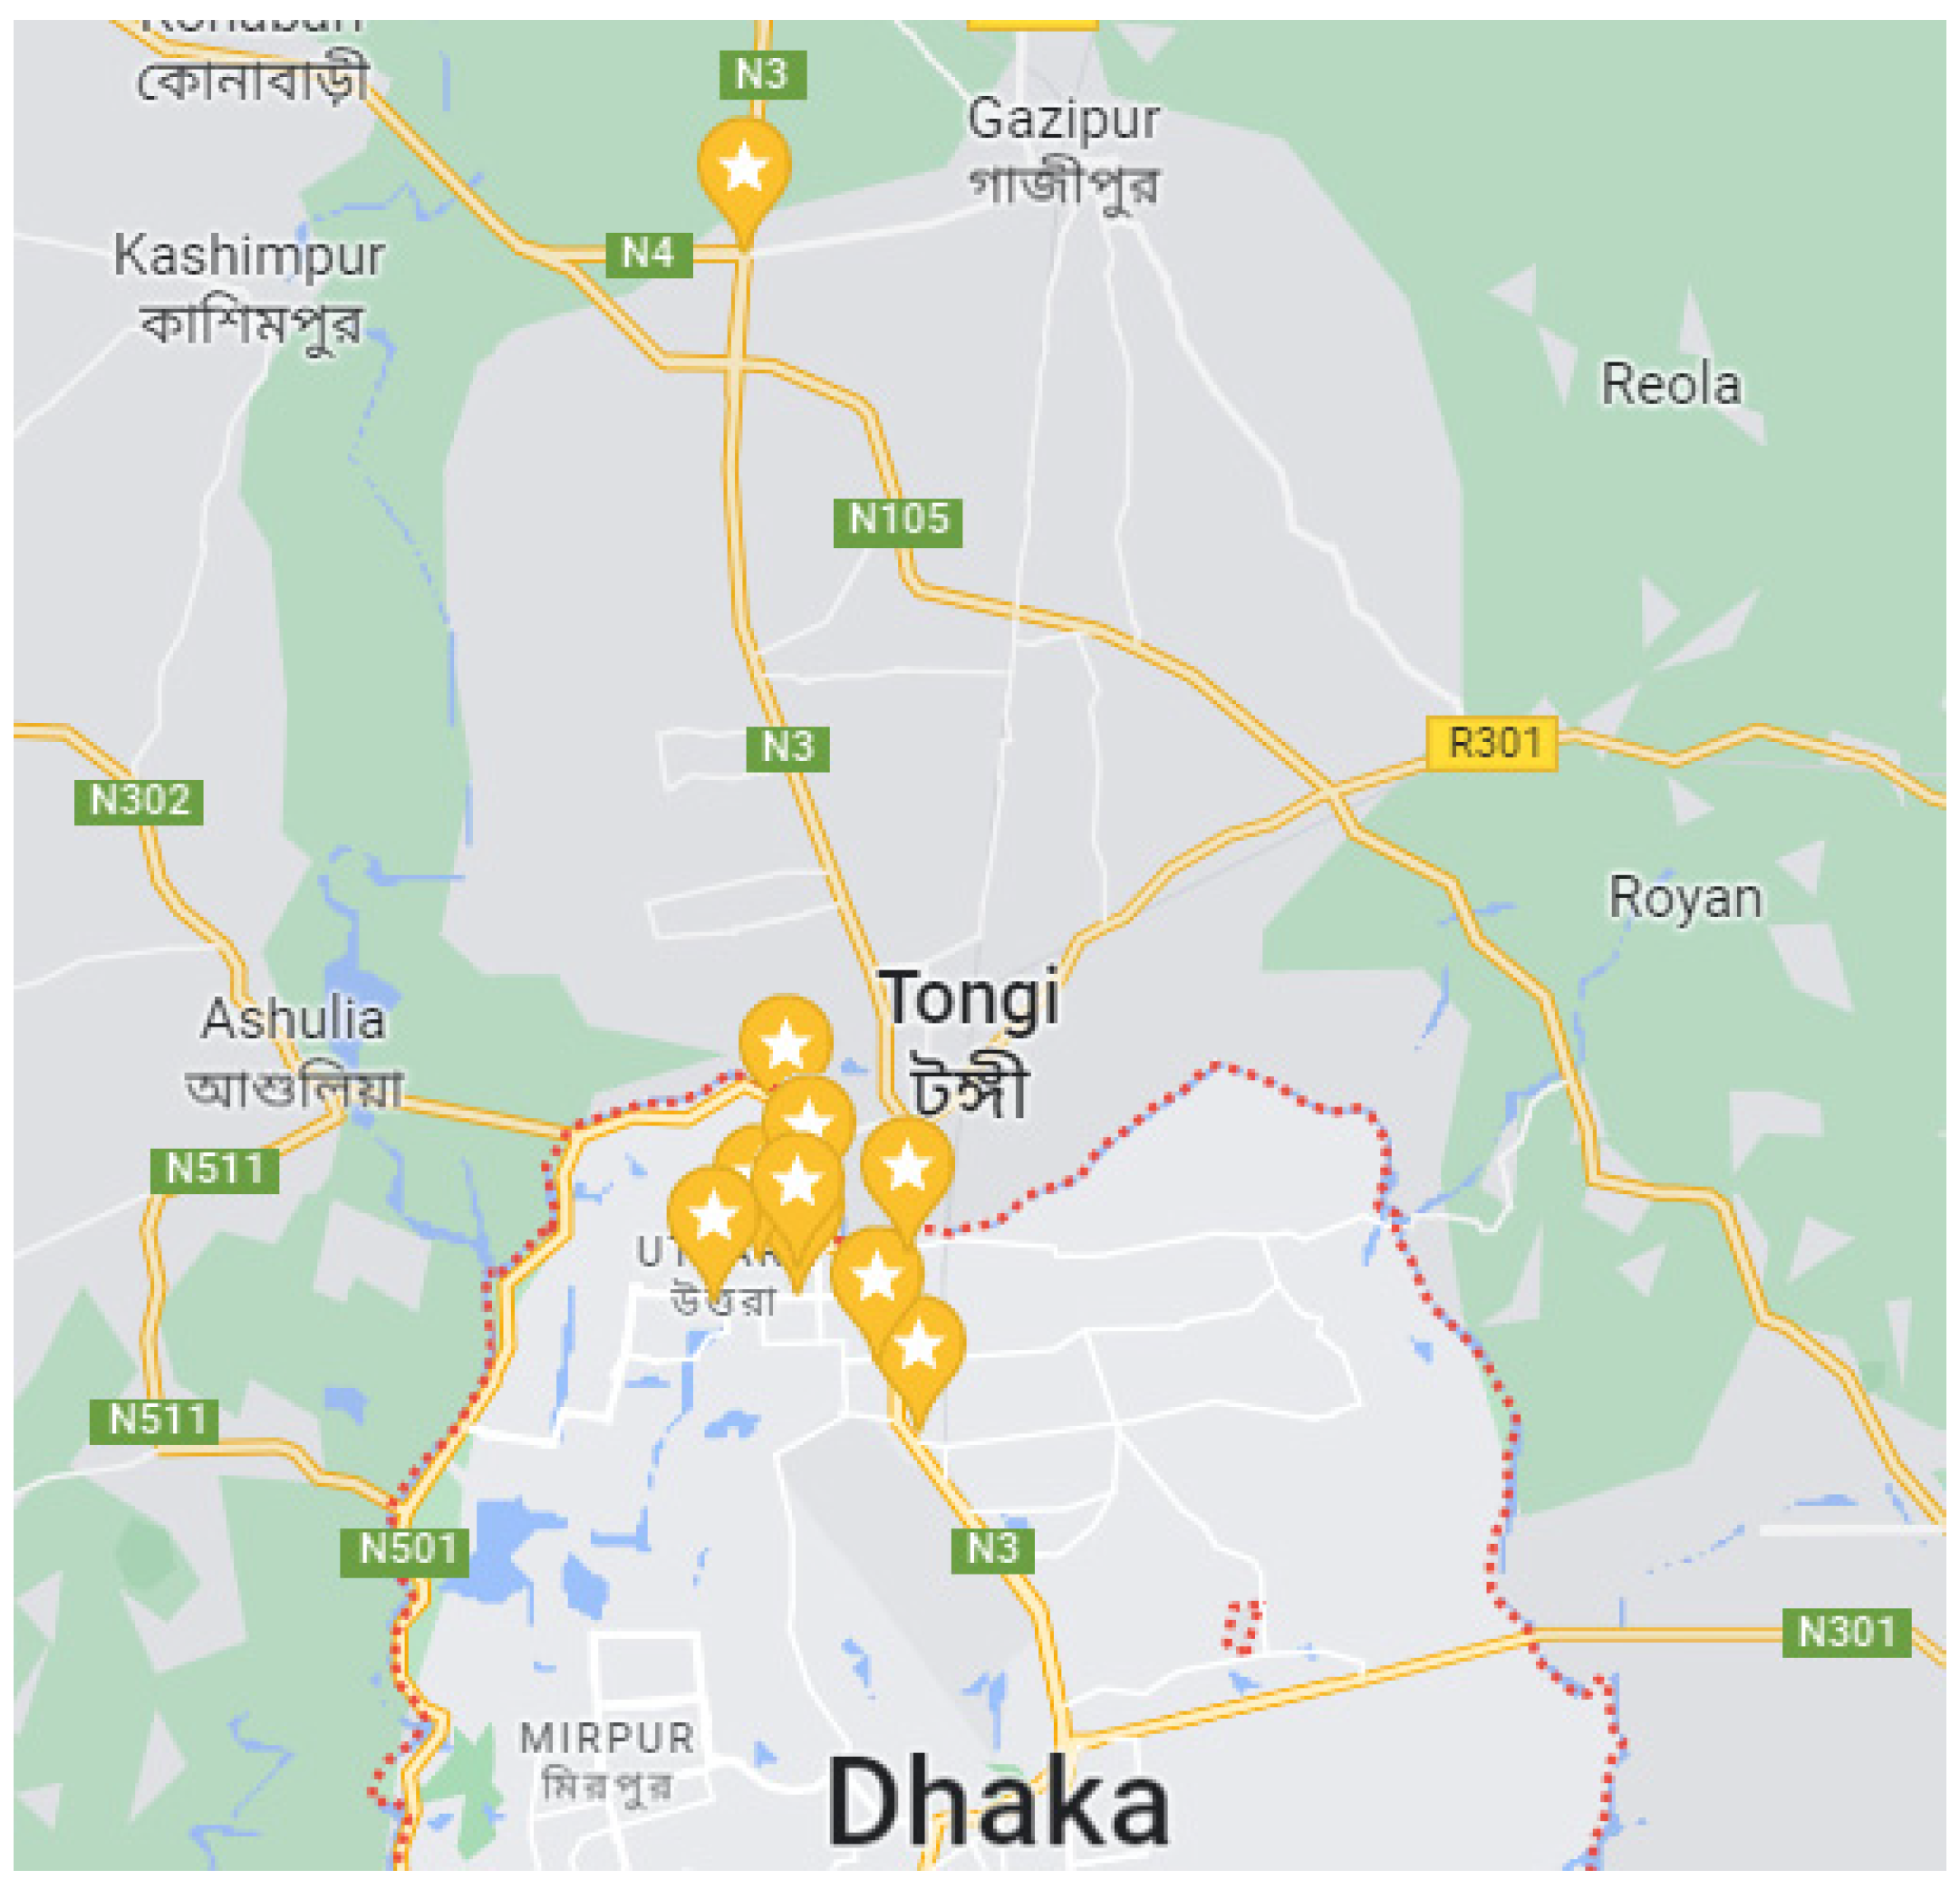
| Sample No. | Location | Collection Date | Collection Time |
|---|---|---|---|
| 1. | Khalpar, Sector 12, Uttara, Dhaka | 19 October 2020 | 9.00 AM–2.00 PM |
| 2. | Chandhona, Gazipur | 19 October 2020 | 9.00 AM–2.00 PM |
| 3. | Abdulapur, Uttara | 19 October 2020 | 9.00 AM–2.00 PM |
| 4. | Sector 11, Road 12, Uttara | 20 October 2020 | 9.00 AM–2.00 PM |
| 5. | Sector 4, Road 5, Uttara | 20 October 2020 | 9.00 AM–2.00 PM |
| 6. | Fulbaria, Uttara | 20 October 2020 | 9.00 AM–2.00 PM |
| 7. | Sector 11, Road 19, Uttara | 20 October 2020 | 9.00 AM–2.00 PM |
| 8. | Sector 7, Crescent hospital, Uttara | 21 October 2020 | 9.00 AM–2.00 PM |
| 9. | Sector 10, Road 11, Uttara | 21 October 2020 | 9.00 AM–2.00 PM |
| 10. | Sector 10, Road 20, Uttara | 21 October 2020 | 9.00 AM–2.00 PM |
| SL. No. | Parameter | Standard Values, Sn | Recommended Agency for Sn | 1/Sn | Constant of Proportionality, k = 1/(∑1/Sn) | Unit Weight, Wn = k/Sn |
|---|---|---|---|---|---|---|
| 1 | pH | 6.5–8.5 | ECR [22] | 0.11765 | 0.04869 | 0.00573 |
| 2 | DO (mg/L) | 6 | ECR [22] | 0.16667 | 0.04869 | 0.00812 |
| 3 | COD (mg/L) | 4 | ECR [22] | 0.25000 | 0.04869 | 0.01217 |
| 4 | TS (mg/L) | 1010 | ECR [22] | 0.00099 | 0.04869 | 0.00005 |
| 5 | TDS (mg/L) | 1000 | ECR [22] | 0.00100 | 0.04869 | 0.00005 |
| 6 | Arsenic (mg/L) | 0.05 | ECR [22] | 20.00000 | 0.04869 | 0.97389 |
| ∑1/Sn = 20.5363 | ∑Wn= 1.00000 |
| Sample No. | Parameters | Observed Values, Vn | Standard Values, Sn | Recommended Agency | Ideal Value, Vid | Unit Weight, Wn | Quality Rating, qn = (Vn − Vid)/(Sn − Vid) × 100 | Wnqn | ∑Wnqn | WQI = ∑Wn qn /∑Wn |
|---|---|---|---|---|---|---|---|---|---|---|
| 1 | pH | 6.9 | 8.5 | ECR [22] | 7 | 0.005729 | 6.666667 | 0.038192 | 0.140 | 0.140 |
| DO (mg/L) | 0.3 | 6 | ECR [22] | 0 | 0.008116 | 5.000000 | 0.040579 | |||
| COD (mg/L) | 0.2 | 4 | ECR [22] | 0 | 0.012174 | 5.000000 | 0.060868 | |||
| TS (mg/L) | 3 | 1010 | ECR [22] | 0 | 0.000048 | 0.297030 | 0.000014 | |||
| TDS (mg/L) | 0.2 | 1000 | ECR [22] | 0 | 0.000049 | 0.020000 | 0.000001 | |||
| Arsenic (mg/L) | 0 | 0.05 | ECR [22] | 0 | 0.973885 | 0.000000 | 0.000000 | |||
| 2 | pH | 6.8 | 8.5 | ECR [22] | 7 | 0.005729 | 13.333333 | 0.076383 | 0.208 | 0.208 |
| DO (mg/L) | 0.3 | 6 | ECR [22] | 0 | 0.008116 | 5.000000 | 0.040579 | |||
| COD (mg/L) | 0.3 | 4 | ECR [22] | 0 | 0.012174 | 7.500000 | 0.091302 | |||
| TS (mg/L) | 2 | 1010 | ECR [22] | 0 | 0.000048 | 0.198020 | 0.000010 | |||
| TDS (mg/L) | 0.1 | 1000 | ECR [22] | 0 | 0.000049 | 0.010000 | 0.000000 | |||
| Arsenic (mg/L) | 0 | 0.05 | ECR [22] | 0 | 0.973885 | 0.000000 | 0.000000 |
| Sample No. | Sampling Location | WQI |
|---|---|---|
| 1 | Khalpar, Adjacent to Sector 12, Uttara, Dhaka | 0.140 |
| 2 | Chandhona, Gazipur | 0.208 |
| 3 | Abdulapur, Uttara | 0.164 |
| 4 | Sector 11, Road 12, Uttara | 0.109 |
| 5 | Sector 4, Road 5, Uttara | 0.216 |
| 6 | Fulbaria, Uttara | 0.241 |
| 7 | Sector 11, Road 19, Uttara | 0.292 |
| 8 | Sector 7, Crescent Hospital, Uttara | 0.216 |
| 9 | Sector 10, Road 11, Uttara | 0.219 |
| 10 | Sector 10, Road 20, Uttara | 0.303 |
| Average | 0.211 | |
| SL. No. | WQI | Status | Possible Usages | Representing Samples (This Study) |
|---|---|---|---|---|
| 1 | 0–25 | Excellent | Drinking, Irrigation and Industrial | S1, S2, S3, S4, S5, S6, S7, S8, S9, S10 |
| 2 | 26–50 | Good | Domestic, Irrigation and Industrial | Nil |
| 3 | 51–75 | Fair | Irrigation and Industrial | Nil |
| 4 | 76–100 | Poor | Irrigation | Nil |
| 5 | 101–150 | Very Poor | Restricted use for Irrigation | Nil |
| 6 | Above 150 | Unfit for Drinking | Proper treatment required before use | Nil |
| Sample No. | Sampling Location | WQI |
|---|---|---|
| 1 | PG Hospital “C” Water Pump | 92.075 |
| 2 | Circuit House “C” Water Pump | 36.176 |
| 3 | Bijoynagar “C” Water Pump | 84.189 |
| 4 | Shegunbagicha “A” Water Pump | 15.733 |
| 5 | New Eskaton (Old Passport Office) “A” Water Pump | 23.323 |
| 6 | Dhaka Medical Water Pump | 18.651 |
| 7 | Rajarbag Old-1 “A” Water Pump | 27.107 |
| 8 | Fakirapul “A” Water Pump | 22.369 |
| 9 | Mogbazar Wireless “C” Water Pump | 88.383 |
| 10 | AGB Colony (SOC) Water Pump | 86.514 |
| 11 | MogbazarDilu Road “C” Water Pump | 14.808 |
| 12 | Kakrail Water Pump | 43.715 |
| 13 | Siddheswari Girls’ School Water Pump | 38.953 |
| 14 | Vigarunnisa Water Pump | 41.323 |
| 15 | Khilgaon-2 Water Pump | 32.675 |
| 16 | Khilgaon-3 Water Pump | 24.293 |
| 17 | Polwel Water Pump | 60.404 |
| 18 | Shahjahanpur Water Pump | 18.919 |
| 19 | ArambagBalur Math Water Pump | 17.723 |
| 20 | Nagar Bhaban Water Pump | 19.076 |
| 21 | High Court Water Pump | 26.903 |
| 22 | Birdem Water Pump | 26.860 |
| Average | 39.099 | |
Disclaimer/Publisher’s Note: The statements, opinions and data contained in all publications are solely those of the individual author(s) and contributor(s) and not of MDPI and/or the editor(s). MDPI and/or the editor(s) disclaim responsibility for any injury to people or property resulting from any ideas, methods, instructions or products referred to in the content. |
© 2023 by the authors. Licensee MDPI, Basel, Switzerland. This article is an open access article distributed under the terms and conditions of the Creative Commons Attribution (CC BY) license (https://creativecommons.org/licenses/by/4.0/).
Share and Cite
Ahsan, A.; Ahmed, T.; Uddin, M.A.; Al-Sulttani, A.O.; Shafiquzzaman, M.; Islam, M.R.; Ahmed, M.S.; Alamin; Mohadesh, M.; Haque, M.N.; et al. Evaluation of Water Quality Index (WQI) in and around Dhaka City Using Groundwater Quality Parameters. Water 2023, 15, 2666. https://doi.org/10.3390/w15142666
Ahsan A, Ahmed T, Uddin MA, Al-Sulttani AO, Shafiquzzaman M, Islam MR, Ahmed MS, Alamin, Mohadesh M, Haque MN, et al. Evaluation of Water Quality Index (WQI) in and around Dhaka City Using Groundwater Quality Parameters. Water. 2023; 15(14):2666. https://doi.org/10.3390/w15142666
Chicago/Turabian StyleAhsan, Amimul, Tahmeed Ahmed, M. Alhaz Uddin, Ali O. Al-Sulttani, M. Shafiquzzaman, M. Rashedul Islam, M. Sabbir Ahmed, Alamin, M. Mohadesh, M. Nazmul Haque, and et al. 2023. "Evaluation of Water Quality Index (WQI) in and around Dhaka City Using Groundwater Quality Parameters" Water 15, no. 14: 2666. https://doi.org/10.3390/w15142666


