Article

Study on Facile and Full-Scale Reuse Treatment of Wastewater Produced from Tail Gas Oxidation-Absorption Technology of Natural Gas Purification Plant

1
Safety, Environment and Technology Supervision Research Institute, PetroChina Southwest Oil & Gas Field Company, Chengdu 610041, China
2
National Energy R&D Center of High-Sulfur Gas Exploitation, Chengdu 610041, China
3
PetroChina Southwest Oil & Gas Field Company, Chengdu 610051, China
4
Natural Gas Purification General Plant, PetroChina Southwest Oil & Gas Field Company, Chongqing 401220, China
*
Author to whom correspondence should be addressed.
Water 2023, 15(12), 2259; https://doi.org/10.3390/w15122259
Submission received: 28 April 2023 / Revised: 30 May 2023 / Accepted: 9 June 2023 / Published: 16 June 2023
(This article belongs to the Special Issue Water, Waste and Wastewater: Treatment and Resource Recovery)

Abstract

:
The oxidation-absorption technology of tail gas is perfect for natural gas purification plants to ensure the up-to-standard discharge of sulfur dioxide emissions, but it can produce a large amount of wastewater. In this paper, a facile and full-scale reuse treatment strategy based on the sequential combination of disc tube reverse osmosis and low-temperature and low-pressure evaporation desalination was proposed and studied. The produced light yellow wastewater was acid sulfate-rich organic wastewater, in which sulfate ions (SO42−) existed up to 6479 mg/L, and the chemical oxygen demand (COD), 5-day biochemical oxygen demand (BOD5), total organic carbon (TOC), ammonia nitrogen (ammonia-N), total nitrogen (TN) and suspended solid (SS) were 207, 71.9, 67.6, 1.28, 70.5 and 20.9 mg/L, respectively. After the reuse treatment, there was COD (6 mg/L), BOD5 (1.4 mg/L), TOC (0.9 mg/L), TN (2.07 mg/L), SS (6 mg/L) and SO42− (90 mg/L) in permeated water, and condensate water with COD (11 mg/L), BOD5 (2.3 mg/L), TOC (4.3 mg/L), SS (2 mg/L) and SO42− (1.2 mg/L) was obtained. Thereby, pollution indexes were reduced after the reuse treatment so as to meet the water quality standard (GB/T18920-2022) in China, and the total water recovery rate reached 98.2 vol%. Ultimately, the priority pollutant migration mechanism during the reuse treatment process was determined.

1. Introduction

Due to low carbon emissions and less air pollution, natural gas (NG) has been regarded as a highly efficient and clean fuel; as a result, global NG consumption has grown significantly in the past decade [1,2,3]. In fact, the raw NG consists of short-chain hydrocarbons (e.g., methane, ethane, propane, butane, pentane, etc.) and trace impurities (for example, hydrogen sulfide, carbon dioxide and nitrogen) [4]. Generally speaking, methane is a major component of NG and its content is more than 85%. The other compositions of NG are primarily dependent on NG reservoirs all over the world and NG wells within the same reservoirs [1,2]. Hydrogen sulfide is one of the toxic acid gases [5], which not only causes worse corrosion in NG transport pipes and NG storage tanks but also causes health issues, such as paralysis and coma, and death [6,7]. To eliminate corrosion and health damages, the sales NG specifications require that the hydrogen sulfide concentration of NG should be limited to below 6 ppm in China; thus, it is essential that a hydrogen sulfide removal process is adopted [8,9,10,11]. Afterward, the hydrogen sulfide is converted to sulfur using a sulfur recovery unit in natural gas purification plants [12,13].
Unlike other available capture, removal and conversion technologies, such as deep eutectic solvents, ionic liquids, metal-organic frameworks, carbon-based materials, zeolites, etc., [14,15] the Claus process is one of the most extensively applied sulfur recovery methods in the world, which can convert hydrogen sulfide to sulfur [16,17,18,19,20]. In the sulfur recovery unit, the Claus process contains thermal and catalytic sections. There is a Claus furnace and a waste heat boiler in the thermal section, where one-third of the hydrogen sulfide is converted to water and sulfur dioxide (See Equation (1)). Then, the oxidation-reduction reaction of sulfur dioxide and unreacted hydrogen sulfide takes place with the aid of alumina-based catalysts in the catalytic section (See Equation (2)). Sulfur steam is generated through hydrogen sulfide pyrolysis in the thermal section and via the reaction of sulfur dioxide and unreacted hydrogen sulfide in the catalytic section. However, because the reactions are highly equilibrium-limited for Equations (1) and (2), the sulfur recovery efficiency of the Claus process only reaches 94~97% [12]. Unfortunately, after sulfur steam is condensed and separated, there still exists a large amount of unreacted sulfur dioxide and hydrogen sulfide at levels beyond the approved emission limits in the tail gas of the Claus process. Indeed, sulfur dioxide as a pollutant is not a component of the atmosphere, which results in serious environmental problems, including haze and acid rain [21,22]. Besides, sulfur dioxide pollution could cause respiratory diseases [22,23,24]. Moreover, it can increase the incidence of lung cancer [22]. In 2017, the International Agency for Research on Cancer of the World Health Organization confirmed that sulfur dioxide is a carcinogen. This has attracted the attention of global governments. In China, it is worth noting that the national government has promulgated many laws and policies, such as the Emission Standard of Air Pollutants for Onshore Oil and Gas Exploitation and Production Industry (GB 39728-2020) in order to decrease the sulfur dioxide emissions of natural gas purification plants.
H 2 S + 3 2 O 2 SO 2 + H 2 O
2 H 2 S + SO 2 3 n S n + 2 H 2 O
Reactions in the Claus process of sulfur recovery units.
In recent years, natural gas purification plants have been driven to lower sulfur dioxide emissions of the tail gas in China. It is well known that sulfur dioxide and hydrogen sulfide exceeding permissible emission limits, as well as hydrogen at low levels, can appear in the tail gas of the Claus process. Meanwhile, the tail gas is free of oxygen. Generally, therefore, a reduction–absorption technology can decrease the sulfur dioxide emission (See Figure 1a), in which all sulfur in the tail gas is converted to hydrogen sulfide. In short, a hydrotreatment in the gas stream is utilized to convert sulfur dioxide to hydrogen sulfide, and then the as-prepared hydrogen sulfide is scrubbed with an amine scrubber. The concentrated hydrogen sulfide by-product forms with the treatment of amine regeneration, and it is returned to the Claus process to produce elemental sulfur [12]. However, there are disadvantages such as high energy penalties, cumbersome processes and complex operations for the reduction–absorption technology. Fortunately, the oxidation-absorption technology of tail gas as an efficient solution has been broadly used in non-ferrous industries to meet sulfur dioxide emission targets (See Figure 1b). In essence, this technology is the basis for amine-based absorbents, which can achieve highly efficient selective absorption of sulfur dioxide [25]. The pure sulfur dioxide by-product can be recovered through steam stripping with low-quality heat. More importantly, because amine-based absorbents are regenerable, their capital costs are cost-effective. In addition, all the operations of this technology are quite simple and easy. Nevertheless, a major flaw is that a large amount of wastewater is produced during this process. On the other hand, as far as we know, few reports have focused on the oxidation-absorption technology used in natural gas purification plants and the wastewater that is produced.
Herein, the oxidation-absorption technology and its produced wastewater from a natural gas purification plant are described, and a facile and full-scale reuse treatment strategy for the produced wastewater is proposed. Water quality was studied before and after the reuse treatment of wastewater produced by the oxidation-absorption technology. The salt byproduct was analyzed using Fourier transform infrared spectroscopy (FT-IR), scanning electron microscopy (SEM) and energy dispersive spectroscopy (EDS). Finally, the priority pollutant migration mechanism during the produced wastewater reuse treatment process was determined.

2. Materials and Methods

2.1. Materials

Wastewater samples were obtained from a natural gas purification plant in Chongqing, China, and they were collected and stored in 5 L polyethylene barrels. Sodium sulfate (AR) was obtained from Kelong Chemical Reagent Factory (Chengdu, China). Sodium hydroxide solutions (30 wt%) were supplied by Chaoyi Chemical Co., Ltd. (Chongqing, China). Amine-based sulfur dioxide absorbents were purchased from Shell (China) Limited (Beijing, China). Demineralized water was homemade via a demineralizer consisting of an ion-exchange resin pretreatment and a double-stage reverse osmosis in the natural gas purification plant. The quality of this demineralized water was given as follows: its pH was 7.7, conductivity was 44.18 µS/cm and total hardness was 0.02 mmol/L. Chemical oxygen demand (COD), 5-day biochemical oxygen demand (BOD5) and ammonia nitrogen contents (ammonia-N) were not detected. Total nitrogen (TN) and total organic carbon (TOC) were 0.13 and 1.00 mg/L, respectively. In addition, steam (160 °C, 0.40 MPa) was manufactured using the gas-fired boiler of a natural gas purification plant.

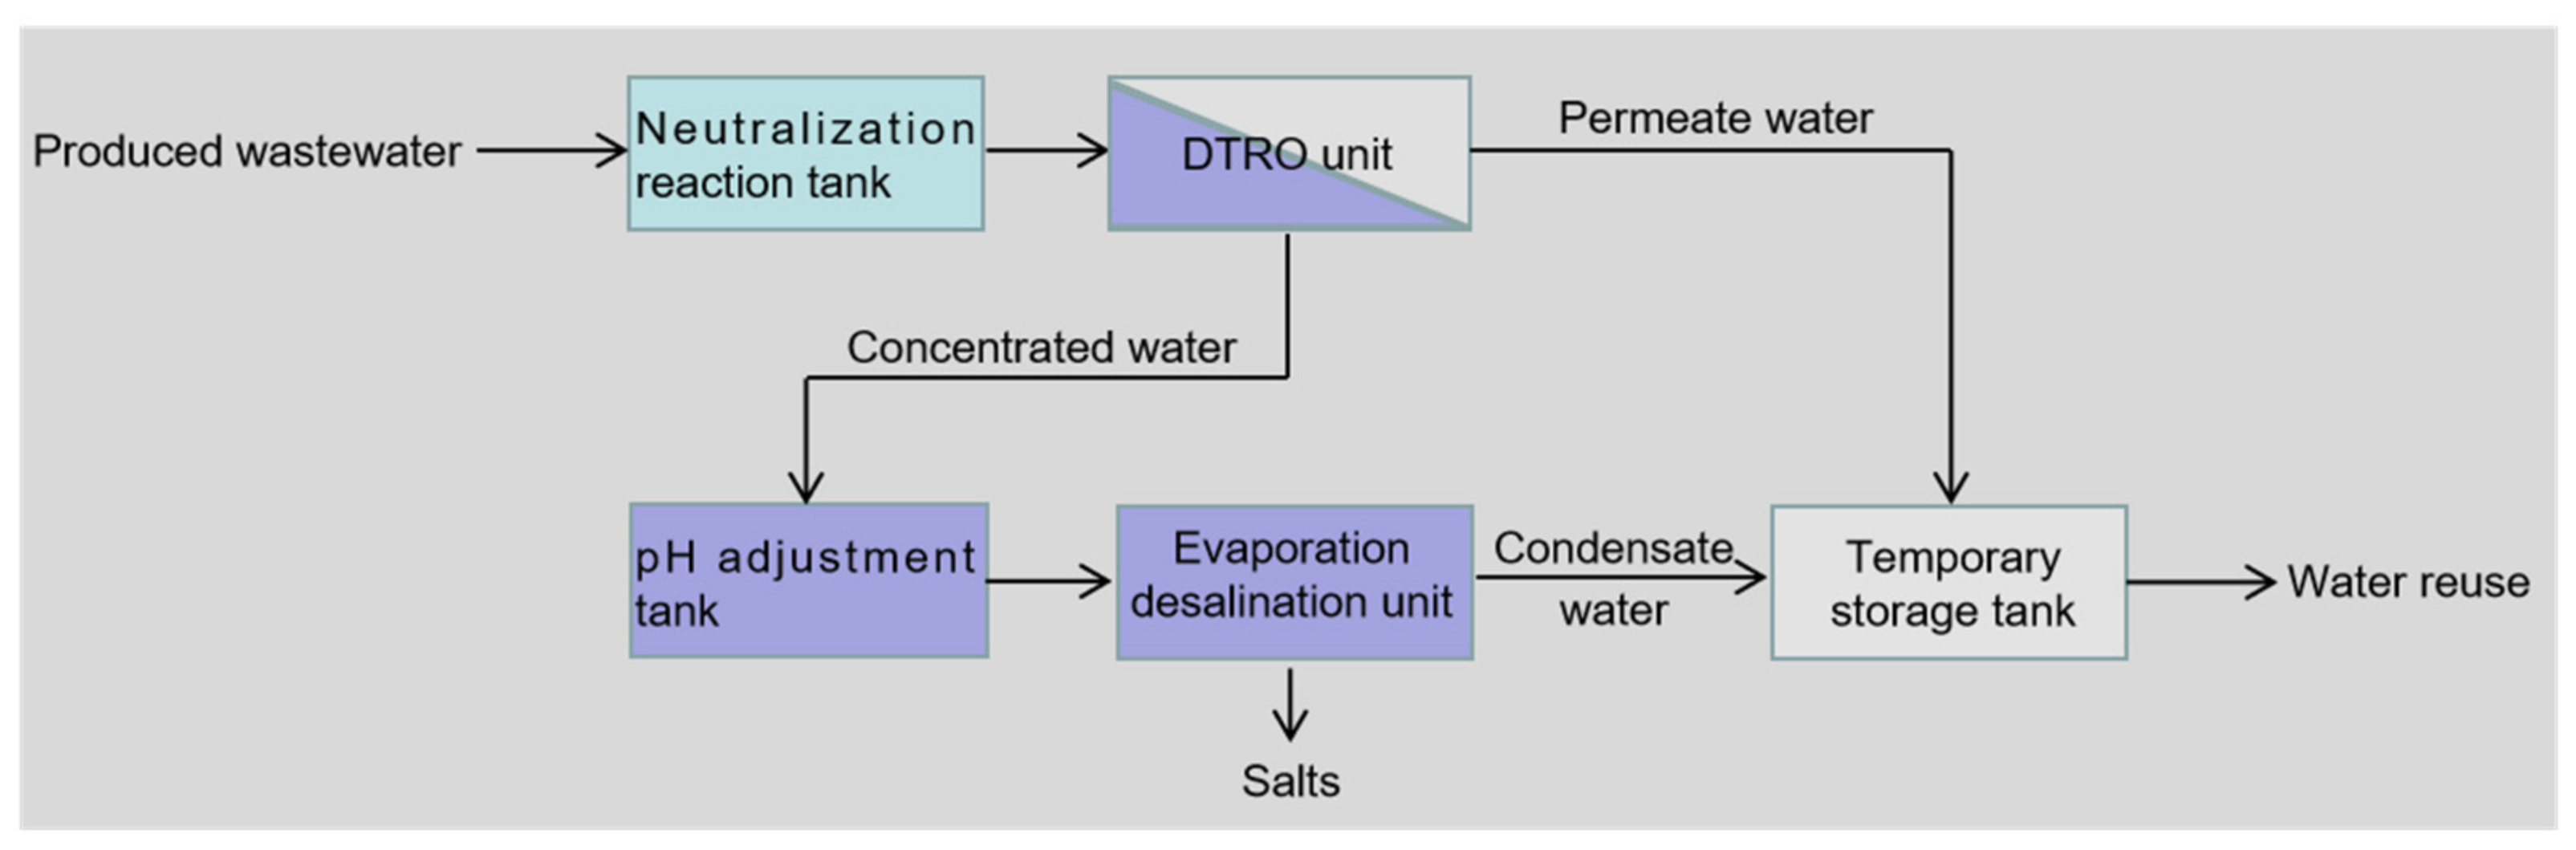
2.2. Facile and Full-Scale Treatment System for Reusing the Produced Wastewater

Figure 2 illustrates a facile and full-scale treatment system for reusing the produced wastewater from the oxidation-absorption technology in a natural gas purification plant in Chongqing, China. As shown in Figure 2, the wastewater reuse treatment system mainly includes neutralization reaction, disc tube reverse osmosis (DTRO) [26,27,28,29], pH adjustment and evaporation desalination at low temperatures and pressures [30,31]. The produced wastewater was pumped into a neutralization reaction tank. Under stirring (200 rpm), sodium hydroxide solutions (30 wt%) were added to the neutralization reaction tank at 30 °C, until the pH value of the produced wastewater was increased to 6.6. Afterward, to concentrate the pretreated wastewater, a DTRO unit with a processing capacity of 1.3 m3/h was employed, which was manufactured by Chengdu Sotec Environmental Technology Co., Ltd. (Chengdu, China). In the DTRO unit, a quartz sand filter tower and an active carbon filter tower were arranged in front of the DTRO module, where the flow rate of the feed water was maintained at 1.0 m3/h. In addition, plate-and-frame type membranes were applied to the DTRO module and their effective membrane area was 9.405 m2. The operating pressure was controlled at 3.5 MPa, and the feed water temperature remained at 30 ± 1 °C using a plate heat exchanger. After DTRO treatment, the permeated and concentrated water was collected in a temporary storage tank and a pH adjustment tank, respectively. Sodium hydroxide solutions (30 wt%) were added to the pH adjustment tank with stirring at 200 rpm until the pH value of the concentrated water was increased to 7.5. After the pH adjustment, the concentrated water was further pumped into an LT-VR 1T evaporation desalination unit supplied by Kunshan WSD Environmental Protection Equipment Co., Ltd. (Kunshan, China). In the LT-VR 1T evaporation desalination unit, the processing capacity of the concentrated water was 1.0 m3/h, the operating vacuum was maintained at −95 KPa using a jet device, the operating temperature was controlled at 37 °C using the steam of a gas-fired boiler (160 °C, 0.40 MPa) and the circulating cooling water inlet temperature was below 20 °C.

2.3. Analytical Methods

Water quality measurements were carried out as follows: The pH of the samples was measured with a SevenGo Duo Pro pH meter (Mettler Toledo, Zurich, Switzerland) at 25 °C. The conductivity of samples was quantified using a DDS-307 conductometer (INESA & Scientific Instruments Co., Ltd., Shanghai, China) at 25 °C. Measurements of COD, BOD5, TOC, and suspended solid (SS) were carried out on the basis of the APHA Standard Methods [32,33,34]. In addition, a UV7504 UV–Vis spectrophotometer (Shanghai jingmi instrument Co., Ltd., Shanghai, China) was employed to measure ammonia-N and TN. Wastewater samples were filtered with a 0.22 µm filter, after which an ECO ion chromatography with an 863 Compact IC Autosampler (Metrohm AG, Herisau, Switzerland) was applied to detect the inorganic ions, such as sulfate ion (SO42−), sulfite ion (SO32−), chloride ion (Cl), fluorion (F) and nitrate ion (NO3). Metal elements, such as sodium (Na), potassium (K), magnesium (Mg) and calcium (Ca), were detected using a PinAAcle 900 atomic absorption spectrophotometer (PerkinElmer, Waltham, MA, USA), and then trace analysis of other metal elements, such as aluminium (Al), barium (Ba), iron (Fe), manganese (Mn), copper (Cu), etc., was performed using an Optima 8300 Inductively Coupled Plasma Optical Emission Spectroscopy (PerkinElmer, Waltham, MA, USA).

2.4. Characterizations

A Nicolet 170SX infrared spectrometer (Madison, WI, USA) was employed to record the Fourier transform infrared (FT-IR) spectra. According to a previous study [32], the FT-IR spectra were recorded in an optical range of 400~4000 cm−1 by averaging 16 scans with a resolution of 4 cm−1. In addition, studies of scanning electron microscopy (SEM) and energy dispersive spectroscopy (EDS) were conducted using a ZEISS Gmini 300 field emission scanning electron microscope (Carl Zeiss Jena, Jena, Germany). In order to obtain high-resolution images of SEM and EDS, an accelerating voltage of 10 kV was used.

3. Results and Discussion

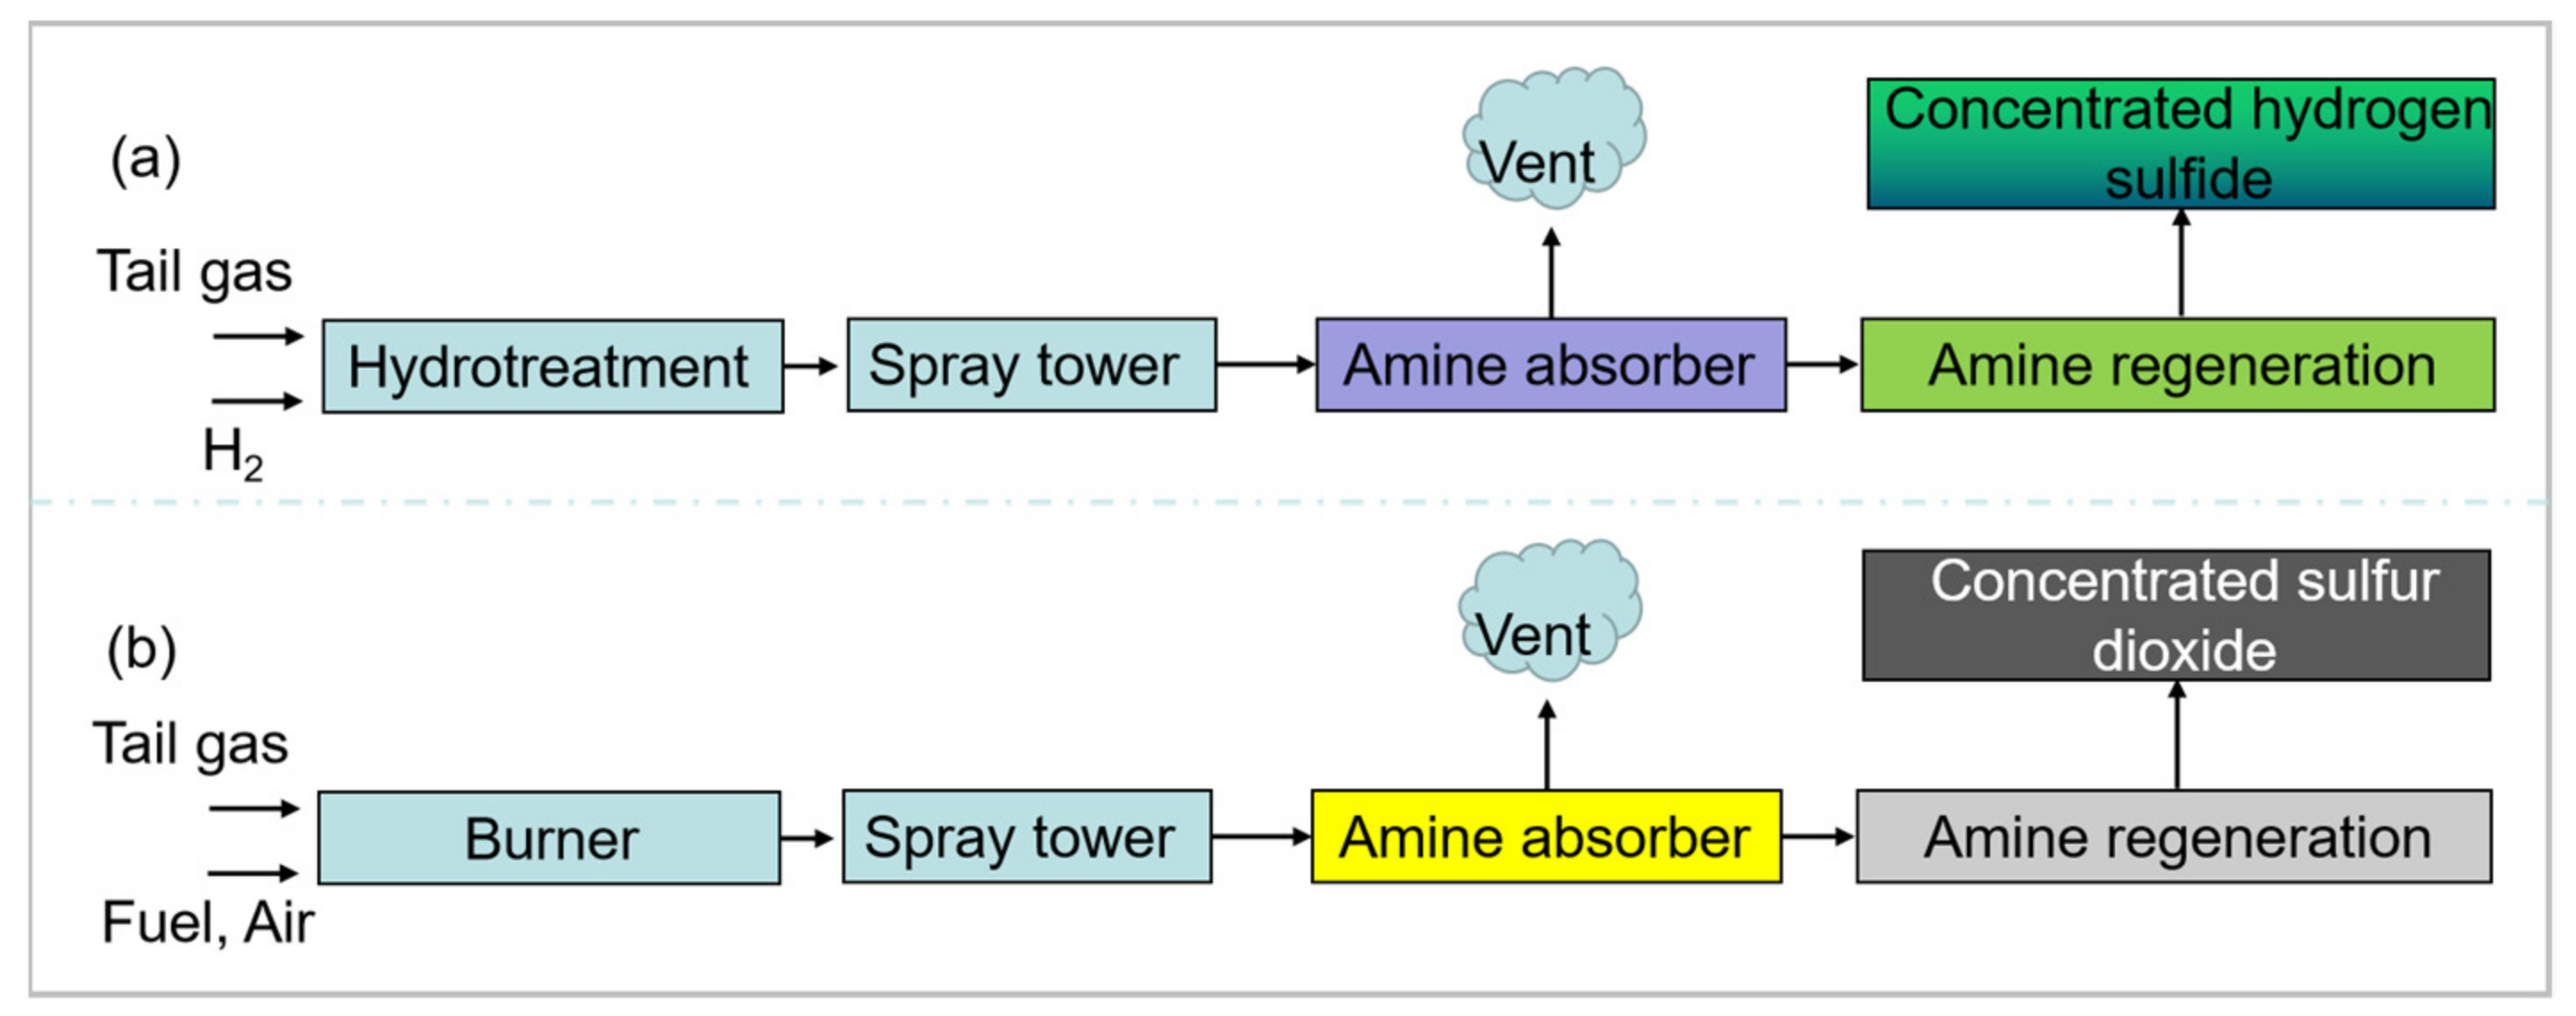
3.1. Oxidation-Absorption Technology of Tail Gas from Natural Gas Purification Plant

An oxidation-absorption technology of tail gases was developed and designed to reduce the sulfur dioxide emission of natural gas purification plants, as shown in Figure 3. The tail gases of the sulfur recovery unit containing hydrogen sulfide, sulfur steam, carbonyl sulfide (COS) and carbon disulfide (CS2) were oxidized in order to convert all sulfur compounds to sulfur dioxide in a burner (See Equations (3)–(6)) [35]. In general, to guarantee that all sulfur compounds were converted to sulfur dioxide, the air distribution of the burner was slightly excessive; thus, there was sulfur dioxide, water vapour and sulfur trioxide in the flue gases of the burner. The high-temperature flue gases (220 °C) were cooled with demineralized water in a Venturi scrubber, and the temperature of the flue gases decreased to 50~55 °C. Unfortunately, a large amount of acid wastewater was produced in the Venturi scrubber due to the existence of sulfur dioxide, water vapour and sulfur trioxide.
H 2 S + 3 2 O 2 SO 2 + H 2 O
S n + nO 2 nSO 2
COS + 3 2 O 2 SO 2 + CO 2
CS 2 + 3 O 2 2 SO 2 + CO 2
Main reactions in the burner of the oxidation-absorption technology.
The low-temperature flue gases (50~55 °C) entered a wet electrostatic precipitator to remove acid mist, and then sulfur dioxide of the flue gases was absorbed by using amine-based sulfur dioxide absorbents, i.e., lean amine solution (See Figure 4) in a sulfur dioxide absorber tower (See Equation (7)). The off-gases of the sulfur dioxide absorber tower, including sulfur dioxide below 100 mg/Nm3, were further heated in a burning stove and discharged with a flue-gas stack. On the other hand, the lean amine solution became a rich amine solution in the sulfur dioxide absorber tower (See Equation (7)). To renew the absorbed sulfur dioxide, the rich amine solution was pumped into a sulfur dioxide stripper tower and heated by using steam at 122 °C (See Equation (8)) [25]. The high-temperature acid gases consisting of sulfur dioxide and water vapour were treated using an air-cooled heat exchanger to produce pure sulfur dioxide. Meanwhile, hung acid water formed in an acid gas knockout pot, as shown in Figure 3. However, moisture was introduced in the lean amine solution; thus, some of the acid water was discharged to the Venturi scrubber for maintaining an appropriate concentration of the lean amine solution.
H + R 1 N = NR 2 + SO 2 + H 2 O H + R 1 N = NR 2 H + + HSO 3 2
H + R 1 N = NR 2 H + + HSO 3 2 Δ H + R 1 N = NR 2 + SO 2 + H 2 O
Main reactions in the sulfur dioxide absorber and stripper towers (R1 and R2 represent alkyl groups).
In addition, there was still a small amount of sulfur trioxide that escaped from the Venturi scrubber. Once the sulfur trioxide entered the sulfur dioxide absorber tower, a side reaction occurred (See Equation (9)). As shown in Equation (9), sulfate was one of the heat-stable salts that can form in the regenerative lean amine solution (See Figure 3), which led to the performance degradation of sulfur dioxide adsorption. So, an amine purification apparatus supplied by Wuhan Yida Water Treatment Engineering Co., Ltd. (Wuhan, China) was applied to remove the sulfate for restoring the properties of the regenerative lean amine solution (See Figure 5). When the sulfate adsorption saturation was attained on the Purolite® A111 polystyrenic macroporous weak base anion resins (Purolite China Co., Ltd., Hangzhou, China), a washing operation was performed on the amine purification apparatus. In order to renew the Purolite® A111 anion resins, demineralized water and sodium hydroxide solutions (30 wt%) were utilized in this operation, but a large amount of high-salinity organic wastewater was generated. In summary, the above acid wastewater and high-salinity organic wastewater came together in the produced wastewater via the oxidation-absorption technology.
+ HR 1 N = NR 2 + SO 3 + H 2 O + HR 1 N = NR 2 H + + SO 4 2 + H +
Side reaction in the sulfur dioxide absorber tower (R1 and R2 represent alkyl groups).

3.2. Wastewater Produced by the Oxidation-Absorption Technology

All of the wastewater produced by the oxidation-absorption technology (hereafter called raw wastewater) was collected and discharged into the neutralization reaction tank. As shown in Figure 6a, the colour of the raw wastewater was light yellow, and its pH was 3.8. Simultaneously, the water quality of the raw wastewater was investigated. Figure 6b shows pollution characteristics of the raw wastewater, including COD (207 mg/L), BOD5 (71.9 mg/L), TOC (67.6 mg/L), ammonia-N (1.28 mg/L), TN (70.5 mg/L) and SS (20.9 mg/L). It is observed from Figure 6c that SO42− (6479 mg/L), NO3 (2.18 mg/L), Cl (11.6 mg/L), F (0.08 mg/L) and SO32− (459 mg/L) were present in the raw wastewater. Figure 6c shows that the raw wastewater was rich in SO42−. This is because the side reaction resulted in the formation of sulfur trioxide (See Figure 3). Sulfur trioxide was captured using the Venturi scrubber and wet electrostatic precipitator. Dilute sulfuric acid formed in the Venturi scrubber (SO3 + H2O = H2SO4; H2SO4 = 2H+ + SO42−). Meanwhile, to remove the heat-stable salts of lean amine solutions (See Equation (9)), the SO42− was captured with the amine purification apparatus (See Figure 5) and discharged in the raw wastewater. The sulfur dioxide was dissolved in the demineralized water (SO2 + H2O = H2SO3; H2SO3 ⇋ 2H+ + SO32−) so that the SO32− could be detected. Furthermore, it is shown in Figure 6d that Ca (0.045 mg/L), Mg (0.061 mg/L), Ba (0.013 mg/L), Sr (0.022 mg/L), Na (28.6 mg/L), K (30.1 mg/L), Fe (0.59 mg/L), Cu (0.024 mg/L) and Mn (0.009 mg/L) were present in the raw wastewater. Therefore, it was concluded that the raw wastewater from the tail gas oxidation-absorption technology was acid sulfate-rich organic wastewater.

3.3. Facile and Full-Scale Reuse Treatment of the Produced Wastewater

3.3.1. Performance of DTRO Treatment

As illustrated in Figure 2, the DTRO treatment system was employed in this study (See Figure 7a). The produced wastewater was neutralized using 30 wt% sodium hydroxide solution with stirring at 200 rpm at 30 °C, and its pH was adjusted to 6.6 (Figure 7b). Then, the neutralized wastewater as feed water was pumped into the DTRO treatment unit, and feed water temperature and operating pressure remained at 3.5 Mpa and 30 °C, respectively. To determine the performances of DTRO treatment, the pollution characteristics of the neutralized wastewater, concentrated wastewater and permeated water (See Figure 7c) were investigated. Furthermore, as shown in Figure 7b,d, the COD, BOD5, TOC, TN, ammonia-N, SS and conductivity of the neutralized wastewater were 206 mg/L, 71.1 mg/L, 67 mg/L, 1.24 mg/L, 70 mg/L, 20 mg/L and 5066 µS/cm, respectively. By contrast, it can be seen that the index concentration of concentrated wastewater, such as COD (970 mg/L), BOD5 (393 mg/L), TOC (216 mg/L), TN (150 mg/L), ammonia-N (7.94 mg/L), SS (134 mg/L) and conductivity (10,190 µS/cm), increased significantly, which is attributed to the efficient interception of DTRO treatment for pollutants. More importantly, the COD (6 mg/L), BOD5 (1.4 mg/L), TOC (0.9 mg/L), TN (2.07 mg/L), SS (6 mg/L) and conductivity (142 µS/cm) of the permeated water were much lower than that of the neutralized wastewater and concentrated wastewater, and ammonia-N of the permeated water was not detected because its concentration was low enough. Hence, all evidence revealed that, with the help of DTRO treatment, the pollutants of the permeated water corresponding to COD, BOD5, TOC, TN, ammonia-N and SS were extremely low.
Inorganic species, such as anions and metal elements, in the neutralized wastewater, concentrated wastewater and permeated water were monitored. Figure 8 shows the index concentrations of the anions and metal elements before and after the DTRO treatment. As shown in Figure 8a, SO42− (6470 mg/L), NO3 (2.17 mg/L), Cl (11.4 mg/L), F (0.07 mg/L) and SO32− (416 mg/L) were present in the neutralized wastewater; SO42− (14400 mg/L), NO3 (18.1 mg/L), Cl (42.5 mg/L), F (0.16 mg/L) and SO32− (473 mg/L) were found in the concentrated wastewater; and SO42− (90 mg/L), NO3 (1.47 mg/L) and Cl (0.66 mg/L) were detected in the permeated water. In addition, F in the permeated water was not detected because its concentration was much lower than the detection limits of the 863 Compact IC Autosampler (Metrohm AG, Herisau, Switzerland). SO32− was not tested in the permeated water, and the SO32− concentration of the concentrated wastewater was close to that of the neutralized wastewater because SO32− can be oxidized by exposure to air. On the other hand, it can be observed from Figure 8b that Ca (0.04 mg/L), Mg (0.058 mg/L), Ba (0.012 mg/L), Sr (0.02 mg/L), Na (3060 mg/L), K (29.8 mg/L), Fe (0.58 mg/L), Cu (0.022 mg/L) and Mn (0.008 mg/L) were present in the neutralized wastewater; Ca (2.54 mg/L), Mg (0.53 mg/L), Ba (0.025 mg/L), Sr (0.075 mg/L), Na (9330 mg/L), K (94 mg/L), Fe (20.8 mg/L), Cu (0.11 mg/L) and Mn (0.477 mg/L) were found in the concentrated wastewater; and Ca (0.004 mg/L), Mg (0.005 mg/L), Na (48.1 mg/L), K (0.39 mg/L) were detected in the permeated water. Obviously, the Na concentration was much higher than the other metal element concentrations, resulting from the 30 wt% NaOH solution that was added to the produced wastewater to adjust the pH. On the basis of the above results, it is concluded that the inorganic species have been captured effectively using the DTRO treatment to obtain permeated water.

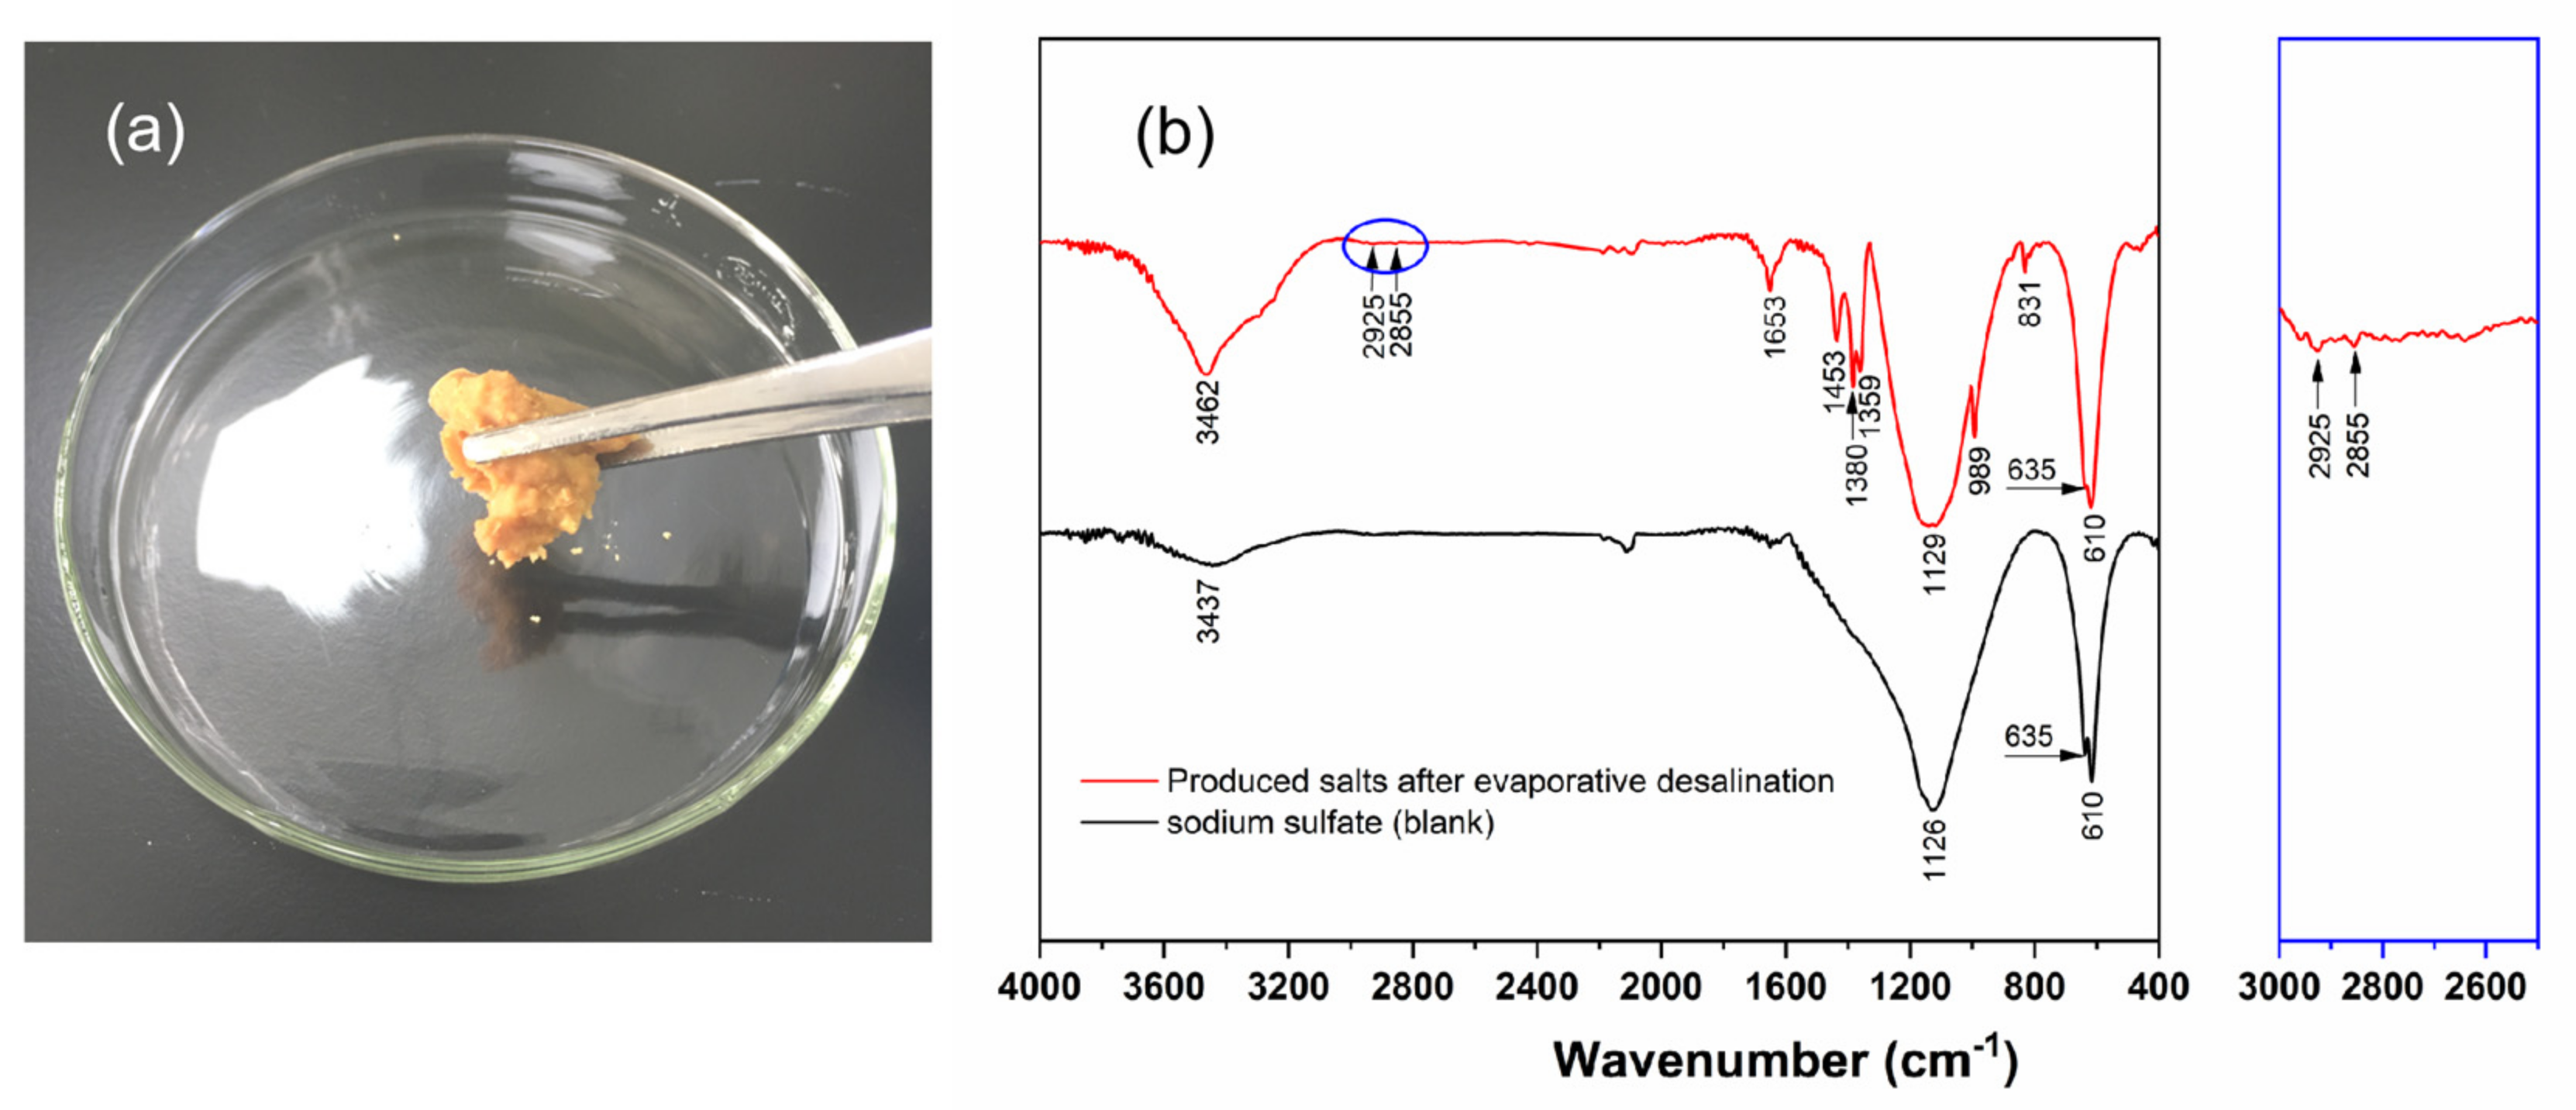
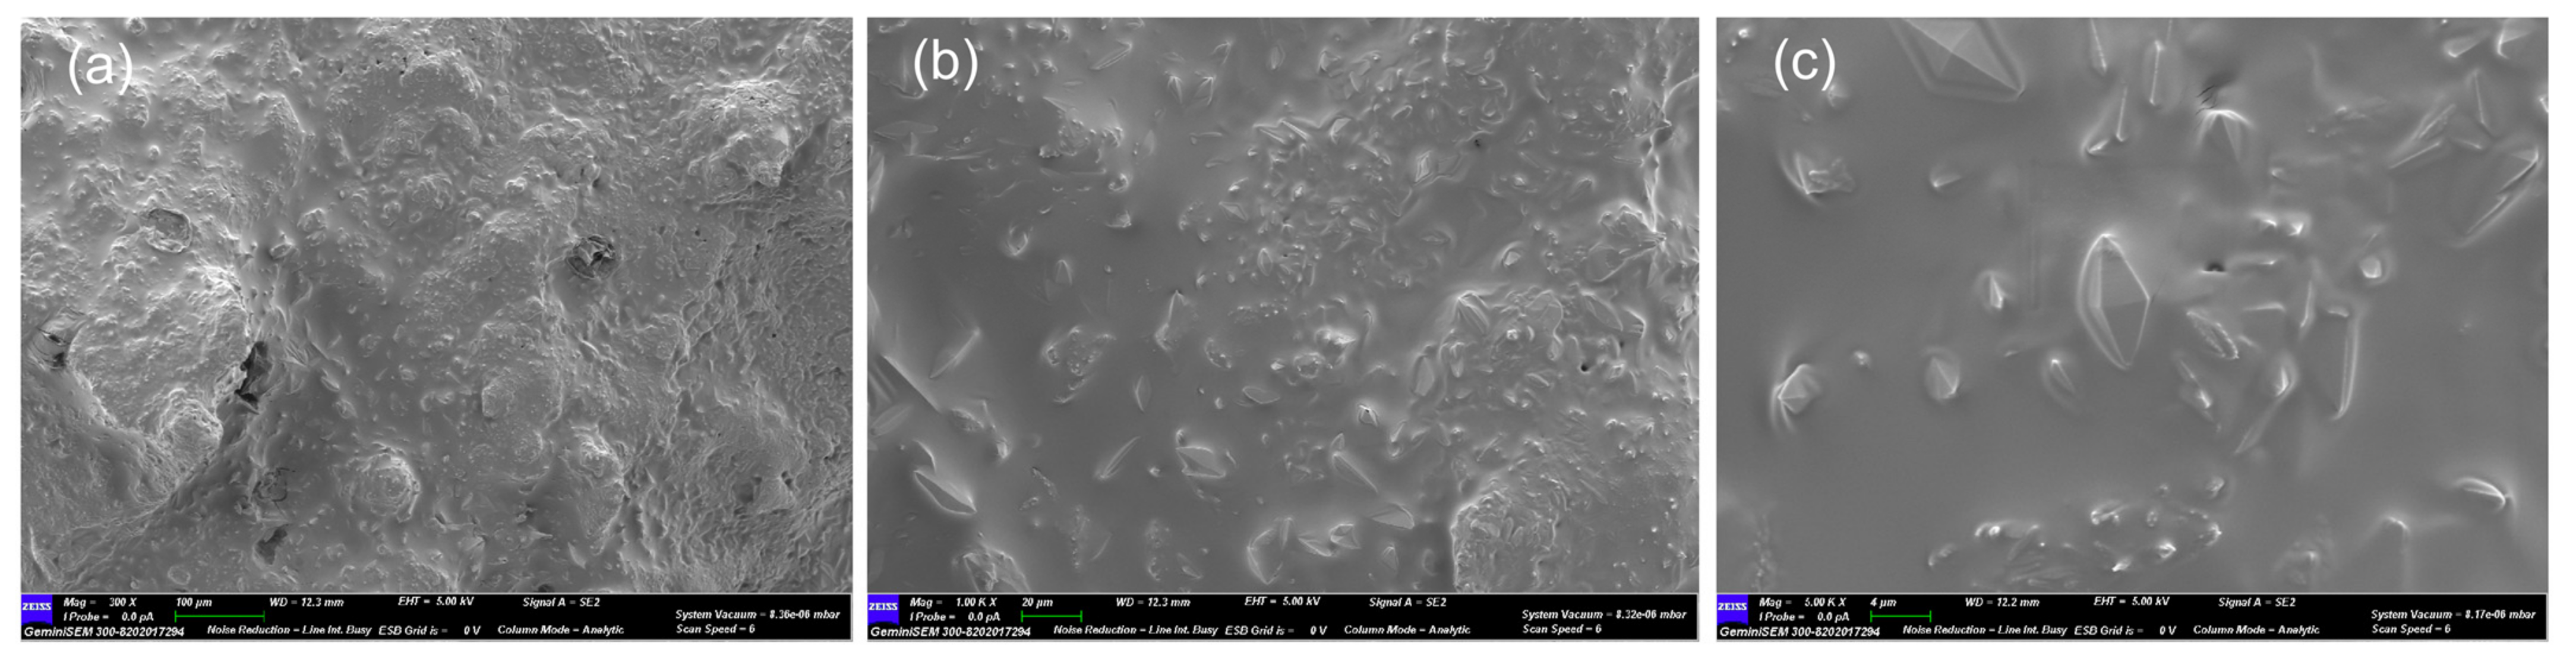
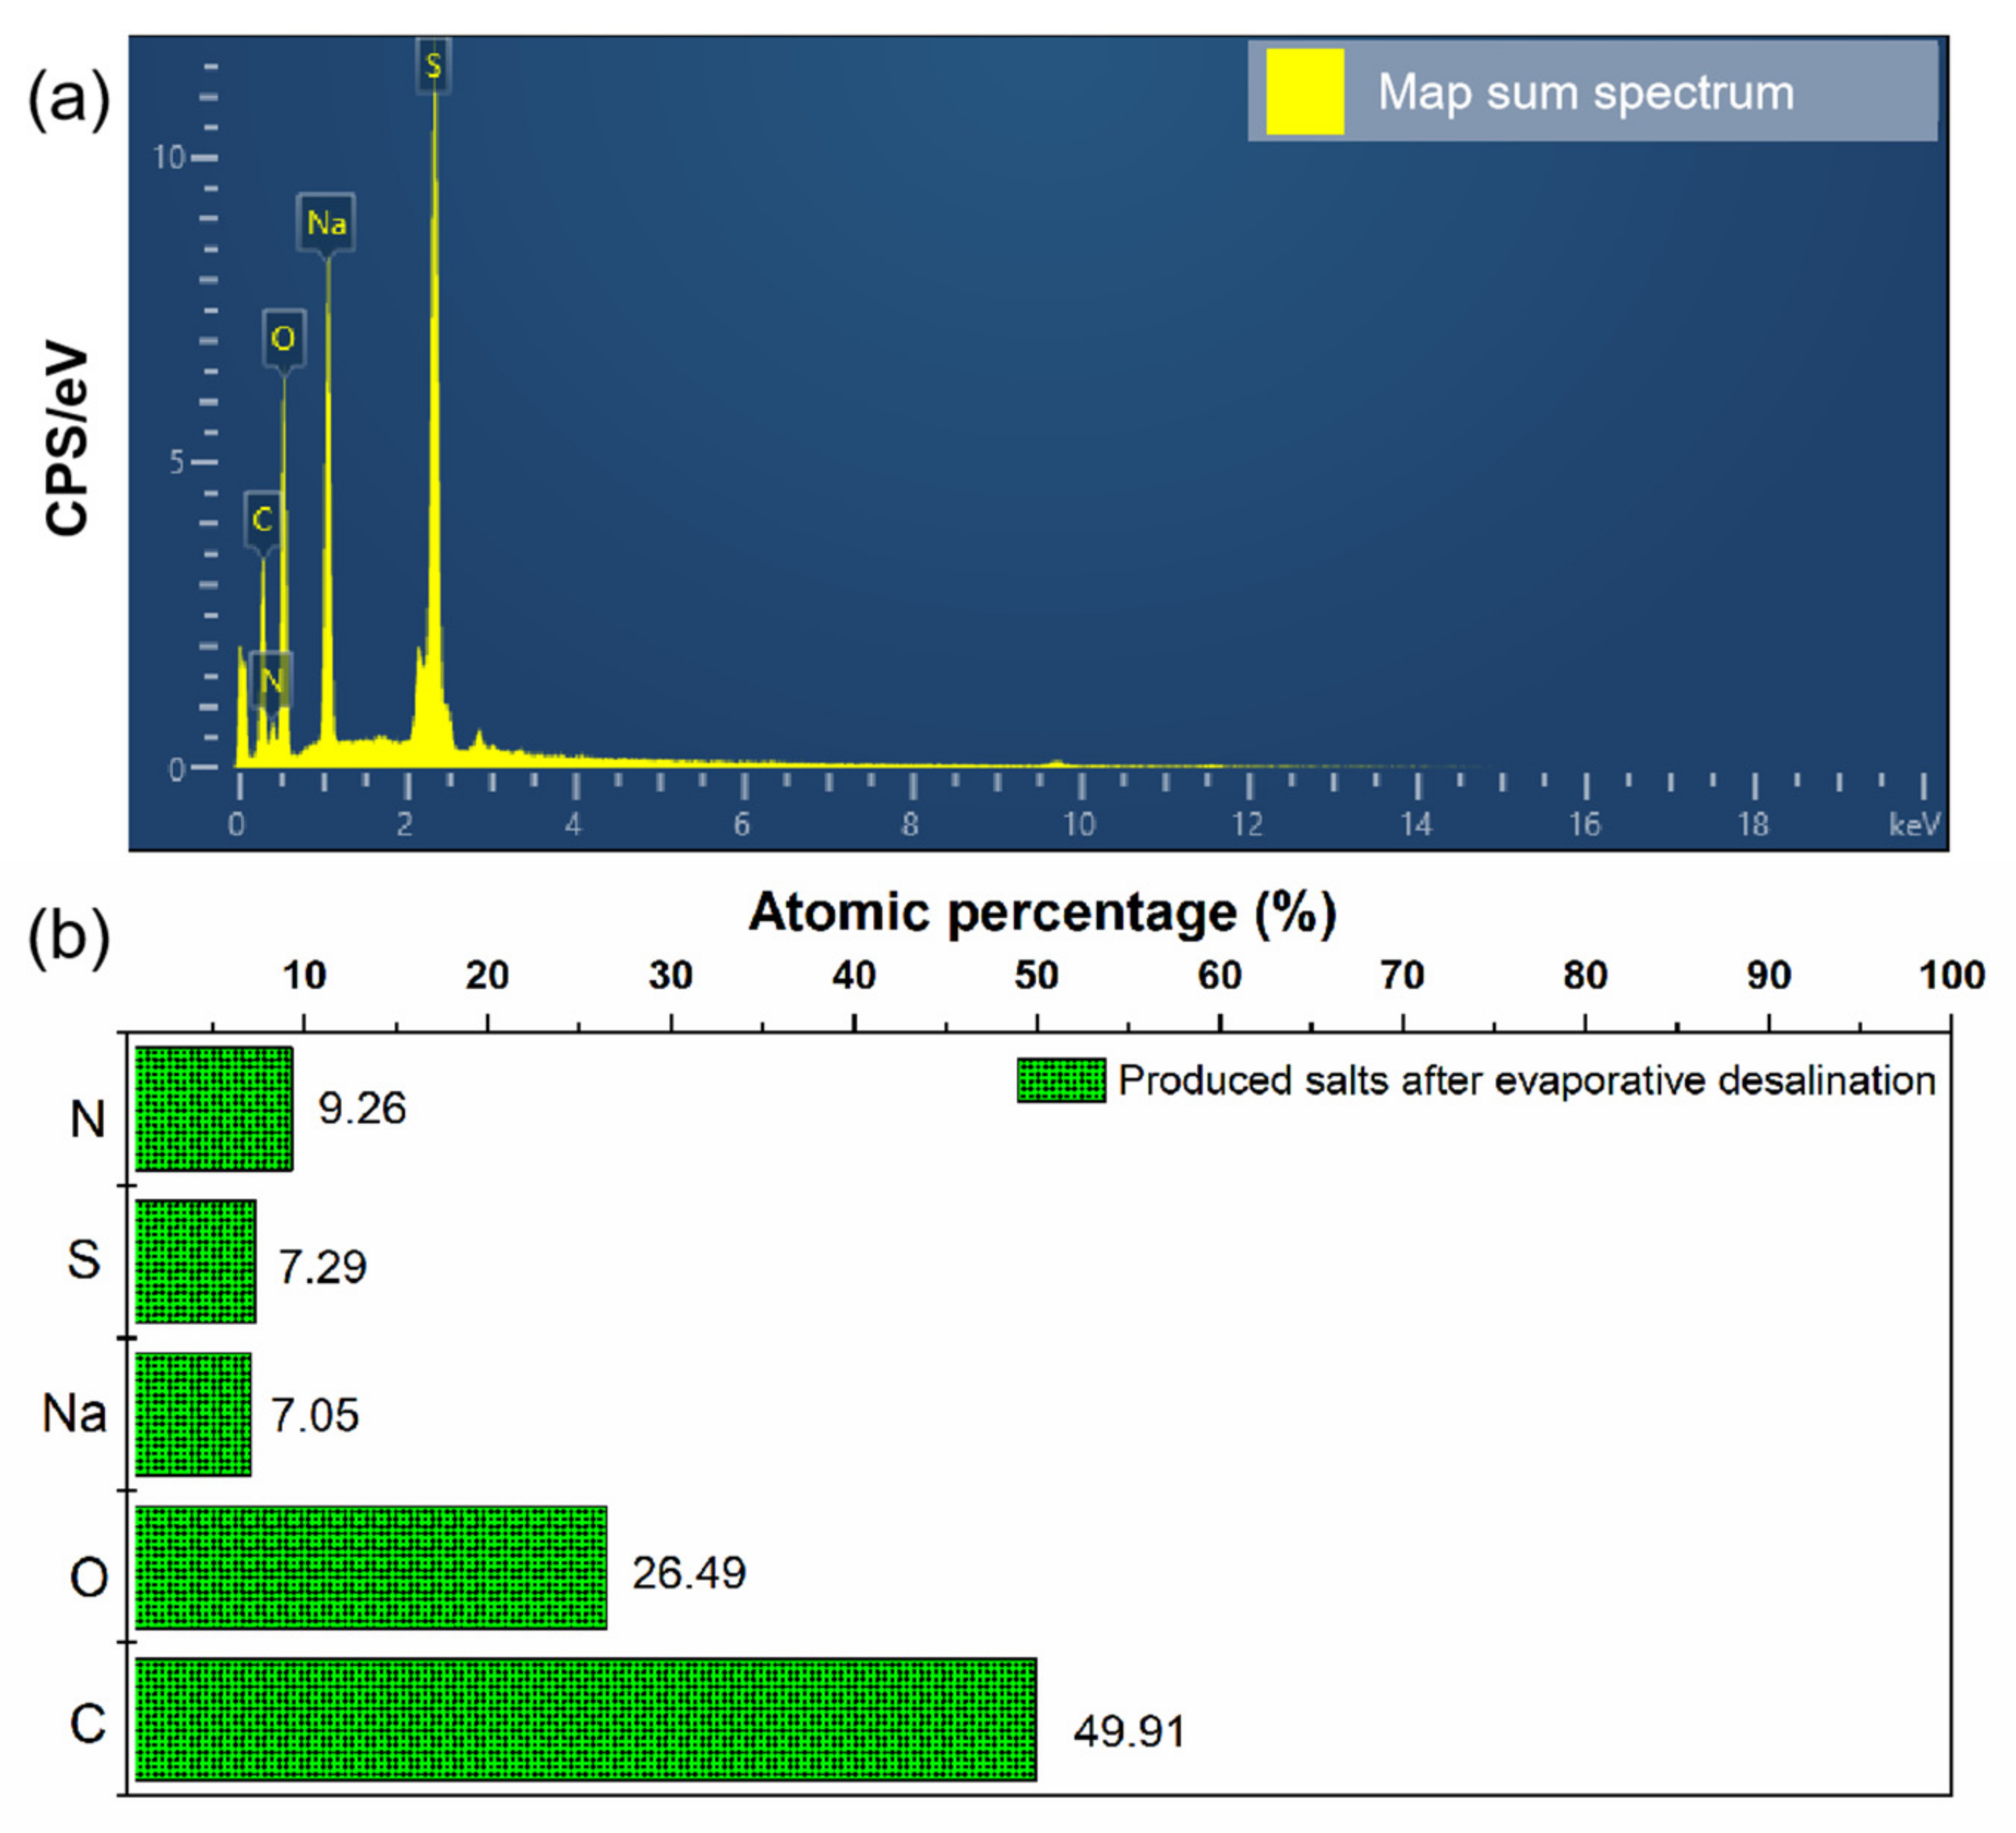
3.3.2. Performance of Evaporation Desalination

To treat the concentrated wastewater, an evaporation desalination treatment was conducted on an LT-VR 1T evaporation desalination apparatus (See Figure 9a) at −95 KPa and 37 °C. After the evaporation desalination treatment, condensate water was collected (See Figure 9b). The condensate water was colourless, and its pH was 7.2. The pollution characteristics of the condensate water were determined, as shown in Figure 9c. Figure 9c shows that the COD, BOD5, TOC and SS of the condensate water were 11 mg/L, 2.3 mg/L, 4.3 mg/L and 2 mg/L, respectively. Meanwhile, ammonia-N and TN could not be detected because their concentrations were below the detection limits corresponding to ammonia-N and TN. These results indicate that the pollution indexes of the condensate water, such as COD, BOD5, TOC, TN, ammonia-N and SS, were much lower than those of the concentrated wastewater. Moreover, the anions and metal elements in the condensate water were explored, as shown in Figure 9d. Figure 9d shows that SO42− (1.2 mg/L) and Na (0.47 mg/L) could merely be detected, revealing that the inorganic species of the condensate water were effectively removed. This is in agreement with the change in the conductivity (0.84 µS/cm). Therefore, all the results confirm that the water quality of the condensate water became better than that of the concentrated wastewater.

3.3.3. Water Reuse Analysis

The produced wastewater from tail gas oxidation-absorption technology containing pollution indexes, such as COD, BOD5, ammonia-N, TN and inorganic species, was acid sulfate-rich organic wastewater. The statistics of the full-scale reuse treatment showed that the recovery rate of the permeated water was 80 vol%, and the recovery rate of the condensate water was 18.2 vol%. There was a 98.2 vol% total water recovery rate, and water losses were 1.8 vol% in this process. Generally, the reuse of recycled water should meet the water quality standard for miscellaneous use (GB/T18920-2022) in China. The key pollution indexes, i.e., BOD5 (≤10 mg/L), ammonia-N (≤8 mg/L), Cl (≤350 mg/L) and SO42− (≤500 mg/L), are required in the GB/T18920-2022. After the DTRO treatment, ammonia-N was not detected in the permeated water, and BOD5, Cl and SO42− of permeated water decreased to 1.4 mg/L, 0.66 mg/L and 90 mg/L, respectively (See Figure 7 and Figure 8). The condensate water with less BOD5 (2.3 mg/L) and SO42− (1.2 mg/L) was obtained after the evaporation desalination treatment of the concentrated wastewater, in which ammonia-N and Cl were not detected. In comparison with the requirements of GB/T18920-2022, therefore, the water quality of the permeated water and condensate water was much better, meaning that the full-scale reuse treatment was suitable for the produced wastewater.

3.4. Pollutant Migration Mechanism during Reuse Treatment Process

Salts that were produced by the evaporation desalination treatment were collected (See Videos S1 and S2). Figure 10a shows the morphology of the produced salts. The produced salts were brown solids and looked like pastes. In order to reveal the pollutant migration mechanism during the reuse treatment process, it is necessary to characterize the produced salts at the micro-scale. Consequently, the produced salts from evaporative desalination were investigated using FT-IR, as shown in Figure 10b. Figure 10b presents the FT-IR spectra of the produced salts and sodium sulfate (blank). In the FT-IR spectrum of sodium sulfate, the asymmetrical stretching vibrations of SO42− at 1126 cm−1 and the symmetrical stretching vibrations of SO42− at 635 cm−1 and 610 cm−1 can be observed. In addition, the O–H stretching vibrations of water at 3437 cm−1 were observed clearly, which is because the sodium sulfate could absorb moisture from the atmosphere in the course of the FT-IR measurement. Similarly, the asymmetrical stretching vibrations (1129 cm−1) and the symmetrical stretching vibrations of SO42− (635 cm−1 and 610 cm−1), and the O–H stretching vibrations of water (3437 cm−1) were expected to exist in the FT-IR spectrum of the produced salts. It is worth noting, however, that the –CH stretching vibrations of alkanes (2925 cm−1 and 2885 cm−1), the stretching vibrations of N=N (1650 cm−1), the in-plane bending vibrations of –C(CH3)2 or –C(CH3)3 (1453 cm−1, 1380 cm−1 and 1359 cm−1) and the –CH out-of-plane bending vibrations (831 cm−1) existed. These absorption bands should belong to the amine-based absorbents, so it is demonstrated that the produced salts were mixtures including the sodium sulfate and amine-based absorbents.
The micromorphology of the produced salts was studied using SEM, as shown in Figure 11. Figure 11a shows that the agglomerations of the produced salts were compact, and salt crystals could not be observed at low magnification (×300). With the magnification increasing (Figure 12b,c), it was found that a segment of salt crystals appeared within the view of SEM observations. Therefore, the SEM results revealed that sodium sulfate was crystallized in the produced salts, and the surface of the sodium sulfate crystals was covered by amine-based absorbents.
To determine the elemental compositions of the produced salts, EDS measurements were performed, as shown in Figure 12. Figure 12 shows the EDS profile and elemental mappings corresponding to the surfaces of the produced salts. Certainly, it was confirmed that the elemental compositions of the produced salts consisted of carbon (C), nitrogen (N), sulfur (S), oxygen (O) and sodium (Na). Thus, the existence of C and N compositions in the EDS elemental mappings supports the SEM analyses.
To evaluate the influence of organic compositions on the crystallized salts, the atomic percentages of the produced salts involved in C, N, S, O and Na were quantified. Figure 13a shows the EDS map sum spectrum of the produced salts. The atomic percentages of the produced salts were analyzed according to the EDS map sum spectrum, as shown in Figure 13b. It can be observed that among them, the C percentage of the produced salts (49.91%) was much highest. This phenomenon could be mainly related to the existence of amine-based absorbents on the surfaces of crystallized sodium sulfate. Thereby, the obtained information suggests that priority pollutants, i.e., the amine-based absorbents, migrated to the salts produced during the reuse treatment process.
As a result, a priority pollutant migration mechanism of the produced wastewater from the tail gas oxidation-absorption technology of a natural gas purification plant during the reuse treatment process is proposed, as shown in Figure 14. In practice, the tail gas oxidation-absorption technology lowered sulfur dioxide emissions below 100 mg/m3, which is better than the sulfur dioxide emission standard of GB/T39728-2020 in China (≤400 mg/m3). Unfortunately, however, a large amount of wastewater was produced by the tail gas oxidation-absorption technology (See Figure 6). It is found, that the produced wastewater was acid sulfate-rich organic wastewater, and thereby TOC, COD, BOD5, TN, ammonia-N, SS and inorganic species could be detected. High values of TOC and TN revealed that the priority pollutants of the produced wastewater were related to amine-based absorbents (See Figure 4). With our reuse treatment process (See Figure 2), the TOC, COD, BOD5, TN, ammonia-N, SS and inorganic species of the permeated and condensate water were reduced significantly, and their water quality could meet the reuse requirements of recycling water (GB/T18920-2022) in China (See Figure 7, Figure 8 and Figure 9). In particular, the obtained results of FT-IR, SEM and EDS demonstrated that the salts produced from the evaporative desalination treatment of the concentrated wastewater were mixtures of sodium sulfate and amine-based absorbents (See Figure 10, Figure 11, Figure 12 and Figure 13). Indeed, priority pollutants in the produced water were removed successfully during the reuse treatment process.

4. Conclusions

In summary, the oxidation-absorption technology and its produced wastewater were described, and then a facile and full-scale reuse treatment strategy based on the sequential combination of disc tube reverse osmosis and evaporation desalination at low temperature and low pressure was reported. The produced wastewater was acid sulfate-rich organic light yellow wastewater with a pH of 3.8. The COD, BOD5, TOC, ammonia-N, TN and SS of the produced wastewater were 207, 71.9, 67.6, 1.28, 70.5 and 20.9 mg/L, respectively. SO42− (6479 mg/L) and SO32− (459 mg/L) were found in the produced water. After the DTRO treatment, there was COD (6 mg/L), BOD5 (1.4 mg/L), TOC (0.9 mg/L), TN (2.07 mg/L), SS (6 mg/L) and SO42− (90 mg/L) in the permeated water. In the condensate water, COD (11 mg/L), BOD5 (2.3 mg/L), TOC (4.3 mg/L), SS (2 mg/L) and SO42− (1.2 mg/L) were detected after the low-temperature evaporation and desalination treatments of the concentrated wastewater. Obviously, with our proposed reuse treatment, the pollution indexes were reduced to meet the water quality standard (GB/T18920-2022) in China, and the total water recovery rate reached 98.2 vol%. As a result, the priority pollutant migration mechanism during the reuse treatment process was determined. It was confirmed that the priority pollutants of the produced water, i.e., the amine-based absorbents, migrated to the produced salts, so the water quality of the permeated water and condensate water was excellent. This study provides insights into a facile and full-scale reuse treatment system to obtain zero liquid discharge of the wastewater produced from the oxidation-absorption technology.

Supplementary Materials

The following supporting information can be downloaded at: https://www.mdpi.com/article/10.3390/w15122259/s1, Video S1: process of low-temperature and low-pressure evaporation desalination; Video S2: salts produced from the evaporation desalination treatment.

Author Contributions

Conceptualization, methodology, validation, investigation, data curation, software, formal analysis, writing—original draft preparation, writing—review and editing, Q.T.; conceptualization, validation, resources, J.L., J.F., D.L. and L.Z.; data curation, software, formal analysis, C.Y., Q.Z. and C.H. All authors have read and agreed to the published version of the manuscript.

Funding

This research was funded by PetroChina Southwest Oil & Gas Field Company (Chengdu, China), grant number 20220307-12.

Data Availability Statement

All the obtained data are presented in the manuscript.

Acknowledgments

The authors acknowledge that Chao Han and Jingchen Tian (Natural Gas Purification General Plant, PetroChina Southwest Oil & Gas Field Company, Chongqing, China) provided us with their kind help in this study. In addition, the authors thank Aichun Hua (Kunshan WSD Environmental Protection Equipment Co., Ltd., Kunshan, China) for his discussion and kind assistance.

Conflicts of Interest

The authors declare no conflict of interest.

References

  1. Sun, J.; Sun, X. China’s natural gas reform: Why and how. Energy Sources Part B 2018, 13, 176–182. [Google Scholar] [CrossRef]
  2. Ma, L.; Geng, J.; Li, W.; Liu, P.; Li, Z. The development of natural gas as an automotive fuel in China. Energy Policy 2013, 62, 531–539. [Google Scholar] [CrossRef]
  3. Brown, M.; Siddiqui, S.; Avraam, C.; Bistline, J.; Decarolis, J.; Eshraghi, H.; Giarola, S.; Hansen, M.; Johnston, P.; Khanal, S.; et al. North American energy system responses to natural gas price shocks. Energy Policy 2021, 149, 112046. [Google Scholar] [CrossRef]
  4. Subramaniam, R.; Yasa, S.; Bertrand, T.; Fontenot, B.; Dupuis, T.F.; Hernandez, R. Advanced simulation of H2S scavenging process with triazine at different depths of gas well. J. Nat. Gas Sci. Eng. 2018, 49, 417–427. [Google Scholar] [CrossRef]
  5. Shoukat, U.; Pinto, D.D.D.; Knuutila, H.K. Study of various aqueous and non-aqueous amine blends for hydrogen sulfide removal from natural gas. Processes 2019, 7, 160. [Google Scholar] [CrossRef] [Green Version]
  6. Doujaiji, B.; Al-Tawfiq, J.A. Hydrogen sulfide exposure in an adult male. Ann. Saudi Med. 2010, 30, 76–80. [Google Scholar] [CrossRef]
  7. Amosa, M.; Mohammed, I.; Yaro, S. Sulphide scavengers in oil and gas industry—A review. Nafta 2010, 61, 85–92. [Google Scholar]
  8. Mandal, B.P.; Biswas, A.K.; Bandyopadhyay, S.S. Selective absorption of H2S from gas streams containing H2S and CO2 into aqueous solutions of N-methyldiethanolamine and 2-amino-2-methyl-1-propanol. Sep. Purif. Technol. 2004, 35, 191–202. [Google Scholar] [CrossRef]
  9. Huttenhuis, P.J.G.; Agrawal, N.J.; Hogendoorn, J.A.; Versteeg, G.F. Gas solubility of H2S and CO2 in aqueous solutions of N-methyldiethanolamine. J. Pet. Sci. Eng. 2007, 55, 122–134. [Google Scholar] [CrossRef] [Green Version]
  10. Abdulrahman, R.K.; Sebastine, I.M. Natural gas sweetening process simulation and optimization: A case study of Khurmala field in Iraqi Kurdistan region. J. Nat. Gas Sci. Eng. 2013, 14, 116–120. [Google Scholar] [CrossRef]
  11. Elmawgoud, H.A.; Elshiekh, T.M.; Khalil, S.A.; Alsabagh, A.M.; Tawfik, M. Modeling of hydrogen sulfide removal from Petroleum production facilities using H2S scavenger. Egypt. J. Pet. 2015, 24, 131–137. [Google Scholar] [CrossRef] [Green Version]
  12. Schmidt, R.; Cross, J.B.; Latimer, E.G. Tail-gas cleanup by simultaneous SO2 and H2S removal. Energy Fuels 2009, 23, 3612–3616. [Google Scholar] [CrossRef]
  13. Abdulsalam, J.; Mulopoa, J.; Amosa, M.K.; Bada, S.; Falcon, R.; Oboirienf, B.O. Towards a cleaner natural gas production: Recent developments on purification technologies. Sep. Sci. Technol. 2019, 54, 2461–2497. [Google Scholar] [CrossRef]
  14. Malolan, R.; Gopinath, K.P.; Vo, D.V.N.; Jayaraman, R.S.; Adithya, S.; Ajay, P.S.; Arun, J. Green ionic liquids and deep eutectic solvents for desulphurization, denitrifcation, biomass, biodiesel, bioethanol and hydrogen fuels: A review. Environ. Chem. Lett. 2021, 19, 1001–15199. [Google Scholar] [CrossRef]
  15. Pudi, A.; Rezae, M.; Signorini, V.; Andersson, M.P.; Baschetti, M.G.; Mansouri, S.S. Hydrogen sulfide capture and removal technologies: A comprehensive review of recent developments and emerging trends. Sep. Purif. Technol. 2022, 298, 121448. [Google Scholar] [CrossRef]
  16. Zarei, S.; Ganji, H.; Sadi, M.; Rashidzadeh, M. Kinetic modeling and optimization of Claus reaction furnace. J. Nat. Gas Sci. Eng. 2016, 31, 747–757. [Google Scholar] [CrossRef]
  17. Zarei, S.; Ganji, H.; Sadi, M.; Rashidzadeh, M. Thermo-kinetic modeling and optimization of the sulfur recovery unit thermal stage. Appl. Therm. Eng. 2016, 103, 1095–1104. [Google Scholar] [CrossRef]
  18. Zarei, S. Life cycle assessment and optimization of Claus reaction furnace through kinetic modeling. Chem. Eng. Res. Des. 2019, 148, 75–85. [Google Scholar] [CrossRef]
  19. Zarei, S. A global reaction scheme for partial oxidation of pure H2S and H2S+CH4 mixtures in claus conditions. Energy Fuel 2017, 31, 6478–6492. [Google Scholar] [CrossRef]
  20. Zarei, S. Exergetic, energetic and life cycle assessments of the modified claus process. Energy 2020, 191, 116584. [Google Scholar] [CrossRef]
  21. Guo, H.; Wei, J.; Li, X.; Ho, H.C.; Song, Y.; Wu, J.; Li, W. Do socioeconomic factors modify the effects of PM1 and SO2 on lung cancer incidence in China? Sci. Total Environ. 2021, 756, 143998. [Google Scholar] [CrossRef]
  22. Zhu, L.; Zhang, Y.; Wu, Z.; Zhang, C. Spatio-temporal characteristics of SO2 across Weifang from 2008 to 2020. Int. J. Environ. Res. Public Health 2021, 18, 12206. [Google Scholar] [CrossRef]
  23. Sram, R.J. Impact of Air Pollution on the Health of the Population in Parts of the Czech Republic. Int. J. Environ. Res. Public Health 2020, 17, 6454. [Google Scholar] [CrossRef] [PubMed]
  24. Zhang, Q.; Sun, S.; Sui, X.; Ding, L.; Yang, M.; Li, C.; Zhang, C.; Zhang, X.; Hao, J.; Xu, Y.; et al. Associations between weekly air pollution exposure and congenital heart disease. Sci. Total Environ. 2021, 757, 143821. [Google Scholar] [CrossRef]
  25. Léveillé, V.; Claessens, T. Cansolv® SO2 scrubbing system: Review of commercial applications for smelter SO2 emissions control. J. S. Afr. I. Min. Metall. 2009, 109, 485–489. [Google Scholar]
  26. Song, X.; Min, H.; Zhao, L.; Fu, Q.; Zheng, W.; Wang, X.; Ding, X.; Liu, L.; Ji, M. The experience and development of the treatment technology of municipal solid waste leachate in China. Water 2022, 14, 2458. [Google Scholar] [CrossRef]
  27. Cingolani, D.; Fatone, F.; Frison, N.; Spinelli, M.; Eusebi, A.L. Pilot-scale multi-stage reverse osmosis (DT-RO) for water recovery from landfill leachate. Waste Manag. 2018, 76, 566–574. [Google Scholar] [CrossRef]
  28. Chung, S.; Seungjin Kim, S.; Kim, J.O.; Chung, J. Feasibility of combining reverse osmosis-ferrite process for reclamation of metal plating wastewater and recovery of heavy metals. Ind. Eng. Chem. Res. 2014, 53, 15192–15199. [Google Scholar] [CrossRef]
  29. Zhang, Z.W.; Wu, Y.H.; Luo, L.W.; Li, G.L.; Li, Y.B.; Hu, H.Y. Application of disk tube reverse osmosis in wastewater treatment: A review. Sci. Total. Environ. 2021, 792, 148291. [Google Scholar] [CrossRef]
  30. Gude, V.G.; Nirmalakhandan, N. Desalination at low temperatures and low pressures. Desalination 2009, 244, 39–247. [Google Scholar] [CrossRef]
  31. Natarajan, S.K.; Suraparaju, S.K.; Elavarasan, R.M. A review on low-temperature thermal desalination approach. Environ. Sci. Pollut. Res. 2022, 29, 32443–32466. [Google Scholar] [CrossRef]
  32. Huang, J.; Zhao, G.; Zhang, Y.; Wu, Z.; Tang, Q. Oil-based drilling cuttings from shale gas wells treated with CO2 switchable hydrophilic solvents: Priority pollutant migration and produced wastewater assessment. Water 2022, 14, 3433. [Google Scholar] [CrossRef]
  33. Lauzurique, Y.; Espinoza, L.C.; Huiliñir, C.; García, V.; Salazar, R. Anodic oxidation of industrial winery wastewater using different anodes. Water 2022, 12, 95. [Google Scholar] [CrossRef]
  34. APHA (American Public Health Association). Standard Methods for the Examination of Water and Wastewater, 20th ed.; American Public Health Association, American Water Works Association, Water Environment Federation: Washington, DC, USA, 1998. [Google Scholar]
  35. Song, C.; Liu, Q.; Ji, N.; Deng, S.; Zhao, J.; Kitamura, Y. Natural gas purification by heat pump assisted MEA absorption process. Appl. Energy 2017, 204, 353–361. [Google Scholar] [CrossRef]
Figure 1. Block diagram of a typical reduction–absorption technology in natural gas purification plants (a) and an oxidation-absorption technology in non-ferrous industries (b).
Water 15 02259 g001
Figure 2. Block diagram of a treatment system for reusing the produced wastewater from the oxidation-absorption technology.
Water 15 02259 g002
Figure 3. Process flow diagram of an oxidation-absorption technology from a natural gas purification plant in Chongqing, China.
Water 15 02259 g003
Figure 4. Amine-based absorbents used in the sulfur dioxide absorber tower.
Water 15 02259 g004
Figure 5. Digital photo of amine purification apparatus.
Water 15 02259 g005
Figure 6. Digital photo (a), pollution characteristics (b), anions (c) and metal elements (d) of the raw wastewater.
Water 15 02259 g006
Figure 7. Digital photo of DTRO treatment unit (a), pH and conductivity (b), digital photo (c) and pollution characteristics (d) of the neutralized wastewater, concentrated wastewater and permeated water.
Water 15 02259 g007
Figure 8. Monitoring of anions (a) and metal elements (b) in the neutralized wastewater, concentrated wastewater and permeated water.
Water 15 02259 g008
Figure 9. Digital photo of LT-VR 1T evaporation desalination apparatus (a), digital photo (b), pollution characteristics (c) and inorganic species (d) of the condensate water.
Water 15 02259 g009
Figure 10. Digital photo (a) and FT-IR spectrum (b) of the produced salts from evaporative desalination. Subfigure (b) gives the individual characteristic peaks of the produced salts at 2925 cm−1 and 2885 cm−1.
Water 15 02259 g010
Figure 11. SEM images of produced salts at ×300 (a), ×1000 (b) and ×5000 (c).
Water 15 02259 g011
Figure 12. EDS profile (a) and corresponding elemental mappings (b) of produced salt surfaces.
Water 15 02259 g012
Figure 13. EDS elemental map sum spectrum (a) and atomic percentages (b) of produced salts.
Water 15 02259 g013
Figure 14. A proposed priority pollutant migration mechanism during the reuse treatment process.
Water 15 02259 g014
Disclaimer/Publisher’s Note: The statements, opinions and data contained in all publications are solely those of the individual author(s) and contributor(s) and not of MDPI and/or the editor(s). MDPI and/or the editor(s) disclaim responsibility for any injury to people or property resulting from any ideas, methods, instructions or products referred to in the content.

