Article

Assessment of Water Reclamation and Reuse Potential in Bali Province, Indonesia

by
Mitria Widianingtias
1,
Shinobu Kazama
2,
Sawangjang Benyapa
1 and
Satoshi Takizawa
1,*
1
Department of Urban Engineering, Graduate School of Engineering, The University of Tokyo, Bunkyo-ku 113-8654, Tokyo, Japan
2
Department of Socio-Cultural Environmental Studies, Graduate School of Frontier Sciences, The University of Tokyo, 5-1-5 Kashiwanoha, Kashiwa 277-8563, Chiba, Japan
*
Author to whom correspondence should be addressed.
Water 2023, 15(14), 2642; https://doi.org/10.3390/w15142642
Submission received: 14 June 2023 / Revised: 15 July 2023 / Accepted: 18 July 2023 / Published: 20 July 2023
(This article belongs to the Special Issue Sustainable Water Supply, Sanitation and Wastewater Systems)

Abstract

:
Bali Province, Indonesia, experiences serious water shortages and groundwater over-abstraction due to rapidly increasing water demand. Therefore, this study aimed to assess the potential for water reclamation and reuse in Bali Province, focusing on the operational performance of two wastewater treatment plants (WWTPs). Although the Suwung WWTP could increase its treatment capacity to produce reclaimed water for irrigation and landscape, there are multiple management issues to be addressed, including fluctuating water demand, limited customer base beyond hotels, concerns about water quality and safety, and cultural perceptions of reclaimed water. In addition, despite the organic loading rates being lower than the design value, the treatment performance of the Suwung WWTP was found to be significantly lower than that of the ITDC WWTP, which achieved high BOD, COD, and TSS removal rates by performing good maintenance of aerators and post-treatment based on dissolved air flotation (DAF). Causal loop analysis indicates that aerator malfunctioning causes multiple problems, such as low dissolved oxygen, poor BOD removal, sludge carryover, and low sludge concentrations. Therefore, regular maintenance of aerators, as well as the development of aerators robust against malfunctioning, are fundamental to producing effluents from stabilization ponds that meet the requirements for irrigation and landscape reuse.

Graphical Abstract

1. Introduction

Water scarcity threatens sustainable development globally due to its impacts on public health and economic development [1]. Water scarcity is harming ecosystems, damaging health, and devastating livelihoods [2]. Physical water scarcity is a common problem in many countries, including the U.S., Middle Eastern and North African nations, parts of Europe, South Asia, and parts of Australia [3]. The United Nations reported that global water demand is projected to increase by 80%, resulting in approximately 1.7–2.4 billion people living in water-scarce areas by 2050 [4,5,6]. Alternative water resources, such as rainwater harvesting (RWH), desalination, and water reuse, have been developed to address water scarcity [7]. Although RWH is cost-effective and has been utilized for a long time, it has limitations, such as volume and water quality issues [8,9]. Desalination is expensive and energy-consuming and has negative environmental impacts [10], while water reuse is a more reliable option in some areas due to its resilience to drought [11]. Around 11% of global wastewater effluents are reused, mostly in the Middle East, North Africa, and Europe, specifically for irrigation purposes, accounting for 85% in Israel and 70% in Spain [12].
Water reclamation and reuse are expected to be a promising solution to the increasing demand for water resources [13]. By treating wastewater to specific quality standards, reclaimed water could be a reliable and sustainable source of water, particularly in urban areas where approximately 80% of the water consumed ends up in wastewater streams [14]. Urban water reuse is rapidly increasing and is becoming an integral component of integrated water resource management in large cities [15]. Reclaimed water is commonly used for non-potable purposes, including irrigation of green areas, urban development, such as waterfalls, fountains, and lakes, in-building applications for air conditioning and toilet flushing, road and street cleaning, car washing, and firefighting [16,17]. However, the potential uses of reclaimed water vary by region [18]. For instance, the Tenorio WWTP in San Luis Potosi, Mexico, produces multi-quality reclaimed water for different purposes, including industrial use, agricultural irrigation, groundwater restoration, and environmental enhancement [19]. In Japan, water reuse is practiced in several cities, mostly for urban uses, such as toilet flushing, stream water augmentation, and landscape irrigation [20]. In Israel, water reclamation and reuse are in a mature stage of development, where 85% of the treated wastewater is reused, mainly for the agricultural irrigation of industrial crops, citrus trees, cooked food, and unrestricted irrigation crops [12,21]. In Singapore, water reuse involves two products, non-potable use in industries and NEWater, to replenish the potable water supply by injecting it into reservoirs [22]. In California, reclaimed water is primarily used for non-potable purposes, such as agricultural and landscape irrigation, and for indirect potable reuse, i.e., groundwater recharge and reservoir water augmentation [23].
To provide a reference to countries practicing water reclamation and reuse, the World Health Organization (WHO) published guidelines for water reuse in 2006, titled Safe use of wastewater, excreta, and greywater [24]. There are various water reclamation technologies that can be used individually or in combination to meet the water quality goals of different applications [17]. However, the widespread implementation of water reuse is hindered by several socio-economic factors, such as stringent regulations and inadequate knowledge of its benefits [9,25]. Therefore, it is important to consider not only the technological aspects but also the socio-economic factors of water reclamation and reuse projects.
In Bali Province, Indonesia, water scarcity is particularly critical due to the steady growth of both the population and the tourism industry. The population of Bali Province was 4.4 million in 2022 and is still annually increasing at a rate of 1.01% [26,27], while the tourism industry annually increased by 12.2% from 2015 to 2019 [28]. Tourists consume water for various purposes, including daily activities, leisure activities, and amenities such as spas and swimming pools. Furthermore, freshwater is essential for maintaining hotel gardens, tourism infrastructure, and attractions [29,30]. Thus, with the increasing number of tourists and inhabitants, the water demand has surged [30], reducing the available water per capita [31].
There are two wastewater treatment plants (WWTPs) in Bali Province, the Indonesia Tourism Development Corporation (ITDC) WWTP and the Suwung WWTP. The ITDC WWTP treats wastewater from the Nusa Dua area and produces reclaimed water for irrigating gardens in hotels, golf courses, and public areas [32]. However, the capacity and service area of the ITDC WWTP are limited. Although the Suwung WWTP has the potential to expand the treatment capacity for water reuse up to five times that of the ITDC WWTP, the treatment performance of the Suwung WWTP has never been evaluated for the reuse of its effluent. Therefore, this study aimed to evaluate the potential of reclaimed water from the Suwung WWTP for water reuse in comparison with the performance and effluent water quality of the ITDC WWTP. The comparative analysis helped identify the similarities and differences between the two WWTPs, and the necessary improvements in the Suwung WWTP to produce reclaimed water for irrigation and other applications. The demand for reclaimed water was also estimated based on an interview survey to assess the feasibility of expanding the use of reclaimed water in Bali Province.

2. Materials and Methods

2.1. Water Sources in Bali Province
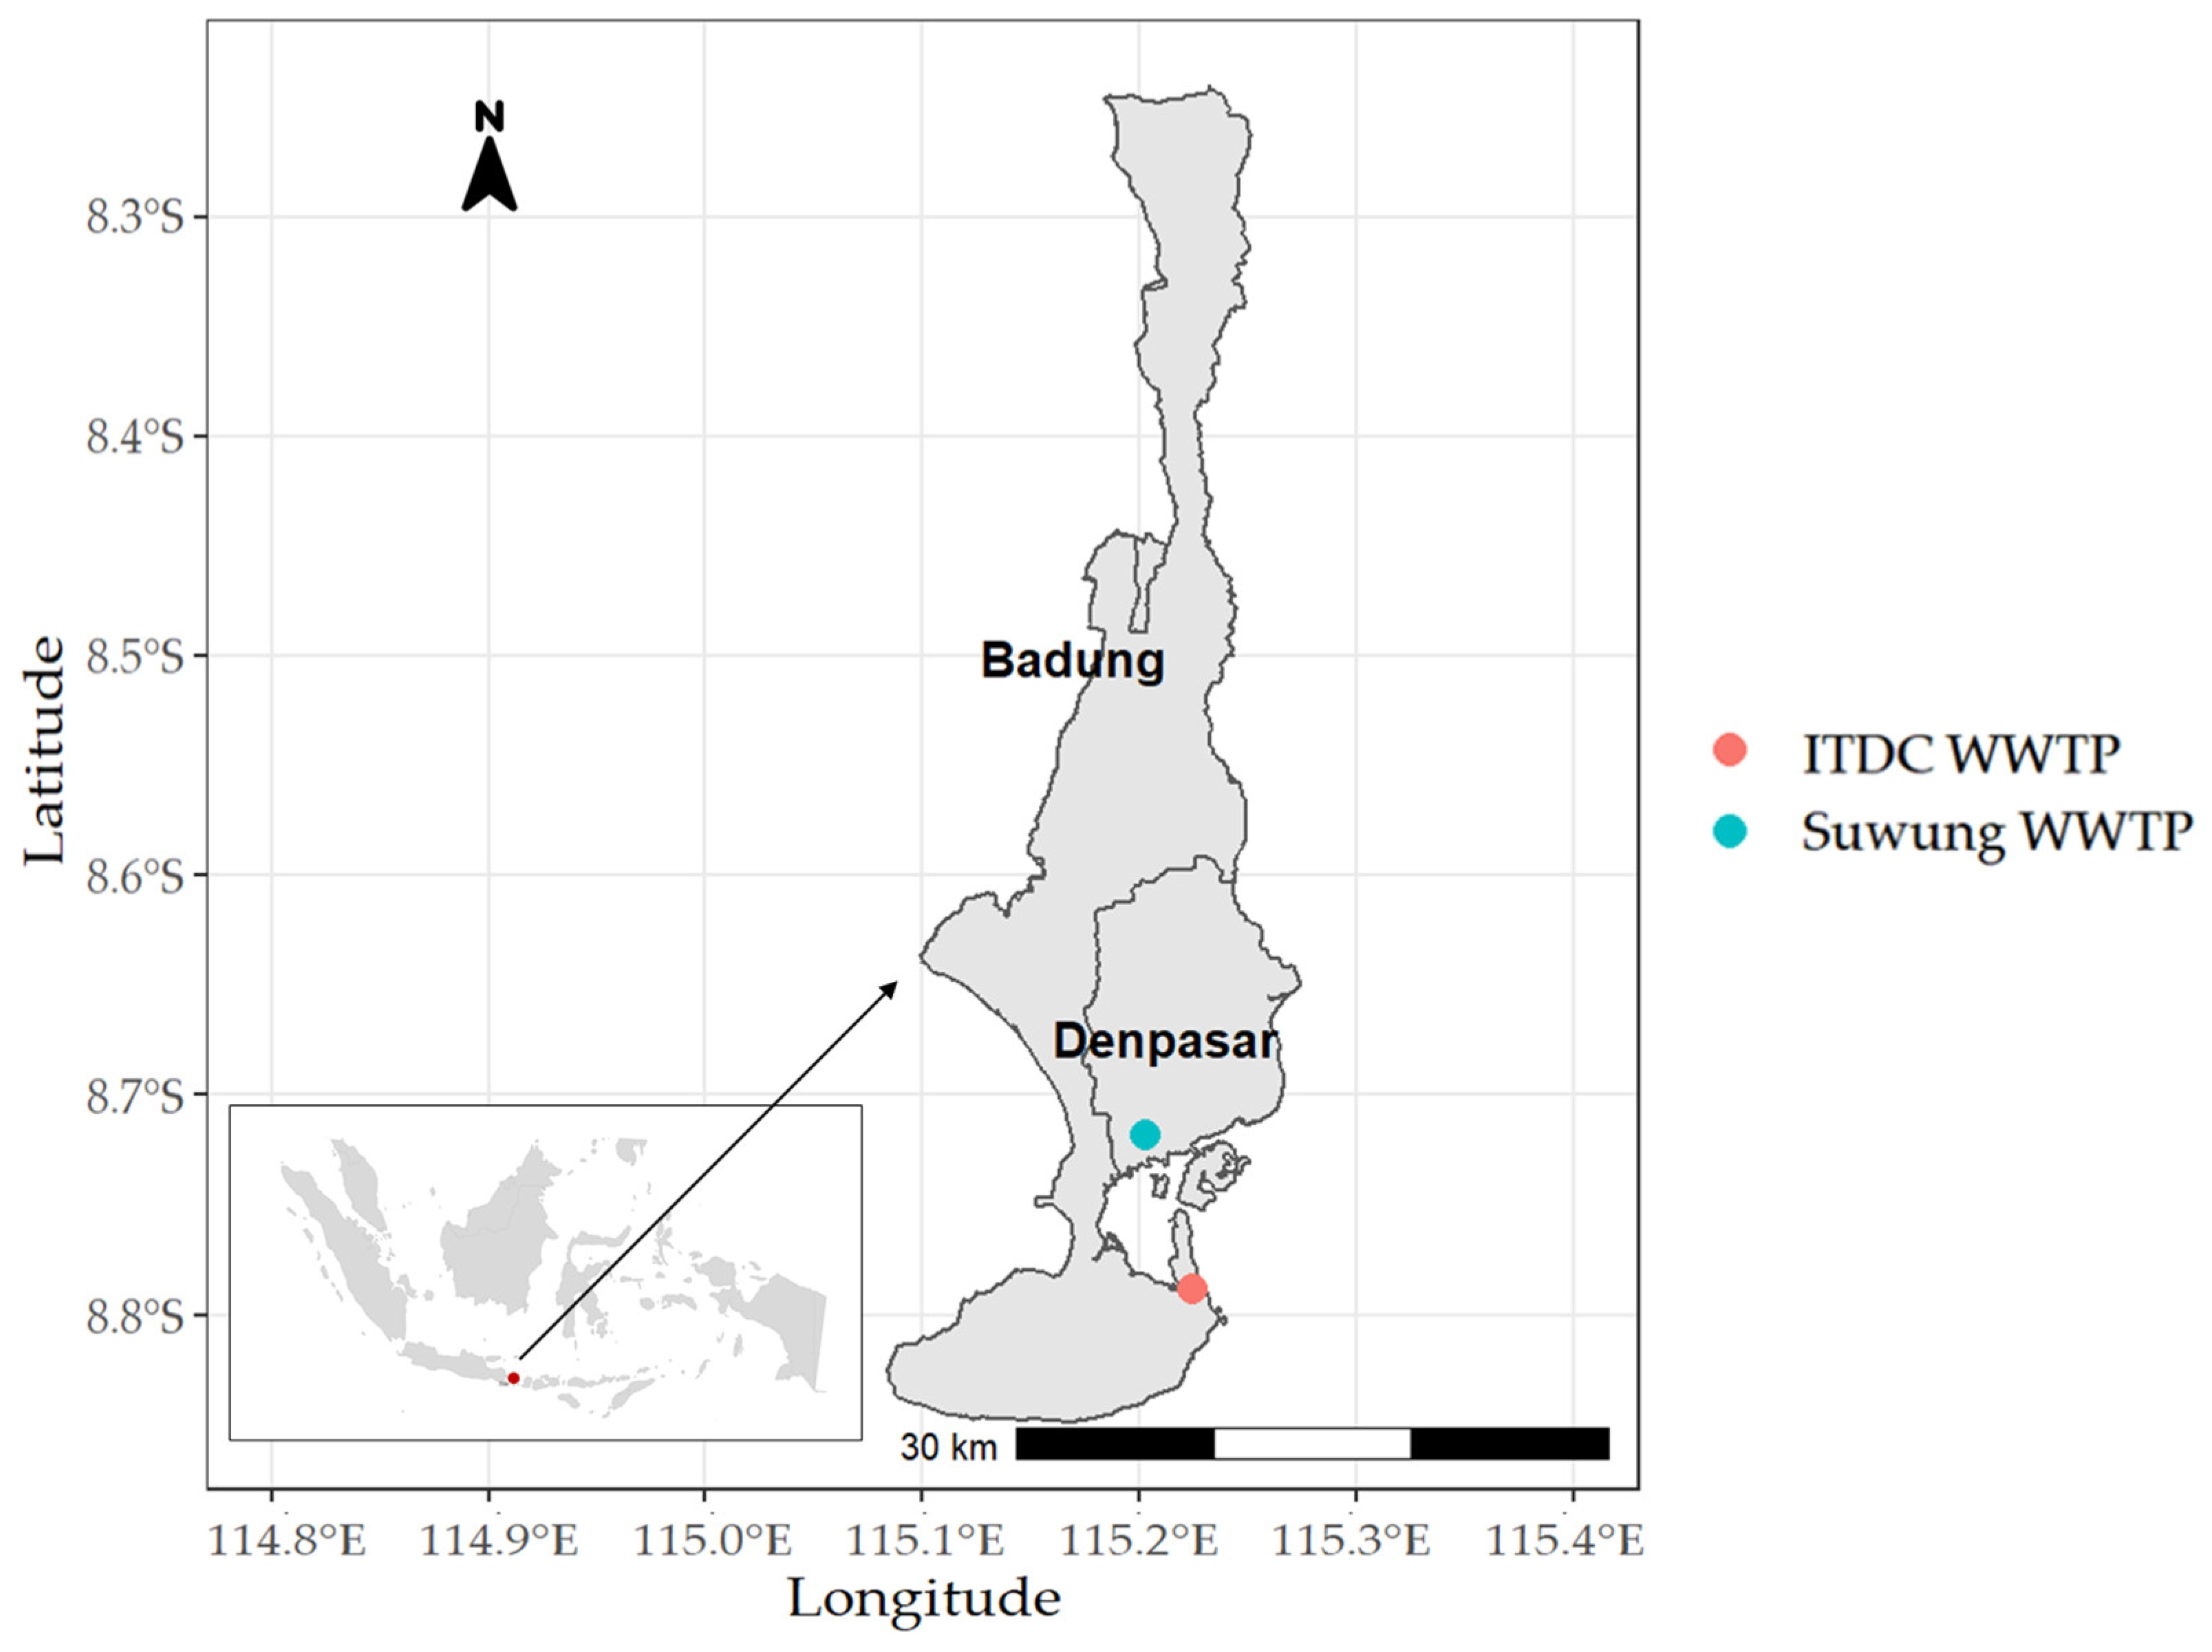
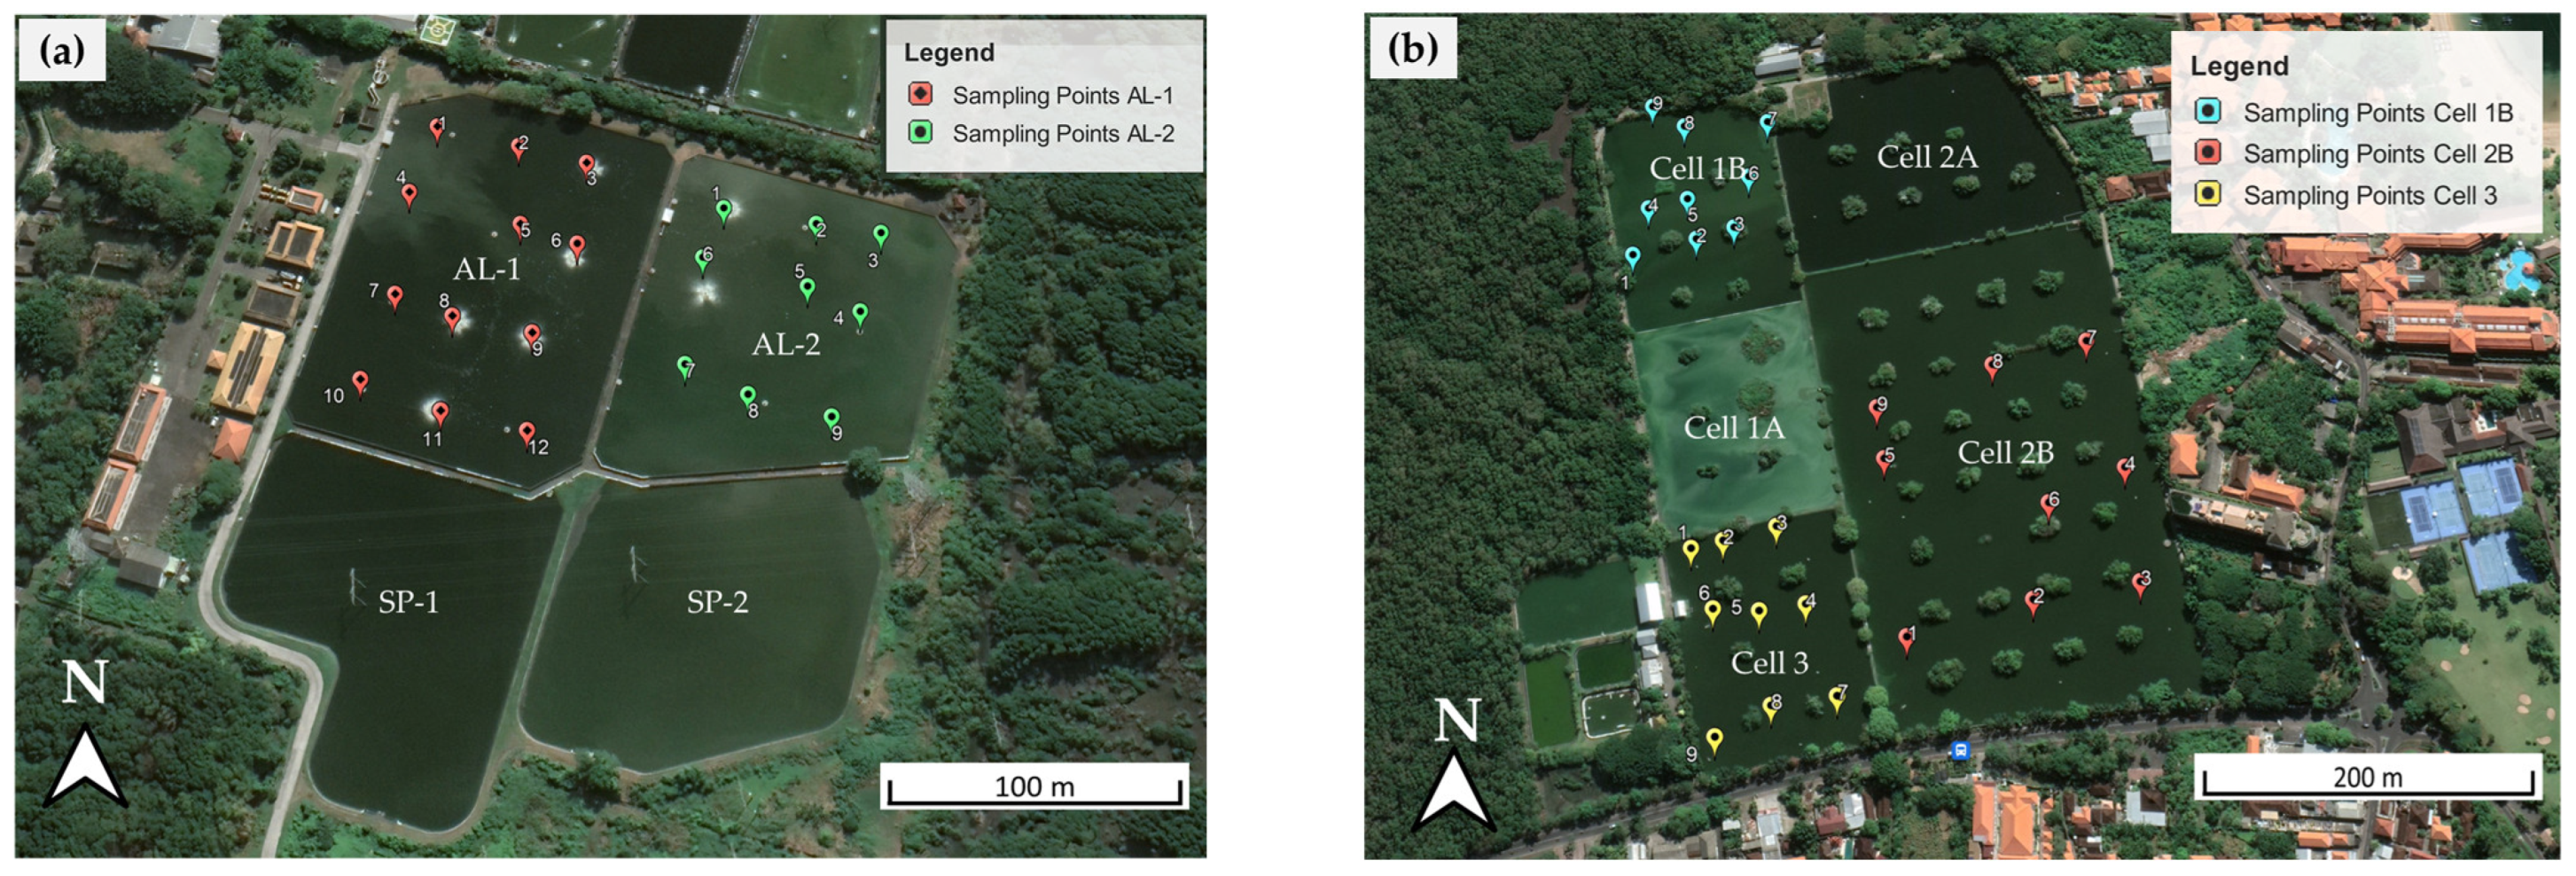
There are 9 water supply enterprises in Bali Province supplying 109 million m3/y of piped water, which is significantly less than the water demand of 272 million m3/y in 2020 [26,33,34]. It was also reported that only 40.1% of Bali Province’s population is served by piped water [34]. The raw water sources of piped water are groundwater, rivers, spring water, lakes, and others, accounting for 38.9%, 29.3%, 25.5%, 0.9%, and 5.4%, respectively [35]. In areas where piped water supply is unavailable, households rely on groundwater extracted from deep wells, which serves 57.2% of Bali Province’s population [34]. Therefore, the majority of the population depends on groundwater as their primary water source, obtained with either piped or non-piped systems. Such high dependence on groundwater has endangered the sustainability of the water resources in Bali Province. It was reported that the excessive use of groundwater results in ecological and hydrogeological problems, such as land subsidence, seawater intrusion, and ecosystem damage [36,37]. Similarly, excessive groundwater exploitation in Bali Province beyond sustainable levels (>392 million m3/y) would result in the depletion of groundwater resources [38,39].
Surface water is another water source in Bali Province. Although there are several rivers, including the Ayung River in the western region of Bali Province, the water quality of these rivers is often impacted by agricultural activities, industrial waste, and domestic wastewater. The 2015 Environmental Status Report [40] indicated deterioration in river water quality, particularly in the Badung and Mati Rivers, exceeding the raw water quality standards for drinking water supply parameters, such as BOD, COD, and total coliforms. Additionally, Haribowo et al. [41] found that the Badung River is contaminated by pollutants measured as TSS, BOD, COD, and phosphorus. River pollution significantly impacts water supply systems, leading to limited availability of water throughout the day. Compared with the estimated water demand of 3.96 billion m3/y, which includes domestic, agricultural, fishery, and plantation needs, only 2.08 billion m3/y is available from surface water in Bali Province [42].
The rainy season in Bali Province typically occurs from October to March, while the dry season lasts from April to September [43]. The average annual rainfall in Bali Province between 2003 and 2022 was 2056.7 mm [44]. Despite the high rainfall, the seasonal variation in rainfall makes it difficult to adapt rainwater harvesting, and the development of impervious residential areas reduces rainwater infiltration into aquifers and increases surface runoff. In Denpasar City, for instance, the weighted runoff coefficient was 0.46 in 2013 [45], and rainwater infiltration in Denpasar is estimated to be approximately 25.4 million m3/y, which is only about 10% of the total rainfall volume of 252.5 million m3/y [46].

2.2. Study Areas

Bali Province is located east of Java and west of Lombok, at the westernmost end of the Lesser Sunda Islands. The province covers an area of 5590 km2, and its total population exceeded 4.4 million in 2022 [27]. Bali Province comprises eight regencies and one city, as shown in Table A1 in Appendix A. This study compared two WWTPs, namely, the Suwung WWTP and the ITDC WWTP (Figure 1). The Suwung WWTP (Figure 2a) is located in Suwung Village, the Pamogan area of Denpasar City, and serves the areas of Denpasar City and Badung Regency (Kuta and Sanur). The WWTP collects wastewater from the social, domestic, government, hotel, restaurant, commercial, and public sectors. As of 2021, it provided services to 14,943 households, with a treatment capacity of 51,000 m3/d. However, there is a plan to expand the household connections to 31,050 and increase the capacity to 81,000 m3/d by 2025. The Suwung WWTP comprises two aerated lagoons with volumes of 52,889 m3 and 42,169 m3, equipped with 21 mechanical aerators. The hydraulic retention time (HRT) in the aerated lagoons is about 2 d, followed by sedimentation ponds 1 and 2 with volumes of 24,371 m3 and 24,273 m3, respectively, and HRT of 23 h [47]. The treatment is divided into two parallel treatment processes, i.e., Process 1 and Process 2. Process 1 consists of aerated lagoon 1 (AL-1) and sedimentation pond 1 (SP-1), while Process 2 comprises aerated lagoon 2 (AL-2) and sedimentation pond 2 (SP-2). Finally, the effluent is discharged into the mangrove area toward Benoa Bay via a canal.
Meanwhile, the ITDC WWTP (Figure 2b) is located in Nusa Dua in the southern part of Bali Province, with a capacity of 10,000 m3/d. The wastewater treatment system includes lagoons and dissolved air flotation (DAF) equipment. The lagoon system is designed as a system of wastewater stabilization ponds, which comprise three cells: Cell 1 (1A and 1B); Cell 2 (2A and 2B); and Cell 3. The influent of the lagoon system flows from Cell 1A to Cell 1B, to Cell 2A, to Cell 2B, and finally, to Cell 3. Cell 1 is divided into two sections, 1A and 1B, separated by a fiberglass layer, which is an oil trap used to manually remove floating oil and other debris. The anaerobic process takes place in both Cell 1A and Cell 1B. Water then flows from Cell 1 to Cell 2, which includes two parts. Both Cells 2A and 2B have been modified as facultative aerated lagoons, with Cell 2B having a larger area, allowing a more efficient oxidation process. Oxygen is supplied to Cells 2A and 2B with mechanical aerators rather than photosynthesis. Cell 3 serves as a maturation pond, further polishing the wastewater before it is pumped to DAF equipment. The actual HRT in the stabilization ponds is 33 d, which is longer than the required HRT of 28 d in stabilization ponds. The WWTP collects wastewater from 36 hotels in the Nusa Dua area, including wastewater from bathrooms, lavatories, sinks, laundry, and kitchen, and all drainage is sent to an inlet chamber and continuously supplied to the treatment facility [32]. The daily inflow to the ITDC WWTP is 8000 m3/d, and around 3200 m3/d of the treated effluent is reused for watering gardens in hotels, golf courses, and the entire park within the Nusa Dua area, while 4800 m3/d is discharged to the mangrove seacoast. The ITDC WWTP charges 6812 IDR/m3 (0.46 USD/m3) for reclaimed water [48].

2.3. Data Collection

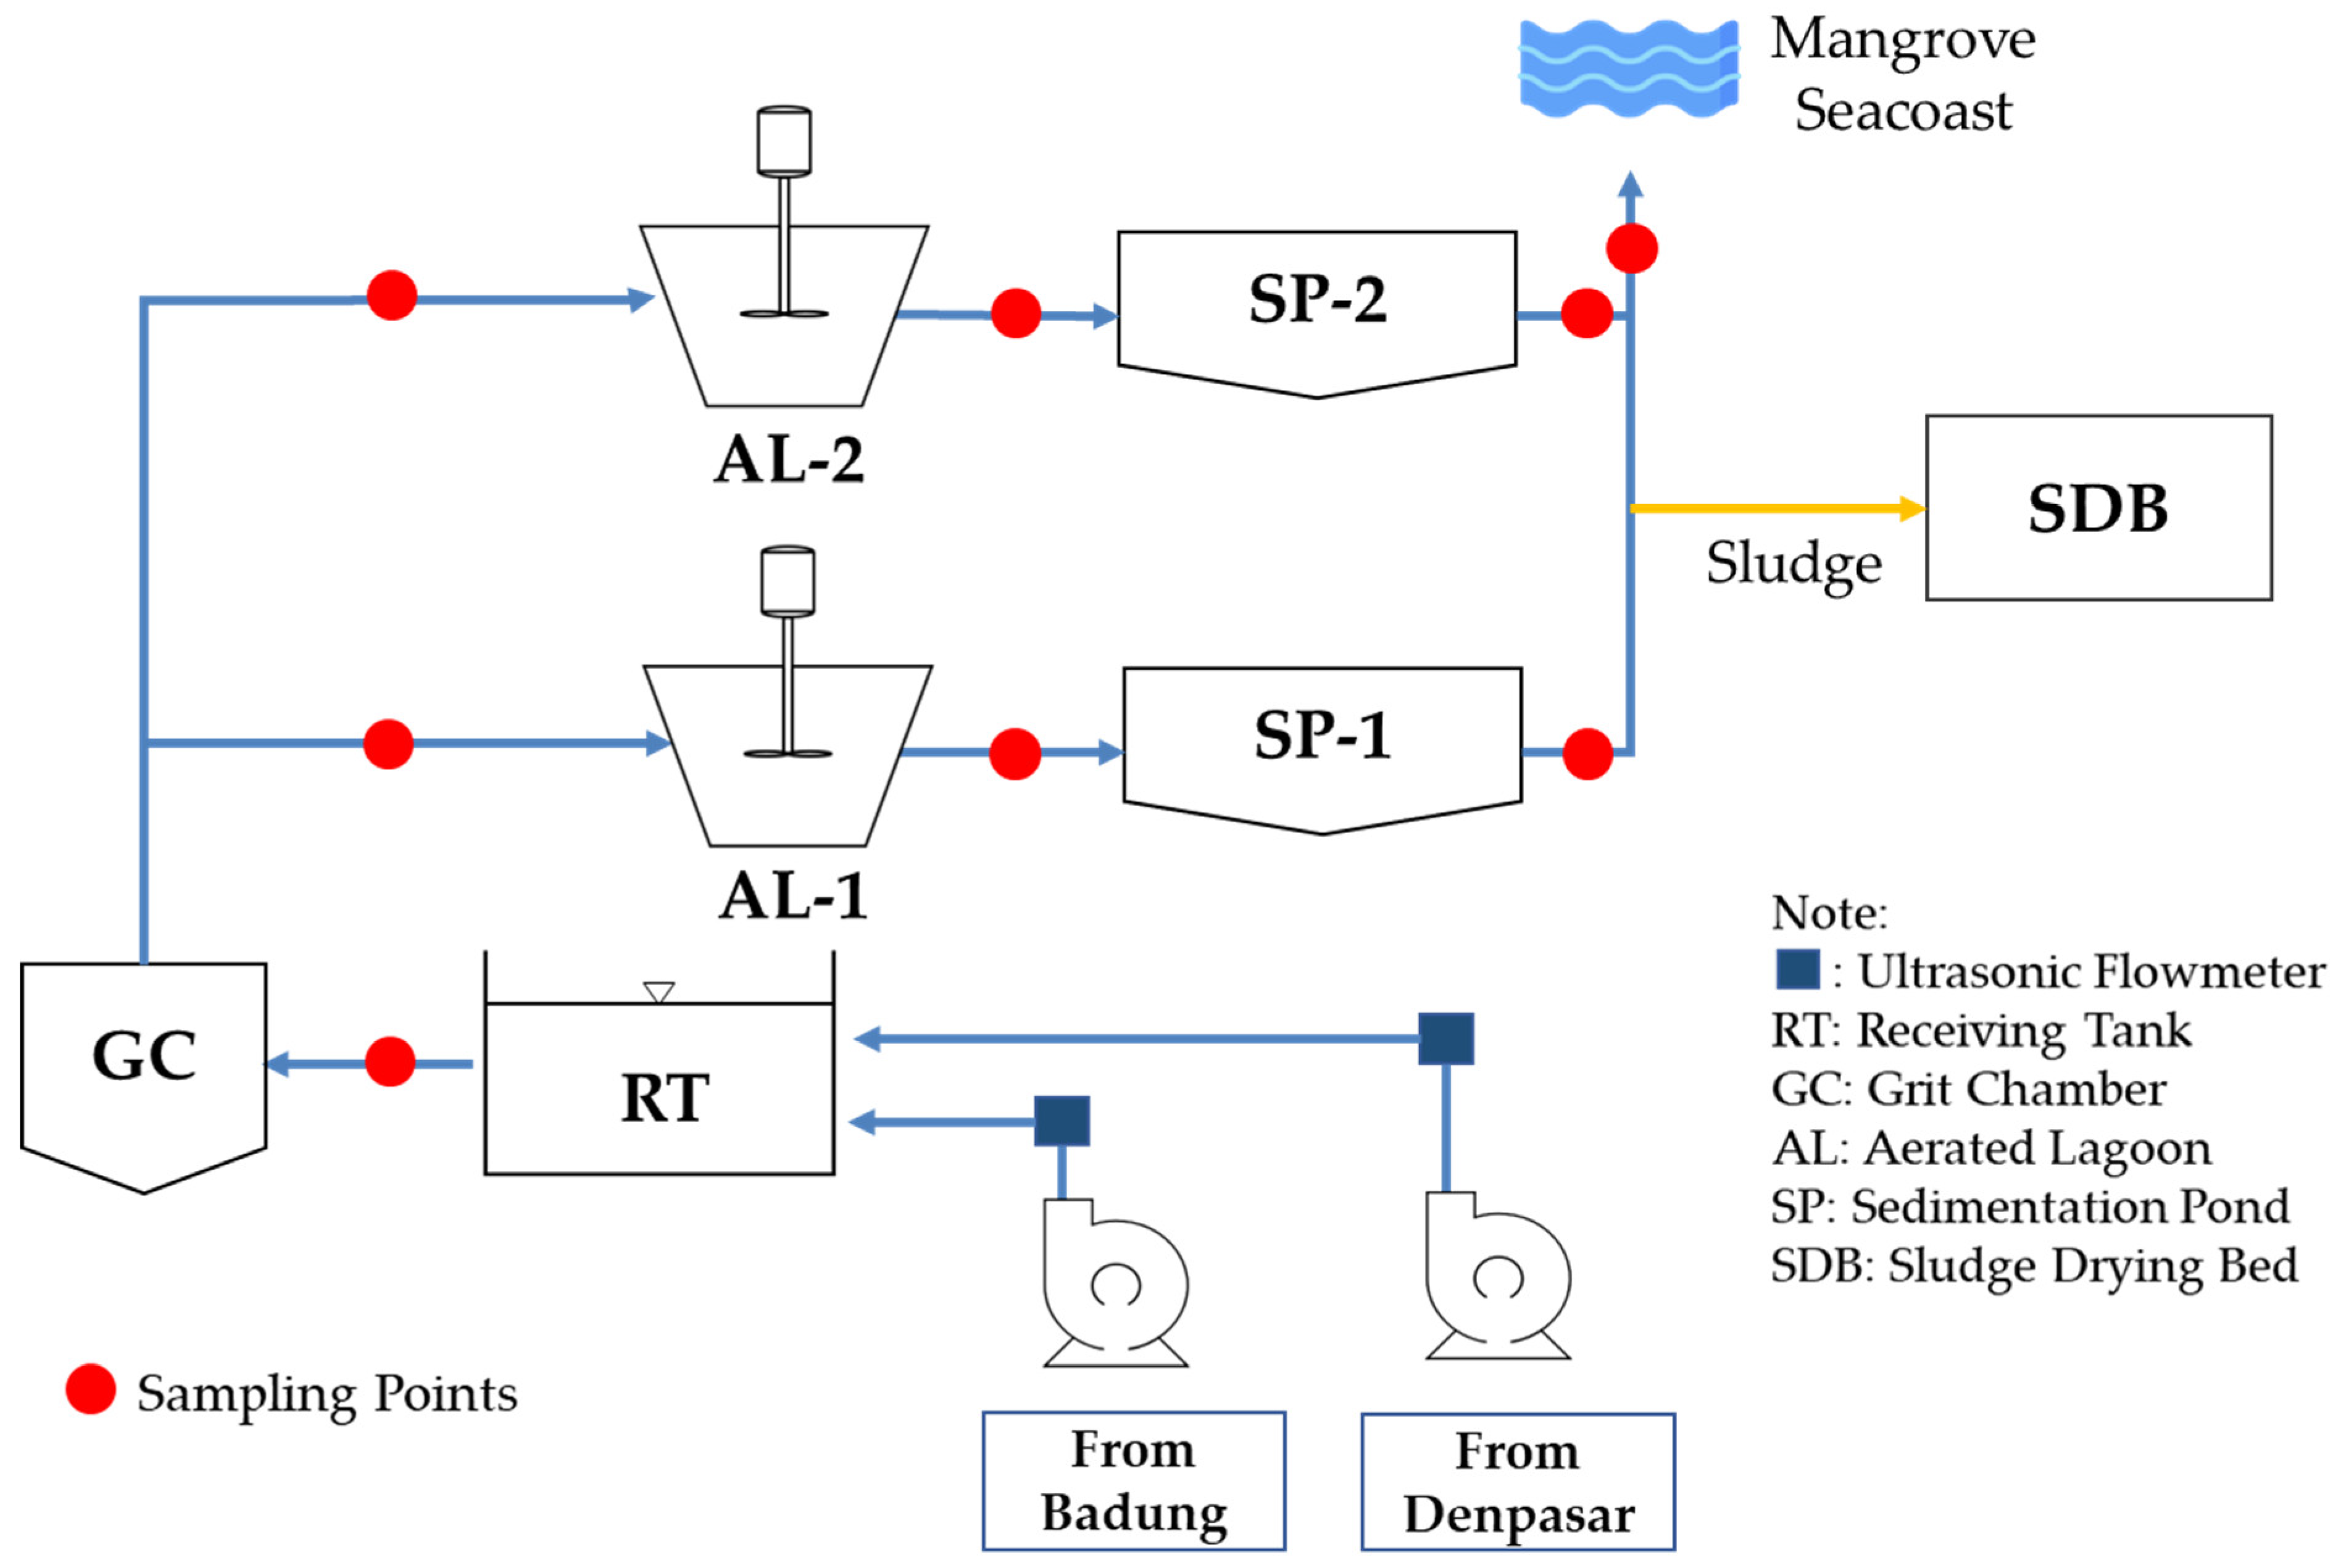
2.3.1. Sampling and Wastewater Quality Analysis

A field survey was conducted in August–September 2022 to assess the water quality and operational conditions of the Suwung WWTP. Grab water samples were collected at 9–11 am twice a week from 8 points at different stages of the treatment processes of the Suwung WWTP to evaluate treatment efficiency (Figure 3). The collected samples were analyzed at the laboratory on the same day.
In Indonesia, there are currently no guidelines for water reclamation and reuse. However, the quality standards for irrigation purposes, i.e., Government Regulation No. 22 of 2021 on Environmental Protection, Organization, and Management, were adopted in this study.
Table 1 presents the water quality parameters and their analysis methods. The parameters consist of physicochemical and microbial parameters. For each sampling point, direct measurements of temperature, electrical conductivity, and total dissolved solids (TDS) were conducted, while laboratory analyses were performed for other parameters. To measure BOD, the potassium permanganate method was applied, which assumes the organic matter oxidizable by potassium permanganate under alkaline conditions to be BOD. COD was measured using HACH reagent vials (No. 2125925), which can measure a large COD range of 20–1500 mg/L. For E. coli and total coliforms counting, samples were serially diluted to the range of 10−2 to 10−4 before inoculating 1 mL onto incubation plates to obtain colonies of 1–300 CFU/plate after incubation. The plates were then incubated for 24 h at 35 ± 2 °C before counting.

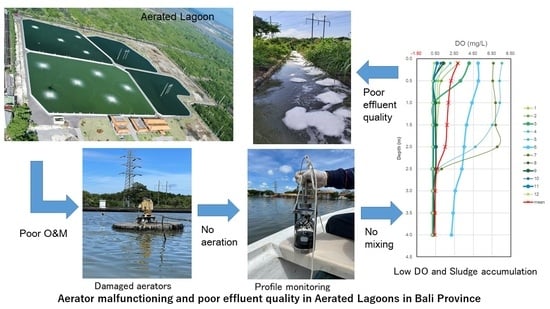
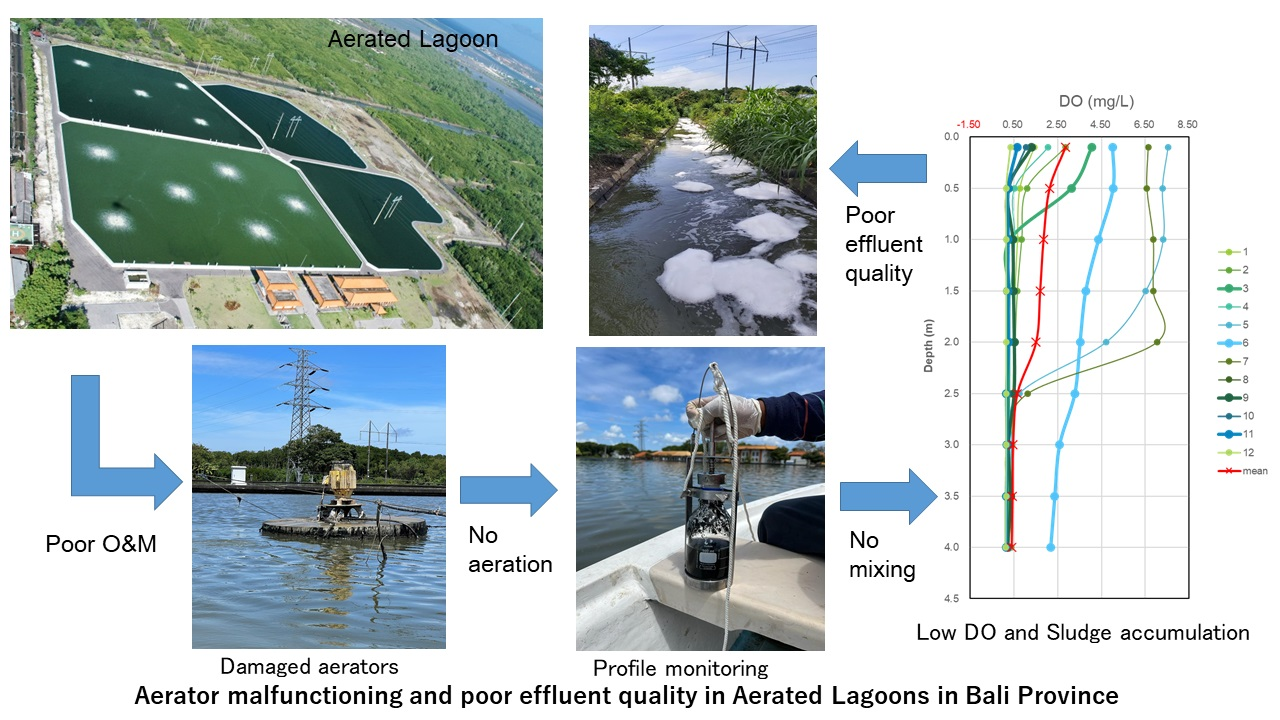
2.3.2. Lagoon Profile Monitoring

Profile monitoring was conducted at the Suwung and ITDC WWTPs to obtain the vertical water quality profiles of the lagoons. Specifically, 12 points in AL-1 and 9 points in AL-2 at the Suwung WWTP (Figure 2a), and 9 points in Cells 1B, 2B, and 3 at the ITDC WWTP (Figure 2b) were selected for profiling water quality at different depths from the surface to 4 m deep at 0.5 m intervals. A multi-parameter water quality checker (U-50; Horiba Advanced Techno, Co., Ltd., Kyoto, Japan) was used to measure several physicochemical parameters, including temperature, pH, oxidation-reduction potential (ORP), electrical conductivity (EC), turbidity, dissolved oxygen (DO), and TDS. The measurement was conducted by lowering the sensor probe to different depths from a boat. Each lagoon was monitored in the daytime between 10 am and 4 pm. In addition, the GPS coordinates of the monitoring positions were obtained using GPSMAP 64csx (Garmin Japan Co., Ltd., Saitama, Japan).

2.3.3. Monthly Inflow and Water Quality Data

The monthly inflow rate and water quality data of the Suwung and ITDC WWTPs were obtained from operators for the period from 2016 to 2021, except for COD data, which were available from 2018 to 2021. The water quality data used in this comparative study were limited to typical water quality parameters of WWTPs, such as BOD, COD, and TSS.

2.3.4. Rainfall Data

Rainfall data from 2016 to 2021 were obtained from the Statistics Indonesia portal (https://www.bps.go.id (accessed on 25 May 2023)) to determine the impact of the seasonal variation in rainfall on the quantity of WWTP influent wastewater. Moreover, the rainfall data were used to assess the association between rainfall and water demand for reclaimed water.

2.3.5. Acceptance and Potential Uses of Reclaimed Water

In order to assess willingness to use and demand for reclaimed water in Bali Province, a questionnaire survey was conducted in 6 hotels that were customers of the Suwung WWTP, and interviews were held with the Technical Implementation Unit of Provincial Wastewater Management in Bali. The hotel industry is a potential customer of reclaimed water in Bali Province due to their need for watering the gardens, as already implemented in the Nusa Dua area (Badung Regency).

2.4. Data Analysis

2.4.1. Statistical Analysis

Statistical analysis was performed using R (version 4.1.2) to compare the performance of the two WWTPs in terms of influent and effluent concentrations, as well as removal efficiency. The statistical test results were considered significant at p-values of less than 0.05. Pearson correlation analysis was also used to investigate the correlations among different parameters of the WWTPs.

2.4.2. Tourism Water Demand

The tourism water demand of each hotel was calculated based on hotel classifications using the following equation:
T w   =   T w r   ×   OR   ×   R
where
Tw = tourism water demand (m3/y);
Twr = tourism water use per room [49];
4–5-star hotel = 1424 m3/room/y;
1–3-star hotel = 949 m3/room/y;
0-star hotel = 548 m3/room/y;
OR = average occupancy rate in a year;
R = number of hotel rooms.
Data on occupancy rate and number of hotel rooms were obtained from the Statistics Indonesia portal (https://www.bps.go.id (accessed on 15 May 2023)).

2.4.3. Oxygen Demand in Aerated Lagoons

To determine the number of aerators necessary for the aerated lagoons, the oxygen demand was calculated using the following equation [50]:
OD = a   ×   Q   ×   S o S 1000
where
OD = oxygen demand (kgO2/d);
a = coefficient of oxygen consumption (1.1 to 1.4 kgO2/kg-BOD5 removed);
Q = influent flow (m3/d);
So = influent total BOD (g/m3);
S = effluent total BOD (g/m3);
1000 = conversion factor from kg to g (g/kg).
It is recommended to use high-speed floating mechanical aerators, which have an oxygenation efficiency (OE) of
OE = 1.8 kgO2/kWh
Assuming the oxygenation efficiency of aerators used in the field to be approximately 60% of the standard OE, OEfield was estimated using Equation (4) [50].
OEfield = 0.6 × 1.8 kgO2/kWh = 1.1 kgO2/kWh
The required daily electric power (kWh/d) is
P = OD OE field  
Thus, the number of aerators required can be determined by dividing the required power by the power per aerator.

3. Results

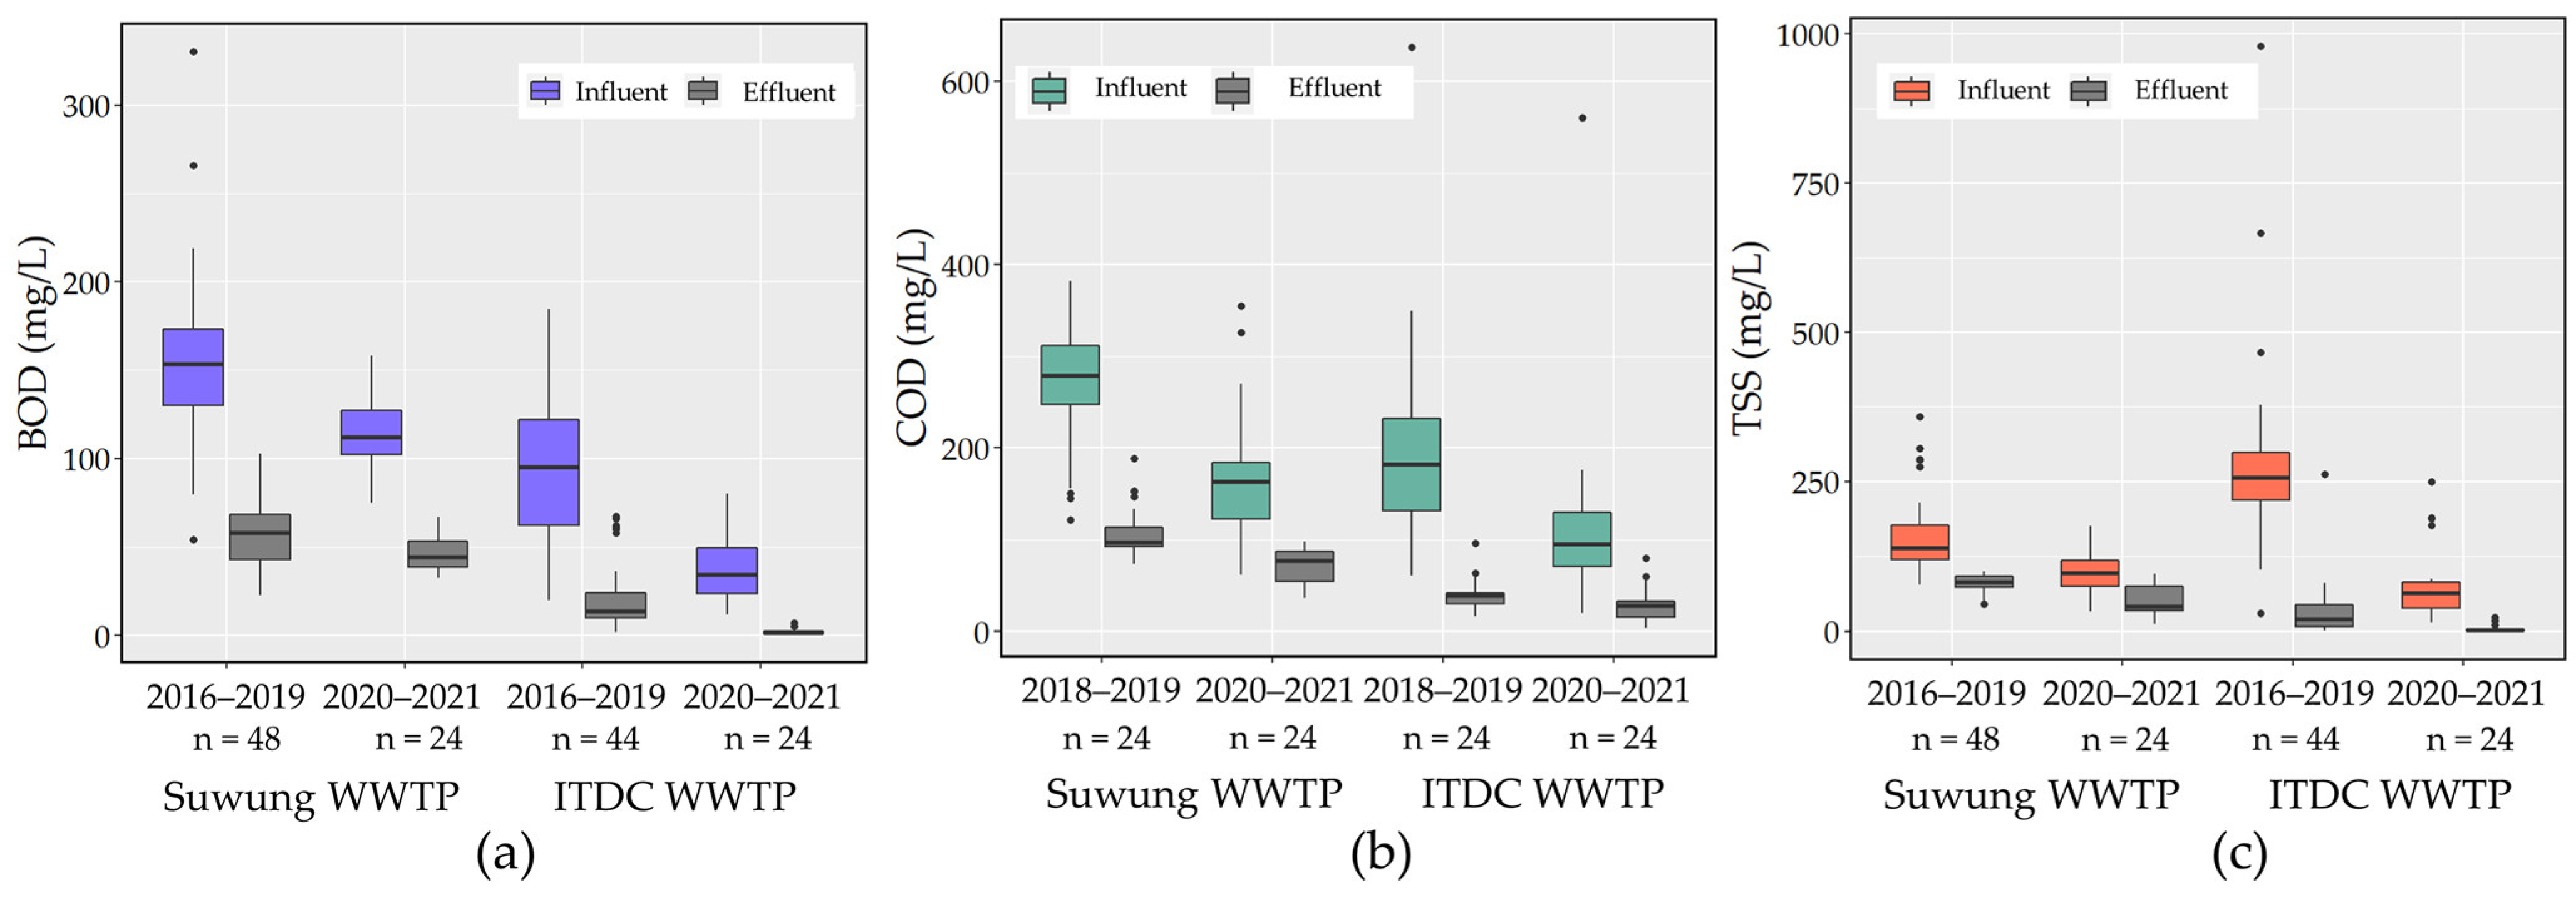
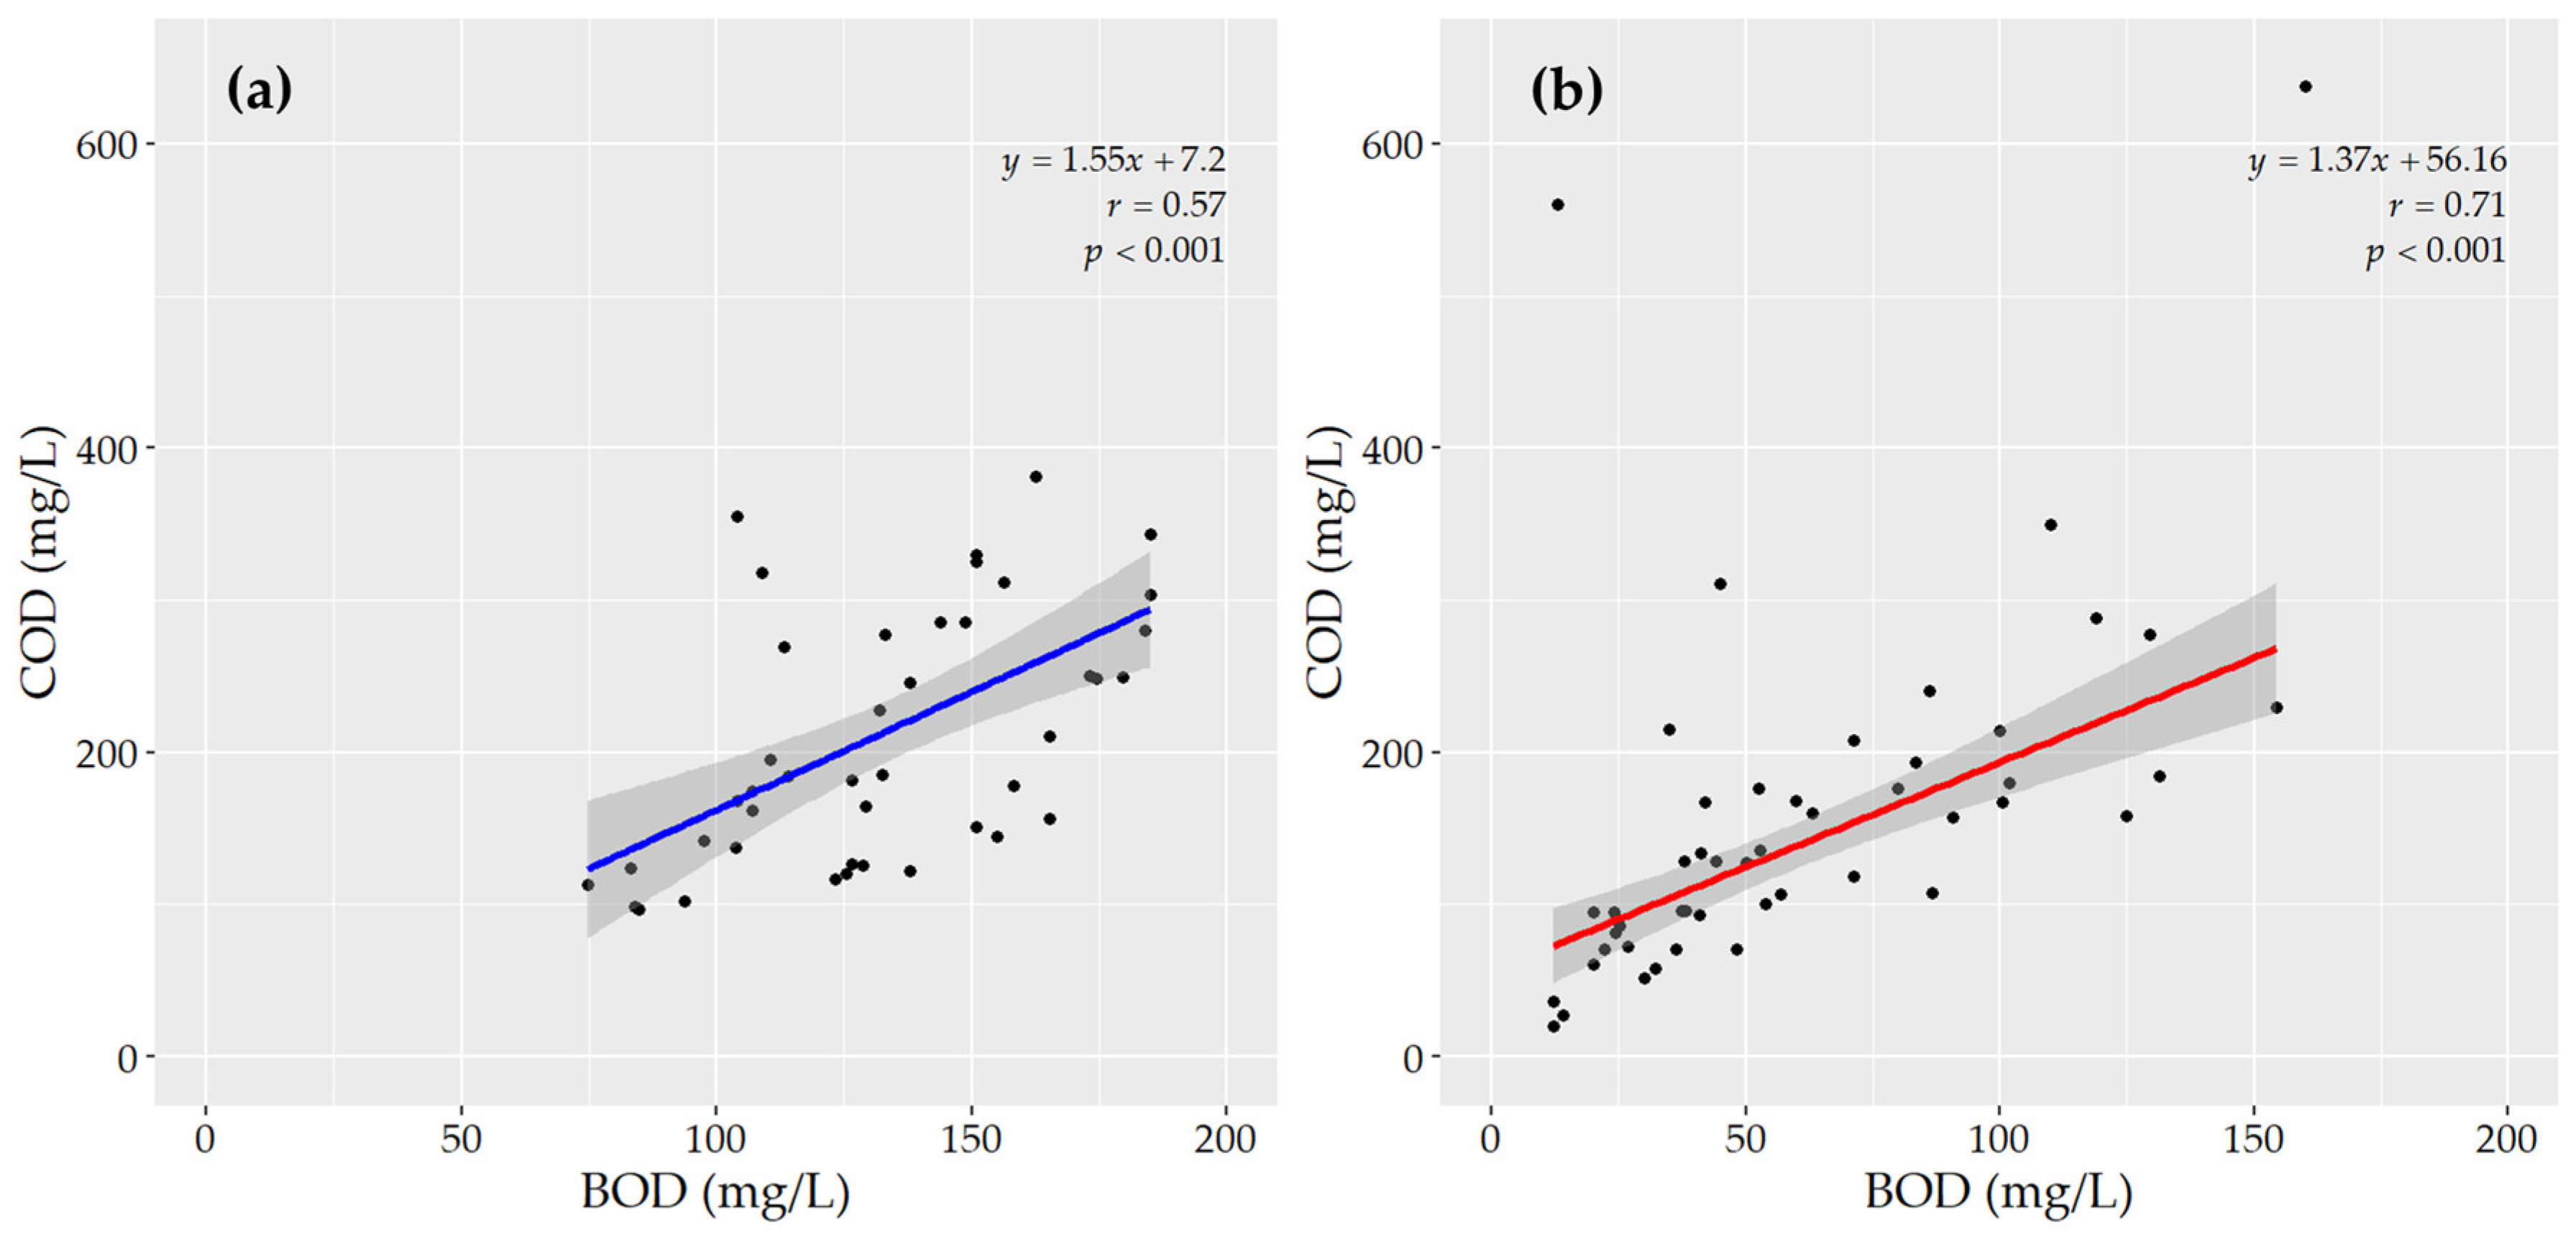
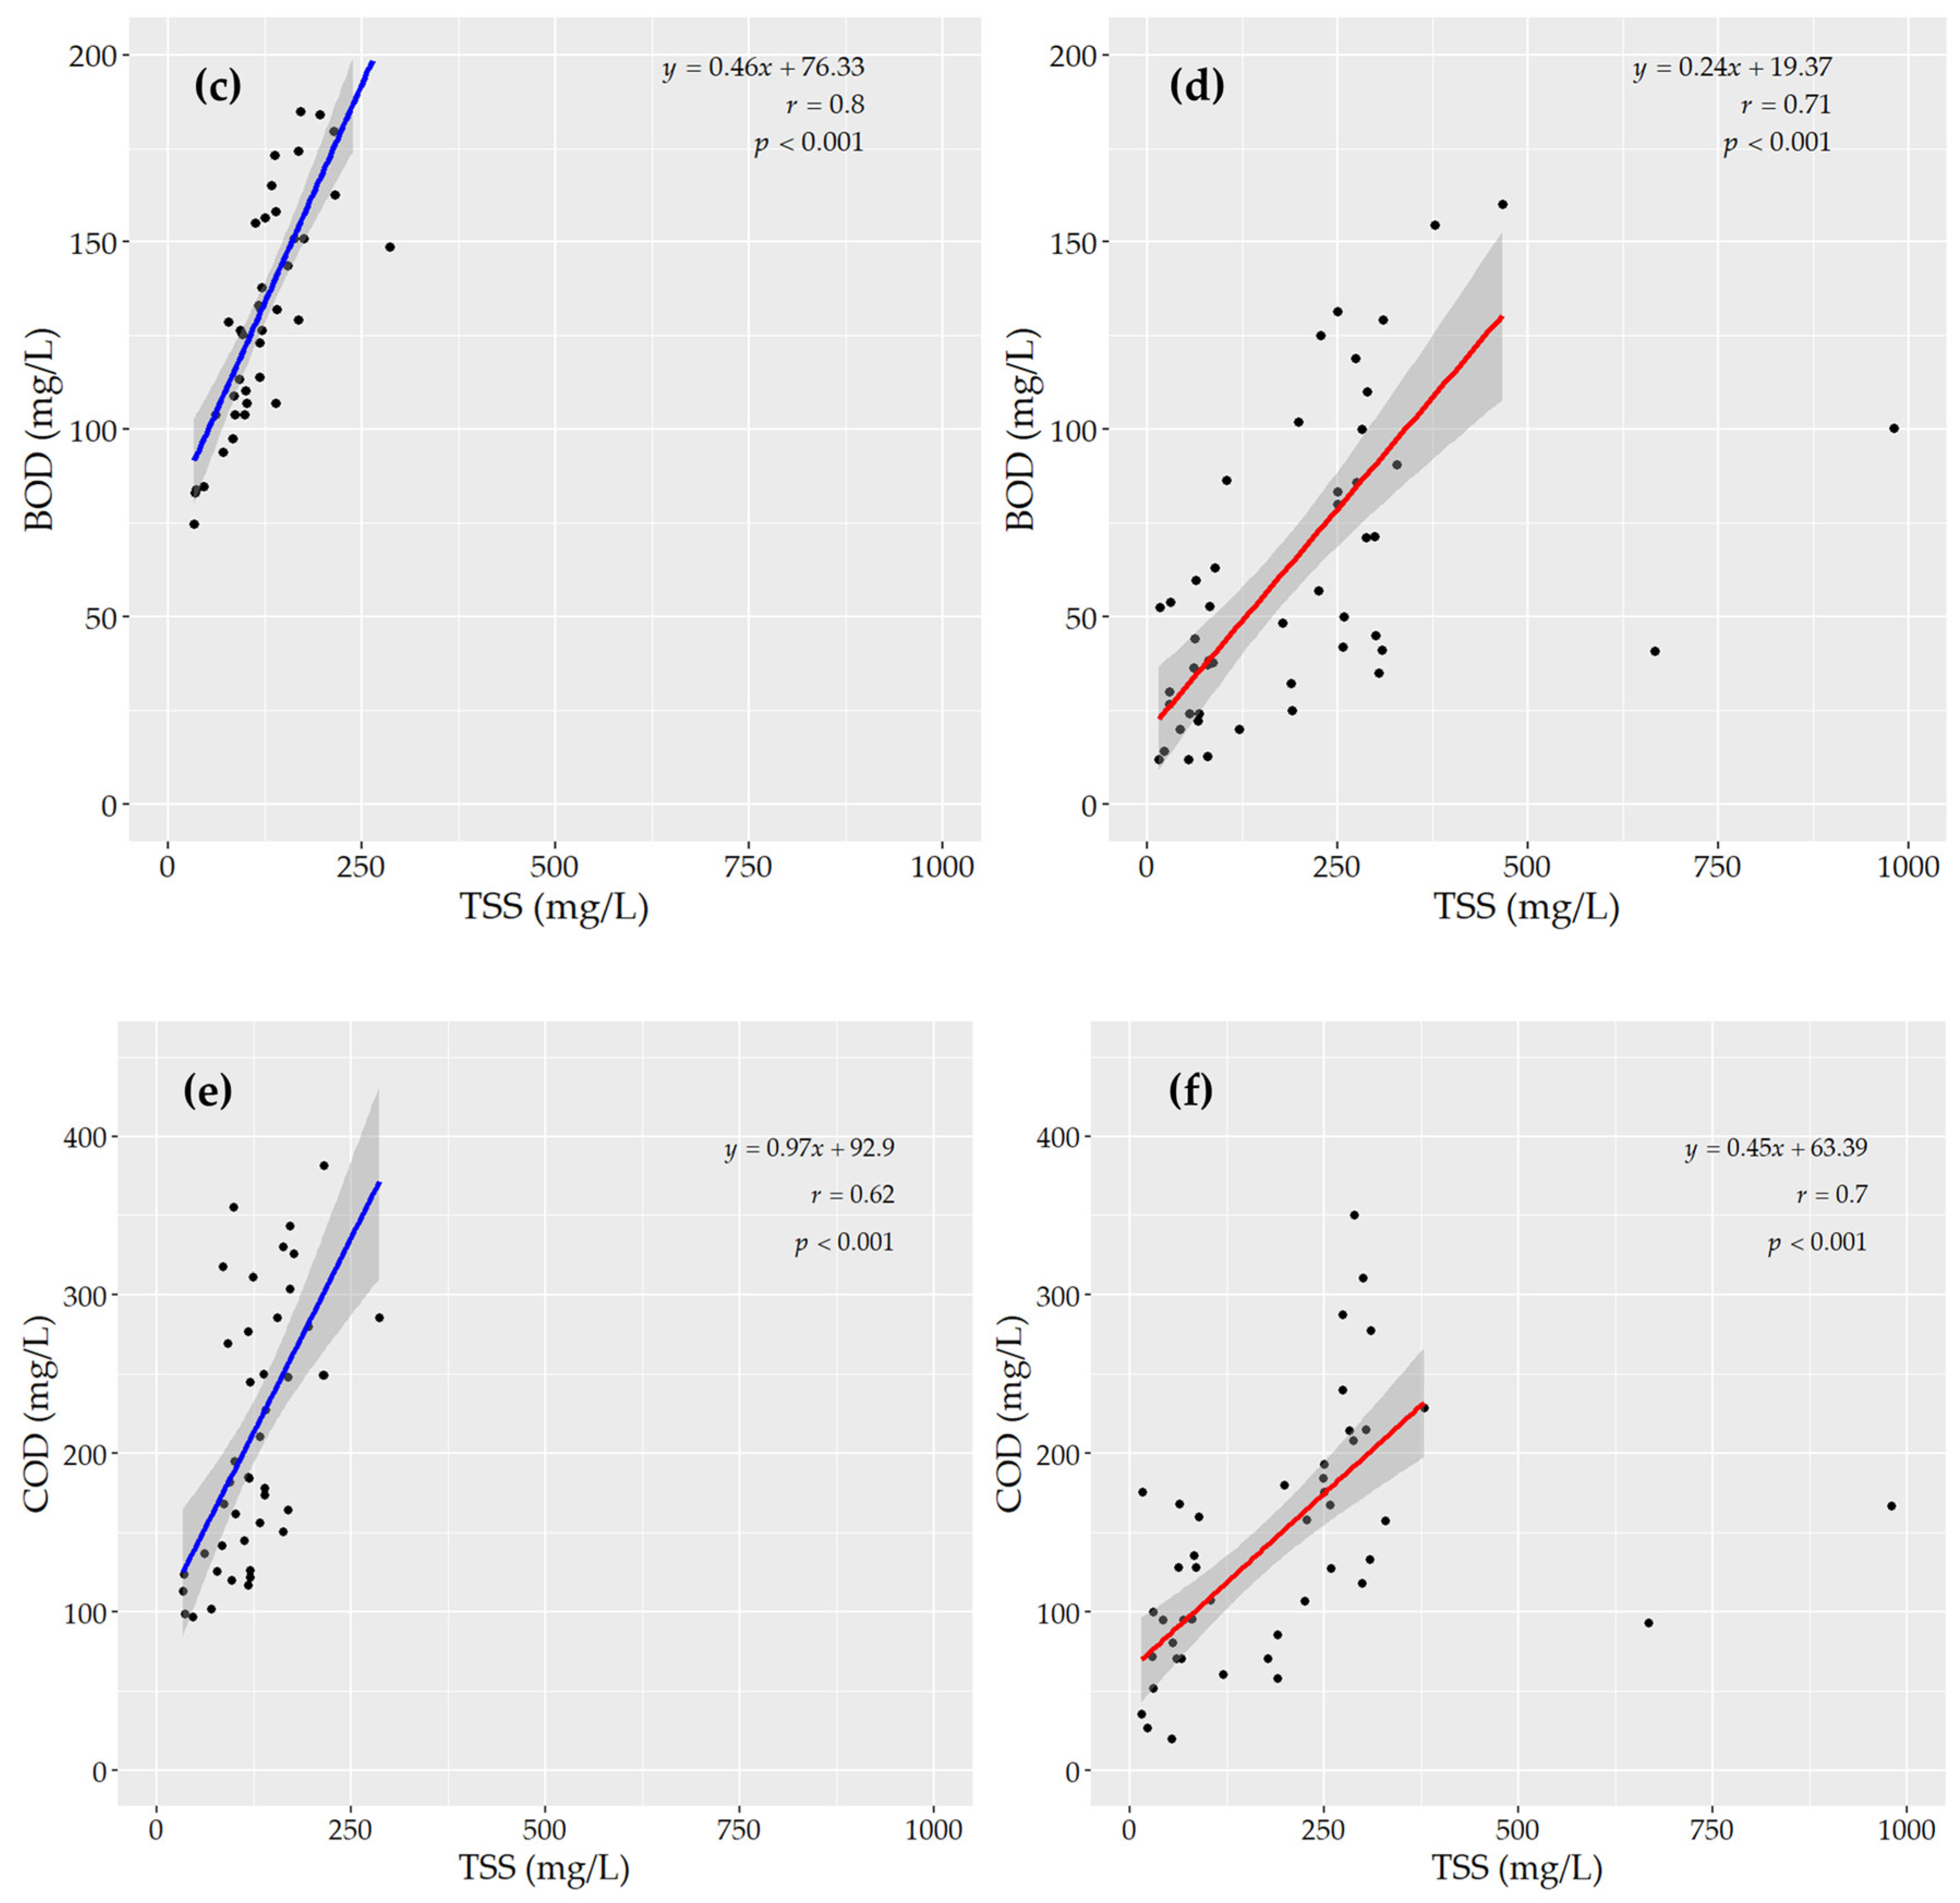
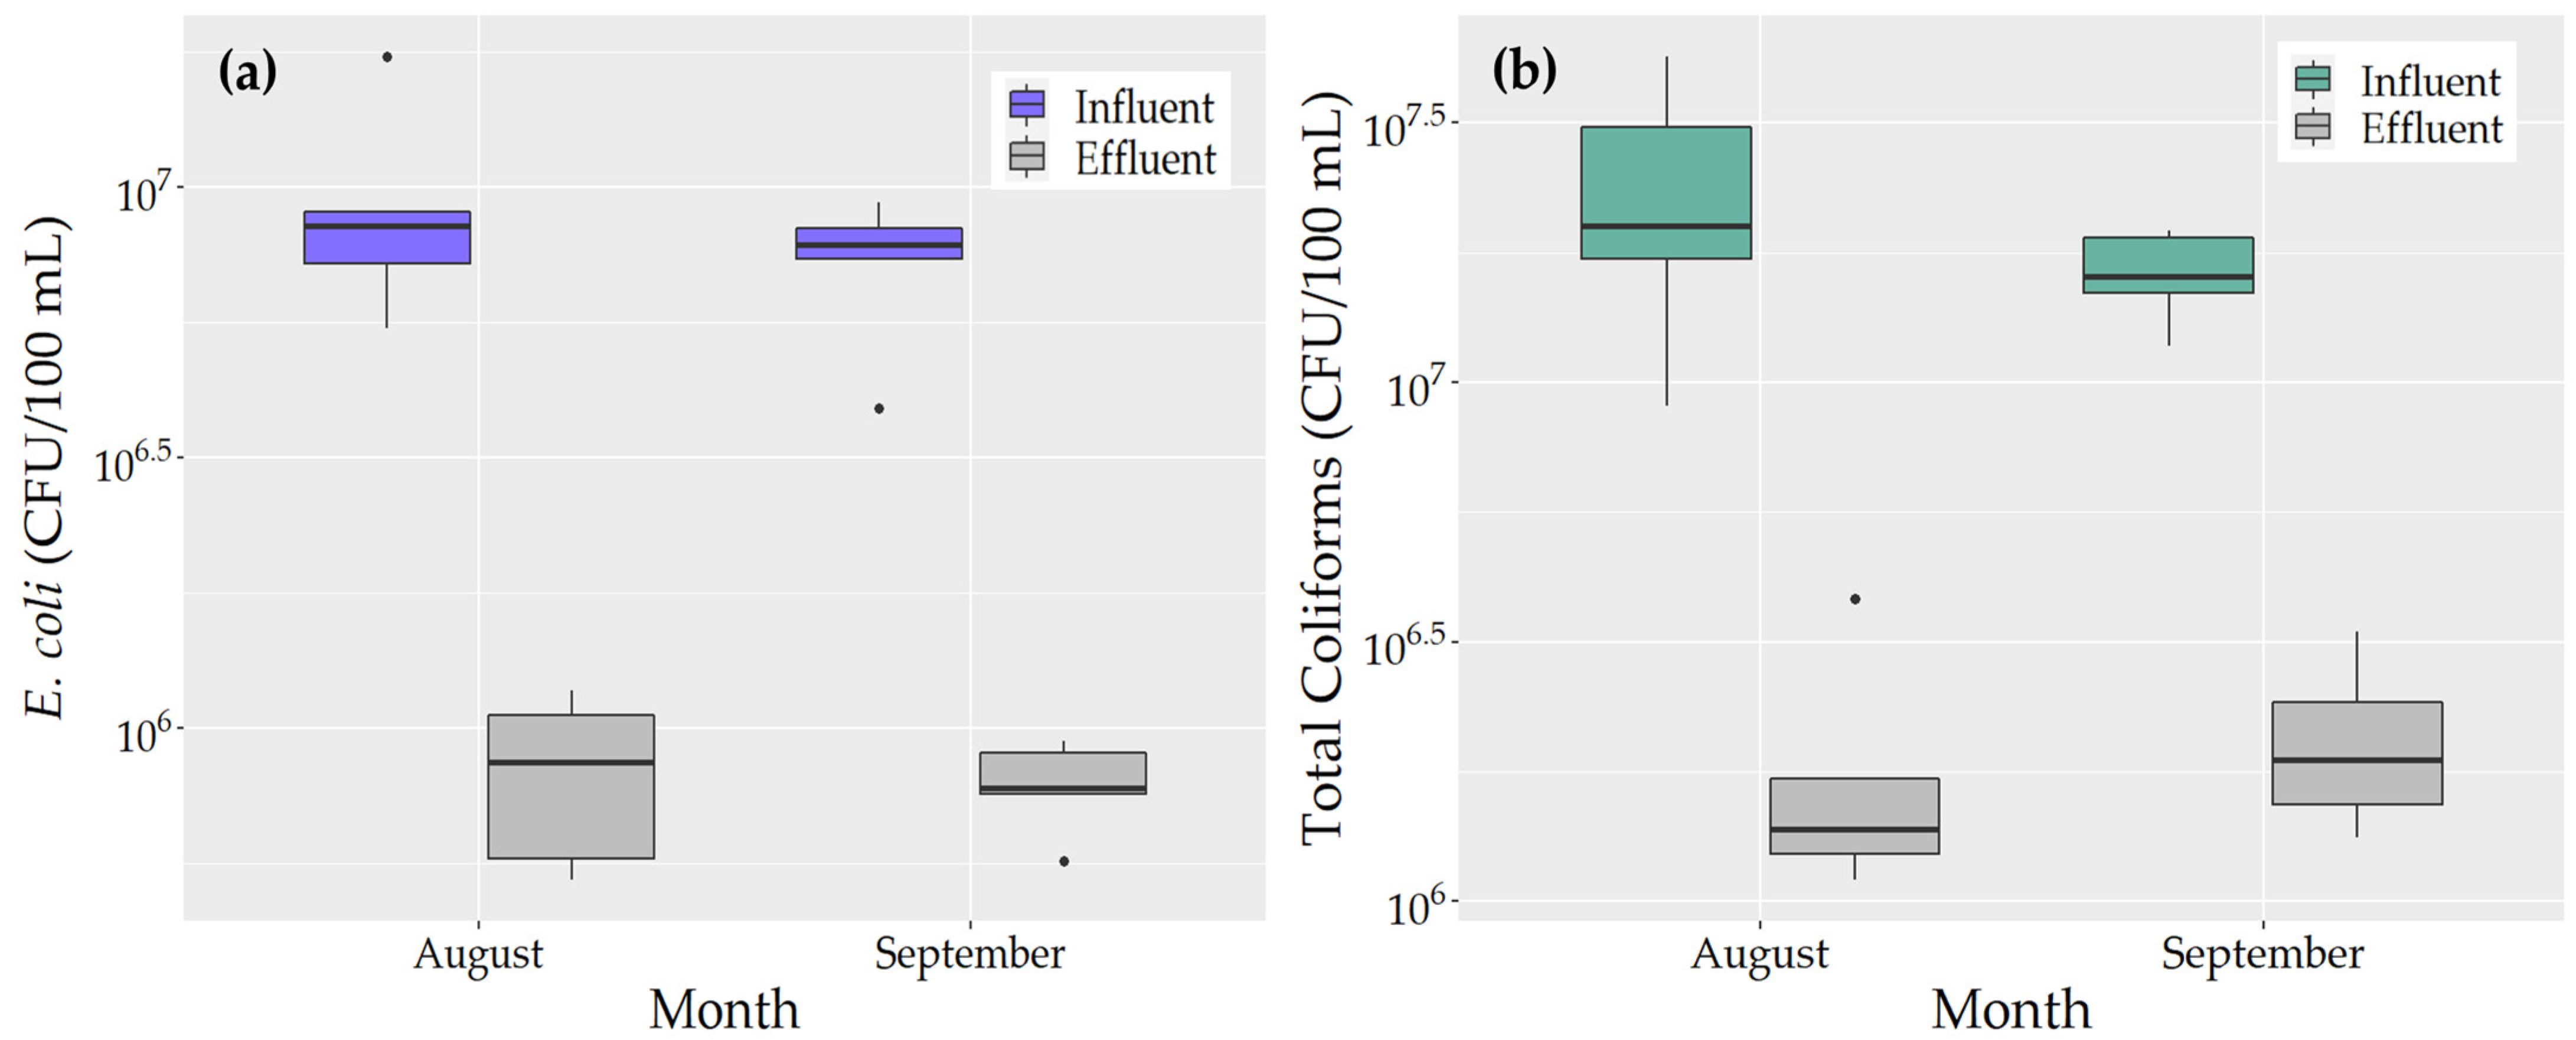
3.1. Wastewater Quality

Figure 4a illustrates the influent and effluent BOD values of the Suwung and ITDC WWTPs in 2016–2021. The Suwung WWTP had an average influent BOD of 153.2 mg/L in 2016–2019, which decreased to 113.1 mg/L during the COVID-19 period (2020–2021). Meanwhile, the corresponding values of the ITDC WWTP were 93.9 mg/L and 35.9 mg/L, respectively. The ITDC WWTP had a lower influent BOD than the Suwung WWTP. However, in both WWTPs, the influent BOD decreased during the COVID-19 period, with decreases of approximately 26.2% in the Suwung WWTP and 61.8% in the ITDC WWTP. Because of the high influent BOD, the average effluent BOD values were higher in the Suwung WWTP (56.4 mg/L in 2016–2019 and 46.6 mg/L in 2020–2021) than in the ITDC WWTP (20.2 mg/L in 2016–2019 and 2.2 mg/L in 2020–2021).
Figure 4b shows the influent and effluent COD values of the Suwung and ITDC WWTPs in 2018–2021. The average influent COD of the Suwung WWTP was 266.5 mg/L in 2018–2019, which decreased to 168.3 mg/L in 2020–2021, while the average effluent COD concentration decreased from 108.4 mg/L in 2018–2019 to 72.7 mg/L in 2020–2021. In the ITDC WWTP, the average influent COD was 205.4 mg/L in 2018–2019, which decreased to 115.0 mg/L in 2020–2021, while the average effluent COD decreased from 39.9 mg/L in 2018–2019 to 28.1 mg/L in 2020–2021. Similarly to BOD, the influent and effluent COD values were higher in the Suwung WWTP than in the ITDC WWTP, and in both WWTPs, COD decreased during the COVID-19 pandemic.
In contrast to BOD and COD, the average influent TSS value (Figure 4c) of the ITDC WWTP was higher than that of the Suwung WWTP in 2016–2019, where the values were 271.3 mg/L and 159.7 mg/L, respectively. However, during the COVID-19 period (2020–2021), the average influent TSS concentration in the ITDC WWTP decreased to 79.4 mg/L, whereas this parameter decreased to 97.3 mg/L in the Suwung WWTP. Despite these differences in influent TSS, the average effluent TSS values of the ITDC WWTP, 33.1 mg/L (2016–2019) and 4.6 mg/L (2020–2021), were lower than those of the Suwung WWTP, 80.8 mg/L (2016–2019) and 49.9 mg/L (2020–2021), owing to TSS removal using DAF.
The difference in the influent water quality of the Suwung WWTP indicates that the measures taken to prevent the spread of COVID-19 increased water consumption [51], which diluted pollutants in wastewater [52]. Conversely, in the ITDC WWTP, the inflow rates decreased during the COVID-19 pandemic due to the reduced operation or temporary closures of hotels in its service area, which may have contributed to variations in influent characteristics [52].
Figure 5 shows the relationships among different water quality parameters of the influents of the Suwung and ITDC WWTPs. Figure 5a shows that BOD was linearly correlated with COD in the Suwung WWTP (Pearson correlation analysis, r = 0.57, p < 0.001). Similarly, in the ITDC WWTP (Figure 5b), the influent BOD was correlated with COD (r = 0.71, p < 0.001). The greater slope of the regression line for the Suwung WWTP compared with that for the ITDC WWTP indicates that the COD of the Suwung WWTP contained less biodegradable organic matter than that of the ITDC WWTP. The greater intercept of the regression lines indicated that the ITDC WWTP had more non-biodegradable COD components (56.2 mg/L) than the Suwung WWTP (7.2 mg/L).
Figure 5c,d shows the relationship between the influent BOD and TSS of the Suwung and ITDC WWTPs, respectively. In both WWTPs, the influent TSS was significantly correlated with the BOD (r = 0.80, p < 0.001; r = 0.71, p < 0.001, respectively). From the intercepts of the regression lines, it was estimated that the Suwung WWTP had a higher concentration of dissolved or soluble BOD, around 76.3 mg/L, while the ITDC WWTP had a lower concentration of soluble BOD than the Suwung WWTP, measuring 19.4 mg/L.
Figure 5e,f shows a significant linear correlation between COD and TSS (r = 0.62, p < 0.001; r = 0.70, p < 0.001, respectively). From the intercepts of the regression lines, the dissolved components of COD in the influents of the Suwung WWTP were higher than those in the influents of the ITDC WWTP.

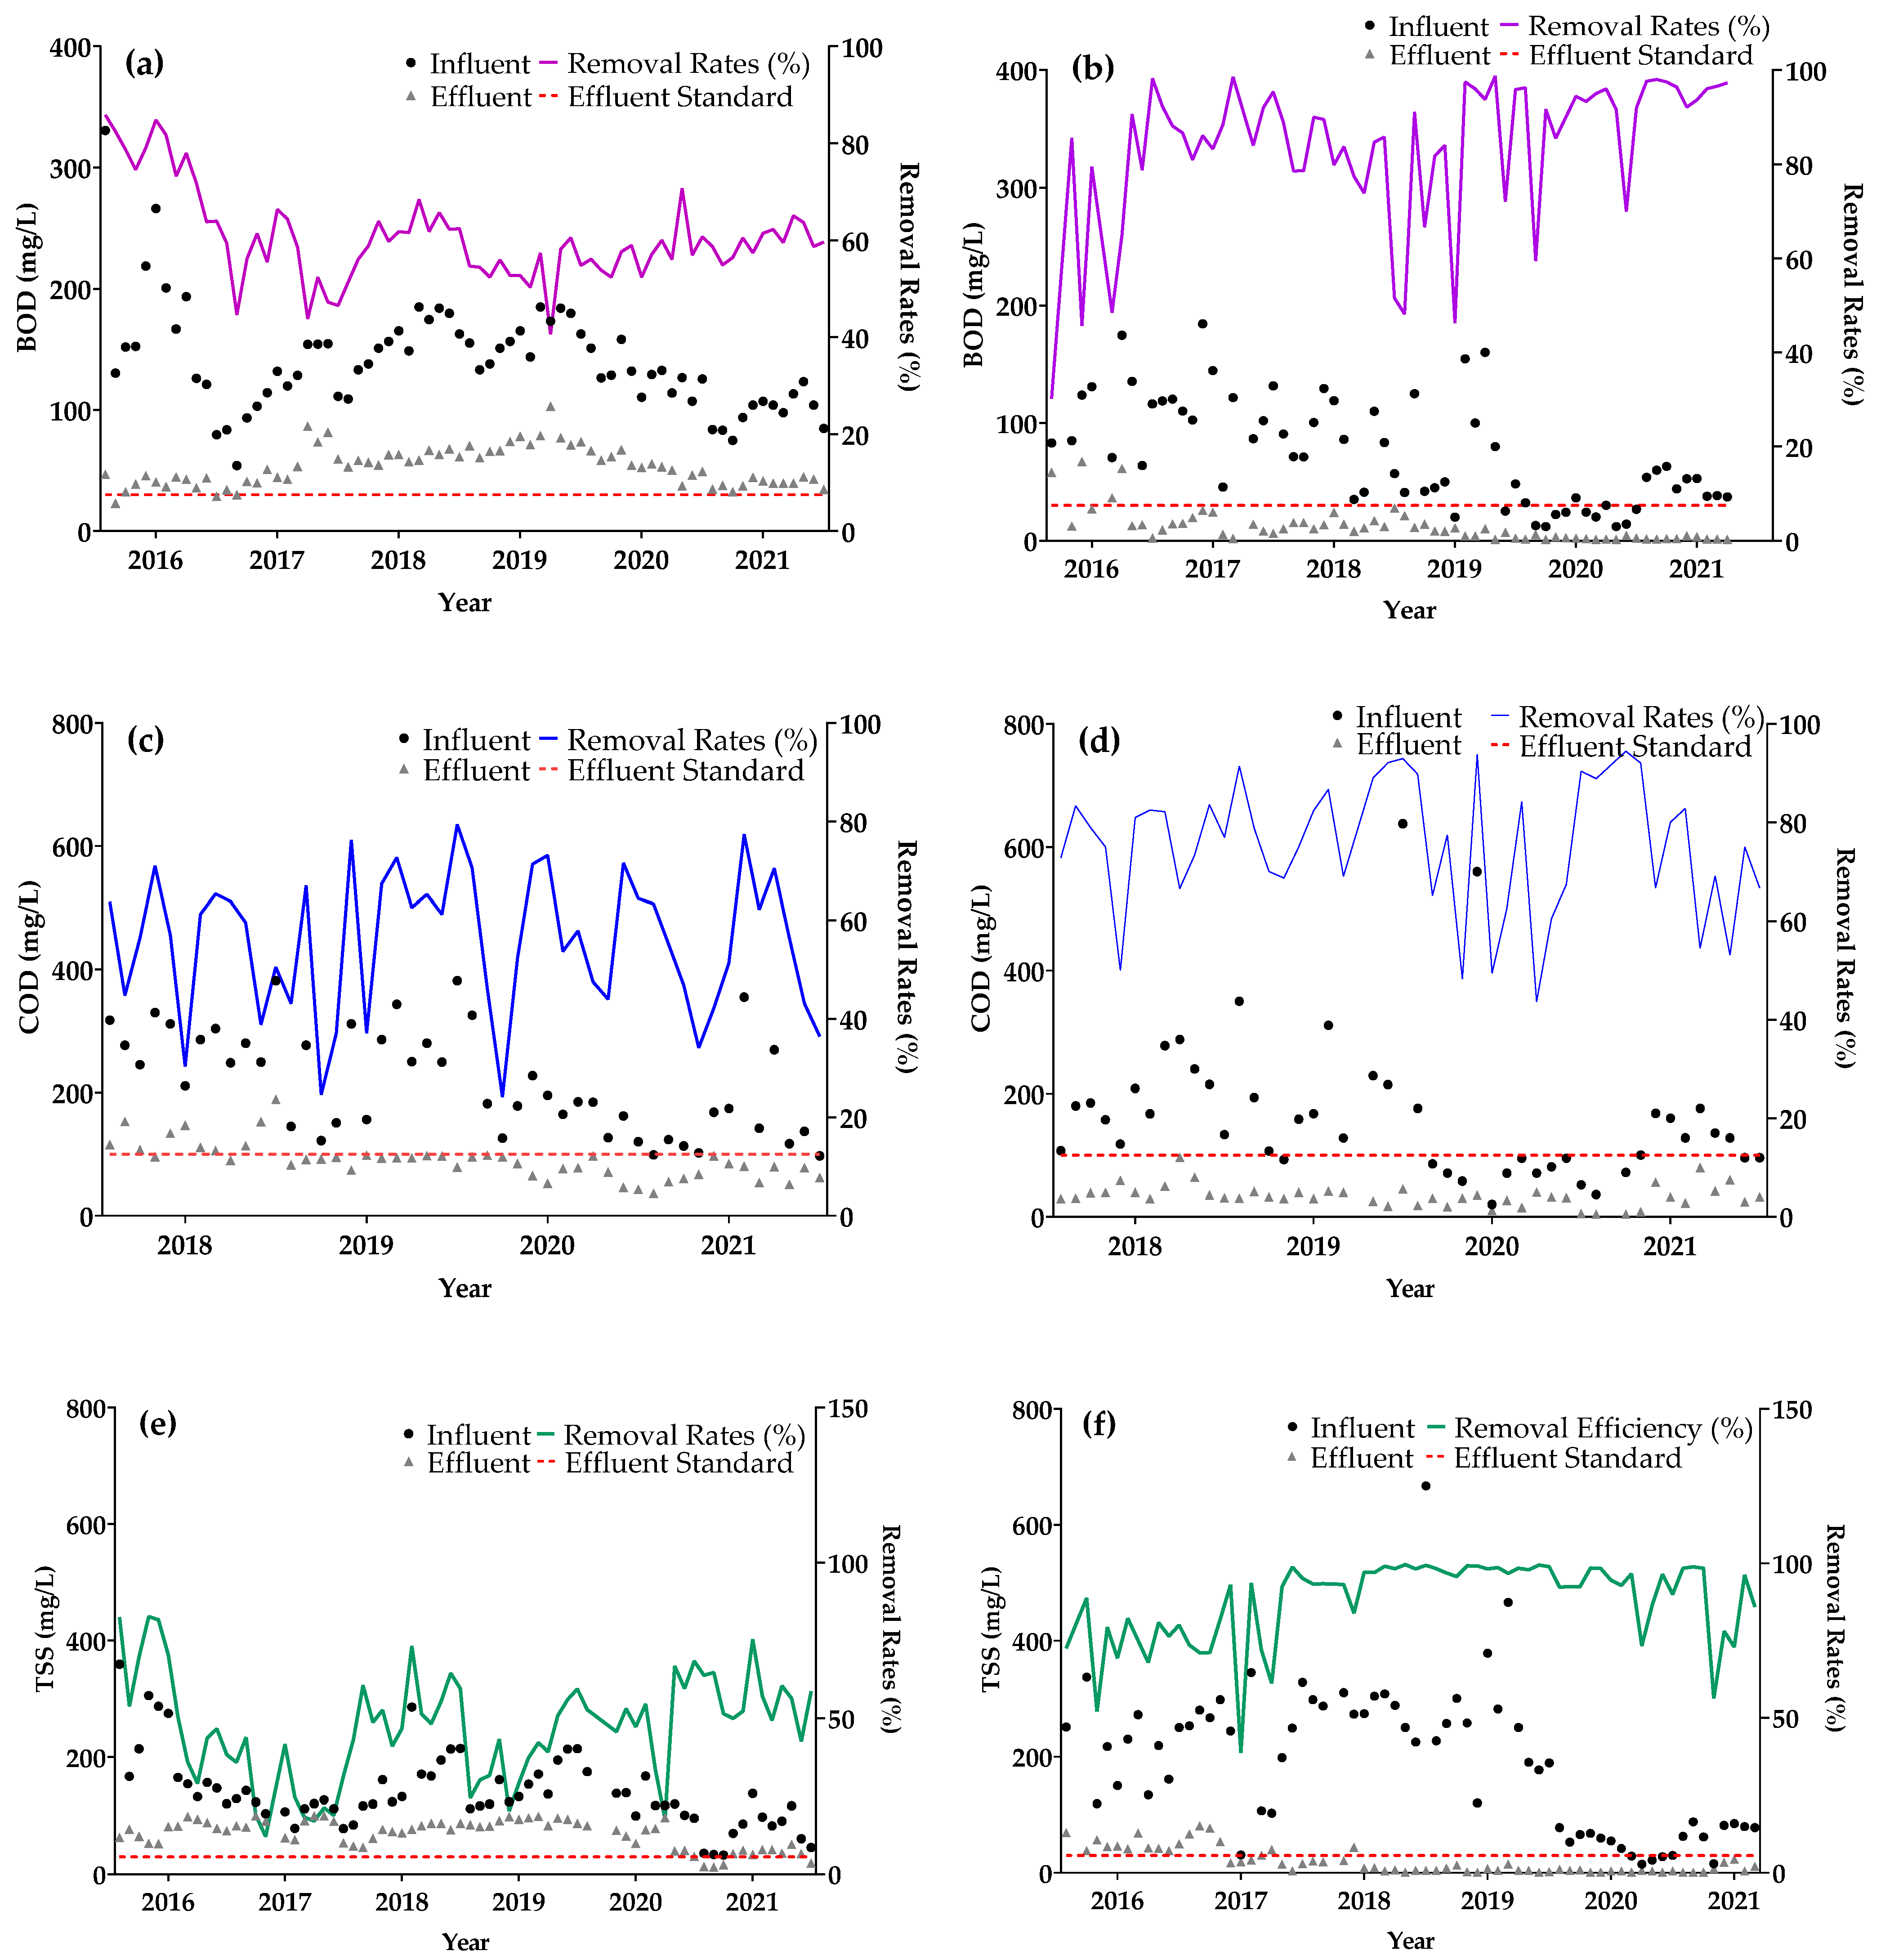
3.2. Performance of the WWTPs

3.2.1. Comparison of BOD, COD, and TSS Removal Rates

Figure 6 shows BOD, COD, and TSS concentrations in the influents and effluents of the Suwung and ITDC WWTPs, as well as the removal rates (%). The BOD removal rate of the Suwung WWTP (Figure 6a) ranged from 40.6 to 85.8%, with a mean removal rate of 60.6%. In contrast, the BOD removal rate of the ITDC WWTP varied from 30.1 to 98.7% (Figure 6b), with a mean removal rate of 83.9%. It was found that the ITDC WWTP had higher BOD removal rates than the Suwung WWTP. Additionally, the effluent BOD of the Suwung WWTP failed to meet both the effluent standard (≤30 mg/L) and the irrigation standard (≤12 mg/L), while the effluents of the ITDC WWTP met these standards. The deterioration in the BOD effluent concentration of the Suwung WWTP in 2016–2017 was attributed to maintenance issues and equipment failure, whereas the improvement of the ITDC WWTP after 2018 was achieved with the installation and use of DAF equipment.
The COD removal rates of the Suwung WWTP (Figure 6c) ranged from 24.1 to 79.4%, with a mean removal rate of 55.6%. Conversely, the COD removal rates of the ITDC WWTP (Figure 6d) varied from 43.7 to 94.4%, with a mean removal rate of 75.2%, which was higher than that of the Suwung WWTP. Despite this, the effluent COD concentration of the Suwung WWTP has been meeting the effluent standard (≤100 mg/L) since mid-2018, but in some cases, it did not meet the irrigation standard (≤80 mg/L).
The TSS removal rates of the Suwung WWTP (Figure 6e) ranged from 12.1 to 82.7%, with a mean removal rate of 47.3%. On the other hand, the TSS removal rates of the ITDC WWTP (Figure 6f) varied from 38.7 to 99.6%, with a mean removal rate of 87.6%. These results indicate that the Suwung WWTP failed to effectively remove TSS and, thus, could not meet the TSS effluent standard (≤30 mg/L). However, it complied with the irrigation standard (≤400 mg/L). In contrast, the ITDC WWTP could more effectively remove TSS, particularly since DAF equipment was installed in 2018.

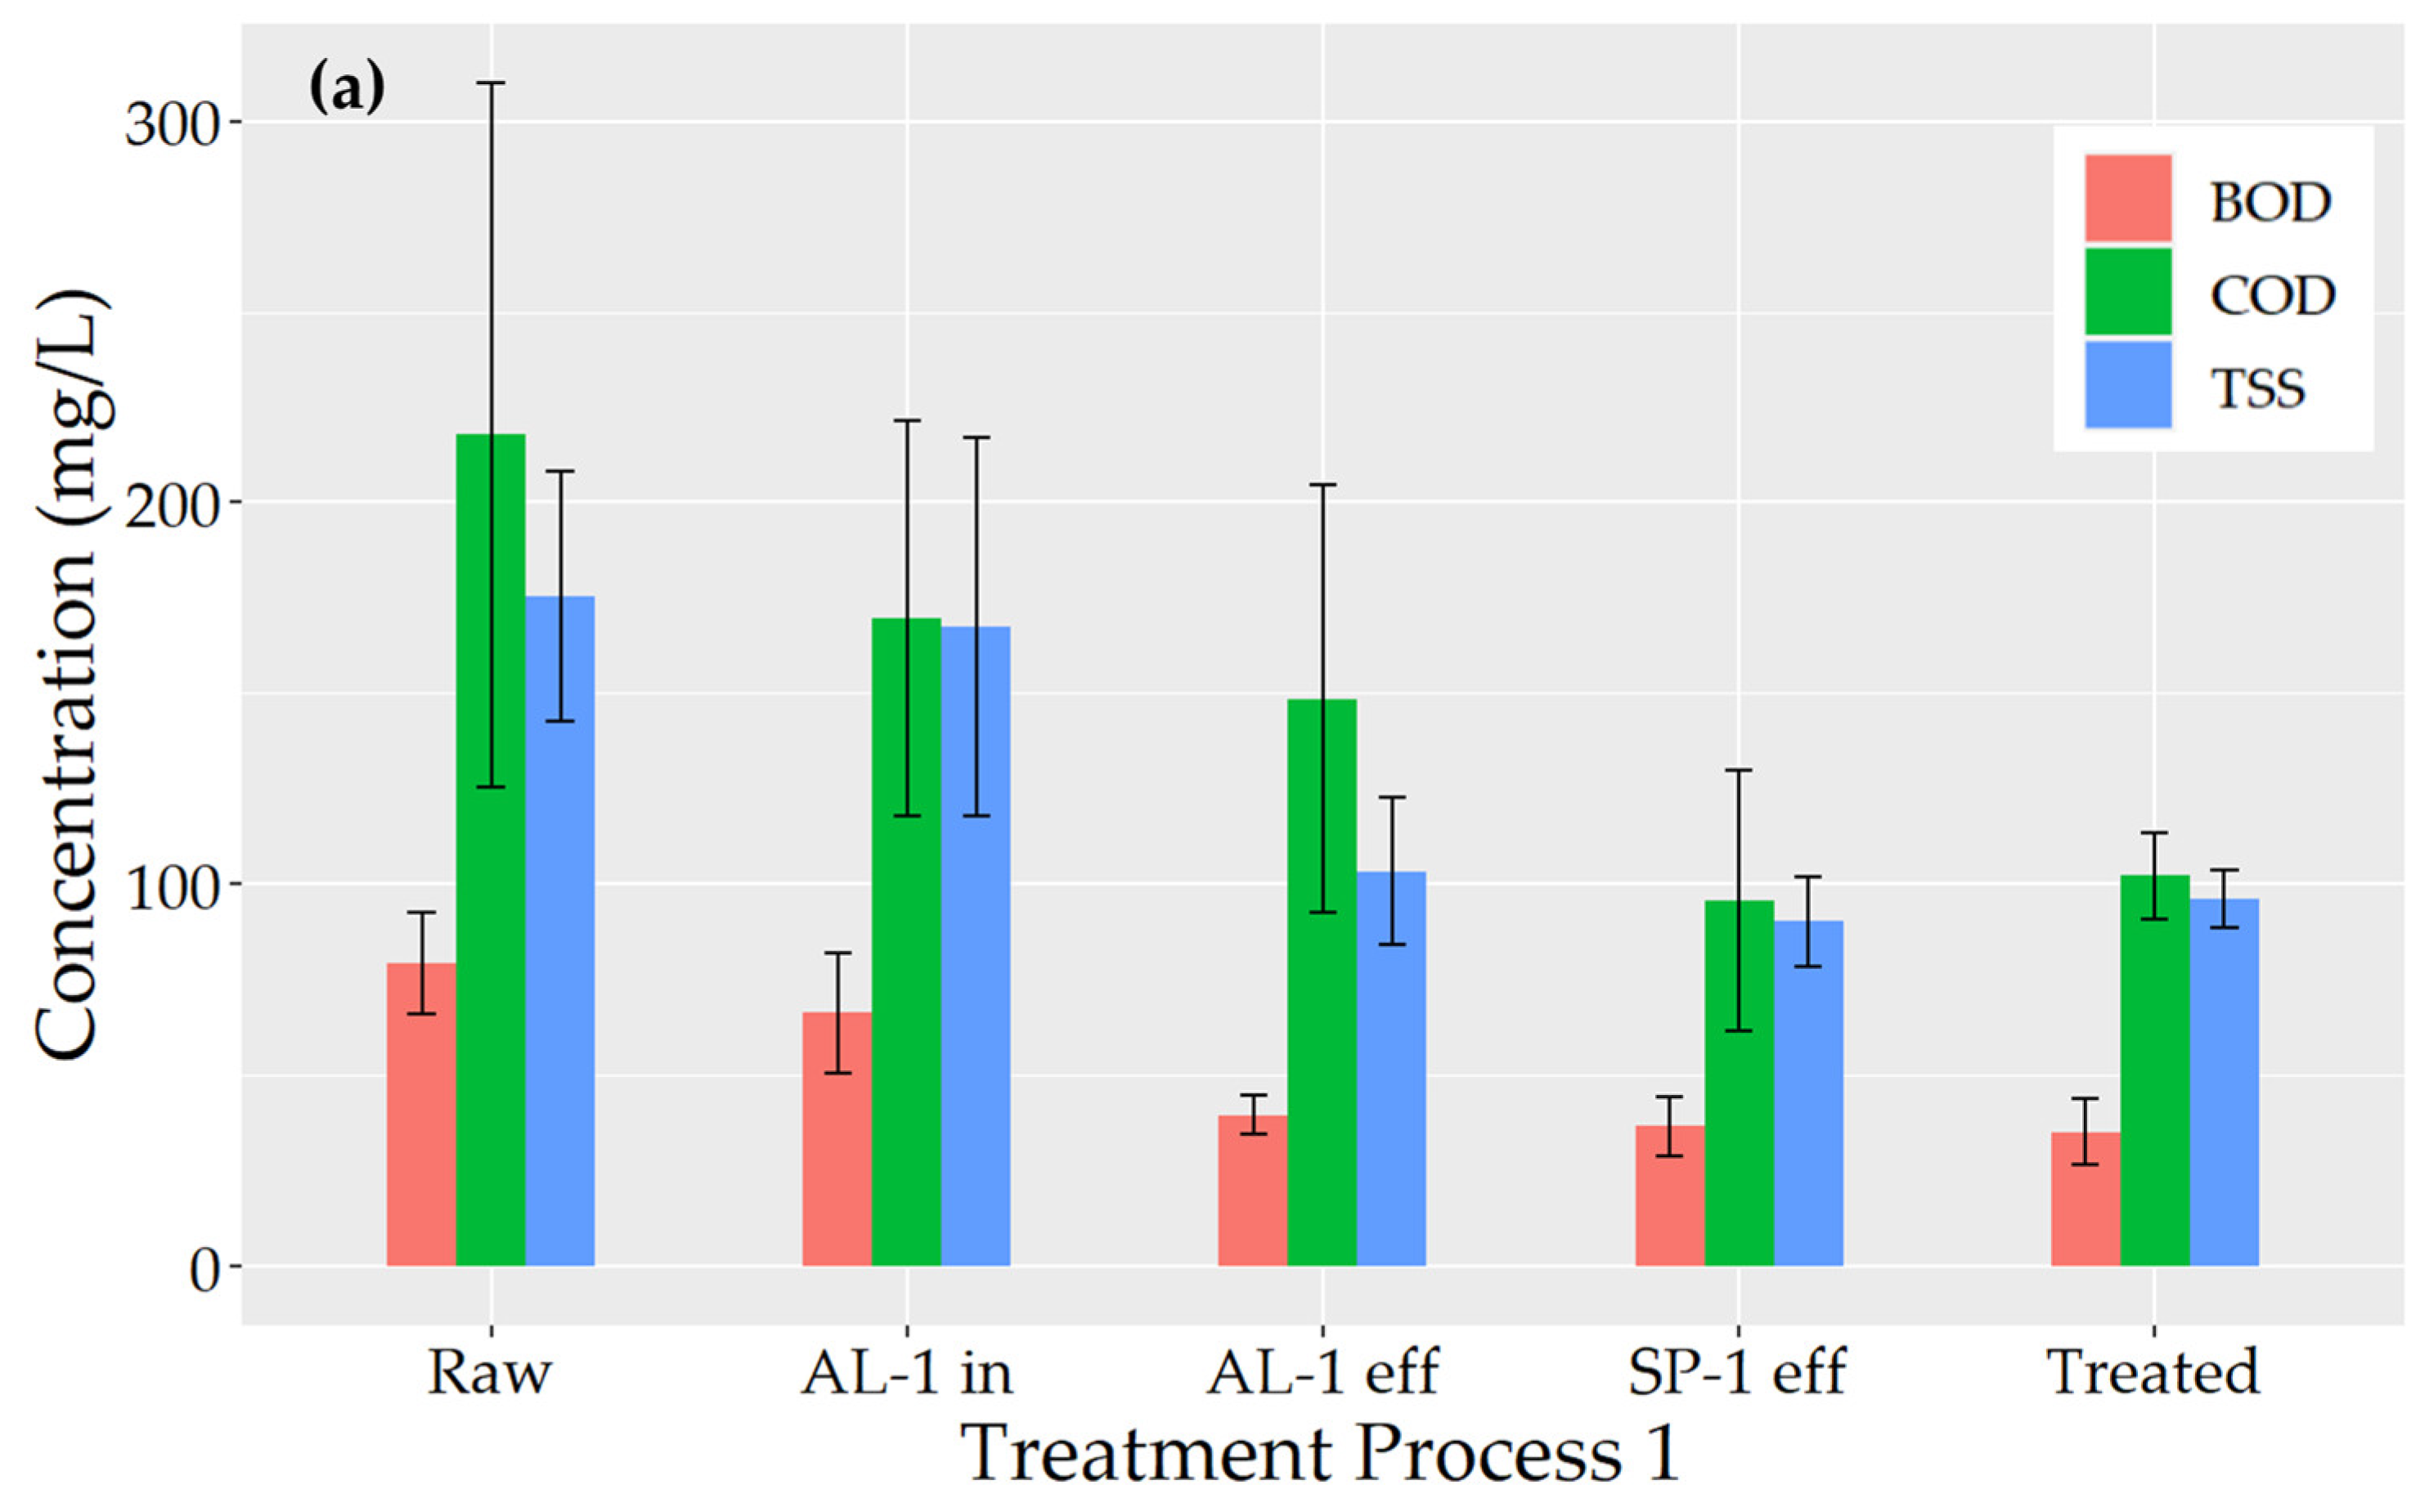
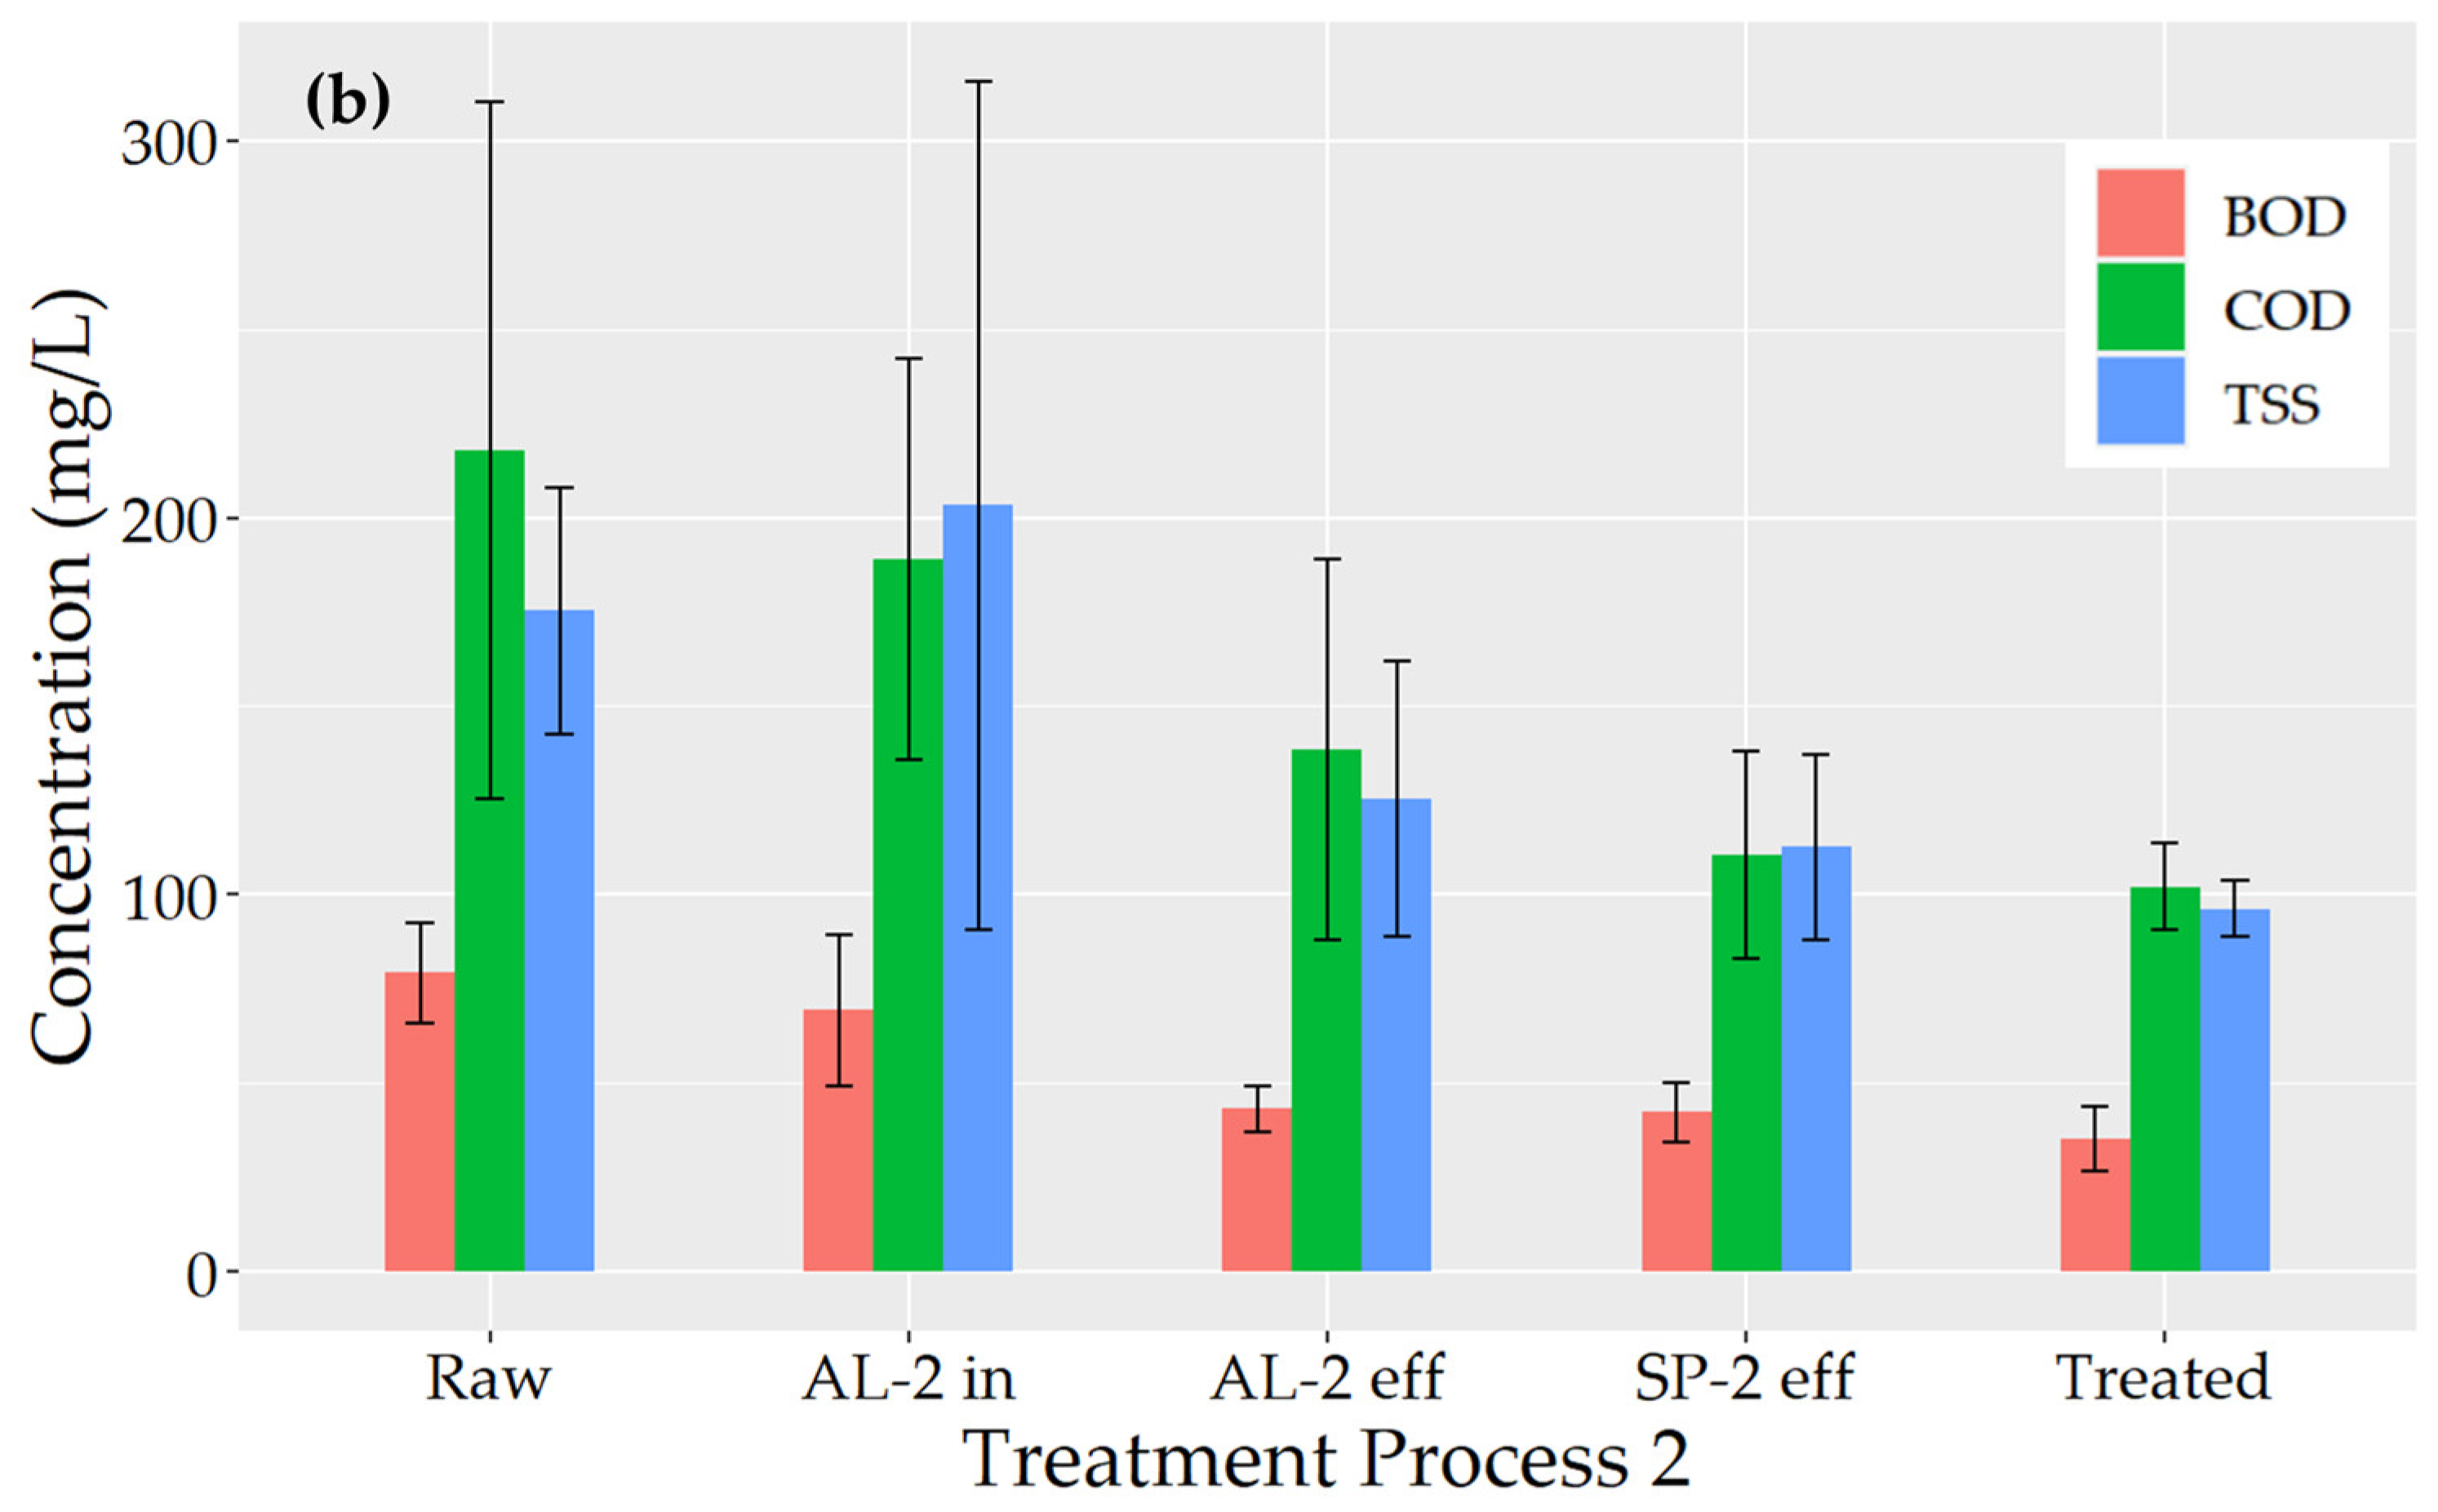
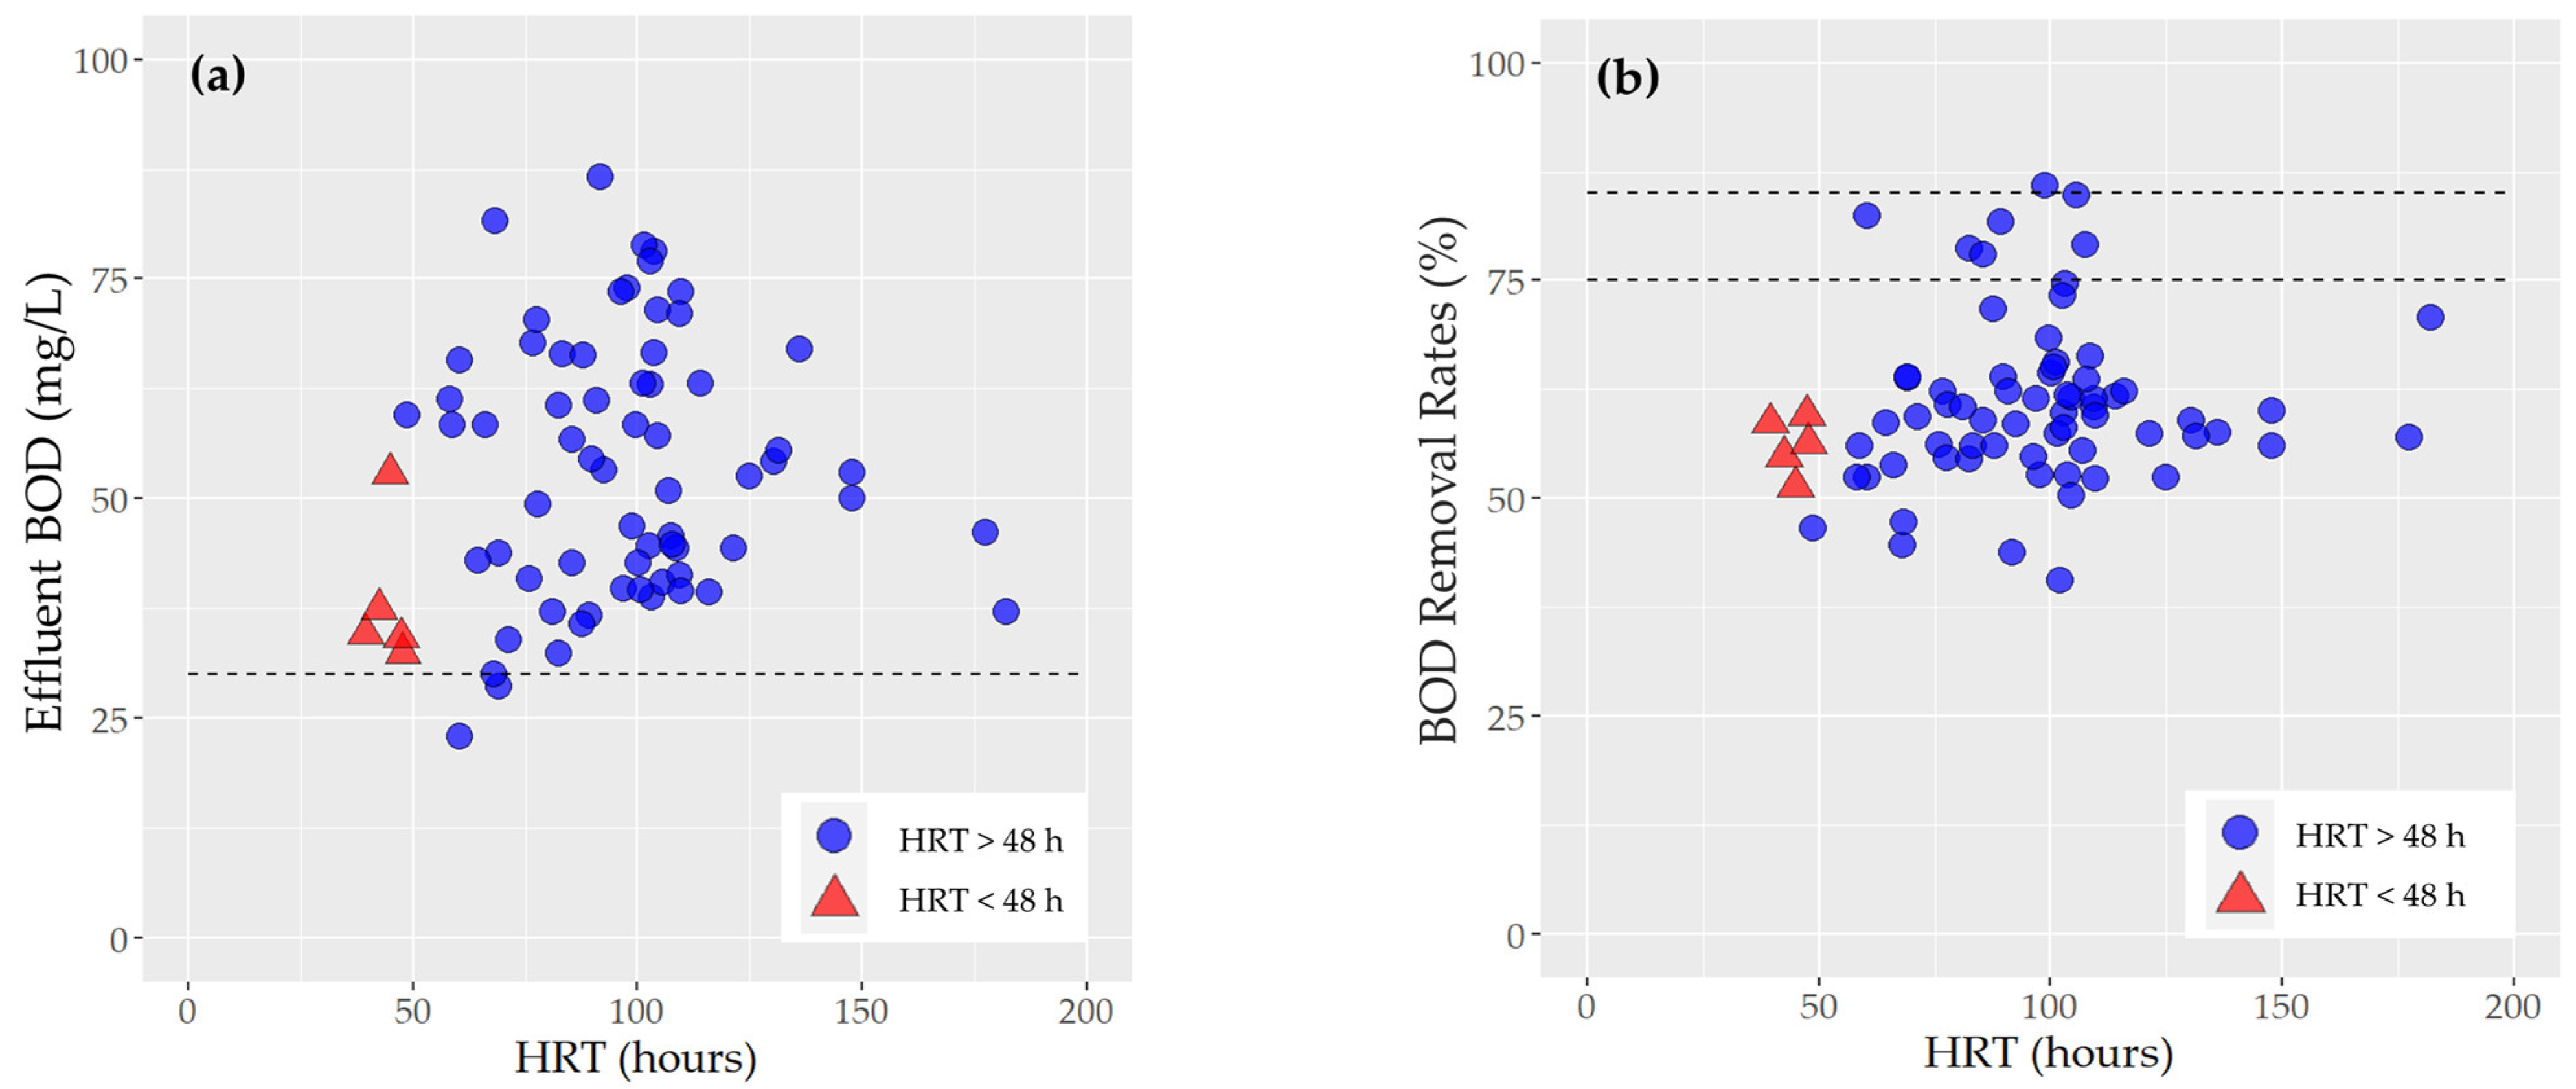
3.2.2. Performance Evaluation of Suwung WWTP Treatment Process

The data presented in this section were collected during a field survey in August– September 2022. Figure 7 compares BOD, COD, and TSS in each step of the two parallel treatment processes of the Suwung WWTP. Overall, BOD decreased from 79.2 mg/L to 35.1 mg/L, indicating a removal rate of 55.7%. The BOD removal rates of AL-1 and AL-2 were almost comparable, at 40.3% and 37.5%, respectively. Overall, COD decreased from 217.9 mg/L to 102.1 mg/L, resulting in a removal rate of approximately 53.1%. The COD removal rates of AL-1 and AL-2 were only 12.5% and 26.6%, respectively, which were significantly lower than the BOD removal rates because COD contains non-biodegradable organic matter. Overall, TSS decreased from 175.3 mg/L to 96.2 mg/L, indicating a removal efficiency of approximately 45.1%. However, the removal of TSS from AL-1 eff to SP-1 eff and from AL-2 eff to SP-2 eff was very small, which indicates poor functioning of these sedimentation ponds and TSS carryover from the SPs.
TDS increased by 6.2% from 681.1 mg/L in raw water to 723 mg/L after treatment. Low DO levels in the lagoon could have caused the accumulation of organic matter and subsequent release of dissolved solids [53], contributing to the TDS increase. Sludge accumulation in the sedimentation pond may have also contributed to the increase in TDS. However, effluent TDS values still fell within the range for WWTP effluents (250–850 mg/L) [54] and remained below the irrigation standard (≤2000 mg/L). Excessively high TDS in water can be toxic to aquatic animals, such as fish, amphibians, and macroinvertebrates [55]. Using reclaimed water with high TDS for irrigation can cause soil salinization, leading to reduced plant growth and drought-like symptoms [56].
The average concentrations of influent and effluent E. coli of the Suwung WWTP were 8.5 × 10⁶ CFU/100 mL and 8.2 × 10⁵ CFU/100 mL, respectively, indicating a 1-log reduction in E. coli (Figure 8a). However, there are no E. coli standards for irrigation or WWTP effluents in Indonesia to compare these results. Nevertheless, according to the WHO standards, the recommended maximum permissible concentration of E. coli for restricted irrigation is ≤10,000 CFU/100 mL [57]; thus, more than a 2-log reduction in E. coli is required for the Suwung WWTP to meet this standard.
The average influent concentration of total coliforms was 2.0 × 10⁷ CFU/100 mL, and the average effluent concentration was 2.0 × 10⁶ CFU/100 mL, representing a 1-log reduction in total coliforms (Figure 8b). The total coliforms in the effluents did not meet the effluent and irrigation standards of ≤3000 CFU/100 mL and ≤10,000 CFU/100 mL, respectively.
The HRT was used as one of the design parameters because it reflects loading rates in a simple way [58]. Figure 9a shows the relationship between the HRT and effluent BOD of the Suwung WWTP. Although the HRT was longer than the design value of 2 d (48 h) (except for five samples of data), the effluent BOD was higher than the standard (30 mg/L) (except for three samples of data). No correlation was found between HRT and effluent BOD, which indicates that hydraulic overloading, or short HRT, was not the cause of high effluent BOD. This was also indicated by the relationship between HRT and BOD removal rates (Figure 9b).

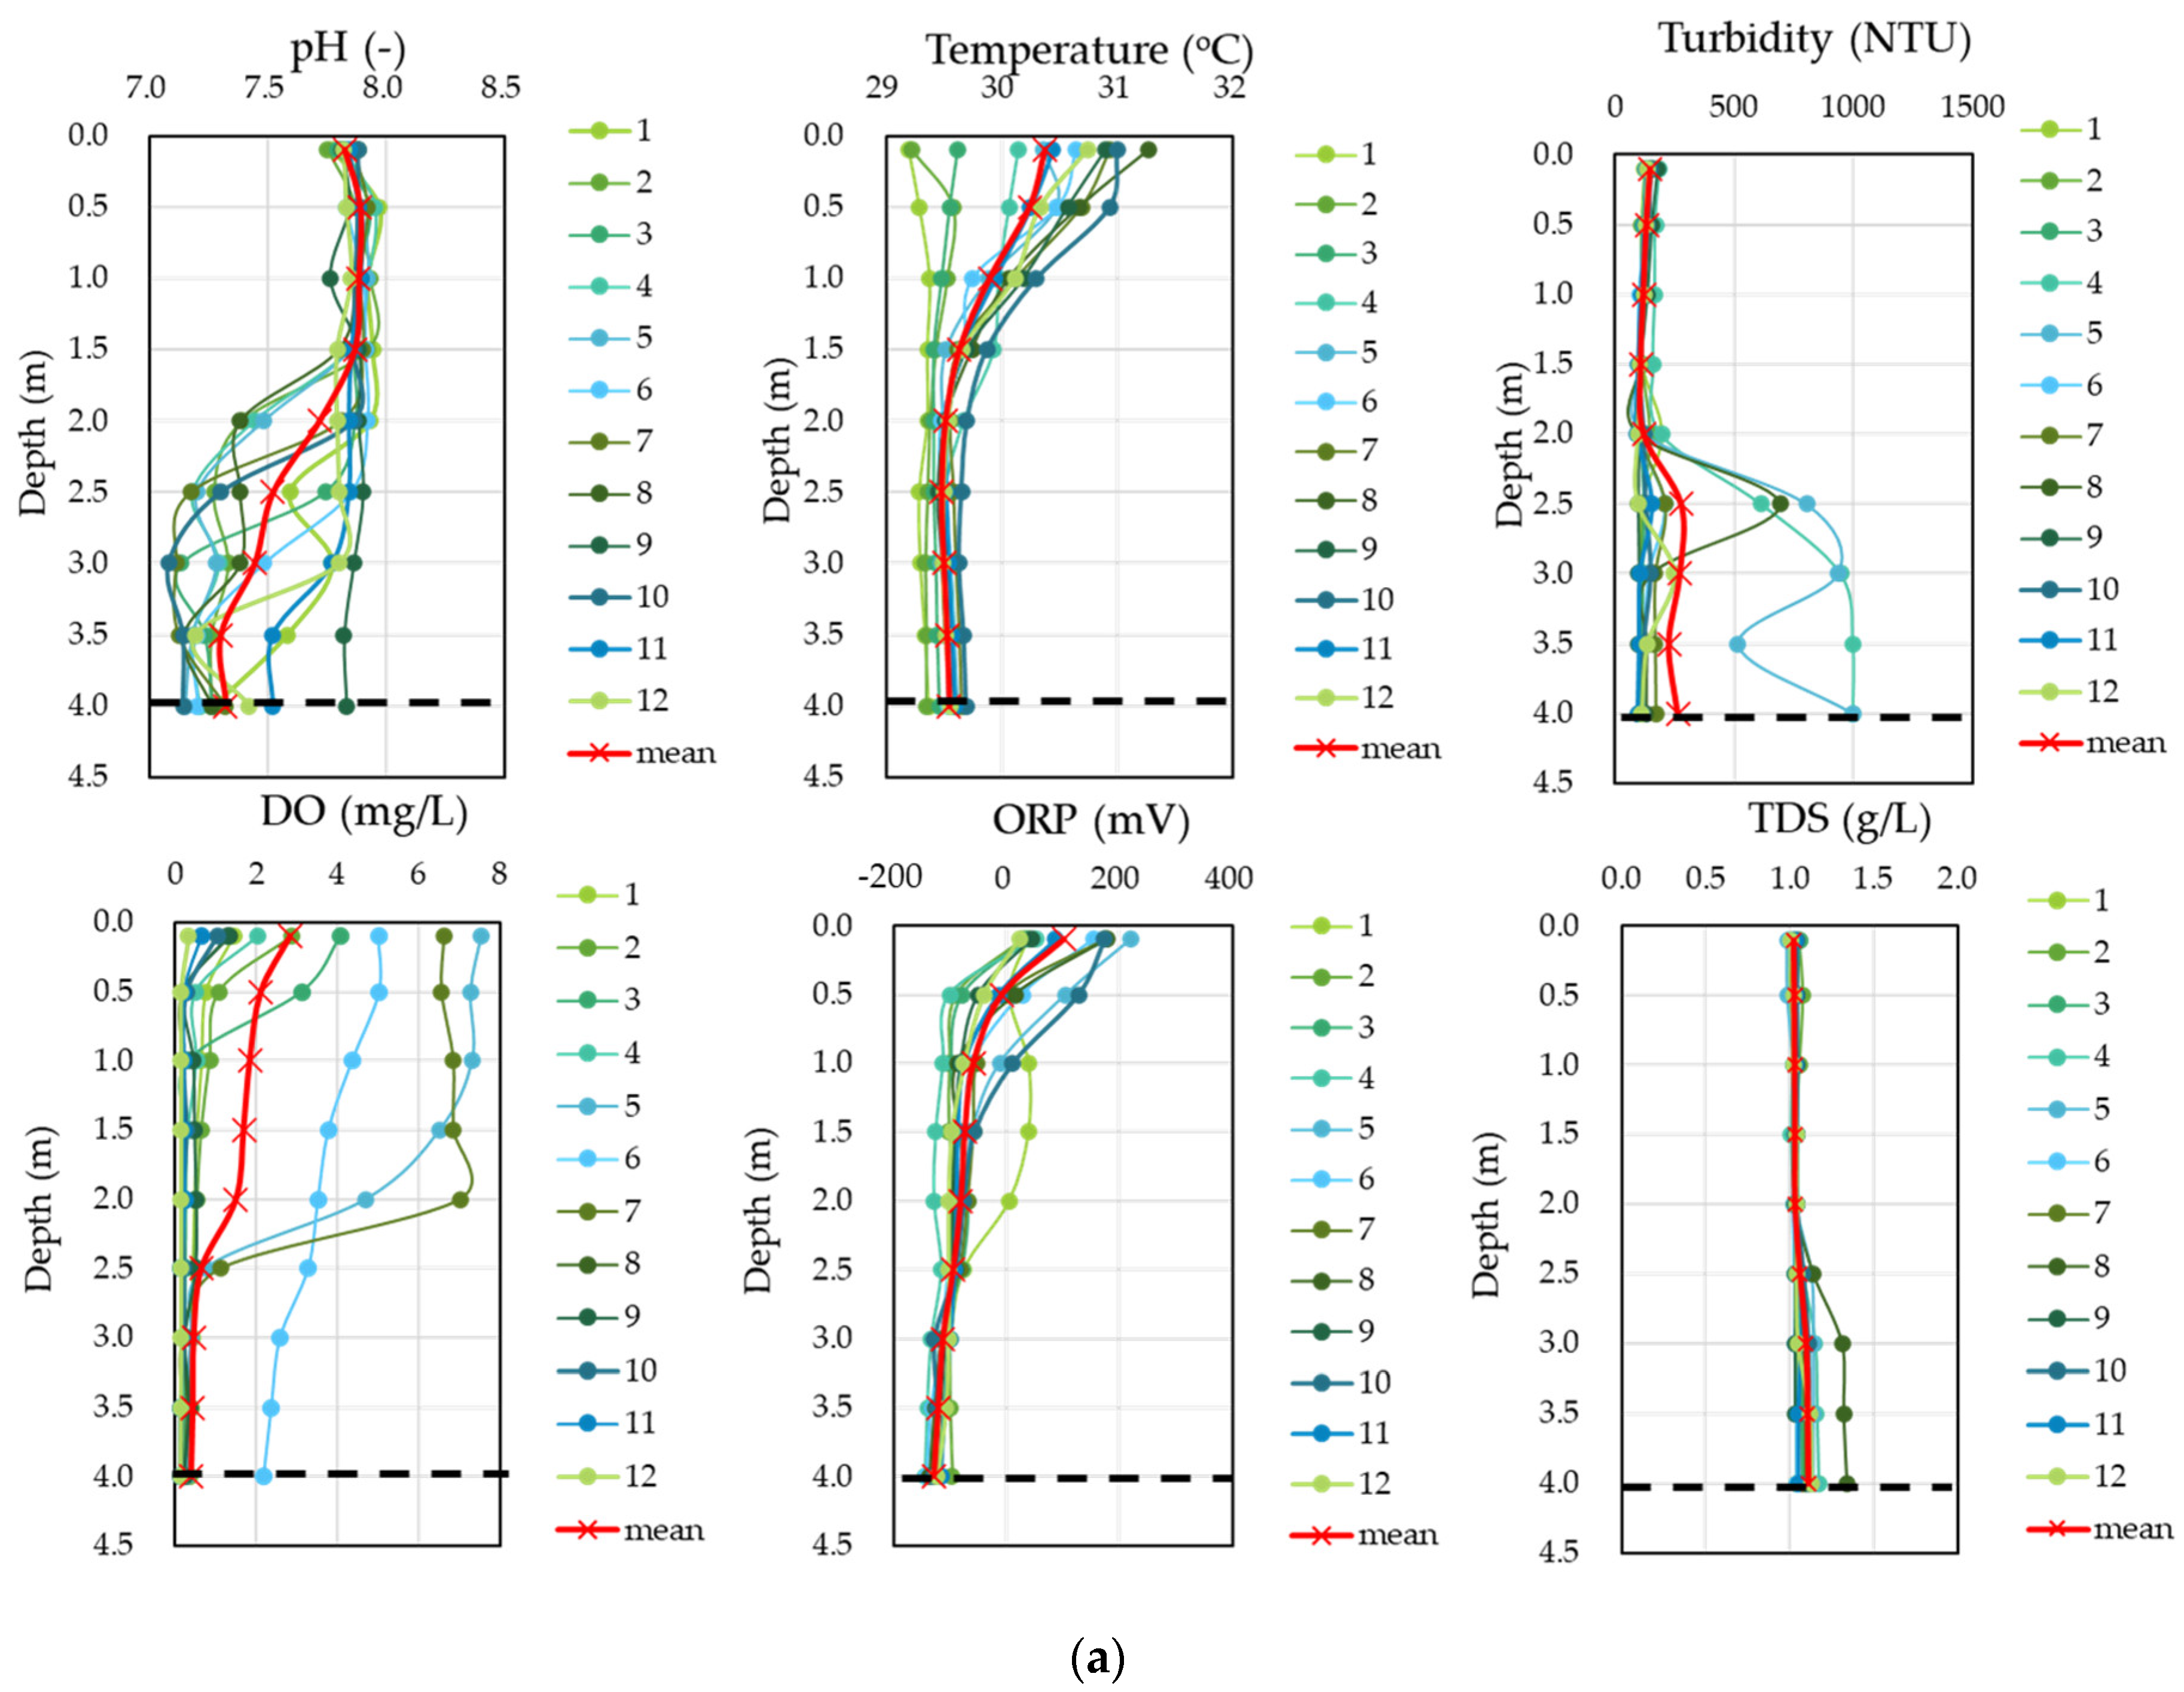
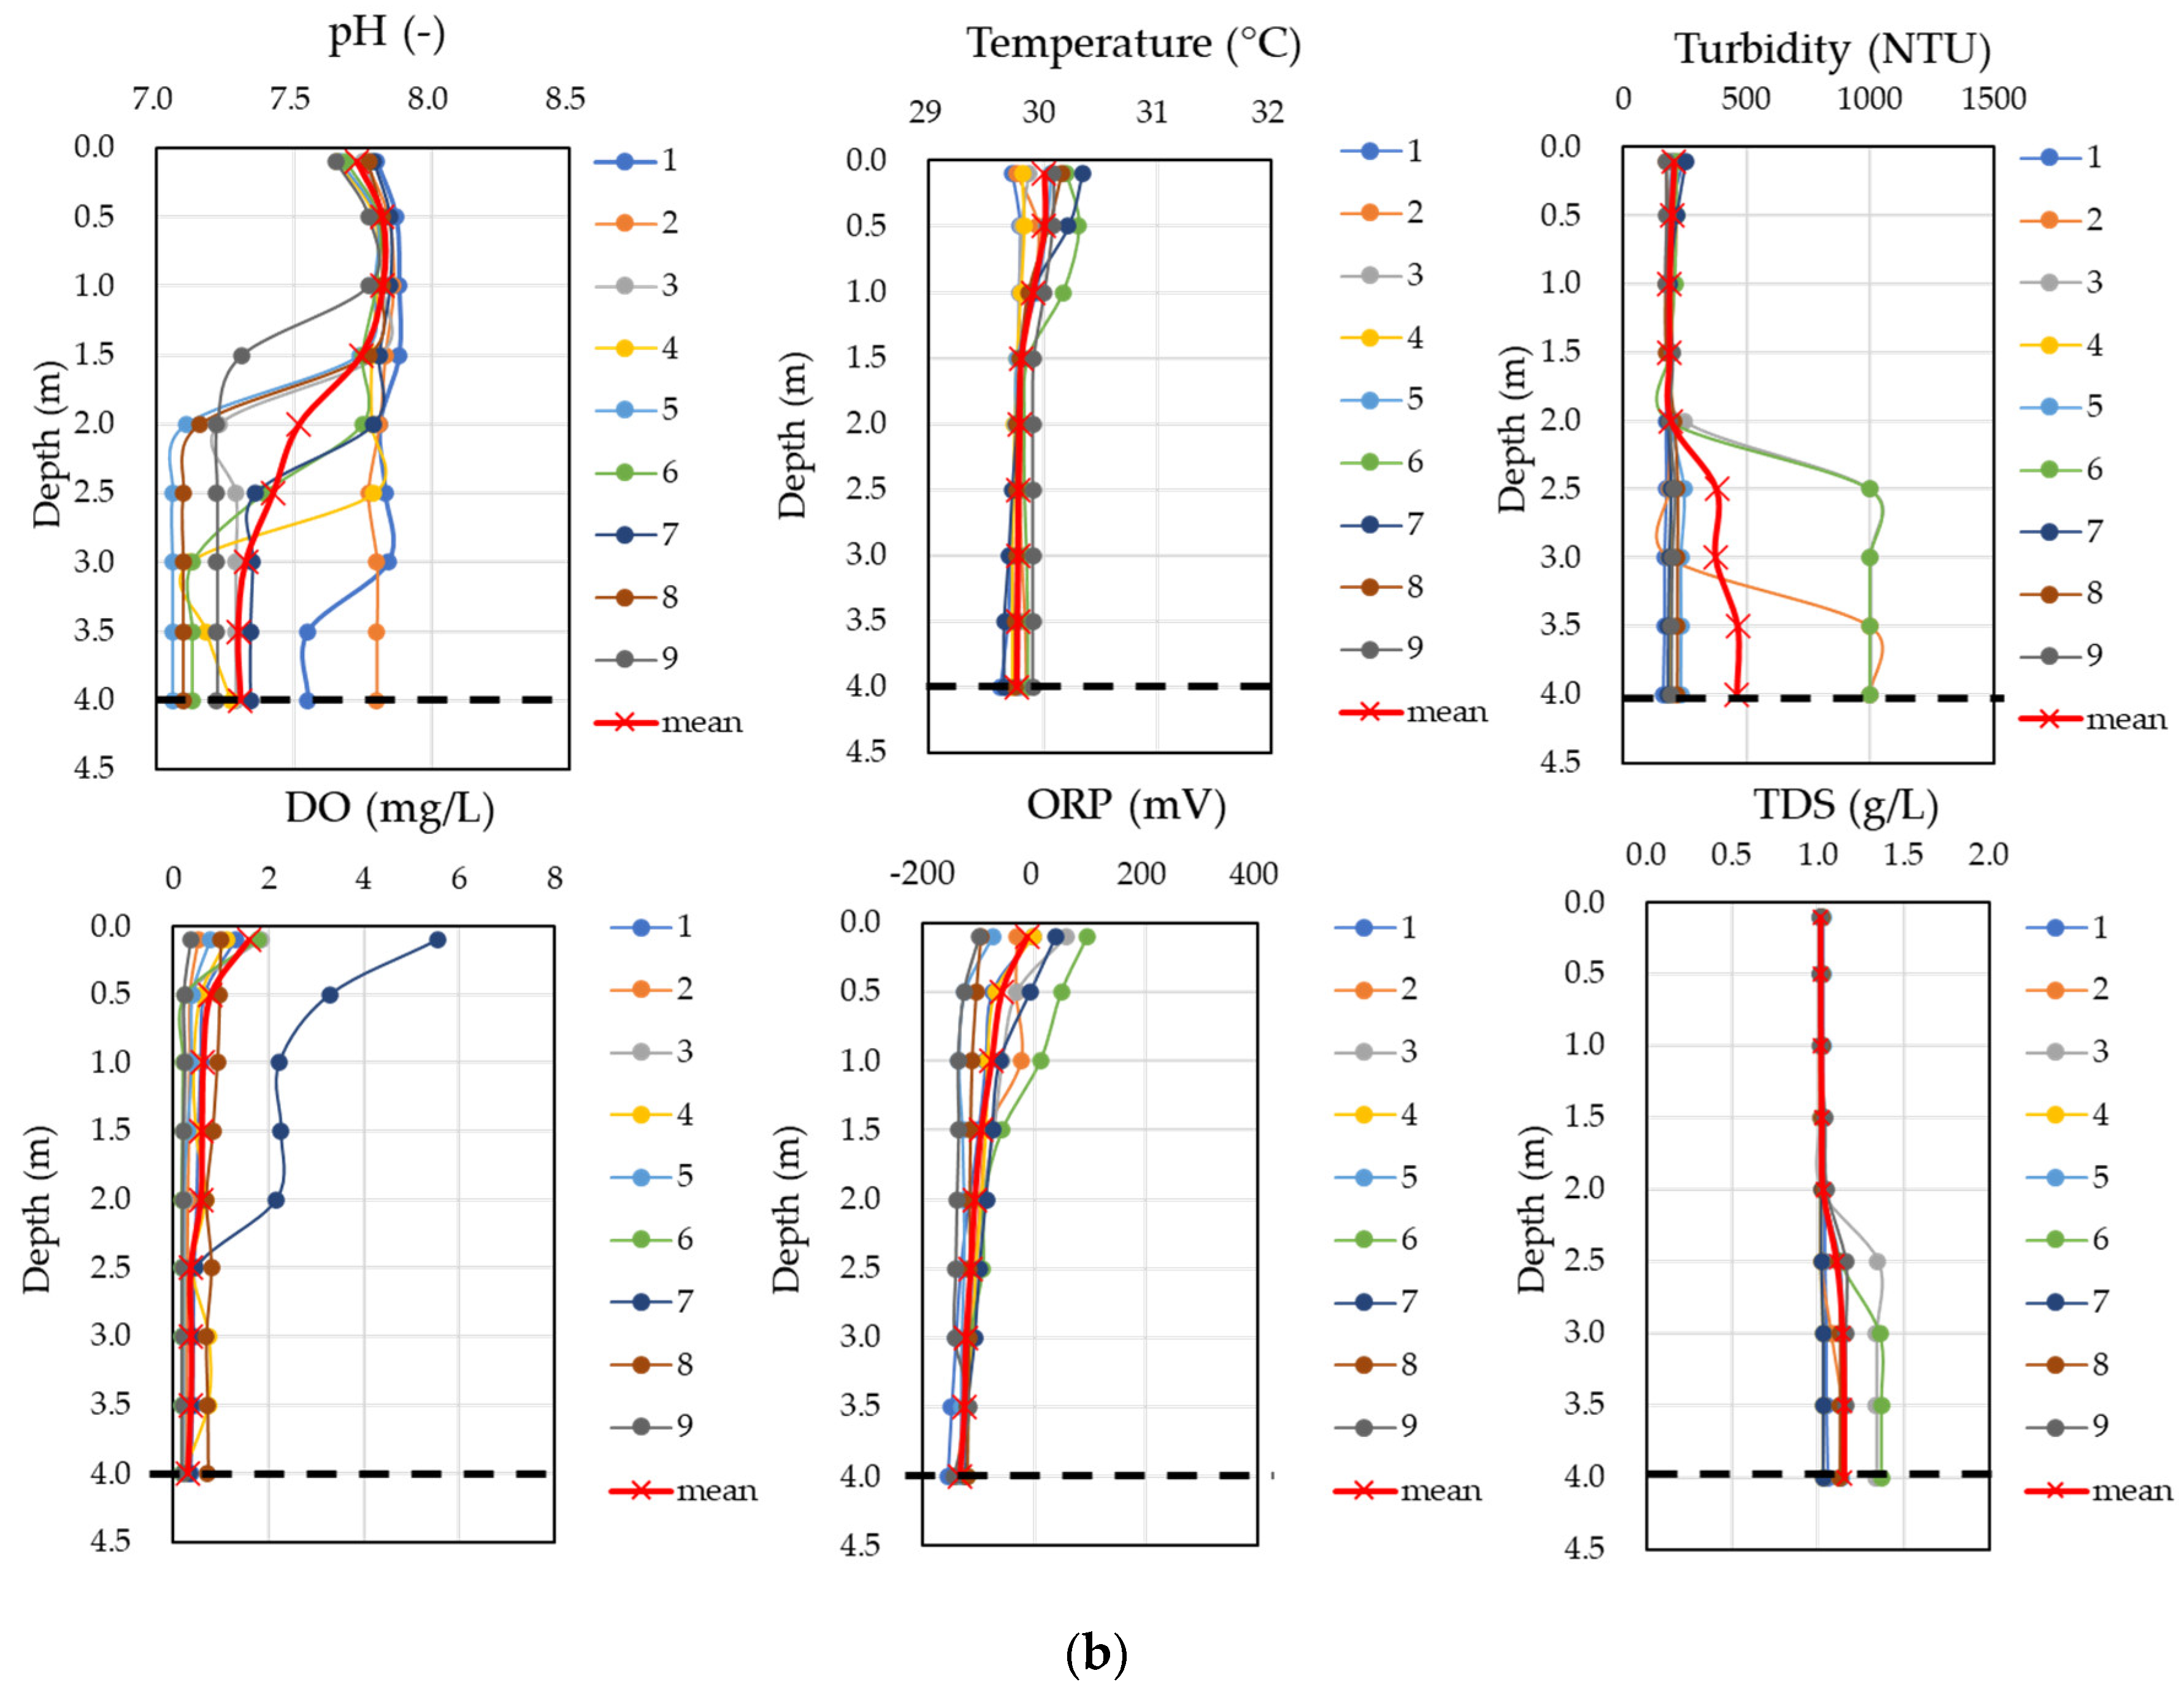
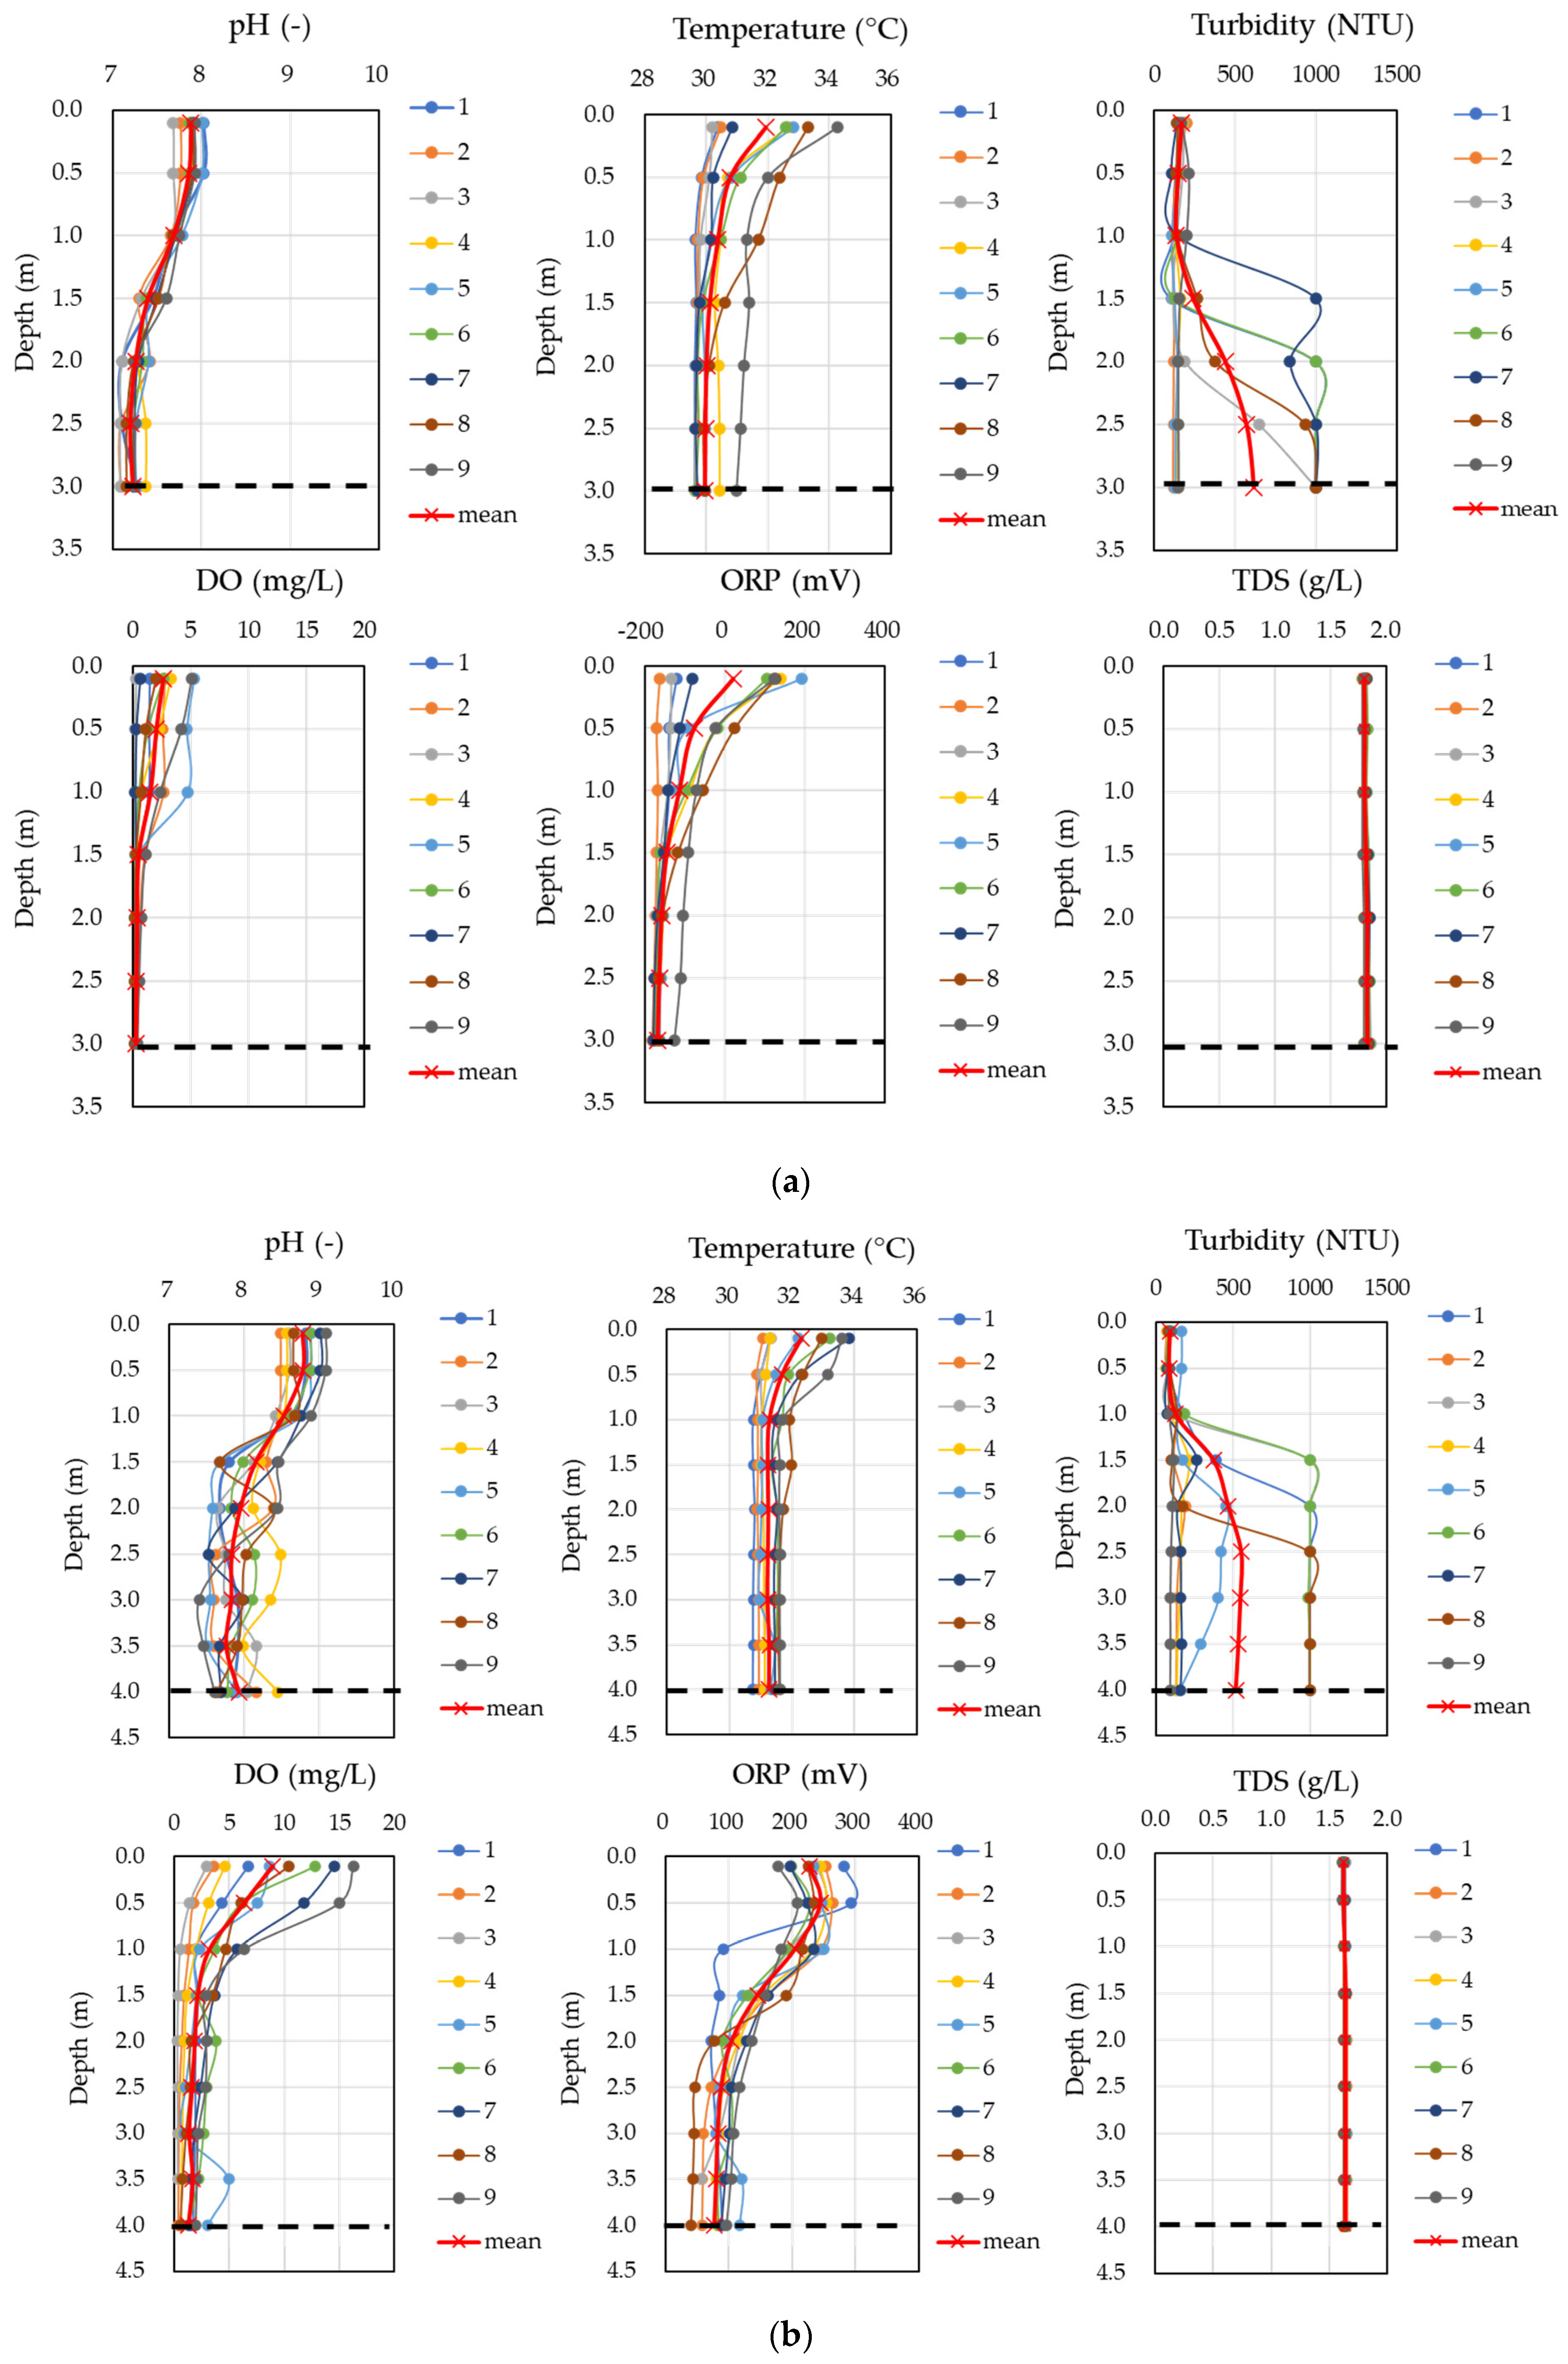
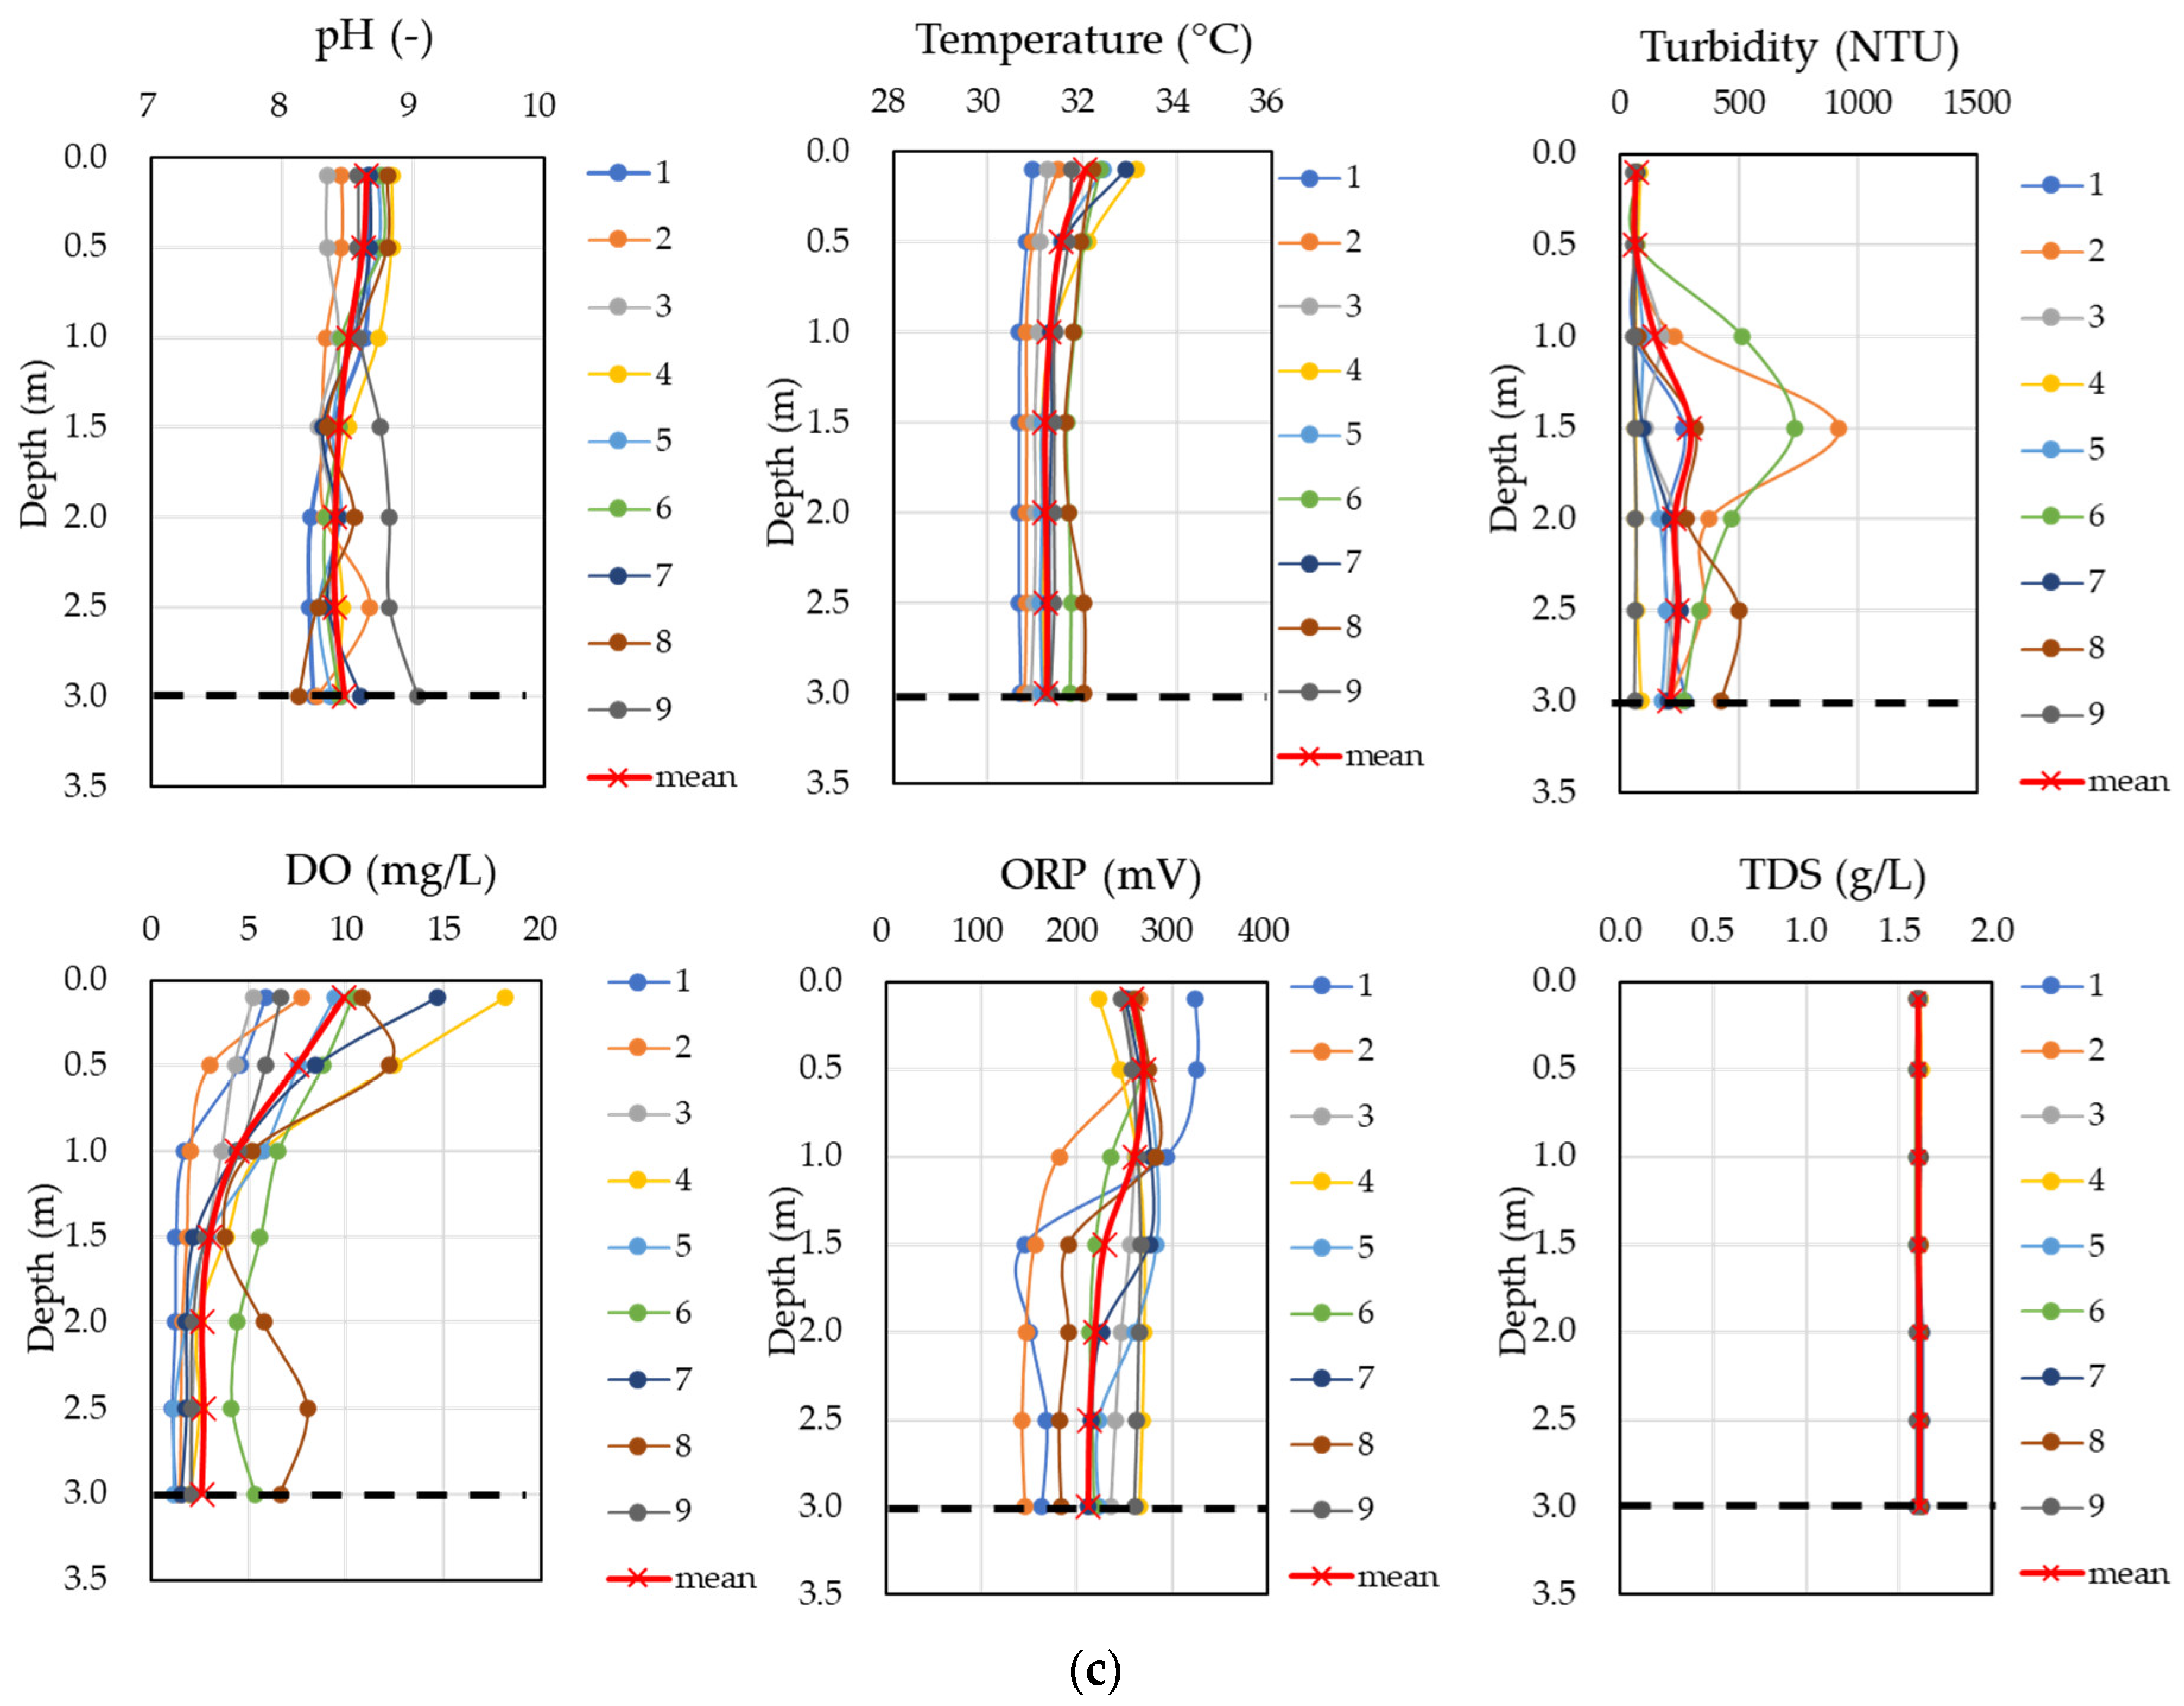
3.2.3. Profile Monitoring Results

Figure 10a,b presents the variations in pH, temperature, turbidity, ORP, DO, and TDS at different depths in AL-1 and AL-2, respectively, in the Suwung WWTP. On average, pH, temperature, ORP, and DO gradually decreased with depth in both aerated lagoons. However, there was a significant difference in ORP and DO between the two lagoons; while there were four monitoring points with high DO at shallow depths in AL-1, there was only one high-DO monitoring point in AL-2; therefore, the average DO of AL-2 was lower than that of AL-1. Moreover, DO concentration dropped to nearly zero below 2.5 m in AL-1 and below 2 m in AL-2. Similarly, the average ORP of AL-1 was higher than that of AL-2. The ORP profiles show high ORP at the surface and a gradual decrease in ORP with depth, indicating that only the top layer was aerobic, while the lower layers were anoxic and anaerobic.
The turbidity profiles display low turbidity from the surface to approximately 2 m depth and an abrupt increase below 2 m at two monitoring points in both aerated lagoons. These results indicate that the sludge concentrations of these aerated lagoons were very low, which could be one of the causes of low BOD removal rates. When a lagoon becomes anoxic or anaerobic, the production of sludge decreases because anaerobic bacteria do not grow as rapidly as aerobic bacteria and are unable to fully utilize the energy contained in organic matter [59]. The TDS profile shows that TDS was almost constant at different depths, except for a few monitoring points. The higher TDS value below 2 m at a few monitoring points indicates that the decomposition of organic matter and/or microbial cells added ionic matter to water [60].
Figure 11a–c presents the variations in the physicochemical parameters of Cells 1B, 2B, and 3 of the ITDC WWTP, showing profiles similar to those of the Suwung WWTP. However, the DO and ORP of the ITDC WWTP were higher than those of the Suwung WWTP, especially in Cells 2B and 3, wherein DO increased to 20 mg/L in some points near the surface. Although the DO concentration decreased with depth, it stayed above 2 mg/L, which is necessary for effective lagoon treatment and for preventing sludge bulking [56]. However, the DO concentration of Cell 1B was lower than that of other cells, as this cell functions as an oil trap, and there is no aeration.

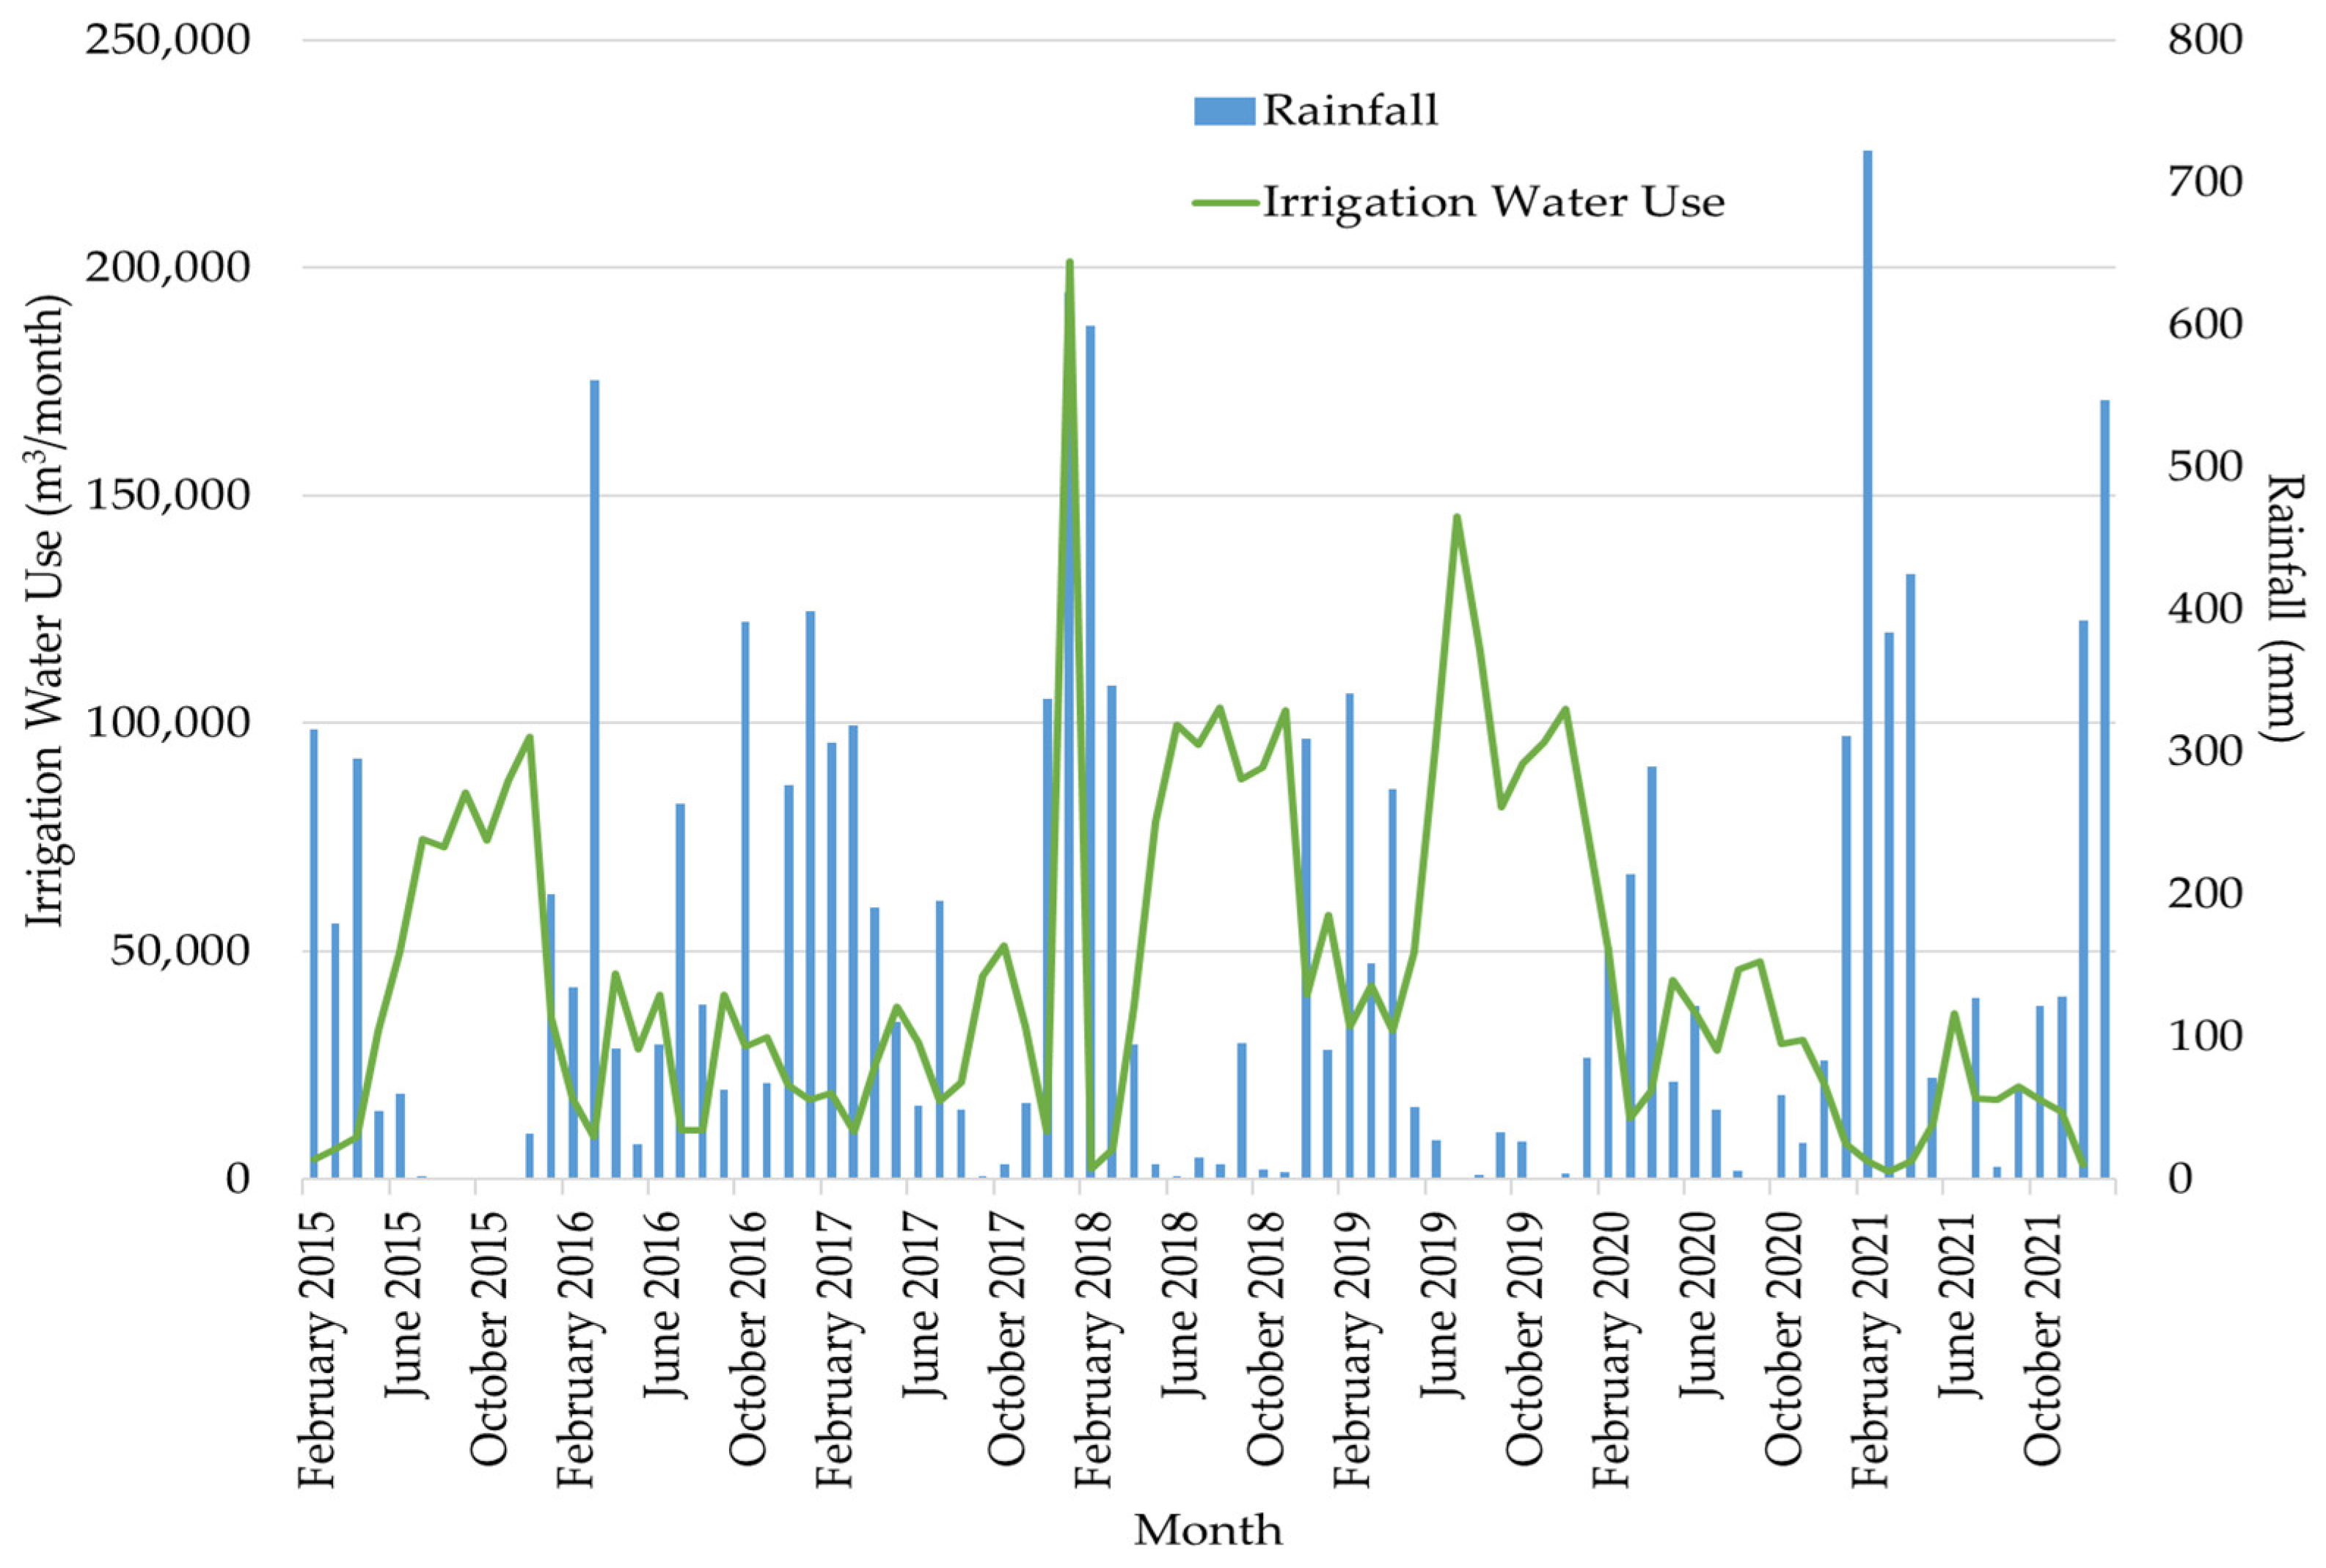
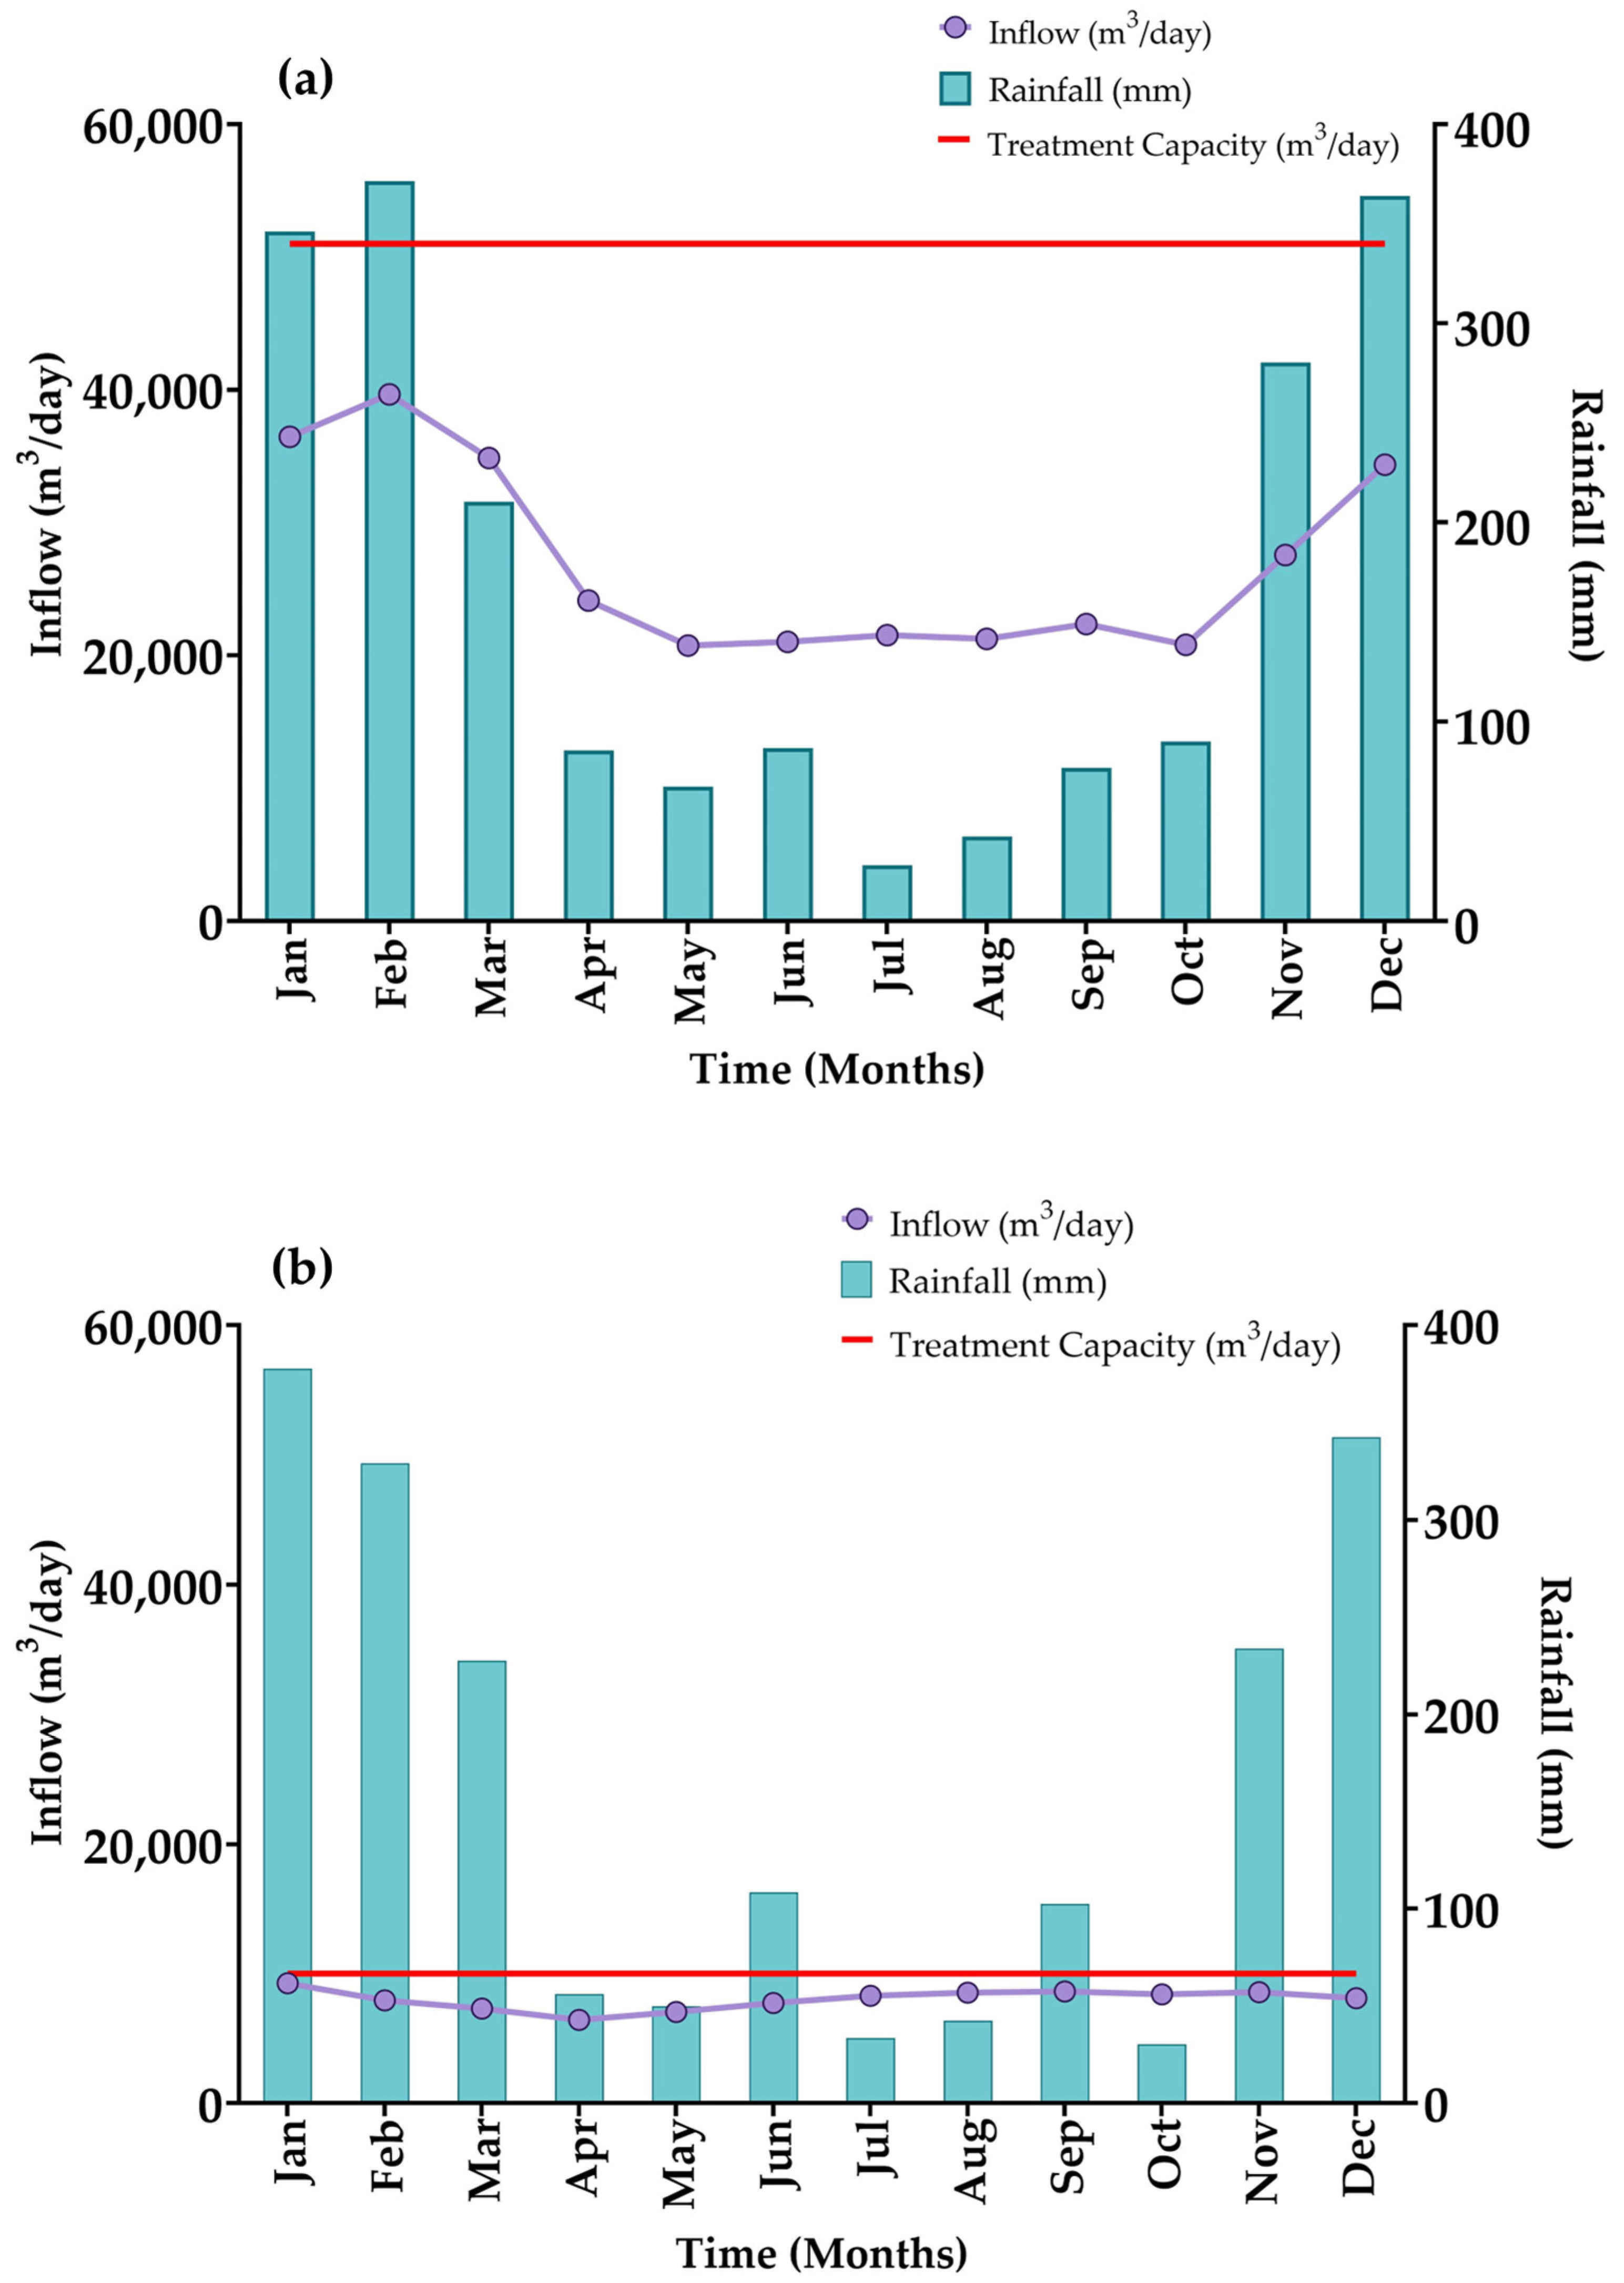
3.3. Wastewater Inflow and Rainfall

Figure A1 presents the relationship between monthly average rainfall and inflow of the two WWTPs in six years (2016–2021). The moderate correlation between rainfall and inflow of the Suwung WWTP indicated infiltration of rainwater into the sewers, particularly during the rainy season from November to March, which might have diluted the influent of the Suwung WWTP. In contrast, the ITDC WWTP monthly inflow appeared to be almost stable throughout the year, indicating less rainwater infiltration than that in the case of the Suwung WWTP. However, both WWTPs appeared to be operating below their treatment capacity, as the monthly average inflows were consistently below the treatment capacity.

3.4. Reclaimed Water Demand and Rainfall

Figure 12 presents the trends of reclaimed water demand for irrigation within the service area of the ITDC WWTP. The findings show that the water demand of hotels and golf courses is directly affected by the seasonal variation in rainfall; this means that the demand is lower during the rainy season, when natural rainfall is sufficient for irrigation, but high during the dry season, when rainwater is not sufficient.

3.5. Acceptance and Potential Uses of Reclaimed Water

Questionnaires were distributed and completed at six hotels located in Badung Regency and Denpasar City that are customers of the Suwung WWTP. Among the six hotels surveyed, only two expressed their interest in utilizing reclaimed water for watering gardens and/or landscape irrigation. The remaining hotels stated various reasons for the lack of interest in using reclaimed water (Table A2). Moreover, the interview survey identified other potential uses for water reuse in Bali Province, such as cooling water, ship cleaning, and roadway median watering. However, additional investigation is required to fully comprehend the demand for reclaimed water for these alternative uses.

4. Discussion

4.1. Potential of Water Reuse in Bali Province

Water reclamation and reuse have significant economic benefits [61]. At the ITDC WWTP, reclaimed water is sold to hotels for landscape irrigation use (Figure 12), generating an annual revenue of 2–6 billion IDR (132,000–396,000 US$). By using this reclaimed water at a rate of 6812 IDR/m3, hotels can save approximately 22–62% compared to using PDAM water, which has a tariff ranging from 8754–17,964 IDR/m3. As a result, the Suwung WWTP also has the potential to generate additional revenue and support its operation and maintenance costs by adopting a similar approach.
The Suwung WWTP has the potential to produce more reclaimed water, i.e., 51,000 m3/d, than its current inflow (26,741 m3/d) by increasing household connections; it can increase production, reaching levels that are comparable to water reuse in Belgium, Cyprus, France, Greece, and Monterey [62,63]. Landscape irrigation prior to COVID-19 was approximately 28,390 m3/d, which is equivalent to 22% of the total water demand of tourism (47 million m3/y, according to Equation (1)). Therefore, the current volume of the influents of the Suwung WWTP could produce reclaimed water to meet approximately 94% of the irrigation demand of hotel landscapes in Bali Province, particularly in Badung Regency and Denpasar City.
Producing more reclaimed water could contribute to resolving the existing gap between water demand and supply. However, there are several hindrances to the adoption of water reuse in Bali Province. Similar to the ITDC WWTP, the Suwung WWTP may face the challenge of fluctuating demand for reclaimed water in different seasons. Therefore, it is crucial to develop effective strategies for managing intermittent demand. To maximize the utilization of reclaimed water, identifying additional potential customers is necessary. Aside from hotels, reclaimed water can be used for landscape irrigation in public parks, school yards, roadway medians, roadside plantings, golf courses, and cemeteries [17]. This application does not require high water quality, unlike for buildings and industry, which are difficult to implement in developing countries including Indonesia, where advanced wastewater treatment is not implemented due to a lack of technologies and financial support. An interview survey revealed other potential customers beyond hotels, such as Indonesia Power (Electricity Provider) for cooling water, PT Pelindo (Indonesia Port Corporation) for ship cleaning, and Denpasar and Badung Environment and Sanitation Agency for roadway median watering.
In order to use treated wastewater from the Suwung WWTP for landscape irrigation, it is necessary to improve and upgrade the treatment systems. To comply with the irrigation standard of BOD, 12 mg/L, all existing aerators must be repaired, and an additional aerator must be installed. This would ensure sufficient oxygen supply and enable the treatment process to run continuously for 24 h to meet the irrigation demand. Moreover, total coliforms were found not to comply with the standards of both effluents and irrigation. It has been found that biological wastewater treatment processes do not completely eliminate pathogenic microorganisms [64,65]. Typically, waste stabilization ponds can only achieve a reduction in total coliforms of up to 99% [50]. Therefore, additional treatment measures are necessary at the Suwung WWTP to achieve more than a 2-log reduction in total coliforms, down to ≤10,000 CFU/100 mL, for irrigation purposes. Implementing a disinfection process, such as chlorine, ozone, or UV irradiation treatment, is essential in water reclamation to effectively inactivate pathogenic microorganisms [56]. However, when upgrading wastewater treatment processes, it is important to consider the capital cost, the operation and maintenance costs, the land area, and the energy requirements.
Another challenge lies in the hesitancy to use reclaimed water, which is influenced by cultural attitudes toward human waste, the stigma associated with reclaimed water, and concerns about its quality and safety. Factors, such as unpleasant odor, disgust at human waste, pathogenic microorganisms, and religious or ethical reasons, contribute to people’s reluctance (Table A2). Hence, trust building and involving the public in the planning process are essential to ensure the acceptance of reclaimed water. Community engagement is important in water reuse planning to build the necessary trust and acceptance [66]. Additionally, regulations and guidelines for the use of reclaimed water should be designed by the government [18].
Concerns about public health and the environment are the main barriers to expanding water reuse, and it is fundamental to avert or mitigate the potential adverse effects of water reuse [67]. As there are currently no regulations nor guidelines for water reclamation and reuse in Indonesia, the establishment of robust water reuse policies and regulations could provide a supportive framework for the extension of current projects and the launch of new projects for water reuse.

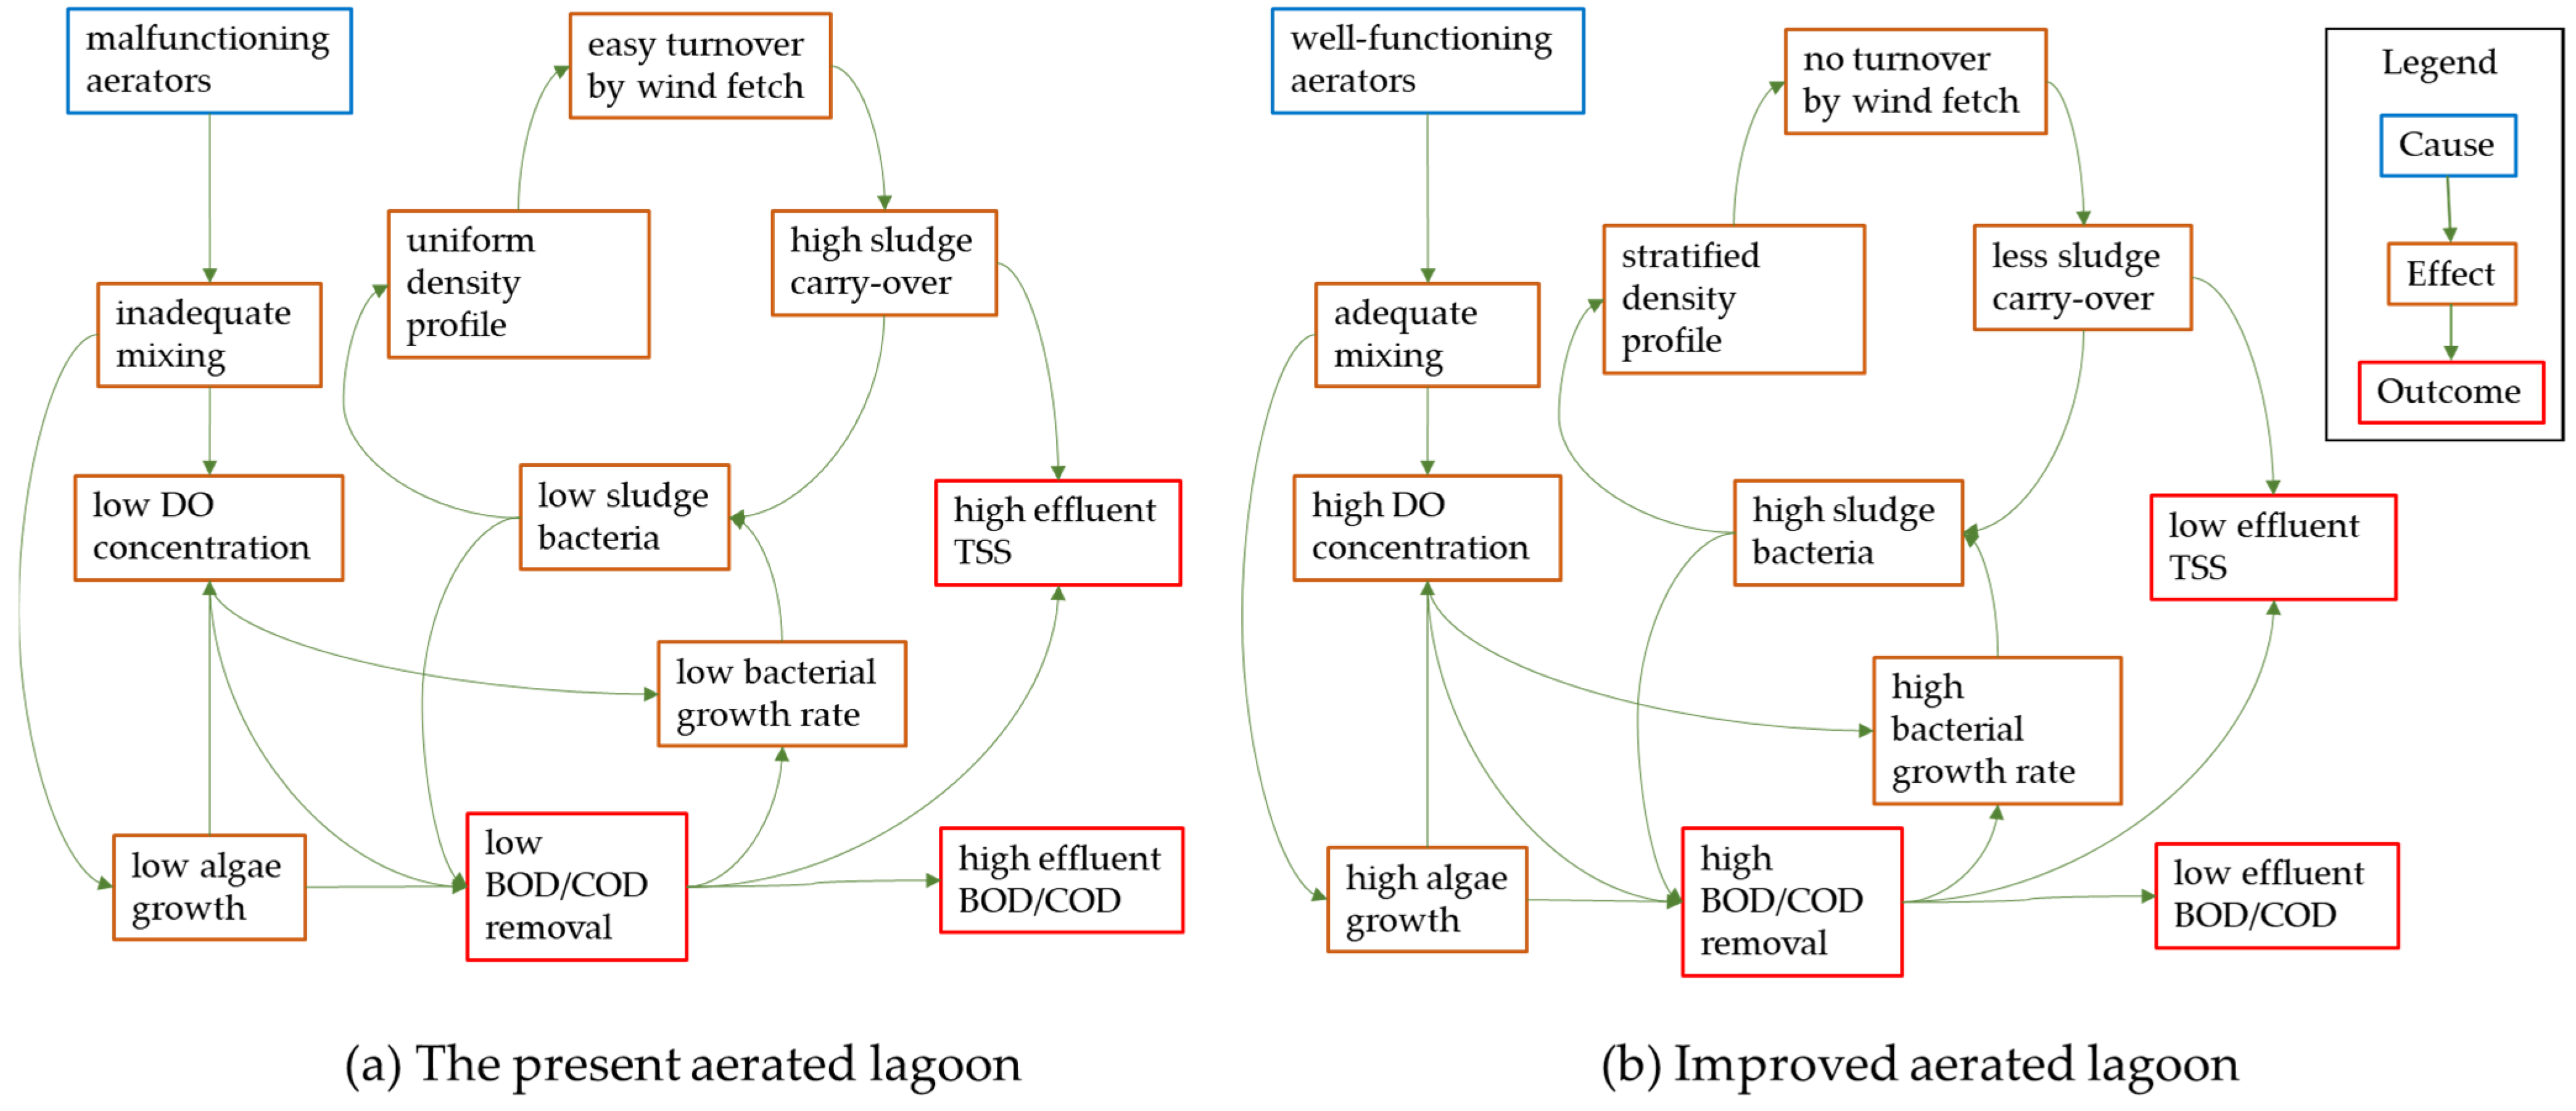
4.2. Improvement in WWTP Treatment Efficiency

Both WWTPs utilize biological processes with waste stabilization ponds (WSPs); the Suwung WWTP employs aerated lagoons and sedimentation ponds, while the ITDC WWTP utilizes anaerobic ponds, facultative aerated lagoons, and maturation ponds. Common removal rates of stabilization ponds are 75–85%, 65–80%, and 60–87% for BOD, COD, and TSS, respectively [50]. The actual removal rates of the Suwung WWTP were lower than these rates, while the ITDC WWTP achieved high removal rates. The contaminant removal rates of WWTPs depend on the composition of influent wastewater; the influent wastewater of the Suwung WWTP had higher soluble BOD than that of the ITDC WWTP (Figure 5c,d). The ratio of soluble-to-particulate BOD of the Suwung WWTP was approximately 1:1, whereas in the ITDC WWTP, it was approximately 1:4, and the average influent BOD concentrations were 153.2 mg/L and 93.9 mg/L in the Suwung WWTP and the ITDC WWTP, respectively. While particulate BOD associated with TSS can be effectively removed using sedimentation or DAF, soluble BOD can only be eliminated using biological decomposition. In bacterial cells, endoenzymes oxidize soluble BOD, generating new cells and various compounds [68]. The presence of higher concentrations of soluble BOD leads to increased demand for oxygen [56]. Microorganisms utilize oxygen for the metabolic decomposition of organic matter. Therefore, elevated levels of soluble BOD require higher rates of oxygen uptake for decomposition. Because of the higher proportion of particulate BOD in the influents of the ITDC WWTP, the BOD removal rates were high, as this plant employs DAF to remove particulate matter. However, in the Suwung WWTP, a malfunctioning aerated lagoon hampers the efficient removal of dissolved BOD, limiting its overall BOD removal rates.
The effectiveness of aerobic stabilization ponds, whether they are aerated lagoons or facultative aerated lagoons, depends on the DO provided by aerators. In the case of aerated lagoons, aerators not only ensure the oxygenation of the medium but also help maintain suspended solids (biomass) dispersed in the liquid medium. Therefore, the proper operation and maintenance of aerators are crucial to ensuring effective treatment, as they maintain dispersed biomass in contact with organic matter. In the ITDC WWTP, 16 aerators are operated for 24 h a day to maintain oxygenation in the lagoons. On the other hand, the Suwung WWTP faces operational challenges with their aerated lagoons, as only 4 of the 12 aerators in AL-1 and 1 of the 9 aerators in AL-2 were found to be operational, while the remaining aerators were found to be damaged and unable to operate due to trash entangled around the motor shaft during its rapid rotation and sludge accumulated in the motor’s intake cone.
The amount of DO to be supplied by the aerators to comply with the effluent standard of BOD, 30 mg/L, was estimated using the following parameters: current average inflow of 26,741 m3/d; average influent BOD of 153.2 mg/L; and oxygen consumption coefficient of 1.2 kgO2/kgBOD5 removed. By applying Equation (2), the required amount of oxygen was estimated to be 3953.4 kgO2/d. Subsequently, using Equation (5), the electric power required to provide 3953.4 kgO2/d was calculated as 3594 kWh/d. Assuming that the plant is operational for 24 h a day, the total power required is 150 kW. Since each current aerator has a power consumption of 15 kW, it is necessary to operate at least 10 aerators to produce effluents that meet the effluent standard. However, to meet the irrigation standard of 12 mg/L with the current average inflow, 12 aerators would need to be operated. It should be noted that if the full capacity of 51,000 m3/d were achieved, 22 aerators would be required to attain the irrigation standard. Presently, there are 21 aerators installed at the Suwung WWTP; therefore, the plant would need to add one additional aerator and fix all the other broken or malfunctioning aerators to meet the irrigation standard.
To illustrate the effects of the malfunctioning aerators in the aerated lagoon of the Suwung WWTP, a causal loop diagram was constructed based on the results of this study (Figure 13a). Aerobic microorganisms consume DO to break down organic matter; thus, at low DO, the rates of organic matter degradation and bacterial growth are low, resulting in a lower concentration of bacteria in sludge and low removal rates of BOD and COD. Inadequate mixing in the lagoon exacerbates the problem by impeding the distribution of nutrients and hindering algal growth, thereby preventing additional oxygen supply. A low concentration of sludge bacteria can contribute to high sludge carryover because it leads to a more uniform density profile, making sludge more susceptible to being stirred up and carried to the surface. Consequently, TSS concentration in effluents becomes high (Figure 7). To enhance the performance of aerated lagoons, adequate oxygen supply by the aerators is necessary for the complete mixing of organic matter in the influents and for sludge bacteria. This leads to a higher concentration of bacteria in the liquid medium, resulting in greater organic matter–biomass contact and increased efficiency of the aerated lagoons. As a result, the concentrations of BOD, COD, and TSS in the effluent are lowered (Figure 13b).

5. Conclusions

Water reclamation and reuse projects in Bali Province face numerous hindrances, including intermittent demand for landscape irrigation, hesitancy among potential customers due to cultural attitudes and stigma surrounding reclaimed water, and the absence of regulations or guidelines for water reclamation and reuse in Indonesia. In addition, there is a need to improve the wastewater treatment systems to meet the required standards.
Developing regions with warm climates, such as Bali Province, often employ waste stabilization ponds for wastewater treatment. However, to ensure the water quality of the effluents to be used for reuse applications, it is crucial to design the treatment processes based on the influent quality and the requirements for reuse applications. A comparison of the two WWTPs highlighted that the quality of the influents of the WWTPs was different even in the same locations. In addition, it was found that the mechanical aerators used in lagoons are susceptible to malfunctioning due to multiple causes. Causal loop analysis reveals that inadequate aerator operation at the Suwung WWTP caused not only limited oxygen supply but also low bacterial growth rates, low sludge concentration, and high sludge carryover, resulting in poor BOD, COD, and TSS removal rates. Proper operation and maintenance of aerators are, therefore, essential for achieving effective treatment in aerated lagoons.
Successful initiatives for water reclamation and reuse require strategic approaches to managing intermittent demand, addressing public acceptance barriers, and overcoming cultural barriers and stigma. Implementing robust water reuse policies helps countries sustainably manage resources and reduce freshwater dependency. The findings of this study provide useful insights and guidance for other cities and countries in tropical regions implementing or planning water reclamation and reuse.

Author Contributions

Conceptualization, S.T., S.K. and M.W.; methodology, S.T., S.K. and M.W.; software, S.T. and M.W.; validation, S.T. and M.W.; formal analysis, S.T. and M.W.; investigation, M.W.; resources, M.W.; data curation, M.W.; writing—original draft preparation, M.W.; writing—review and editing, S.T., S.K. and S.B.; visualization, M.W.; supervision, S.T., S.K. and S.B.; project administration, S.T. and S.K.; funding acquisition, S.T. All authors have read and agreed to the published version of the manuscript.

Funding

This research was supported by Japan International Cooperation Agency (JICA) through the collaborative program with the University of Tokyo and the scholarship provided to Mitria Widianingtias for her graduate studies. This study was also funded by a grant-in-aid for scientific research (No. 22H01621) provided by the Japan Society for the Promotion of Sciences (JSPS).

Data Availability Statement

The data used in this study are available from the sources mentioned in the manuscript or upon request.

Acknowledgments

The authors extend their gratitude to the Ministry of Public Works and Housing of the Republic of Indonesia, the Technical Implementation Unit of Provincial Wastewater Management in Bali (UPTD PAL Provinsi Bali), and the Indonesia Tourism Development Corporation (PT. ITDC Nusantara Utilitas).

Conflicts of Interest

The authors declare no conflict of interest.

Appendix A

Table A1. Area and population of the regencies and city in Bali Province adapted from [27].
No.Regency/CityArea (km2)Total Population (thousand)
1Badung Regency398.8549.5
2Bangli Regency526.8267.1
3Buleleng Regency1322.7825.1
4Gianyar Regency364.4524.0
5Jembrana Regency849.1327.9
6Karangasem Regency839.3511.3
7Klungkung Regency314.0214.0
8Tabanan Regency849.3469.3
9Denpasar City125.9726.8
Table A2. The results of the questionnaire survey.
No.HotelCategoryInterested/Not Interested in
Using Reclaimed Water
Reasons
1AThree-star hotelInterestedThe total garden area is 500 m2
2BThree-star hotelInterestedThey want to be an eco-friendly hotel (the total garden is only 10–15 m2)
3CFour-star hotelNot InterestedUnpleasant odors and disgust at human waste
4DFour-star hotelNot InterestedPathogenic microorganisms
5EZero-star hotelNot InterestedReligious or ethical reasons
6FZero-star hotelNot InterestedUnpleasant odors
Figure A1. Monthly average rainfall and inflow of (a) the Suwung WWTP and (b) the ITDC WWTP between 2016 and 2021.
Water 15 02642 g0a1

References

  1. Tortajada, C. Contributions of recycled wastewater to clean water and sanitation Sustainable Development Goals. NPJ Clean Water 2020, 3, 22. [Google Scholar] [CrossRef]
  2. Gleick, P.H.; Cooley, H. Freshwater scarcity. Annu. Rev. Environ. Resour. 2021, 46, 319–348. [Google Scholar] [CrossRef]
  3. Gude, V.G. Desalination and water reuse to address global water scarcity. Rev. Environ. Sci. Bio. Technol. 2017, 16, 591–609. [Google Scholar] [CrossRef]
  4. Flörke, M.; Schneider, C.; McDonald, R.I. Water competition between cities and agriculture driven by climate change and urban growth. Nat. Sustain. 2018, 1, 51–58. [Google Scholar] [CrossRef]
  5. He, C.; Liu, Z.; Wu, J.; Pan, X.; Fang, Z.; Li, J.; Bryan, B.A. Future global urban water scarcity and potential solutions. Nat. Commun. 2021, 12, 4667. [Google Scholar] [CrossRef] [PubMed]
  6. UN-Water; UNESCO. The United Nations World Water Development Report 2023: Partnerships and Cooperation for Water. 2023. Available online: https://unesdoc.unesco.org/ark:/48223/pf0000384655 (accessed on 10 July 2023).
  7. Dalezios, N.R.; Angelakis, A.N.; Eslamian, S. Water scarcity management: Part 1: Methodological framework. Int. J. Glob. Environ. Issues 2018, 17, 1–40. [Google Scholar] [CrossRef]
  8. Khanal, G.; Thapa, A.; Devkota, N.; Paudel, U.R. A Review on harvesting and harnessing rainwater: An alternative strategy to cope with drinking water scarcity. Water Supply 2020, 20, 2951–2963. [Google Scholar] [CrossRef]
  9. Tzanakakis, V.A.; Paranychianakis, N.V.; Angelakis, A.N. Water supply and water scarcity. Water 2020, 12, 2347. [Google Scholar] [CrossRef]
  10. Voulvoulis, N. Water reuse from a circular economy perspective and potential risks from an unregulated approach. Curr. Opin. Environ. Sci. Health 2018, 2, 32–45. [Google Scholar] [CrossRef]
  11. Drechsel, P.; Qadir, M.; Baumann, J. Water reuse to free up freshwater for higher-value use and increase climate resilience and water productivity. Irrig. Drain. 2022, 71, 100–109. [Google Scholar] [CrossRef]
  12. Scanlon, B.R.; Fakhreddine, S.; Rateb, A.; de Graaf, I.; Famiglietti, J.; Gleeson, T.; Grafton, R.Q.; Jobbagy, E.; Kebede, S.; Kolusu, S.R.; et al. Global water resources and the role of groundwater in a resilient water future. Nat. Rev. Earth Environ. 2023, 4, 87–101. [Google Scholar] [CrossRef]
  13. Devaisy, S.; Kandasamy, J.; Nguyen, T.V.; Ratnaweera, H.; Vigneswaran, S. Membranes in Water Reclamation: Treatment, Reuse and Concentrate Management. Membranes 2023, 13, 605. [Google Scholar] [CrossRef]
  14. Yi, L.; Jiao, W.; Chen, X.; Chen, W. An overview of reclaimed water reuse in China. J. Environ. Sci. 2011, 23, 1585–1593. [Google Scholar] [CrossRef]
  15. Akpan, V.E.; Omole, D.O.; Bassey, D.E. Assessing the public perceptions of treated wastewater reuse: Opportunities and implications for urban communities in developing countries. Heliyon 2020, 6, e05246. [Google Scholar] [CrossRef]
  16. Lazarova, V.; Sturny, V.; Sang, G.T. Relevance and benefits of urban water reuse in tourist areas. Water 2012, 4, 107–122. [Google Scholar] [CrossRef] [Green Version]
  17. Asano, T.; Burton, F.; Leverenz, H. Water Reuse: Issues, Technologies, and Applications; McGraw-Hill Education: New York, NY, USA, 2007. [Google Scholar]
  18. National Research Council. Water Reuse: Potential for Expanding the Nation’s Water Supply through Reuse of Municipal Wastewater; National Academies Press: Washington, DC, USA, 2012. [Google Scholar]
  19. Rodriguez, D.J.; Serrano, H.A.; Delgado, A.; Nolasco, D.; Saltiel, G. From Waste to Resource: Shifting Paradigms for Smarter Wastewater Interventions in Latin America and the Caribbean; World Bank: Washington, DC, USA, 2020. [Google Scholar] [CrossRef]
  20. Takeuchi, H.; Tanaka, H. Water reuse and recycling in Japan—History, current situation, and future perspectives. Water Cycle 2020, 1, 1–12. [Google Scholar] [CrossRef]
  21. Ait-Mouheb, N.; Mayaux, P.L.; Mateo-Sagasta, J.; Hartani, T.; Molle, B. Water reuse: A resource for Mediterranean agriculture. In Water Resources in the Mediterranean Region; Elsevier: Amsterdam, The Netherlands, 2020; pp. 107–136. [Google Scholar] [CrossRef]
  22. Kog, Y.C. Water reclamation and reuse in Singapore. J. Environ. Eng. 2020, 146, 03120001. [Google Scholar] [CrossRef]
  23. Olivieri, A.W.; Pecson, B.; Crook, J.; Hultquist, R. California water reuse—Past, present and future perspectives. In Advances in Chemical Pollution, Environmental Management and Protection; Elsevier: Amsterdam, The Netherlands, 2020; Volume 5, pp. 65–111. [Google Scholar] [CrossRef]
  24. Shoushtarian, F.; Negahban-Azar, M. Worldwide regulations and guidelines for agricultural water reuse: A critical review. Water 2020, 12, 971. [Google Scholar] [CrossRef] [Green Version]
  25. Hardy, D.; Cubillo, F.; Han, M.; Li, H. Alternative Water Resources: A Review of Concepts, Solutions, and Experiences; International Water Association (IWA), Alternative Water Resources Cluster: London, UK, 2015; Available online: https://www.pseau.org/outils/ouvrages/iwa_alternative_water_resources_a_reveix_of_concepts_solutions_and_experiences_2015.pdf (accessed on 16 April 2023).
  26. Statistics of Bali Province. Bali Province in Figures. 2021. Available online: https://bali.bps.go.id/publication/2021/02/26/4ae96914ff22e9b79d8d6551/provinsi-bali-dalam-angka-2021.html (accessed on 26 February 2023).
  27. Statistics of Bali Province. Bali Province in Figures. 2023. Available online: https://bali.bps.go.id/publication/2023/02/28/b467b61cc7b43c86916a11db/provinsi-bali-dalam-angka-2023.html (accessed on 30 May 2023).
  28. Statistics of Bali Province. Tourism Statistic in Bali Province. 2020. Available online: https://bali.bps.go.id/publication/2021/07/28/b4daa6a3245079c50f68f6c7/statistik-wisatawan-mancanegara-ke-bali-2020.html (accessed on 26 February 2023).
  29. Pan, S.Y.; Gao, M.; Kim, H.; Shah, K.J.; Pei, S.L.; Chiang, P.C. Advances and challenges in sustainable tourism toward a green economy. Sci. Total Environ. 2018, 635, 452–469. [Google Scholar] [CrossRef]
  30. Gössling, S.; Peeters, P.; Hall, C.M.; Ceron, J.P.; Dubois, G.; Scott, D. Tourism and water use: Supply, demand, and security. An International Review. Tour. Manag. 2012, 33, 1–15. [Google Scholar] [CrossRef]
  31. Okello, C.; Tomasello, B.; Greggio, N.; Wambiji, N.; Antonellini, M. Impact of population growth and climate change on the freshwater resources of Lamu Island, Kenya. Water 2015, 7, 1264–1290. [Google Scholar] [CrossRef]
  32. Wayan Budiasa, I.; Gusti Ngurah Santosa, I.; Nyoman Sunarta, I.; Ketut Suada, I.; Nyoman Rai, I.; Ratna Dewi, A.A.I.; Dias, V.; Moyzhes, S.; Shchegolkova, N. The potential use of bali wastewater for crop production based on Moscow region experience. Water Resour. 2018, 45, 138–147. [Google Scholar] [CrossRef]
  33. Ministry of Public Works and Housing of Republic of Indonesia. Performance Book of Water Supply Companies. 2021. Available online: https://drive.google.com/drive/folders/1vp3PoEjtNqVWYYqVmbs2RLW9TUSEaKJ2 (accessed on 26 February 2023).
  34. Ministry of National Development Planning of the Republic of Indonesia. Profile of the Province’s Drinking Water. 2020. Available online: https://www.nawasis.org/portal/database/airminum/provinsi/51 (accessed on 26 February 2023).
  35. Statistics of Bali Province. Bali’s Water Statistics. 2015. Available online: https://bali.bps.go.id/publication/2016/10/28/06614ce0d0d60b8576bbec3c/statistik-air-bersih-provinsi-bali-2015.html (accessed on 26 February 2023).
  36. Dong, Y.; Xing, L.; Zhang, X.; Cao, Q.; Lan, X. Assessment methods of groundwater overdraft area and its application. IOP Conf. Ser. Earth Environ. Sci. 2018, 153, 052005. [Google Scholar] [CrossRef] [Green Version]
  37. Elshall, A.S.; Arik, A.D.; El-Kadi, A.I.; Pierce, S.; Ye, M.; Burnett, K.M.; Wada, C.A.; Bremer, L.L.; Chun, G. Groundwater sustainability: A review of the interactions between science and policy. Environ. Res. Lett. 2020, 15, 093004. [Google Scholar] [CrossRef]
  38. JICA. The Comprehensive Study on Water Resources Development and Management in Bali Province in the Republic of Indonesia. 2006. Available online: https://libopac.jica.go.jp/ (accessed on 28 May 2023).
  39. Eva, M.S. Impact of Rapid Development Growth on Water Resources Situation in Tourism Dependent Economy: A Case Study of Bali, Indonesia. Ph.D. Thesis, Kyoto University, Kyoto, Japan, 26 March 2018. [Google Scholar] [CrossRef]
  40. Bali’s Environmental Status Report. 2015; Bali Province. Available online: https://docplayer.info/67927994-Laporan-status-lingkungan-hidup-daerah-provinsi-bali-tahun-2015.html (accessed on 5 March 2023).
  41. Haribowo, R.; Prayogo, T.B.; Vichotama, R. Analysis of water quality of Tukad Badung River, Denpasar, Bali using QUAL2Kw program. J. Technol. Eng. Water Resour. 2021, 1, 40–51. [Google Scholar] [CrossRef]
  42. Ministry of Environment and Forestry of the Republic of Indonesia. Information on National Water Carrying Capacity and Water Holding Capacity. 2019. Available online: https://www.menlhk.go.id/uploads/site/download/1609210499.pdf (accessed on 5 March 2023).
  43. As-syakur, A.R.; Tanaka, T.; Osawa, T.; Mahendra, M.S. Indonesian rainfall variability observation using TRMM Multi-Satellite data. Int. J. Remote Sens. 2013, 34, 7723–7738. [Google Scholar] [CrossRef]
  44. Statistics Indonesia. Indonesia in Figures. Available online: https://www.bps.go.id/publication (accessed on 25 May 2023).
  45. Sunarta, I.N.; As-Syakur, A.R. Study on the development of water crisis in Bali Island in 2009 and 2013. E-J. Tour. 2015, 2, 33–42. [Google Scholar] [CrossRef]
  46. Suharta, I.K.; Merit, N.; Sunarta, N. Rainwater infiltration study in Denpasar City. Ecotrophic 2008, 3, 385912. [Google Scholar]
  47. Rarasari, D.M.G.; Restu, I.W.; Ernawati, N.M. The efficiency of Suwung Wasterwater Treatment Plant (WWTP) in Denpasar City, Bali. J. Mar. Aquat. Sci. 2019, 5, 153–163. [Google Scholar] [CrossRef]
  48. JICA. The Preparatory Survey on Application of Wastewater Reclaiming in Southern Bali Water Supply System in the Republic of Indonesia. 2012. Available online: https://openjicareport.jica.go.jp/pdf/12080107.pdf (accessed on 17 March 2023).
  49. Yamamoto, E.M.S.; Sayama, T.; Takara, K. Impact of Rapid Tourism Growth on Water Scarcity in Bali, Indonesia. Indonesian J. Limnol. 2021, 2, 1–16. [Google Scholar] [CrossRef]
  50. Von Sperling, M. Waste Stabilisation Ponds; IWA Publishing: London, UK, 2007. [Google Scholar]
  51. Kalbusch, A.; Henning, E.; Brikalski, M.P.; de Luca, F.V.; Konrath, A.C. Impact of coronavirus (COVID-19) spread-prevention actions on urban water consumption. Resour. Conserv. Recycl. 2020, 163, 105098. [Google Scholar] [CrossRef]
  52. Yazdian, H.; Jamshidi, S. Performance evaluation of wastewater treatment plants under the sewage variations imposed by COVID-19 spread prevention actions. J. Environ. Health Sci. Eng. 2021, 19, 1613–1621. [Google Scholar] [CrossRef]
  53. Muigai, P.G.; Shiundu, P.M.; Mwaura, F.B.; Kamau, G.N. Correlation between dissolved oxygen and total dissolved solids and their role in the eutrophication of Nairobi dam, Kenya. Int. J. Bio. Chem. Phys. 2010, 18, 38–46. Available online: https://www.academia.edu/download/31478151/The_FT-IR_and_Malarial_Biological_Studie.pdf#page=43 (accessed on 18 April 2023).
  54. Park, M.; Snyder, S.A. Attenuation of contaminants of emerging concerns by nanofiltration membrane: Rejection mechanism and application in water reuse. In Contaminants of Emerging Concern in Water and Wastewater; Butterworth-Heinemann: Oxford, UK, 2020; pp. 177–206. [Google Scholar] [CrossRef]
  55. Peng, J.; Kumar, K.; Gross, M.; Kunetz, T.; Wen, Z. Removal of total dissolved solids from wastewater using a revolving algal biofilm reactor. Water Environ. Res. 2020, 92, 766–778. [Google Scholar] [CrossRef]
  56. Metcalf & Eddy; Abu-Orf, M.; Bowden, G.; Burton, F.L.; Pfrang, W.; Stensel, H.D.; Tchobanoglous, G.; Tsuchihashi, R.; AECOM (Firm). Wastewater Engineering: Treatment and Resource Recovery; McGraw Hill Education: New York, NY, USA, 2014. [Google Scholar]
  57. WHO. Guidelines for the Safe Use of Wastewater, Excreta, and Greywater. 2006. Available online: https://www.who.int/publications/i/item/9241546824 (accessed on 31 May 2023).
  58. Oliveira, S.C.; von Sperling, M. Performance evaluation of different wastewater treatment technologies operating in a developing country. J. Water Sanit. Hyg. Dev. 2011, 1, 37–56. [Google Scholar] [CrossRef]
  59. Mosen, A. Beet-Sugar Handbook; John Wiley & Sons: Hoboken, NJ, USA, 2006. [Google Scholar]
  60. Iyasele, J.U.; Idiata, D.J. Investigation of the relationship between electrical conductivity and total dissolved solids for mono-valent, di-valent and tri-valent metal compounds. Int. J. Eng. Res. Rev. 2015, 3, 40–48. Available online: https://www.researchgate.net/publication/280325585 (accessed on 2 April 2023).
  61. Lyu, S.; Chen, W.; Zhang, W.; Fan, Y.; Jiao, W. Wastewater reclamation and reuse in China: Opportunities and challenges. J. Environ. Sci. 2016, 39, 86–96. [Google Scholar] [CrossRef]
  62. Anderson, J. The environmental benefits of water recycling and reuse. Water Sci. Technol. Water Supply 2003, 3, 1–10. [Google Scholar] [CrossRef] [Green Version]
  63. Angelakis, A.N.; Durham, B. Water recycling and reuse in EUREAU countries: Trends and challenges. Desalination 2008, 218, 3–12. [Google Scholar] [CrossRef]
  64. Kumaraswamy, R.; Amha, Y.M.; Anwar, M.Z.; Henschel, A.; Rodriguez, J.; Ahmad, F. Molecular analysis for screening human bacterial pathogens in municipal wastewater treatment and reuse. Environ. Sci. Technol. 2014, 48, 11610–11619. [Google Scholar] [CrossRef] [PubMed]
  65. Kazner, C.; Wintgens, T.; Dillon, P. (Eds.) Water Reclamation Technologies for Safe Managed Aquifer Recharge; IWA Publishing: London, UK, 2012. [Google Scholar]
  66. Ablo, A.D.; Etale, A. Beyond technical: Delineating factors influencing recycled water acceptability. Urban Water J. 2022, 1–8. [Google Scholar] [CrossRef]
  67. Paranychianakis, N.V.; Salgot, M.; Snyder, S.A.; Angelakis, A.N. Water reuse in EU states: Necessity for uniform criteria to mitigate human and environmental risks. Crit. Rev. Environ. Sci. Technol. 2015, 45, 1409–1468. [Google Scholar] [CrossRef]
  68. Von Sperling, M. Basic Principles of Wastewater Treatment; IWA Publishing: London, UK, 2007. [Google Scholar]
Figure 1. Map of the study area (Badung Regency and Denpasar City) and locations of the WWTPs.
Water 15 02642 g001
Figure 2. Profile monitoring points at (a) the Suwung WWTP and (b) the ITDC WWTP. Placemarks represent the monitoring points.
Water 15 02642 g002
Figure 3. Sampling points at the Suwung WWTP.
Water 15 02642 g003
Figure 4. Influent and effluent quality: (a) BOD; (b) COD; (c) TSS.
Water 15 02642 g004
Figure 5. Relationships between different water quality parameters of the influents of the Suwung and ITDC WWTPs. (a,b) Relationship between BOD and COD, (c,d) relationship between TSS and BOD, and (e,f) relationship between the TSS and COD of Suwung and ITDC WWTPs. The gray shaded area represents the 95% confidence interval for the line.
Water 15 02642 g005aWater 15 02642 g005b
Figure 6. Influent and effluent concentrations and removal rates (%) of Suwung and ITDC WWTPs. (a,b) BOD, (c,d) COD, and (e,f) TSS values of the Suwung and ITDC WWTPs, respectively.
Water 15 02642 g006
Figure 7. Average BOD, COD, and TSS concentrations relative to (a) treatment process 1 and (b) treatment process 2 of the Suwung WWTP. The bars indicate the standard deviations. Note: The influent of the wastewater treatment plant, sourced from the receiving tank, is denoted here as Raw. The influents after the grit chamber of aerated lagoons 1 and 2 are denoted as AL-1 in and AL-2 in, respectively. The effluents of each aerated lagoon are denoted as AL-1 eff and AL-2 eff, while the effluents of sedimentation ponds 1 and 2 are denoted as SP-1 eff and SP-2 eff, respectively. The final effluent, discharged into the mangrove seacoast, is denoted as Treated.
Water 15 02642 g007aWater 15 02642 g007b
Figure 8. Influent and effluent concentrations: (a) E. coli; and (b) total coliforms.
Water 15 02642 g008
Figure 9. Relationships (a) between the HRT and effluent BOD and (b) between the HRT and BOD removal rates (%) of the Suwung WWTP. The dashed lines are (a) the effluent standard (30 mg/L) and (b) the representative range of typical BOD removal rates adapted from [50].
Water 15 02642 g009
Figure 10. Variations in pH, temperature, turbidity, DO, ORP, and TDS at different depths in (a) AL-1 and (b) AL-2 in the Suwung WWTP. The numbers in the legend indicate the monitoring points (refer to Figure 2a). The dashed line represents the lagoon’s depth.
Water 15 02642 g010aWater 15 02642 g010b
Figure 11. Variations in pH, temperature, turbidity, DO, ORP, and TDS at different depths in (a) Cell 1B, (b) Cell 2B, and (c) Cell 3 in the ITDC WWTP. The numbers in the legend indicate the monitoring points (refer to Figure 2b). The dashed line represents the cell’s depth.
Water 15 02642 g011aWater 15 02642 g011b
Figure 12. Rainfall and demand for reclaimed water for irrigation of the ITDC WWTP (2015–2021).
Water 15 02642 g012
Figure 13. Causal loop diagrams of the present aerated lagoon of the Suwung WWTP and its proposed improvement.
Water 15 02642 g013
Table 1. Water quality parameters and analytical devices.
ParameterUnitAnalytical Device
Physicochemical
Temperature°CHoriba Laquatwin EC-33 (Pocket Water Quality Meters); HORIBA Advanced Techno Co., Ltd., Kyoto, Japan
Electrical conductivityμS/cm
TDSmg/L
TSSmg/LDR900 Multiparameter Portable Colorimeter; Hach Company, Loveland, CO, USA
pH-Horiba Laquatwin pH-22 (Pocket Water Quality Meters); HORIBA Advanced Techno Co., Ltd., Kyoto, Japan
BODmg/LKyoritsu Pack Test BOD (Visual Colorimetric Method); Kyoritsu Chemical-Check Lab., Corp., Yokohama, Japan
CODmg/LDR900 Multiparameter Portable Colorimeter; Hach Company, Loveland, CO, USA
Microbial
E. coliCFU/100 mLCompact Dry Nissui; Nissui Pharmaceutical Co., Ltd., Tokyo, Japan
Total coliformsCFU/100 mL
Disclaimer/Publisher’s Note: The statements, opinions and data contained in all publications are solely those of the individual author(s) and contributor(s) and not of MDPI and/or the editor(s). MDPI and/or the editor(s) disclaim responsibility for any injury to people or property resulting from any ideas, methods, instructions or products referred to in the content.

