Article

Intensity–Duration–Frequency Curves for Dependent Datasets

by
Wafaa El Hannoun
1,*,
Anas Boukili Makhoukhi
2,
Abdelhak Zoglat
1 and
Salah-Eddine El Adlouni
2
1
Laboratory of Mathematics, Statistics and Applications, Faculty of Sciences, Mohammed V University in Rabat, Rabat 1014, Morocco
2
Department of Mathematics and Statistics, Université de Moncton, Moncton, NB E1A 3E9, Canada
*
Author to whom correspondence should be addressed.
Water 2023, 15(14), 2641; https://doi.org/10.3390/w15142641
Submission received: 18 June 2023 / Revised: 14 July 2023 / Accepted: 19 July 2023 / Published: 20 July 2023
(This article belongs to the Section Urban Water Management)

Abstract

:
Intensity–duration–frequency (IDF) curves of precipitation are a reference decision support tool used in hydrology. They allow the estimation of extreme precipitation and its return periods. Typically, IDF curves are estimated using univariate frequency analysis of the maximum annual intensities of precipitation for different durations. It is then assumed that the annual maxima of different durations are independent to simplify the parameter estimation. This strong hypothesis is not always verified for every climatic region. This study examines the effects of the independence hypothesis by proposing a multivariate model that considers the dependencies between precipitation intensities of different durations. The multivariate model uses D-vine copulas to explore the intraduration dependencies. The generalized extreme values distribution (GEV) is considered a marginal model that fits a wide range of tail behaviors. An illustration of the proposed approach is made for historical data from Moncton, in the province of New Brunswick (Eastern Canada), with climatic projections made through three scenarios of the Representative Concentration Pathway (RCP).

1. Introduction

Extreme rainfall events are a real challenge for society in both human and economic terms. They often require a multidisciplinary approach to be understood and analyzed [1]. The associated risk is generally measured through the quantile of a return period T and corresponds to the probability of exceedance 1 / T . Extreme rainfall quantile estimation can be conducted using either a deterministic approach, a stochastic approach, or a statistical frequency approach [2]. Frequency analysis (FA) techniques are most frequently employed to estimate extreme rainfall quantiles. This is based on a probability distribution fitted to the sampled rainfall intensity series for various fixed reference durations. The univariate approach to rainfall frequency analysis is explained in detail by [3,4]. Generally, these quantiles are synthesized according to mathematical formulas relating the quantile to its duration and return period and represented in the form of graphs, commonly called IDF curves [5]. The analysis of these graphs continues to arouse the interest of several studies of climatic and hydrological risk [6]. In the univariate FA framework, different durations of annual maxima are often modeled independently of each other by a Gumbel distribution. These are two assumptions, often involving simplification, that have been implicitly used by several authors and services to establish the IDF curves of extreme rainfall [5,7,8,9,10,11].
Some studies have shown the inadequacy of the Gumbel distribution for measuring annual rainfall maxima, as it implies much lower quantiles of extreme rainfall when compared to the general form of extreme distributions, generalized extreme value distribution (GEV) [12]. Moreover, the issue of such a debate between Gumbel and GEV distributions is considerable, since it is related to IDF curve estimation. On the other hand, annual maxima of different durations are, generally, correlated. For example, for a given year, the maximum intensity of duration d can be derived from d of a shorter duration ( d < d ) . However, when estimating the parameters of the IDF curves model, the global likelihood is assumed to be equal to the product of the components for each duration. This assumption is very strong and could lead to erroneous results [13,14,15,16]. Indeed, a multivariate FA can provide a more comprehensive approach for modeling IDF curves. The dependence between different duration levels is the fundamental element in an extreme rainfall multivariate analysis. This an important question that should be explored through multivariate models. The most frequently used model for dependent variables is based on the copula theory, which has been extensively applied in hydrometeorlogy. For example, [17,18,19] analyzed the dependence of intensities and their durations by bivariate copulas.
Copulas were first defined by [20]. Their advantages in the modeling of joined distributions are numerous. They provide flexibility in the choice of arbitrary margins and the dependency structure; the ability to expand to more than two variables; and a separate analysis of marginal distributions and the dependency structure [21]. There are several families of copulas which can be classified into three large families: the elliptical copulas family (Gaussian and Student copulas) and Archimedean copulas, which can be obtained from generating functions [22]. Another class of copulas is deduced as an extension of the univariate extreme values theory to higher dimensions. These copulas measure the probability of the simultaneous occurrence of extreme values of two or more random variables and are, therefore, suitable for modeling phenomena with extreme values in the financial, economic, and environmental fields [23]. For a full review of copula families, see [24,25,26,27].
The use of copulas in a multivariate space with high dimensions is limited to elliptical copulas, thanks to their matrixial expressions. However, they cannot cover large structures of dependencies. Some generalizations have been proposed by the decomposition of the multivariate distribution to a class of bivariate models. For example, [28,29] proposed a general formulation of a multivariate model, called vine copulas, through a graphical model and hierarchical bivariate copula. A regular vine is a special case where the constraints are two-dimensional (2D) or 2D conditional. It is an additive decomposition of the mutual information depending only on expected probability from each side [29]. The first regular vine was discussed in [30]. The goal was to extend the bivariate copula from extreme values to larger dimensions. There are two types of R-vines that allow us to introduce the variables in the order of priority [31]: the canonical vine (C-), which has a star structure that enables a key variable to govern interactions in the data series, and the “drawable” (D-) vine, which has a path structure.
Combining regular vines with copulas provides a flexible tool for high-dimensional modeling [28,29,32]. Indeed, pair copula constructions were compared in [33] with other multivariate models, such as n-dimensional parametric copulas and hierarchical Archimedean constructions. They concluded the superiority of pair copula constructions in terms of their flexibility and modeling efficiency.
In order to address this problem of dependent rainfall maxima for different durations, we propose an appropriate probabilistic model for a multivariate IDF model based on vine copulas. The multivariate inference is detailed for parameter estimation and the conditional distribution expression is explicitly deduced. The D-vine is considered to represent the dependence diagram for closed durations. The proposed approach also implements a maximum likelihood estimation of the parameters of the vine copulas. Our approach not only addresses the issues concerned with independent IDF curves, but also provides the following advantages: (1) being a probabilistic model, the approach produces the probabilistic outputs for the quantiles and (2) the conditional distribution could be used for regional studies when ungagged regions have similar climatic conditions to the available data sites.
The rest of this paper is organized as follows: Section 2 presents the classical model with the GEV distribution and proposes the probabilistic vine copula model, followed by an experimental illustration of Moncton rainfall data and analysis in Section 3. Section 4 discusses the IDF curve formulation and results for the GCM projections for the Maritimes region. Finally, Section 5 concludes the paper and presents the main results and analysis.

2. Classical Models and Vine Copula Approach

This study consists of estimating and comparing IDF curves using univariate and multivariate rainfall frequency analyses. According to [5], IDF curves rely mathematically on the rainfall intensity i, duration d, and return period T. For each of these approaches, the construction of IDF curves is mostly conducted by the following four steps:
  • Rainfall intensity sample definition;
  • Determination and estimation of the marginal distributions and, for the sampled series, estimation of the copula parameters and construction of the joint distribution;
  • Estimation of the quantiles corresponding to specified return periods;
  • Adjustment of an IDF relationship to the estimated quantiles;
Different procedures, such as the use of the annual maximum (AM), or the use of the peaks-over-threshold (POT) can be applied to determine the sample [4,5]. In our study, nine samples were constructed using the AM approach.

2.1. GEV-Distribution-Based Rainfall Quantiles

As part of the modeling of IDF curves, a classical challenge is to analyze an m-sample I d 1 , I d 2 , , I d m , where I d i represents the random variable modeling the AMS of the rainfall intensities at duration i. In this context, a classical or univariate frequency analysis consists of individually adjusting a marginal probability distribution F at each duration d. According to the extreme value theory, we can approximate the distribution F of the annual maxima of a sample by a generalized extreme values distribution (GEV), whose distribution function is given by:
F ( i d ; μ , σ , κ ) = exp 1 + κ ( i d μ σ ) 1 κ , κ 0 .
where < κ < is the shape parameter controlling the tail behavior of F, < μ < is the position value characterizing the mean magnitude of F, σ > 0 is the scale parameter defining the variability around μ , and 1 + κ i d μ σ > 0 .
There are many methods for estimating these parameters. The reader may refer to [34] for a review. For this work, we used the maximum likelihood method (MLE) due to the efficiency of its estimators [34] and its wide use in the analysis of extreme rainfall [9,11,13].
Estimating the parameters by MLE consists of formulating a likelihood of the observations while knowing the parameters. It is given by:
L ( i | ϕ ) = j = 1 n k = 1 m f ( i j k , ϕ ) .
where f denotes the probability density function of the variable I d i , i j k denotes the j-th rainfall intensity in the series of duration k ( 1 k m ) of size n, and Φ = ( κ , σ , μ ) is the vector of the parameters to be estimated.
Consequently, having the parameters ( κ ^ , σ ^ , a n d   μ ^ ) , the distribution F is thus known for each reference duration used. This facilitates the estimation of the quantiles corresponding to one or more return periods T. Indeed, by definition, the quantile i d T verifying
F ( i d ; μ , σ , κ ) = 1 1 T
is only the converse of Equation (3). It is given by the following expression:
i d T = μ ^ + σ ^ κ ^ 1 ln ( 1 1 T ) κ ^ , κ ^ 0 .
The likelihood model presented in Equation (2) is statistically unrealistic. It is based on the assumption, implicitly used in the construction of IDF curves, of independence between observations of different durations. The advantage of this likelihood is the use of a large amount of information. However, the dependence of distinct duration observations can result in information redundancies. In particular, the variability of the quantile and parameter estimators is underestimated, which is a typical problem that we seek to solve through copulas.

2.2. Vine-Copula-Based Rainfall Quantiles

A summary of the vine copula properties is presented below. More details can be found in [35].
Definition 1.
V is a vine over n elements if
1.
V = ( T 1 , , T m ) .
2.
T 1 is a tree of nodes N 1 = { 1 , , n } and a set of edges denoted by E 1 .
3.
For i = 2 , , m , T i is a tree of nodes N i N 1 E 1 E 2 E i 1 and a set of edges denoted by E i .
V is called a regular vine when m = n , T i is a tree connected to the set of edges E i and to the set of nodes N i = E i 1 of the cardinal # N i = n ( i 1 ) for i = 1 , , n . In addition, the proximity condition must be verified, i.e., for i = 2 , n 1 . If a = { a 1 , a 2 } and b = { b 1 , b 2 } are two nodes in N i connected by an edge, then # a b = 1 .
Definition 2.
(R-vine specification). ( F , V , B ) is a specification of the R-vine if F = ( F 1 , , F n ) is a vector of continuous functions, V is an n-dimensional R-vine, and for a set of bivariate copulas B e , we have B = B e / i = 1 , , n 1 ; e E i .
Two particular types or regular vines are canonical (C-) vines and drawable (D-) vines.
Since successive IDF durations are more closely correlated, a natural choice for the multivariate dependence structure is a D-vine (path structure). We represent the D-vine for the case of six variables in Figure 1.
Following [28], the general expression of the D-vine density on six nodes is given by:
f 123456 = f 1 . f 2 . f 3 . f 4 . f 5 . f 6 . c 12 . c 23 . c 34 . c 45 . c 56 . c 13 / 2 . c 24 / 3 . c 35 / 4 . c 46 / 5 . c 14 / 23 . c 25 / 34 . c 36 / 45 . c 15 / 234 . c 26 / 345 . c 16 / 2345 ,
where the grouped terms represent, respectively, the univariate densities of the distributions of the first tree of the D-vine and the densities of the unconditional copulas of the rest of the trees of the D-vine. The conditional distributions and quantile formulation are developed in Appendix A.

2.3. IDF Curve Formulation

The quantiles of the maximum annual rainfall are synthesized according to IDF relationships linking the rainfall intensity i as a function of the rainfall duration d for each return period T. They are mathematically expressed by:
i d T = f T ( d )
where i T d (mm/h) denotes the quantile of a return period T (in years) of the annual maximum intensity of an aggregation duration d (in minutes or hours). On a double logarithmic scale, we plot IDF relationships according to a family of curves called IDF curves. The statistical modeling of the IDF curves consists of fitting a non-linear model to the quantiles of extreme rainfall estimated by each of the GEV and vine copula approaches. Several empirical models of IDF curves have been proposed in the literature. Ref. [36] presents a historical overview of IDF curves.
Below, we suggest a classical model that synthesizes the quantiles estimated marginally by the GEV distribution and jointly using vine copulas. A common characteristic of all IDF equations is that the rainfall intensity varies inversely with the rainfall duration. The most general equation found in the literature is the Montana’s empirical two-parameter model [8,37].
For a given return period T, IDF Equation (6) is expressed mathematically by:
f T ( d ) = a d b
To synthesize the subhourly quantiles estimated by the GEV model or by the vine copula model, we use, respectively, the following Montana models:
I D F G E V : i T ( d ) = a 1 d b 1
I D F C o p u l a : i T ( d ) = a 2 d b 2
where i T ( d ) is the rainfall intensity in millimeters per hour (mm/h), d is the rainfall duration in hours or minutes (h or min), and T is the return period for the rainfall intensity in years. Montana’s parameters ( a 1 , b 1 ) are estimated, for each return period T using the least squares method on i T ( d ) , which is found using Equation (4) for a set of durations d. ( a 2 , b 2 ) are estimated for each return period T using the least squares method on i T ( d ) , which is found using the vine copula method for a set of durations d.
This regression consists of minimizing the square of the deviations between Equations (8) and (9) and the subhourly quantiles of both methods. The following section implements the methodology through a case study. We used Matlab programs (based on the regress and fitnlm functions) for optimization [38].

3. Study Area and Dataset

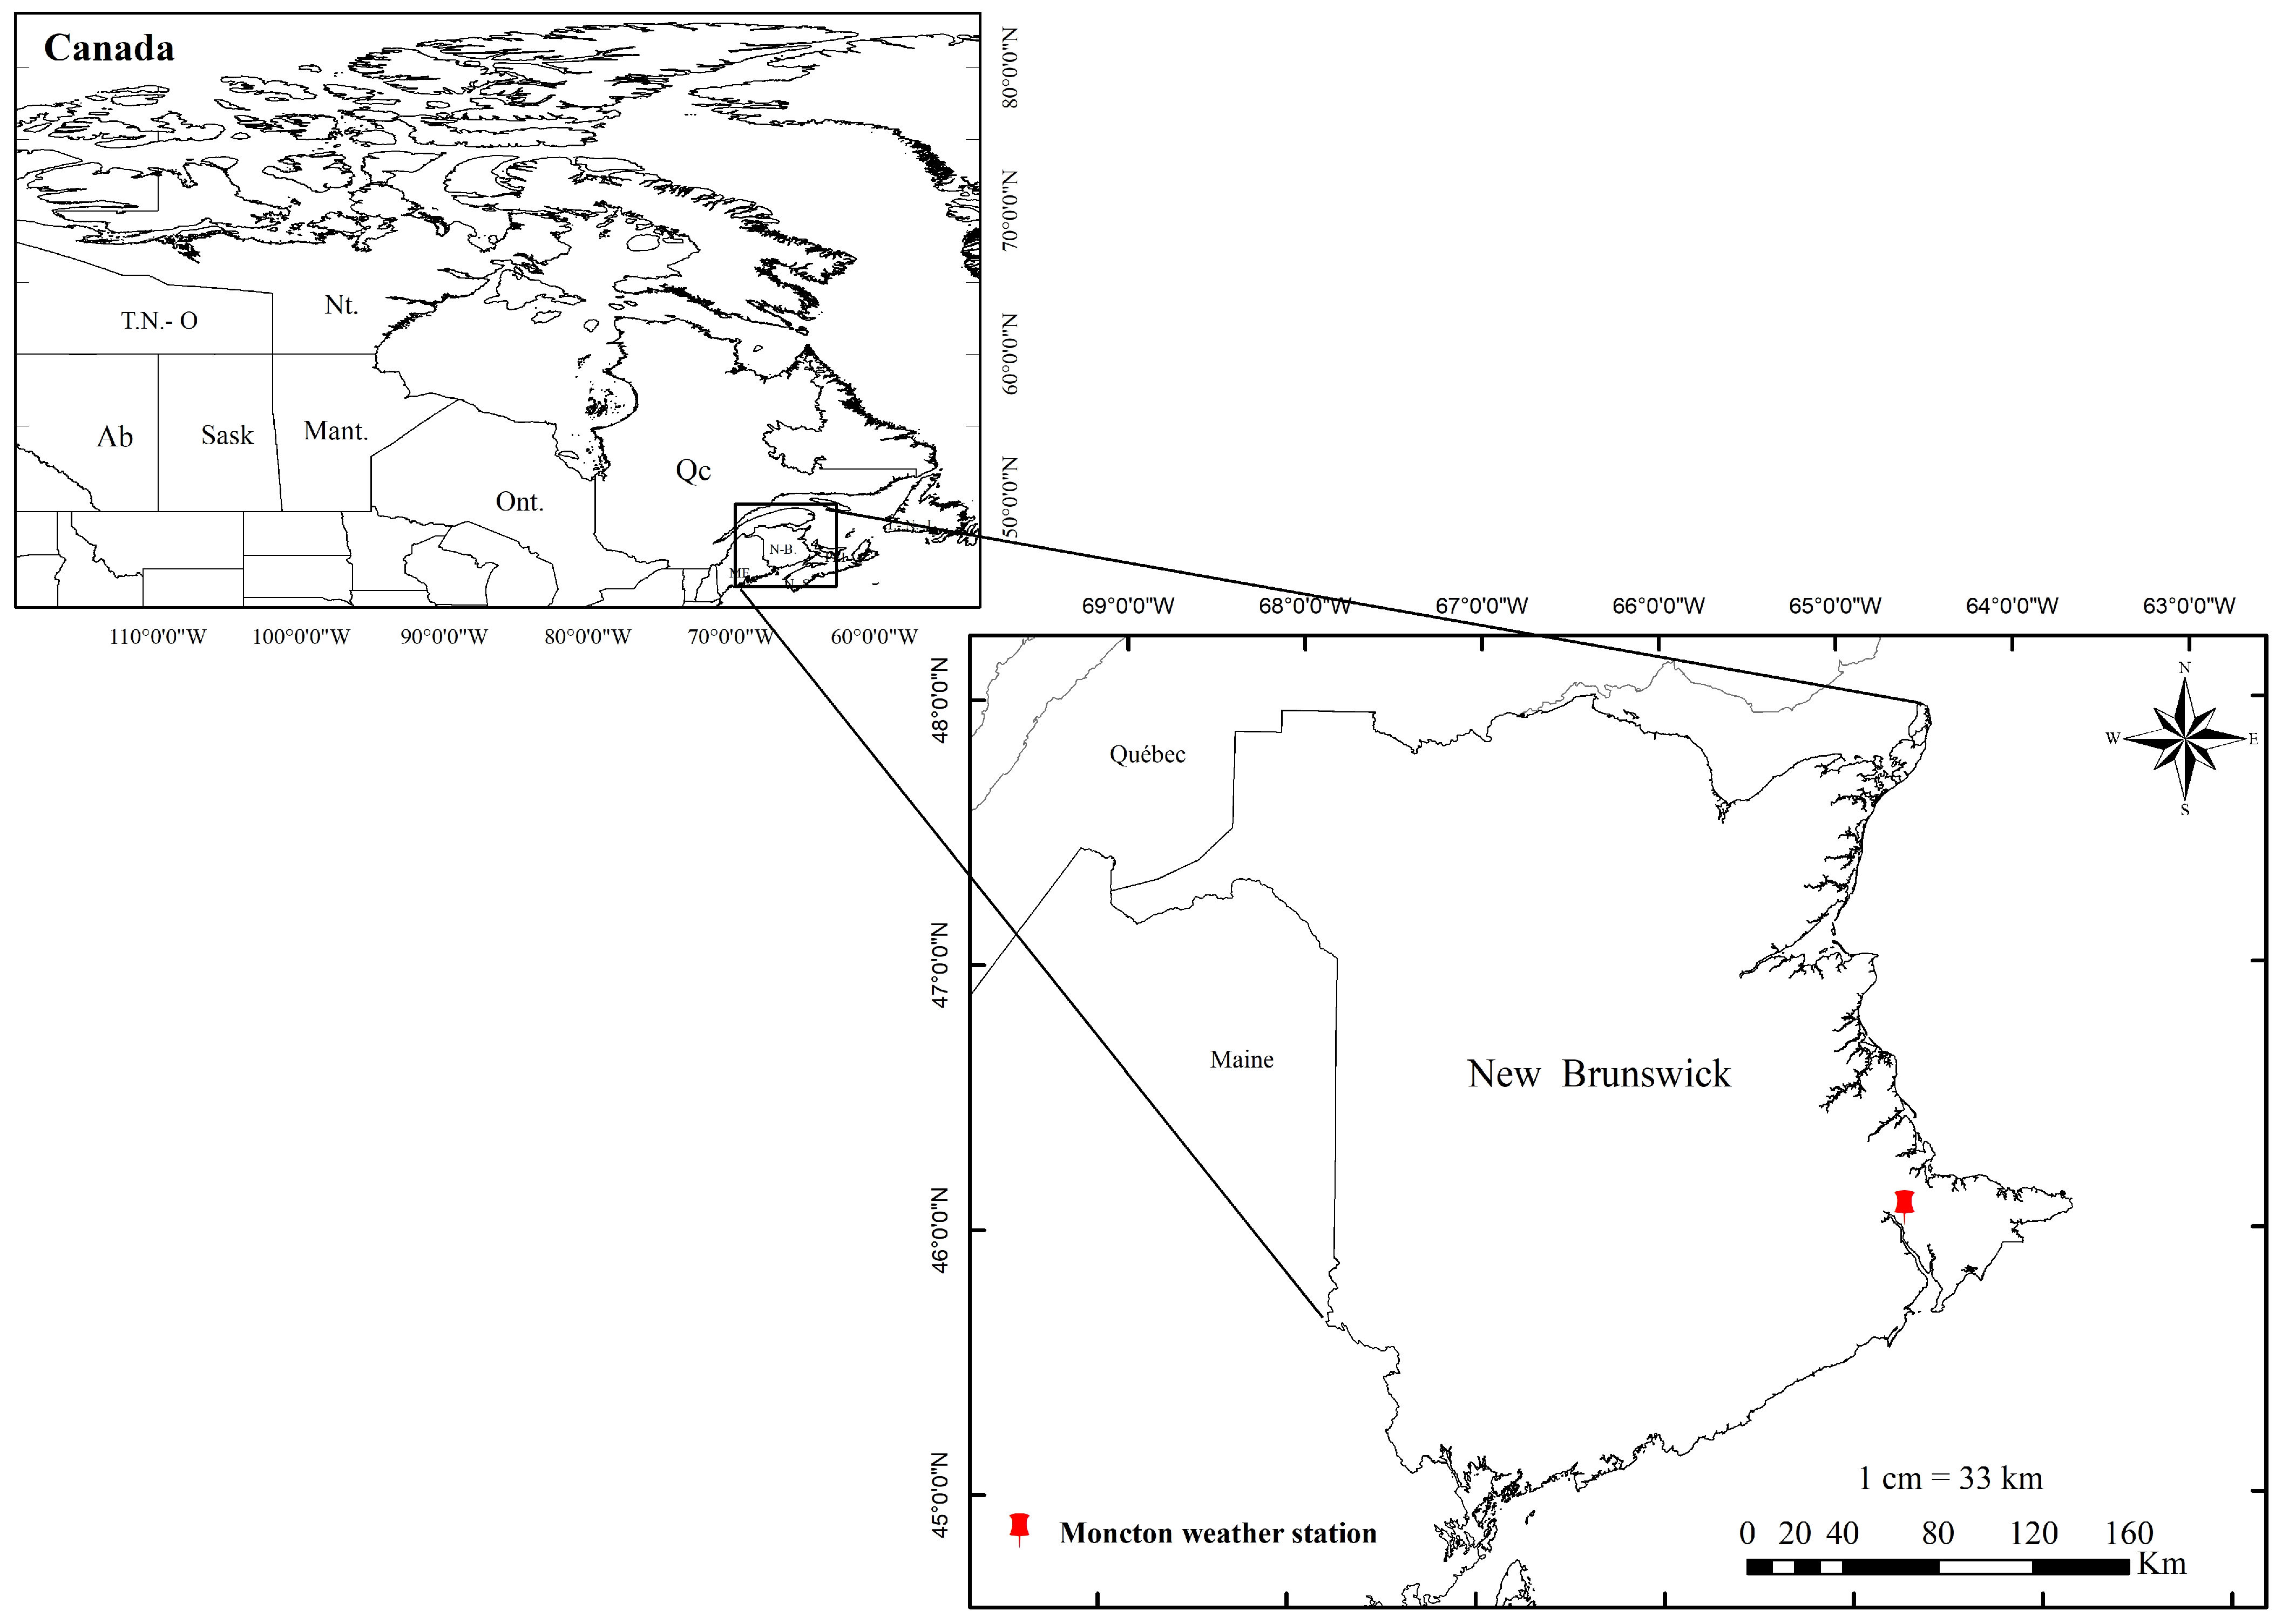
We applied the proposed models in this study to a set of rainfall data collected at the weather station in Moncton (New Brunswick, Canada), as illustrated in Figure 2).
Table 1 presents some characteristics of the studied station.
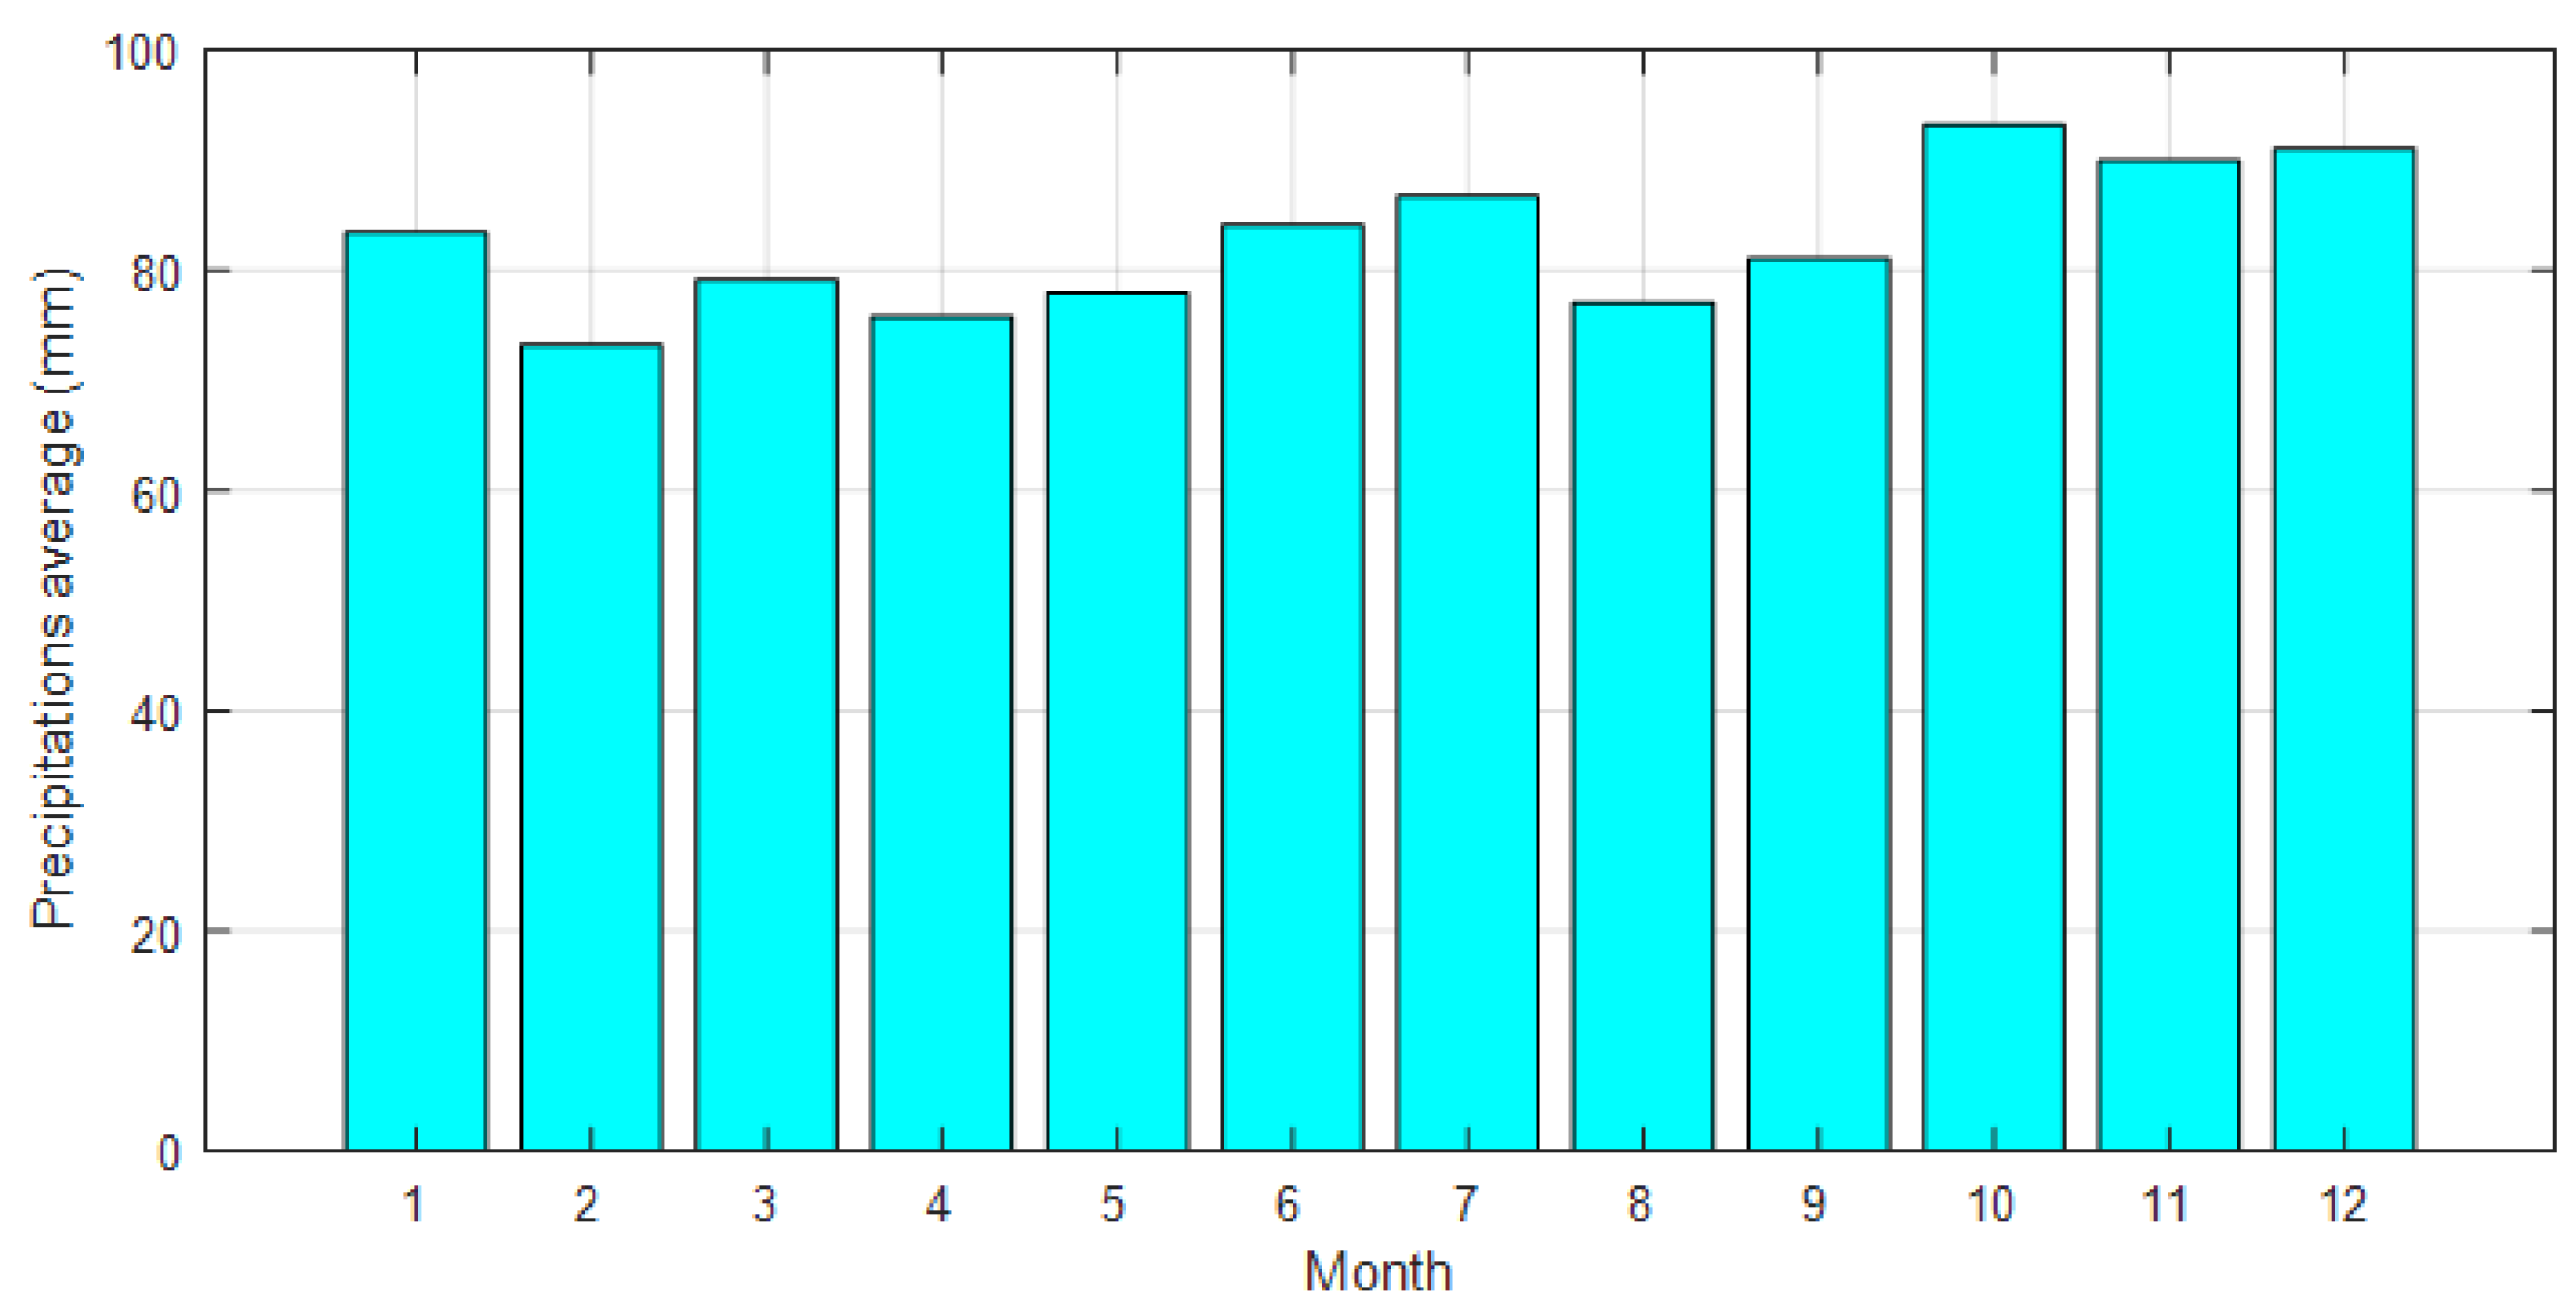
The city of Moncton is the largest city in its area and located in Westmorland County in the southeastern part of the province of New Brunswick (eastern Canada). The study area is limited to the east by the Gulf of St Lawrence (or the Atlantic Ocean), to the south by the Petitcodiac River, and to the southeast by the province of Nova Scotia. The region is fairly flat with a maximum elevation of around 70 m above the ocean level. According to the Köppen climate classification, the study area is characterized by a humid, continental climate with large seasonal variations in temperature and an average precipitation of 1146 mm/year that is almost uniformly distributed over the rainy period of the year (May–October) (see Figure 3).
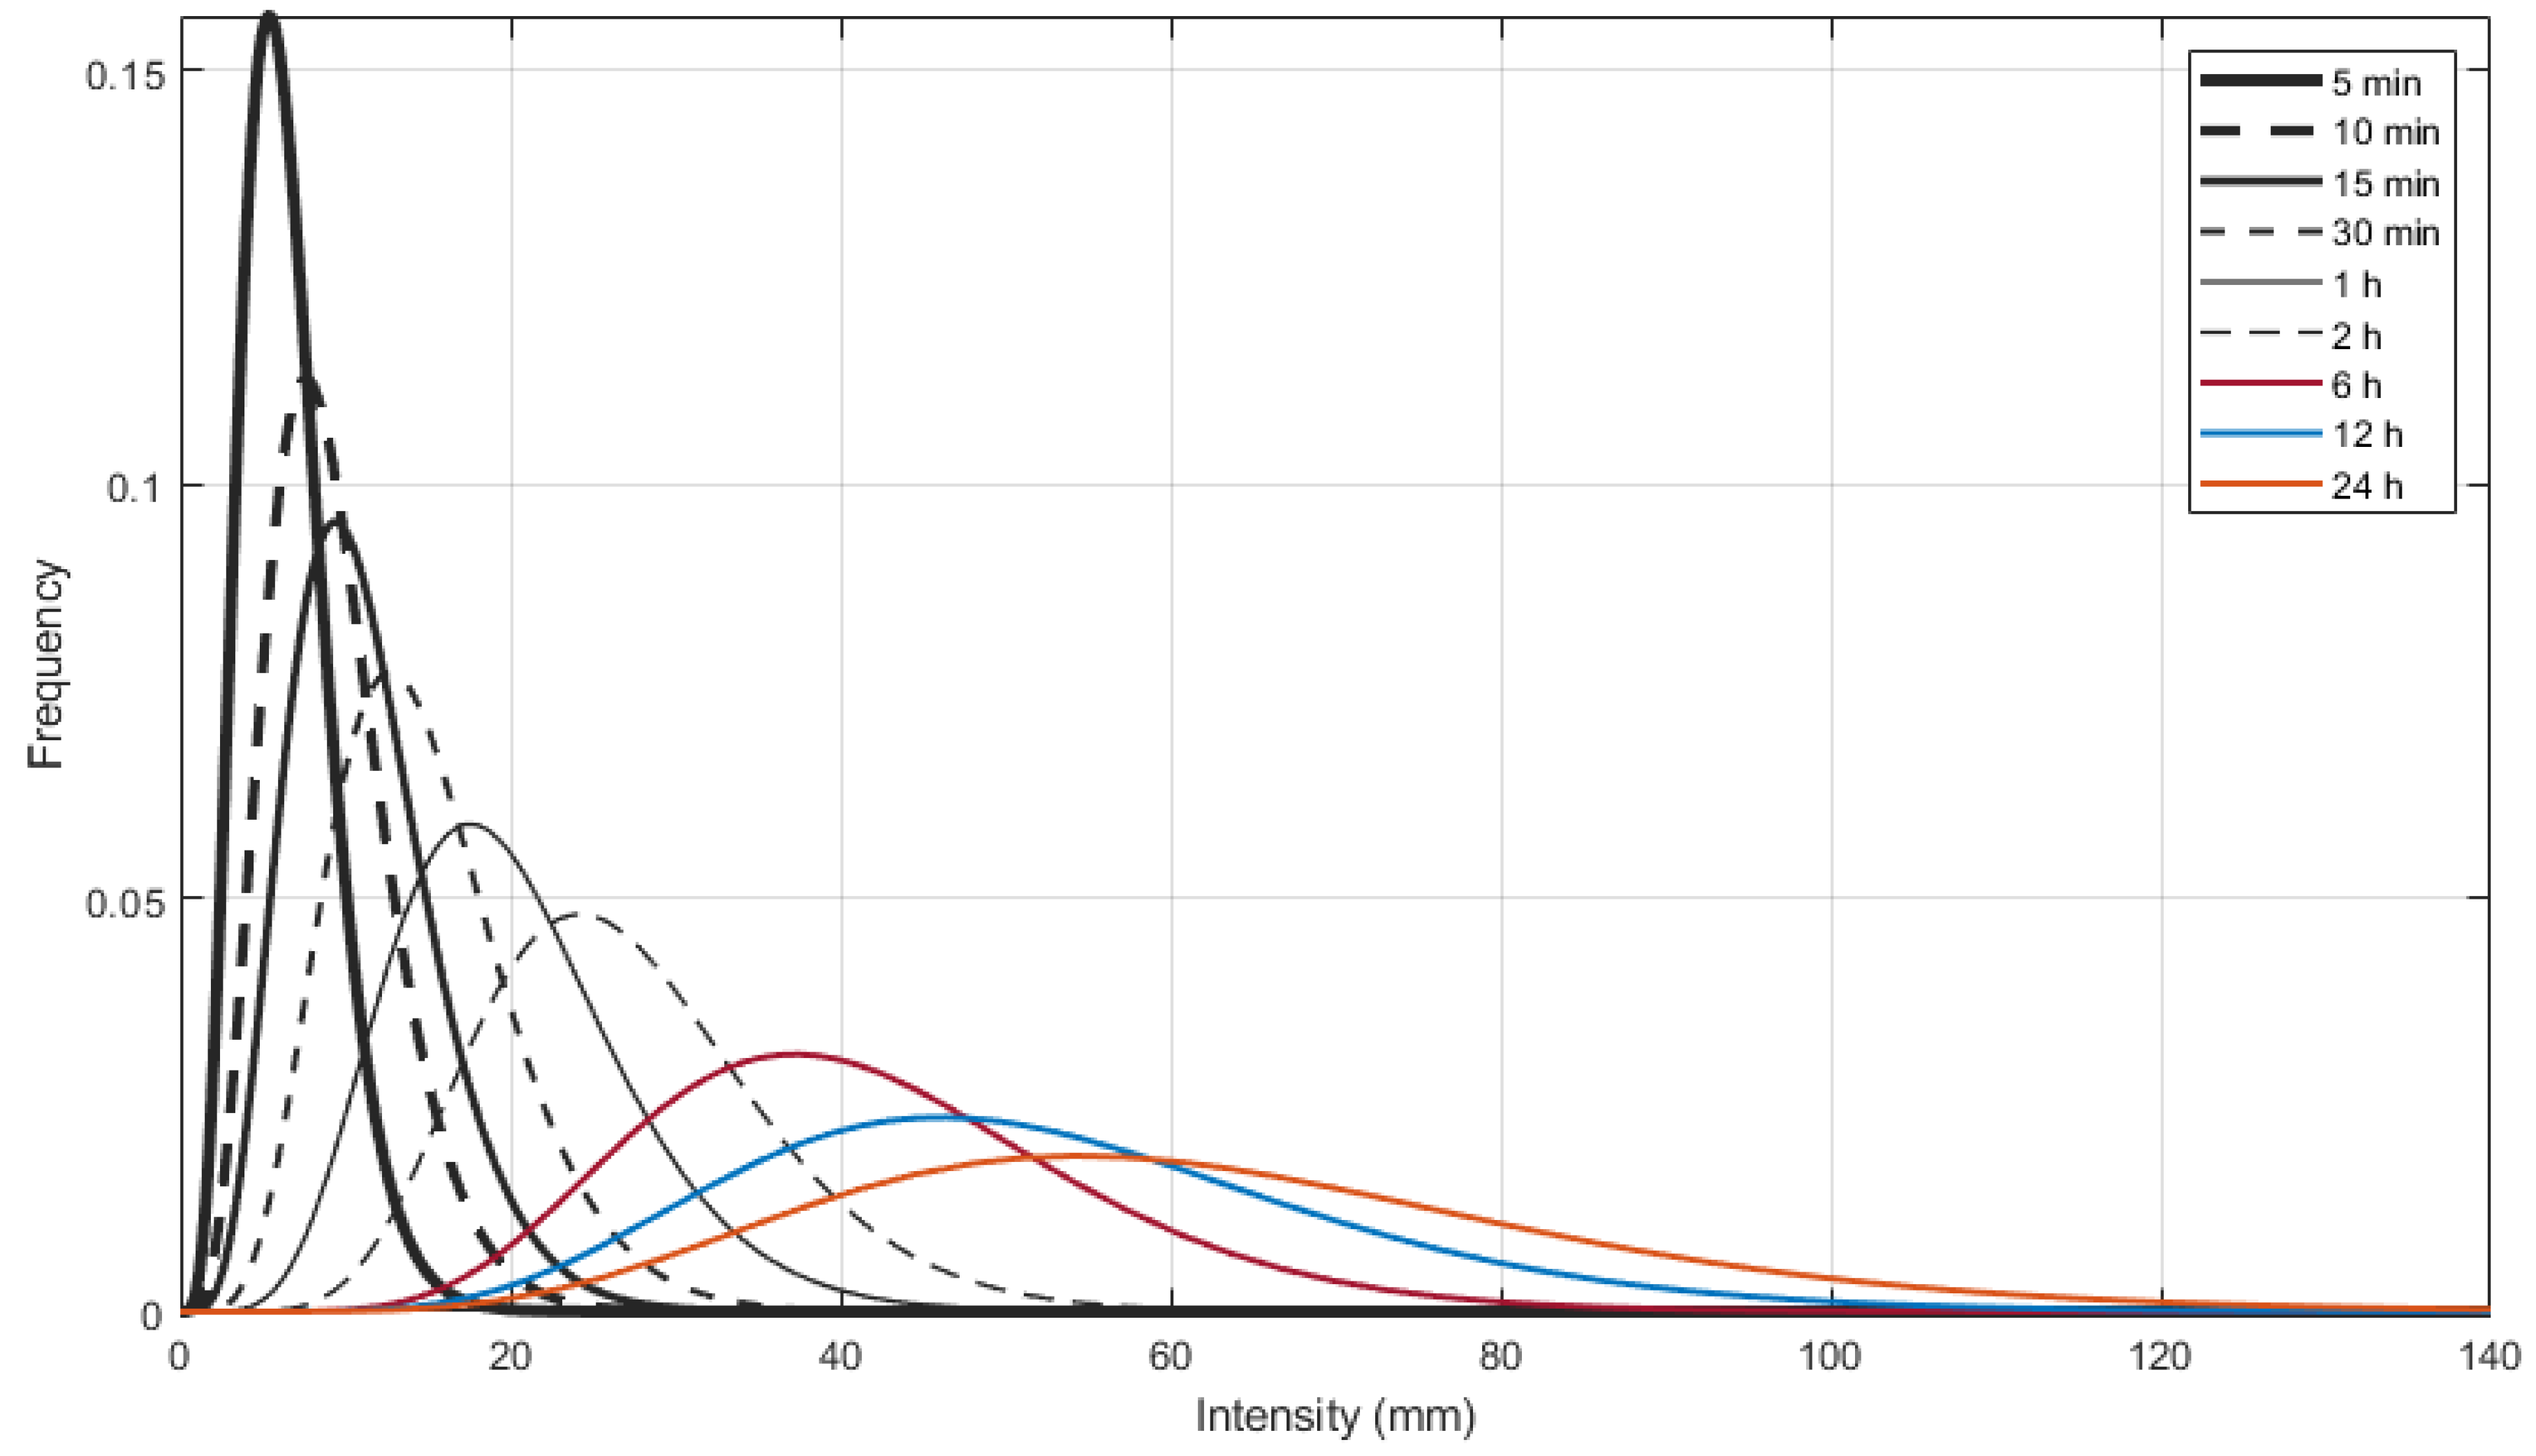
As for the used data, we analyzed the AMS of the rainfall intensities of the available aggregation durations ( d 1 = 5 min; d 2 = 10 min; d 3 = 15 min; d 4 = 30 min; d 5 = 1 h; d 6 = 2 h; d 7 = 6 h; d 8 = 12 h and d 9 = 24 h). These data are accessible through the website of Environment and Climate Change Canada (ECCC): https://climate.weather.gc.ca/prods_servs/engineering_e.html (accessed on 12 July 2022). A graphical visualization of the collected samples is shown in Figure 4.
As a notation, two time ranges were used for one of the two approaches used in this study. The intrahourly data were used to designate the AMS of durations d 1 = 5 min, d 2 = 10 min, d 3 = 15 min, and d 4 = 30 min, and the hourly data were used to designate that of durations d 5 = 1 h, d 6 = 2 h, d 7 = 6 h, d 8 = 12 h, and d 9 = 24 h.

4. Results and Discussion

4.1. Quantile Estimation and Comparison

For the two approaches used in this study, we started by estimating rainfall quantiles of different durations corresponding to certain return periods. The return periods considered in this study were T = 2 , 5 , 10 , 25 , 50 , and 100 years.
First, the quantiles denoted by i G E V T , were estimated by solving Equation (4) based on the parameters of the GEV distribution of the nine used durations. The intrahourly quantiles ( d 30 min), denoted by i c o p T , were conditionally re-estimated by the resolution of Equation (A2).
Note that, to cover different possible dependency ranges between the variables in use, we used Archimedean copulas with one parameter (Clayton, Frank, Gumbel, and Joe) and with two parameters (BB7 and BB8) as well as the Gaussian copula. In Table 2, we summarize the copulas and conditional copulas of each of the edges of the D-vine trees obtained by the minimal AIC and whose parameters were estimated by the MLE. Let us notice the similarities in the copulas for all edges non-related to the first node, i.e., the node corresponding to the short duration that varies each time.
To compare the intrahourly quantiles resulting from the two analyses, we calculated, for example, the relative difference Δ between each pair of quantiles with a specified return period T. The relative difference is expressed by:
Δ = i c o p T i G E V T i G E V T × 100 %
Small values of Δ (close to zero) indicate a slight difference between the short duration quantiles resulting from the two approaches. This difference is even more meaningful for high Δ values. Table 3 brings together the estimation and comparison results.
For hourly durations (1, 2, 6, 12, and 24 h), the quantiles were estimated marginally for the whole study. Table 4 shows the calculation results.
The lower and upper bounds of the confidence interval (CI) were also obtained from a re-sampling method that was applied to the quantiles estimated using the GEV distribution. It is interesting to compare the values of the i G E V T and i c o p T quantiles after taking into account the CIs.
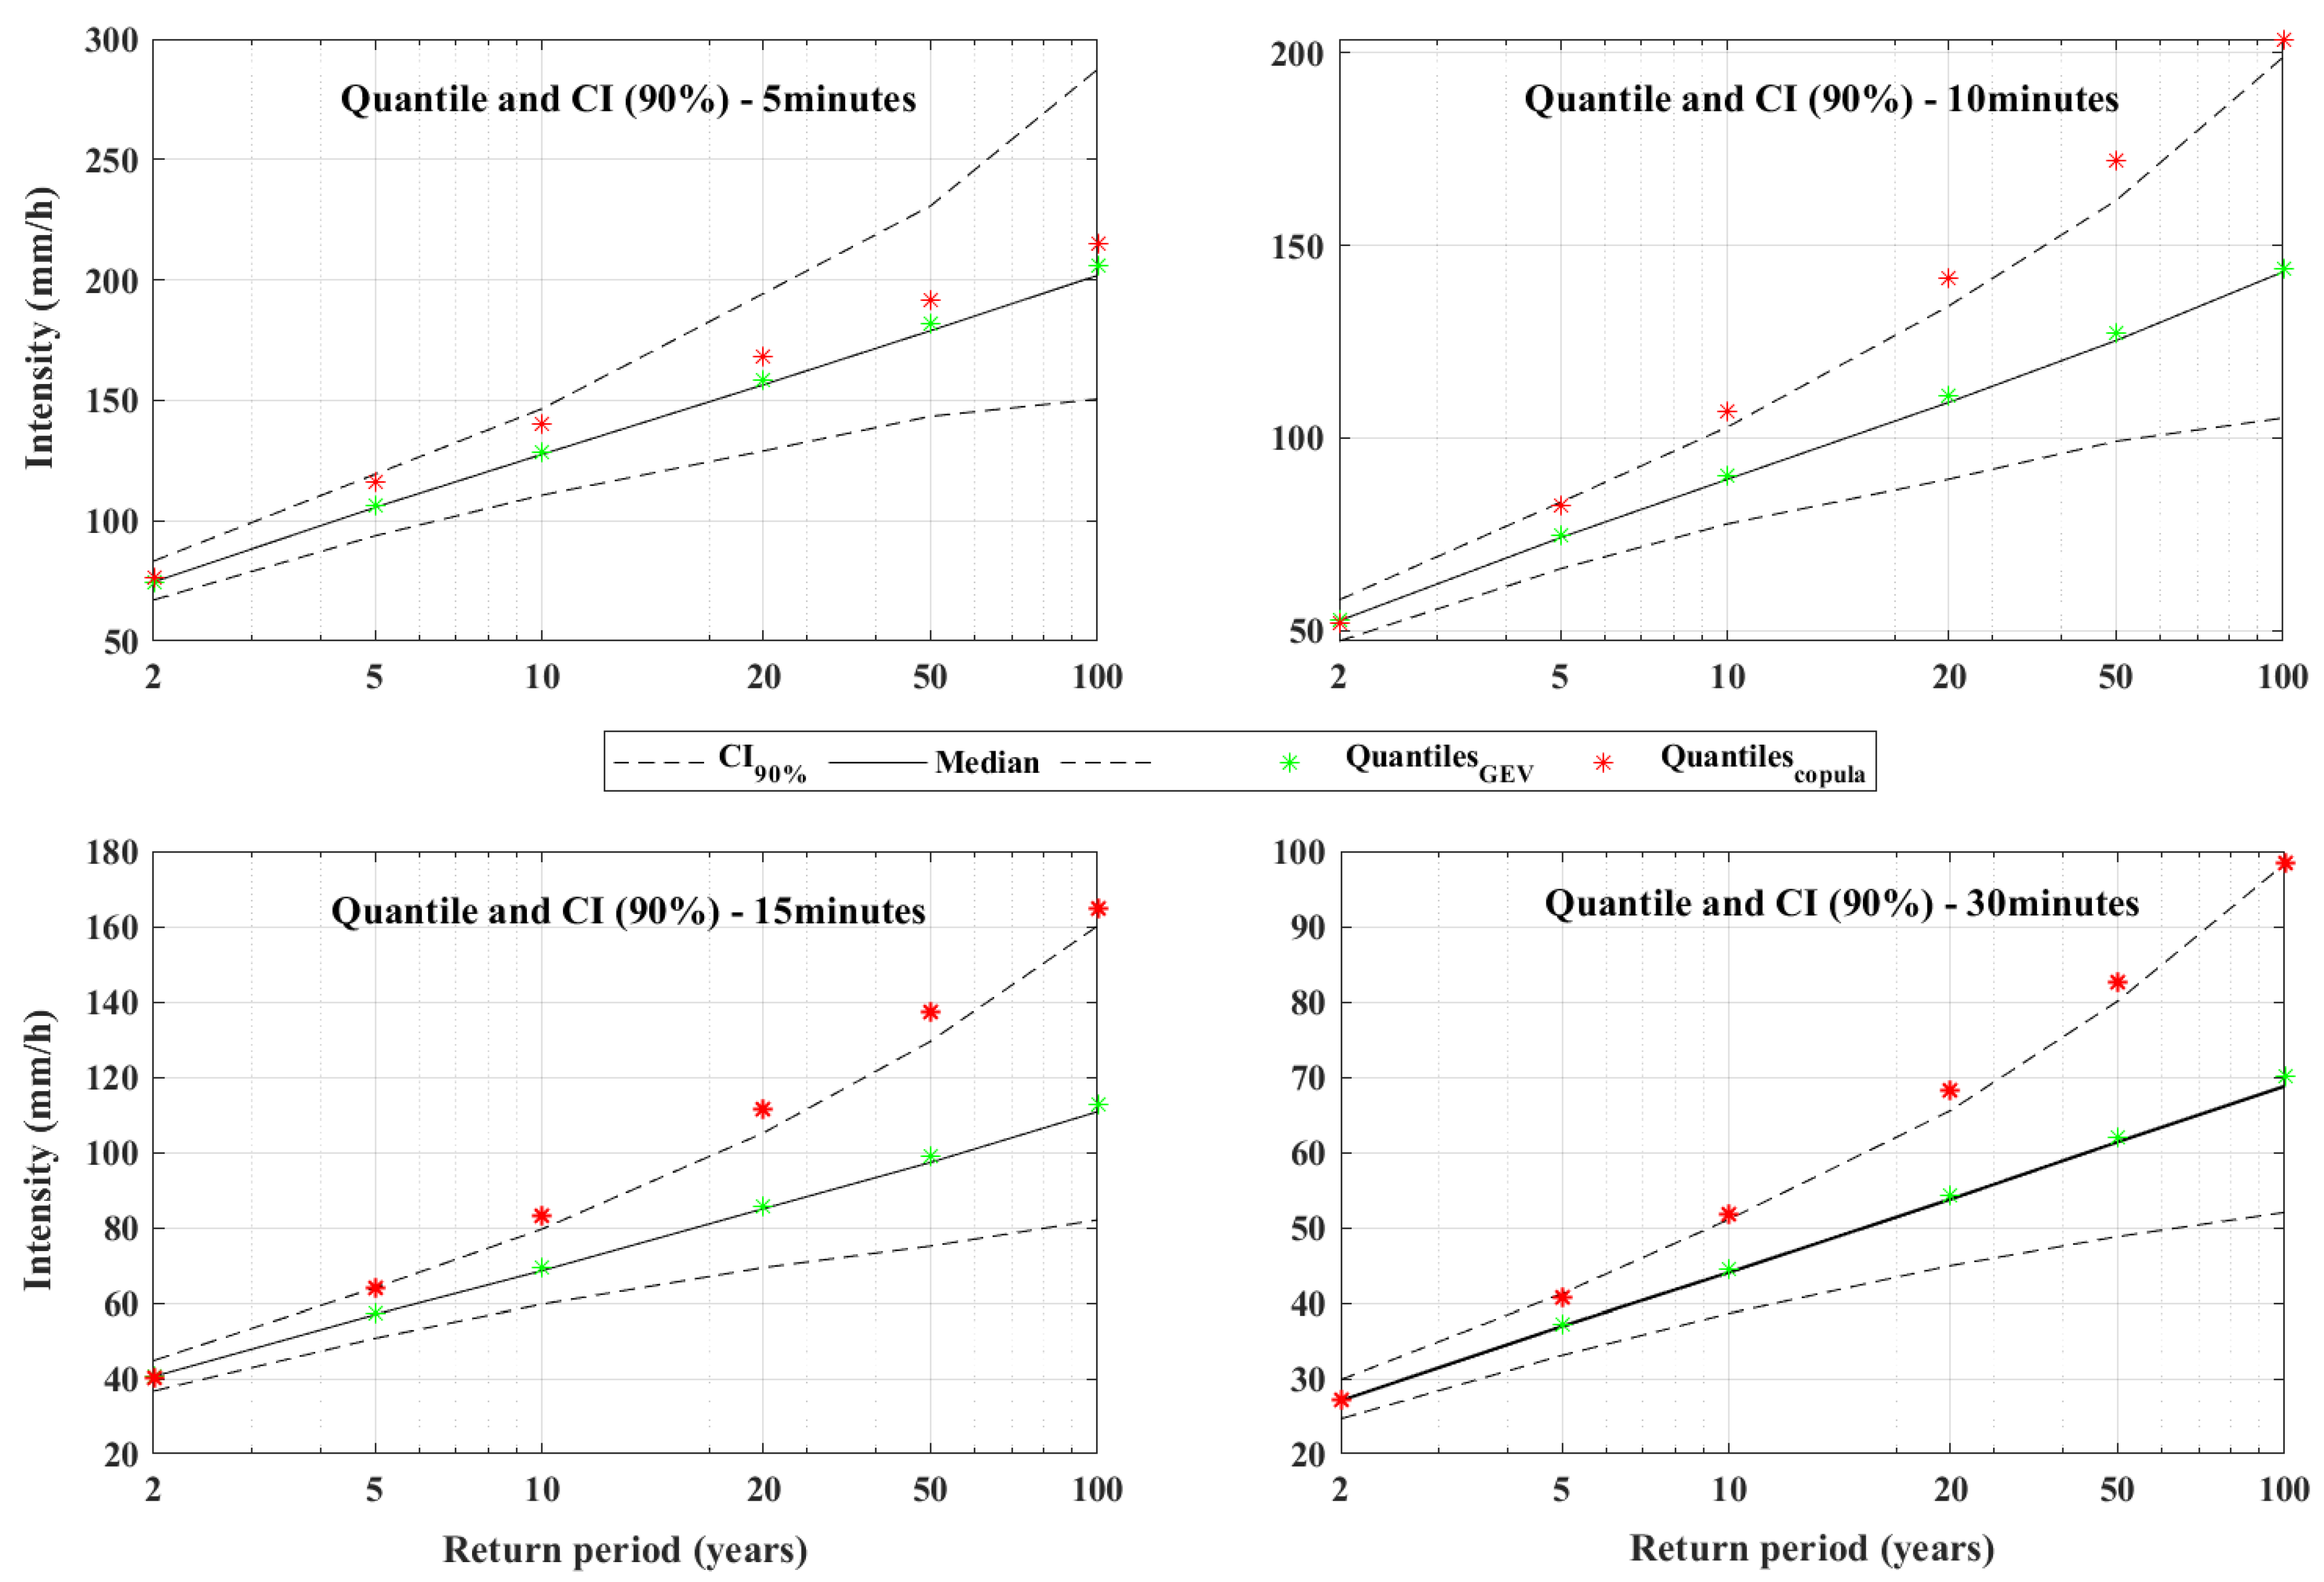
Figure 5 shows the subhourly quantiles (5 to 30 min) and the CIs. The values for the return period, T, considered in this analysis were 2, 5, 10, 20, 50, and 100 years.
Table 3 and Figure 5 show that the gaps tended to increase rapidly with the return period for all durations, except for 5 min. For example, the difference between the independent model and the proposed multivariate model quantiles varied between 1.2 % (15 min) and 2.7% (5 min) for the shortest return period (2 years), while it had an interval of 4.3% (5 min) to 31.6% (15 min) for the highest return period (100 years). These results show that the D-vine copula multivariate approach reproduces the quantiles better for all return periods. This might be explained by the redundancy of information in the likelihood function Equation (2), when assuming independence and its effect on the parameter and quantile estimators. These differences are not without consequence for the estimation of the IDF curves based on the quantiles of the two approaches.
Furthermore, the quantiles for durations between 10 and 30 min estimated using the copula were even larger than the upper bound of the confidence interval associated with the classical model based on the GEV distribution for Moncton station’s dataset.

4.2. IDF Curve Estimation and Comparison

The IDF curves can then be deduced from the estimated quantiles for both approaches, GEV with the independent duration series ( I D F G E V shown in Equation (8)) and the multivariate model with the D-vine copula ( I D F C o p u l a shown in Equation (9)).
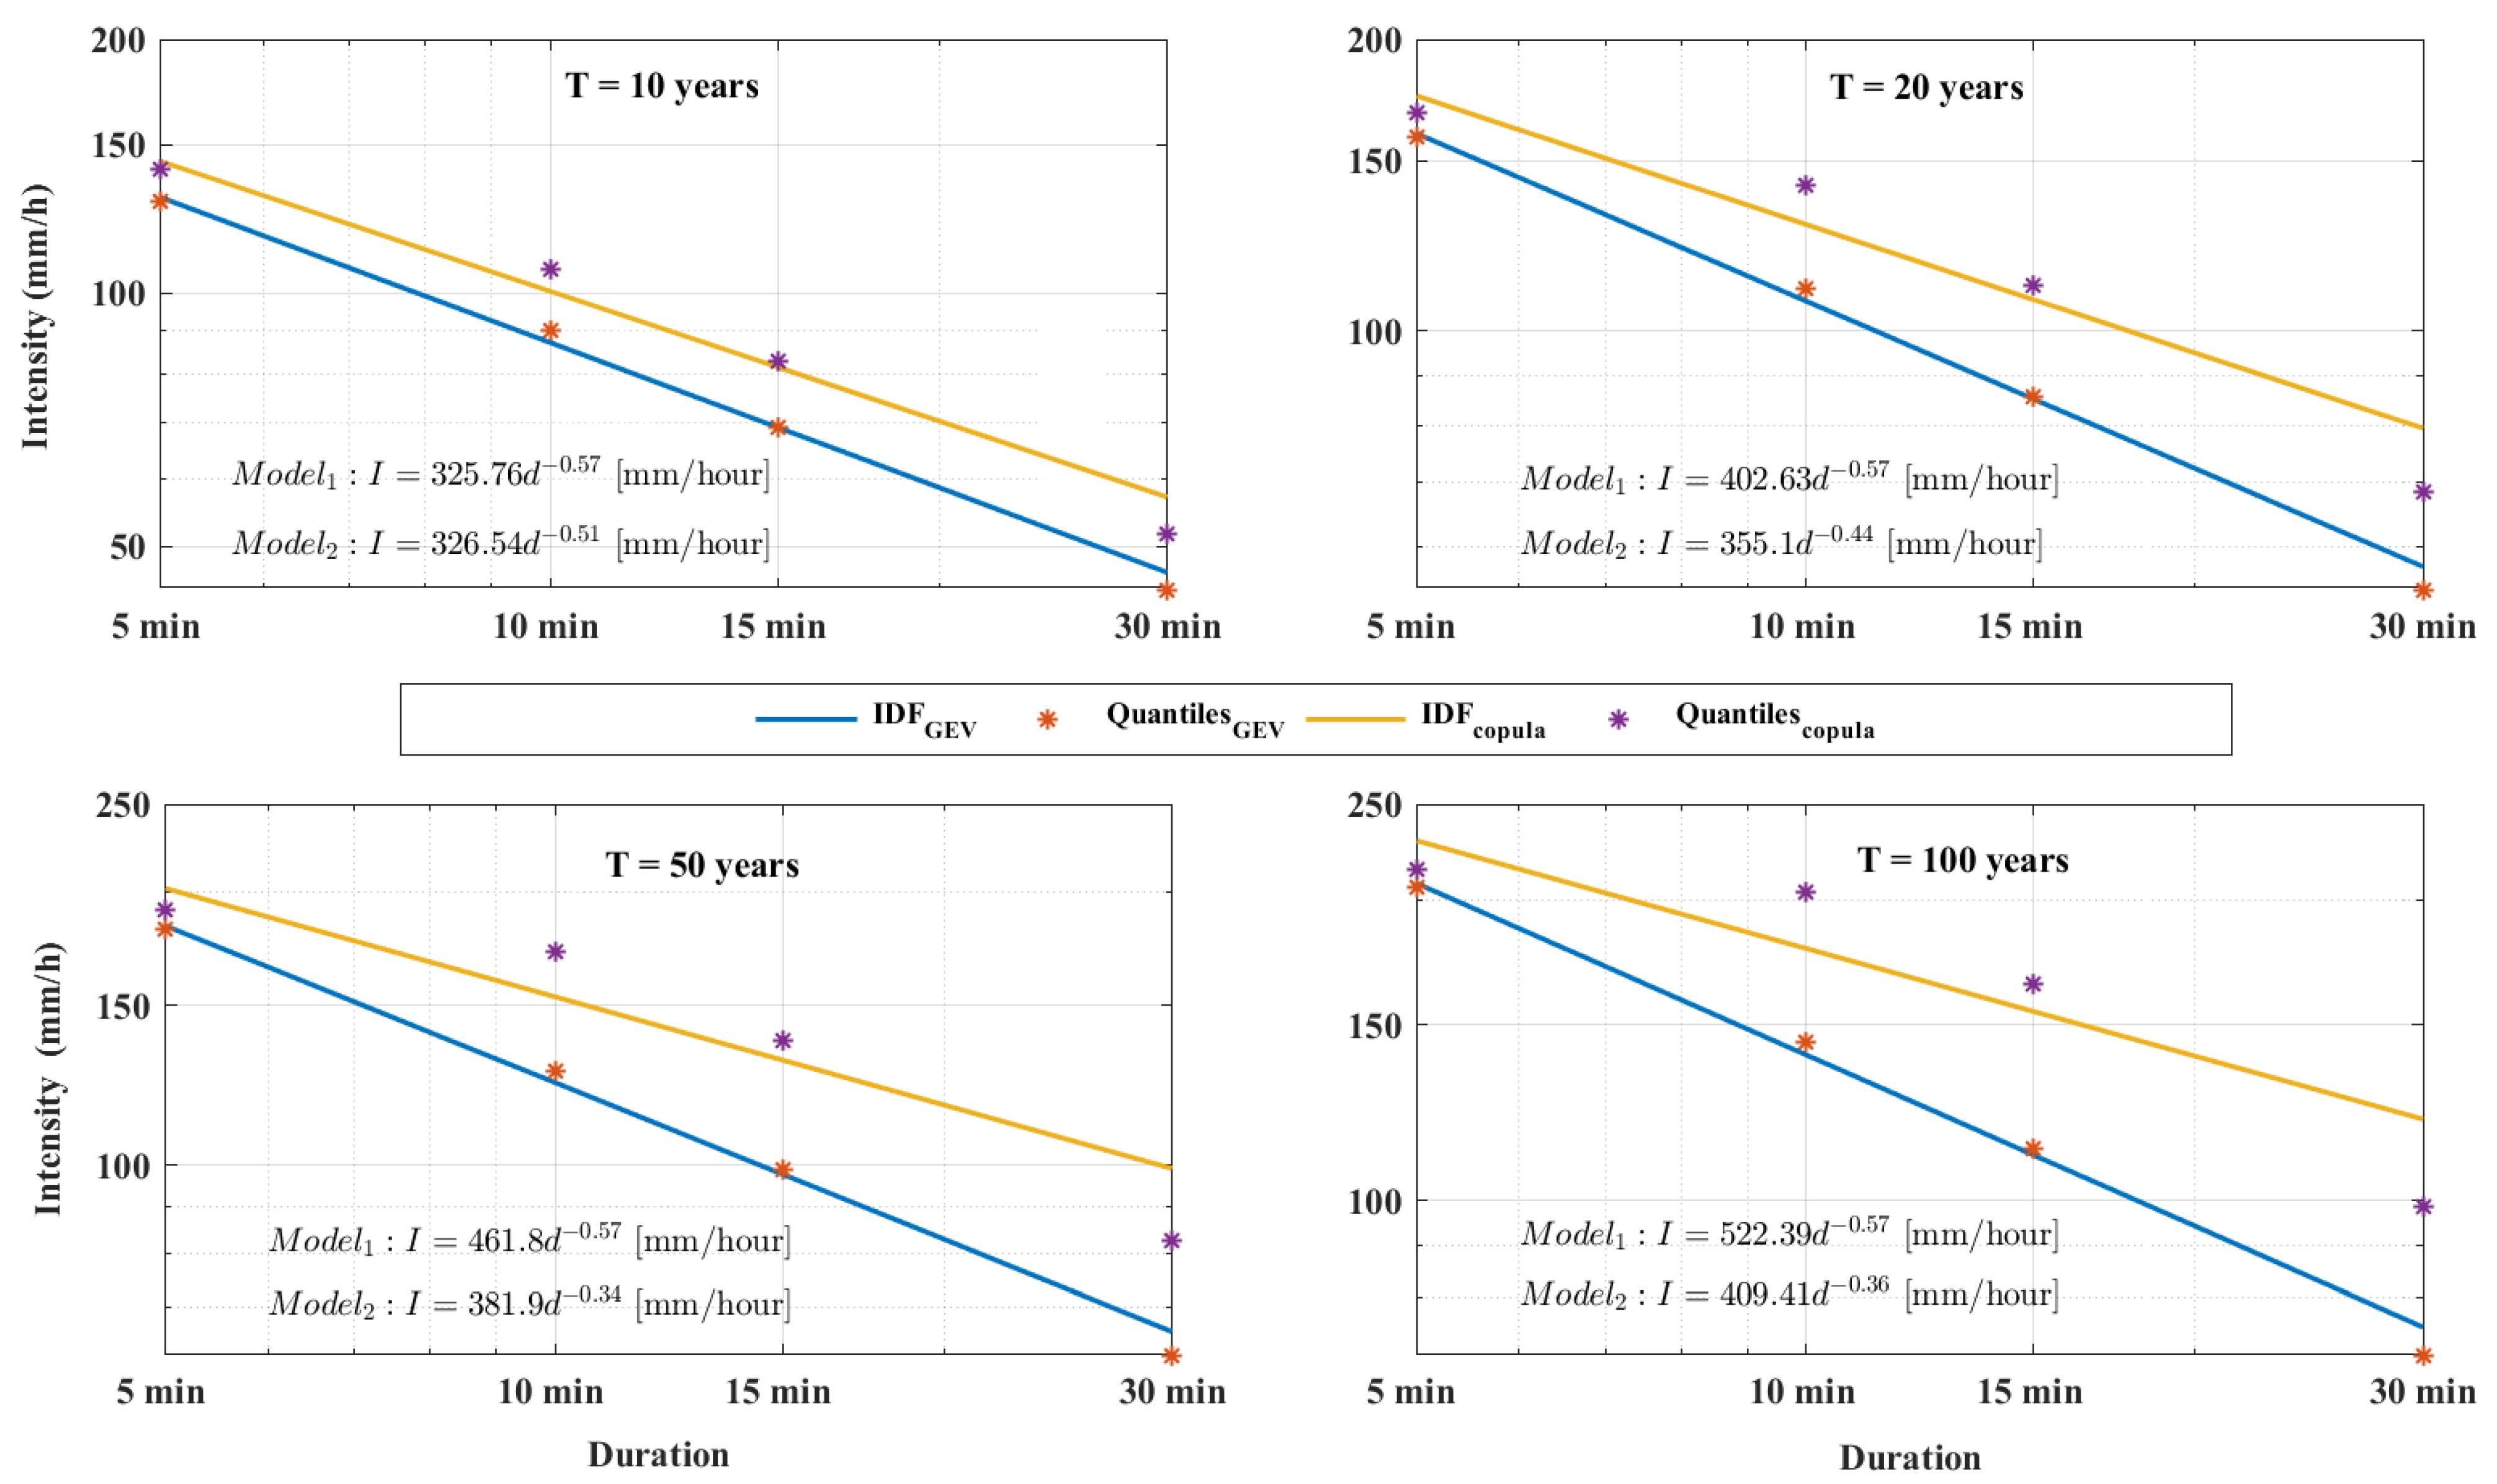
For the return periods (10, 20, 50, and 100 years), Figure 6 provides visual comparisons between the subhourly IDF curves drawn based on GEV quantiles and the IDF curves obtained using the copula method. Each of these subfigures was produced for a semi-log scale for the return period.
For almost all durations and return periods, the rainfall intensity quantiles estimated by the multivariate model I D F C o p u l a were larger than those obtained by the I D F G E V model. More precisely, this difference reached 41% for the return period of 100 years. The differences observed were of a statistical order, since the I D F G E V model is based on a dependent process and leads to underestimation of the quantiles. The most important discrepancies were observed for the subhourly durations which were estimated through conditional distributions.

5. IDF Projections for Global Climate Models (GCMs)

The proposed approach for IDF curves, with the same dependence structure, was applied to climate projections of simulated precipitations given by the Coupled Model Intercomparison Project version 5 (CMIP5; [39,40]).
CMIP5 multimodel ensemble data (http://climate-scenarios.canada.ca, (accessed on 7 June 2023); Canadian Climate Data & Scenarios 2017) were used for IDF curve estimation to assess the evolution of the precipitation components. Emission scenarios represent possible future atmospheric concentrations of greenhouse gases and aerosols based on plausible combinations of projected population growth, economic activity, energy intensity, and socioeconomic development. Representative Concentration Pathways (RCPs; [41]) are a set of emission scenarios that serve as the input for CMIP5 projections. The RCP scenarios range from a low emission scenario characterized by active mitigation (RCP2.6), to two intermediate scenarios (RCP4.5 and RCP6.0), to a high emission scenario (RCP8.5). IDF curve estimations were carried out for the 1950–2100 period using historical and RCP2.6, RCP4.5, and RCP8.5 forcing scenarios for Moncton city (Lat = 46.09; Long = −64.79). A spatial kriging was used to interpolate the estimated quantile using the four neighboring points on the grid.
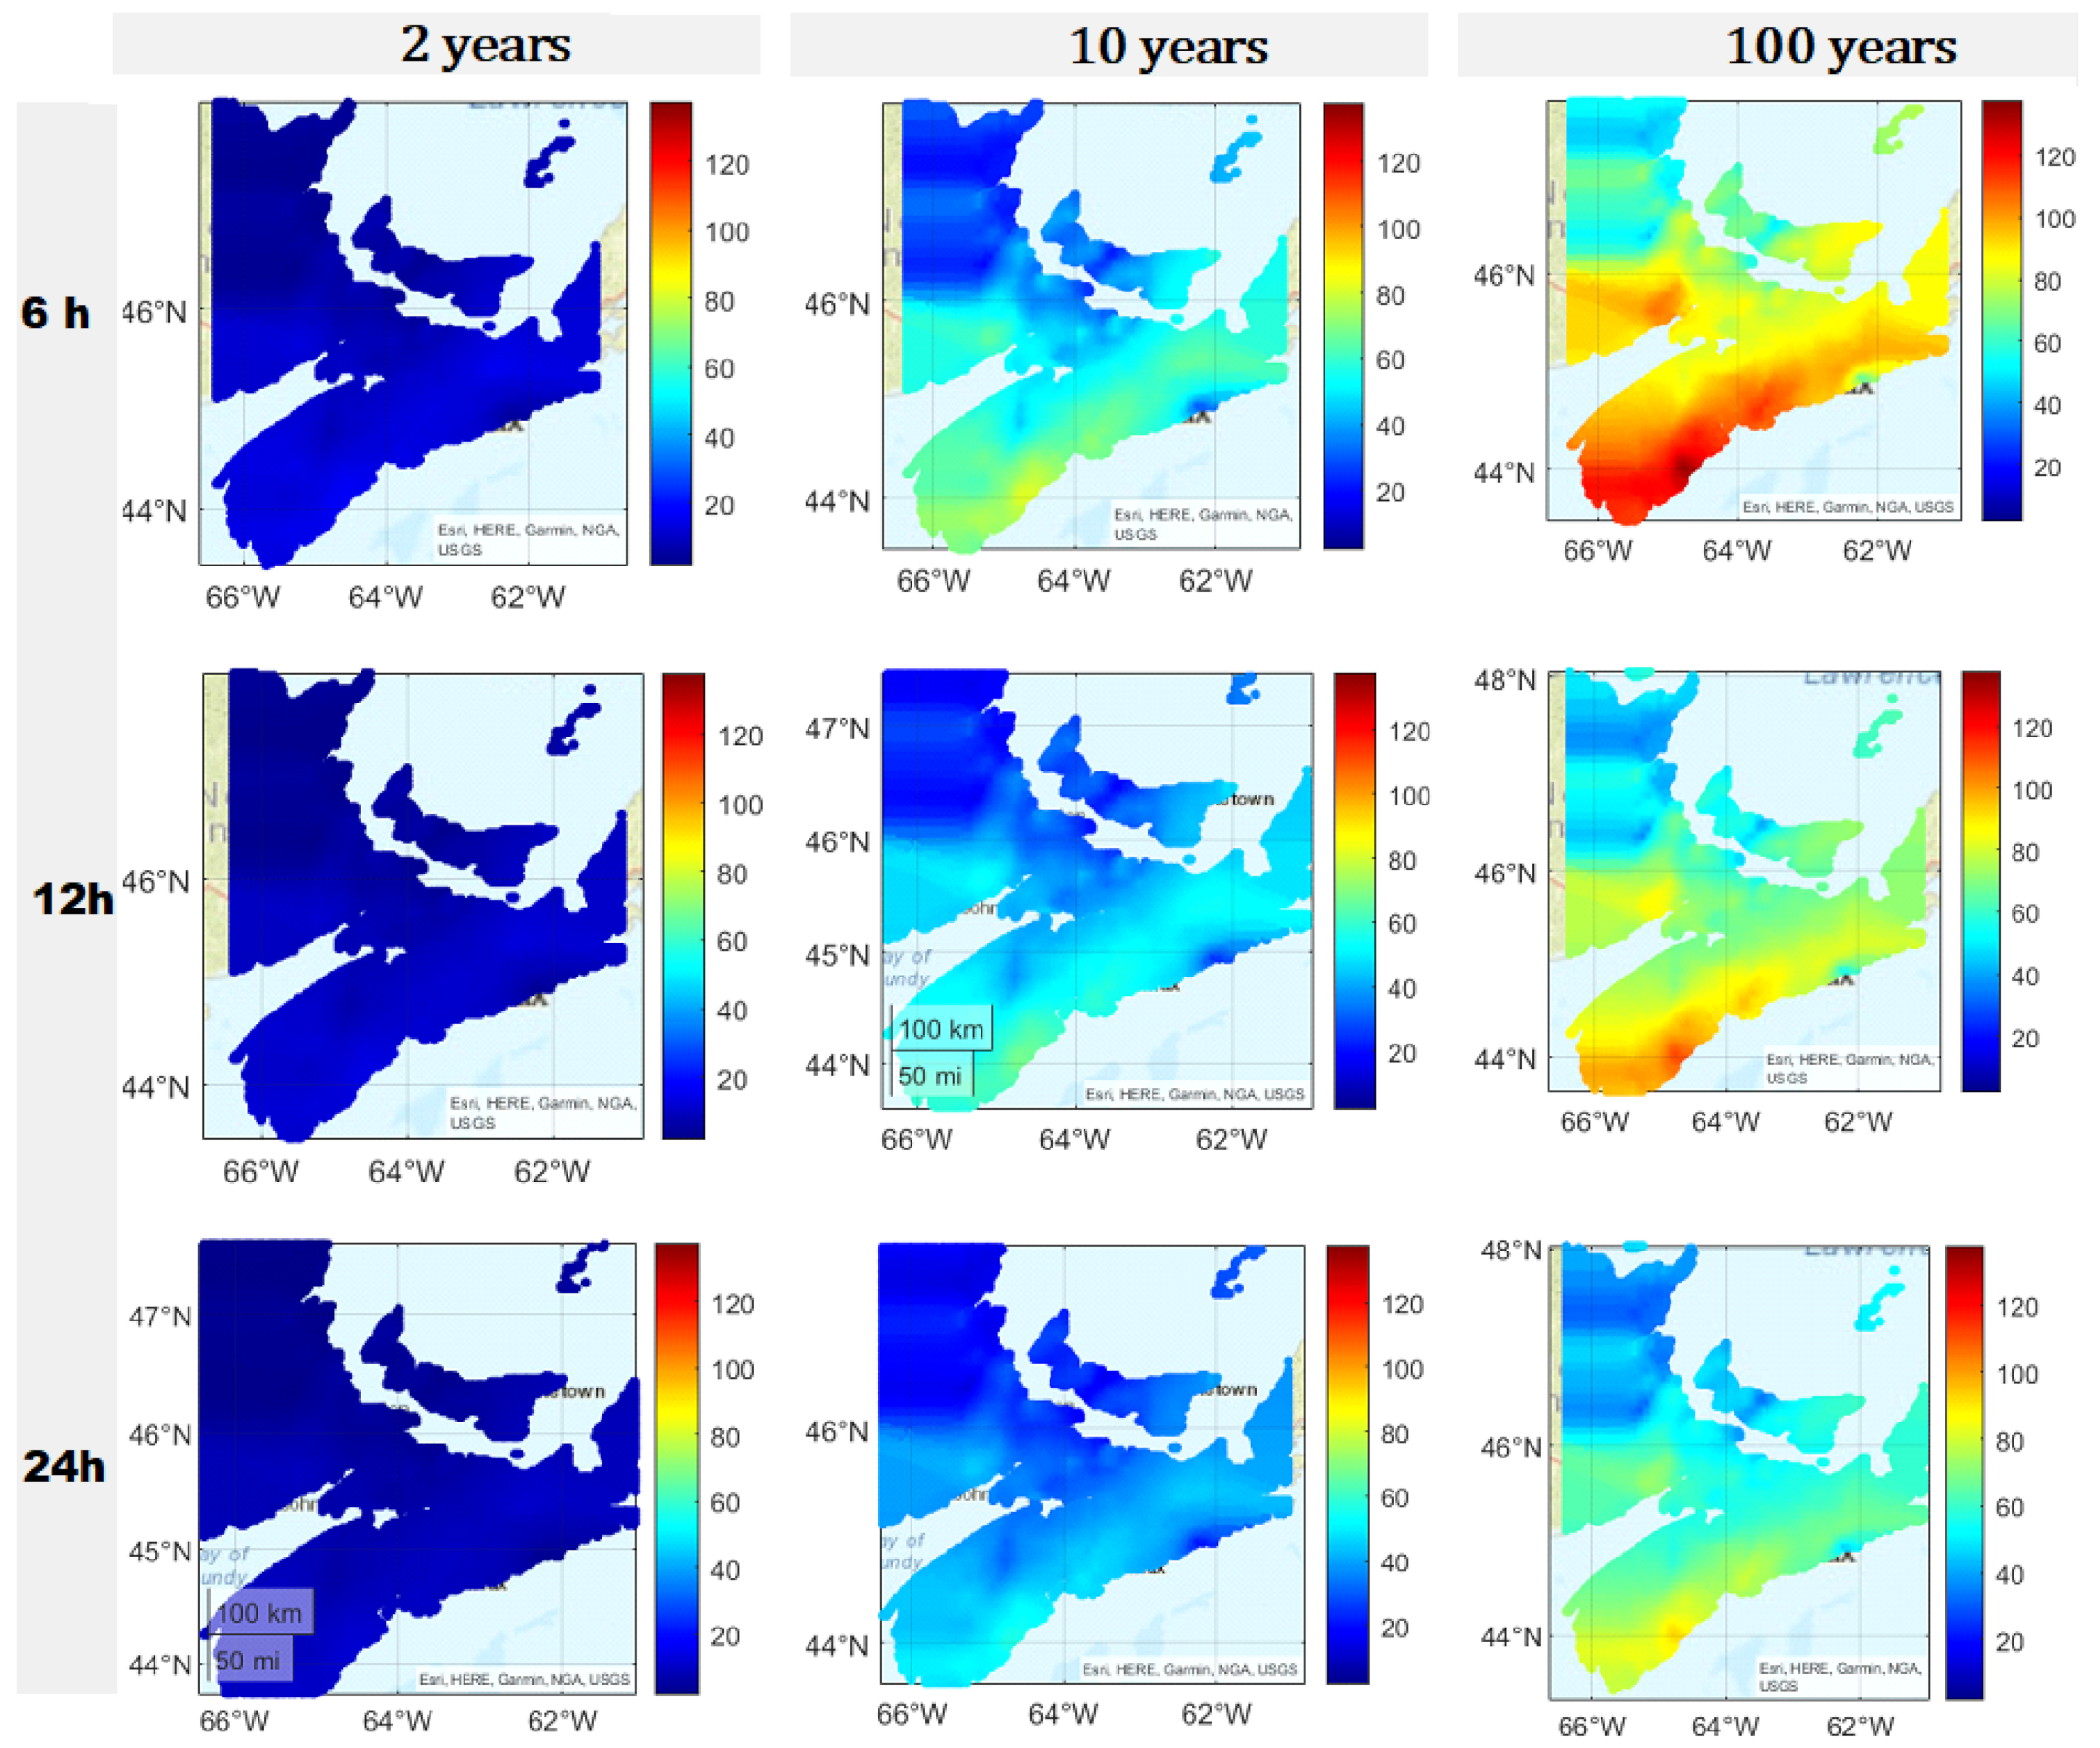
Figure 7 presents a spatial interpolation of the IDF curves for RCP2.6. The results show that the southern region of the Maritimes will be highly affected by the changes. Such conclusions confirm the vulnerability of coastal as well as mountainous regions [42,43], with high intensities occurring, especially for short durations, in the southern part of Nova Scotia. For the Moncton area, the intensities corresponding to return periods of 2, 10, and 100 years are given in Table 5 for comparison with the historical dataset model.
Table 6 shows that the main increases concerned small durations and high-return periods. High changes were associated with RCP4.5 and RCP8.5. RCP 2.6 is an optimistic scenario where strict adherence to GHG emission reductions is expected. The positive trend is most visible for the Moncton station, given the difference between precipitation depths for the expected projections and observed data for previous decades.
The projected IDF curves were developed for three RCP scenarios (RCP 2.6, RCP 4.5, and RCP 8.5) during the 2020–2099 period. The obtained IDF curves with all durations and three return periods (2, 10, and 100 years) are shown in Table 5 with illustrations for RCP 2.6 and some durations for the southeastern region of the Maritimes (Figure 7). For Moncton, the results show a higher increase in the short-duration rainfall intensity than in the long-duration rainfall intensity. Particularly, the increase would be higher for short-duration, high-return-period (RP) rainfall intensities. For example, the 2-year RP 5 min rainfall intensity will increase from 71 mm/h to 119 mm/h, while the 1 h rainfall intensity will increase from 17.9 mm/h to 19.9 mm/h for RCP 2.6. In contrast, the 100-year RP rainfall intensity will increase from 155 mm/h to 260 mm/h for the 5 min rainfall intensity, while it will increase from 33.2 mm/h to 43.4 mm/h for the 1 h rainfall intensity. The relative percentage changes revealed temporal evolution in the IDF curves (Table 6) ranging from 18 % (for long durations (over 6 h) and small RPs with RCP 2.6) to 89% (for short durations (5 min) and high RPs with the RCP 4.5 scenario). The largest changes were found for the RCP 4.5 scenario and short durations. The projected changes for the 1 h duration and 2-year RP were between 11 % and 21 % corresponding to scenarios RCP2.6 and RCP 4.5, respectively. For daily intensities, the projections predicted a decrease in the quantiles especially for the central part of the distribution (RP of 2 years). Changes varied from 16 % for RCP 2.6 and the 2-year and 10-year RPs to 3 % for RCP 4.5 and the 100-year RP.
The results of this study highlight the effect of the dependence structure of the annual maxima of the precipitation intensity for different durations. This dependence is due to precipitation types: convective, orographic, or cyclonic. Convective precipitation is generally stormy, of short duration (less than one hour), of high intensity, and of low spatial extension, such as that commonly observed in eastern Canada in the summer. Orographic precipitation is not “spatially mobile” and often occurs at the level of mountain ranges. Cyclonic precipitation is long and widespread but not very intense. This wide range of characteristics leads to a variety of dependence structures between intensities with different durations. To consider this correlated dataset, multivariate modeling should be used but simplified due to its complexity. The proposed vine copula offers high flexibility and a methodological construction of high-dimensional distributions by hierarchical decomposition into bivariate models. The proposed approach’s results demonstrate that current IDF curves generated with univariate distributions and independent datasets may not be the most robust for a given study area. As illustrated for the Moncton study area, the multivariate model produced stronger results and indicated possible underestimation of intensities by the simplified model based on the independence assumption. This raises an important general conclusion, which is that baseline IDF curves based on historical observed data are generated using a range of assumptions, and re-examination may be required considering these dependence structures and alterations in local precipitation regimes associated with the precipitation regimes. This should include the re-examination of marginal distribution functions as well as the copula model used for rainfall time series with closed durations. Based on the ensemble of results developed through this study, the dependence should be considered significant, resulting in a high level of differences concerning the duration and return period. This high level of variability is most significant for high-duration and moderate-to-high return period events. For example, for the 5 min to 30 min duration for 100-year storms, independent assumptions lead to relative underestimations of the quantiles from 12% to 46%, respectively. This is due to the high dependence between the 30 min duration extremes and those with a duration of over 1 h. Overall, the analysis conducted in this study showed larger variability in future IDFs for the Moncton area, suggesting that it would not be appropriate to assume the independence of datasets.

6. Conclusions

The modeling of meteorological extremes is an important step for decision makers for both the conception and the management of hydraulic and urban water resource structures. Statistical approaches are an essential tool for carrying out this modeling and providing the estimates with their uncertainties. Previous decades have seen a significant evolution in the development of these approaches to consider the problems of non-stationarity due to climate change and also the use of non-linear interpolation.
The estimation of the IDF curves is an important input for several water resource models and combines intensities for different durations with their probabilities of exceedance. The absence of data for short durations has oriented research towards the development of expressions to deduce IDF curves from subhourly observed intensities. The formulation is based on empirical studies with explicit expressions involving three parameters: intensity, duration, and frequency. These developments assume independence between series of different durations. This independence assumption, originally used to simplify the problem, is very strong and should be considered to develop realistic relationships between these quantities.
We considered vectors of rainfall series with durations of less than one hour (from 5 to 30 min) with other series for high durations (over 1 h). Indeed, data are often available for the extrahourly durations, and the multivariate model allows us to deduce the conditional distributions of series of short duration. Bivariate copulas have revolutionized the modeling of combined risk in several fields of applied statistics during the last two decades. The introduction of vine copulas makes it possible to generalize this notion to separate the marginal distribution selection and the dependence structures with high dimensionality. The vine copulas make it possible to decompose the multivariate distributions of these series into a hierarchical structure of bivariate models. There are different constructions of vines, such as D-vines, C-vines, and more generally, R-vines. Recently, these models have been considered in regression contexts to predict the conditional mean and conditional quantiles of a variable of interest, given other variables. In this work, we proposed a multivariate model based on D-vine copulas to represent the dependence structures between rainfall intensities of short durations and subhourly durations to deduce the conditional distribution.
We compared the predictive performance of the multivariate model and evaluated the predictive utility of vine copulas to account for dependencies between rainfall intensities for different durations.
To our knowledge, this is the first time that a multivariate model has been proposed to take into account the dependencies of intensities with different durations. The methodology was developed with the main equations of the multivariate model as well as the expressions of the conditional distributions. The Moncton airport meteorological station was considered to illustrate the proposed approach. Comparisons were made with the classical model based on the assumption of independence and the GEV distributions for all intensity series. The results show that this assumption of independence could lead to the underestimation of extreme intensities for short durations (10, 15, and 30 min) and especially for return periods of above 10 years.
We also applied the retained dependence structure to precipitations simulated by RCP (Representative Concentration Pathway) models for three scenarios. Comparisons with historical estimates for the Moncton station showed that the differences were very large for short durations. Note also that changes in the intensities for the following decades are very important, especially for short durations and high return periods. This augmentation is higher in the south of the province of Nova Scotia for all scenarios (RCP2.6, RCP4.5, and RCP8.5). All developments presented in the Appendix A and the Matlab codes are available on request from the authors. We consider that, even for engineering implementation, there is no excuse for using a realistic model instead of imposing very strong assumptions for simplicity needs.

Author Contributions

Conceptualization, A.Z. and S.-E.E.A.; Data curation, A.B.M.; Formal analysis, W.E.H. and S.-E.E.A.; Investigation, W.E.H.; Methodology, A.B.M., A.Z. and S.-E.E.A.; Writing— original draft, W.E.H., A.B.M. and S.-E.E.A.; Writing—review & editing, A.B.M. and A.Z. All authors have read and agreed to the published version of the manuscript.

Funding

This work was supported by the Natural Sciences and Engineering Research Council of Canada (NSERC) through individual grants to Pr. Salah El Adlouni (NSERC- RGPIN-2019-05746).

Institutional Review Board Statement

Not applicable.

Informed Consent Statement

Not applicable.

Data Availability Statement

Historical and simulated precipitation data used in this study are available on the official site of Environment Canada (Environnement et Changement climatique Canada, 2022). Codes were developed by the authors. Direct requests for these codes can be made to Salaheddine El Adlouni (E-mail: [email protected]).

Acknowledgments

We acknowledge the financial support from the Natural Sciences and Engineering Research Council of Canada (NSERC) through individual grants to Salah El Adlouni (NSERC- RGPIN-2019-05746). We also acknowledge other financial support from the University Mohamed V, Rabat.

Conflicts of Interest

The authors have no relevant financial or non-financial interests to disclose.

Appendix A

For a D-vine on six nodes, we use the notations and methodology of [44] to write the quantile estimation of the last variable corresponding to d = 24 h. The conditional distribution of V given U 1 , U 2 , U 3 , U 4 , U 5 is:
C V / U 1 , U 2 , U 3 , U 4 , U 5 ( v / u 1 , u 2 , u 3 , u 4 , u 5 ) = h V / U 5 ; U 1 , U 2 , U 3 , U 4 C V / U 1 , U 2 , U 3 , U 4 ( v / u 1 , u 2 , u 3 , u 4 ) , C U 5 / U 1 , U 2 , U 3 , U 4 ( u 5 ) / u 1 , u 2 , u 3 , u 4 ) = h V / U 5 ; U 1 , U 2 , U 3 , U 4 h V / U 4 ; U 1 , U 2 , U 3 C V / U 1 , U 2 , U 3 v / u 1 , u 2 , u 3 , C U 4 / U 1 , U 2 , U 3 u 4 / u 1 , u 2 , u 3 , h U 5 / U 1 ; U 2 , U 3 , U 4 C U 5 / U 2 , U 3 , U 4 u 5 / u 2 , u 3 , u 4 , C U 1 / U 2 , U 3 , U 4 u 1 / u 2 , u 3 , u 4 = h V / U 5 ; U 1 , U 2 , U 3 , U 4 h V / U 4 ; U 1 , U 2 , U 3 h V / U 3 ; U 1 , U 2 C V / U 1 , U 2 ( v / u 1 , u 2 ) , C U 3 / U 1 , U 2 ( u 3 / u 1 , u 2 ) , h U 4 / U 1 ; U 2 , U 3 C U 4 / U 2 , U 3 ( u 4 / u 2 , u 3 ) , C U 1 / U 2 , U 3 ( u 1 / u 2 , u 3 ) , h U 5 / U 1 ; U 2 , U 3 , U 4 h U 5 / U 2 ; U 3 , U 4 C U 5 / U 3 , U 4 ( u 5 / u 3 , u 4 ) , C U 2 / U 3 , U 4 ( u 2 / u 3 , u 4 ) , h U 1 / U 4 , U 2 , U 3 C U 1 / U 2 , U 3 ( u 1 / u 2 , u 3 ) , C U 4 / U 2 , U 3 ( u 4 / u 2 , u 3 ) = h V / U 5 ; U 1 , U 2 , U 3 , U 4 h V / U 4 ; U 1 , U 2 , U 3 h V / U 3 ; U 1 , U 2 h V / U 2 ; U 1 ( C V / U 1 ( v / u 1 ) , C U 2 / U 1 ( u 2 / u 1 ) ) , h U 3 / U 1 ; U 2 ( C U 3 / U 2 ( u 3 / u 2 ) , C U 1 / U 2 ( u 1 / u 2 ) ) , h U 4 / U 1 ; U 2 , U 3 h U 4 / U 2 ; U 3 ( C U 4 / U 3 ( u 4 / u 3 ) , C U 2 / U 3 ( u 2 / u 3 ) ) , h U 1 / U 3 ; U 2 ( C U 1 / U 2 ( u 1 / u 2 ) , C U 3 / U 2 ( u 3 / u 2 ) ) , h U 5 / U 1 ; U 2 , U 3 , U 4 h U 5 / U 2 ; U 3 , U 4 h U 5 / U 3 ; U 4 ( C U 5 / U 4 ( u 5 / u 4 ) , C U 3 / U 4 ( u 3 / u 4 ) ) , h U 2 / U 4 ; U 3 ( C U 2 / U 3 ( u 2 / u 3 ) , C U 4 / U 3 ( u 4 / u 3 ) ) , h U 1 / U 4 , U 2 , U 3 h U 1 / U 3 ; U 2 ( C U 1 / U 2 ( u 1 / u 2 ) , C U 3 / U 2 ( u 3 / u 2 ) ) , h U 4 / U 2 ; U 3 ( C U 4 / U 3 ( u 4 / u 3 ) , C U 2 / U 3 ( u 2 / u 3 ) ) = h V / U 5 ; U 1 , U 2 , U 3 , U 4 h V / U 4 ; U 1 , U 2 , U 3 h V / U 3 ; U 1 , U 2 h V / U 2 ; U 1 ( h V / U 1 ( v / u 1 ) , h U 2 / U 1 ( u 2 / u 1 ) ) , h U 3 / U 1 ; U 2 ( h U 3 / U 2 ( u 3 / u 2 ) , h U 1 / U 2 ( u 1 / u 2 ) ) , h U 4 / U 1 ; U 2 , U 3 h U 4 / U 2 ; U 3 ( h U 4 / U 3 ( u 4 / u 3 ) , h U 2 / U 3 ( u 2 / u 3 ) ) , h U 1 / U 3 ; U 2 ( h U 1 / U 2 ( u 1 / u 2 ) , h U 3 / U 2 ( u 3 / u 2 ) ) , h U 5 / U 1 ; U 2 , U 3 , U 4 h U 5 / U 2 ; U 3 , U 4 h U 5 / U 3 ; U 4 ( h U 5 / U 4 ( u 5 / u 4 ) , h U 3 / U 4 ( u 3 / u 4 ) ) , h U 2 / U 4 ; U 3 ( h U 2 / U 3 ( u 2 / u 3 ) , h U 4 / U 3 ( u 4 / u 3 ) ) , h U 1 / U 4 , U 2 , U 3 h U 1 / U 3 ; U 2 ( h U 1 / U 2 ( u 1 / u 2 ) , h U 3 / U 2 ( u 3 / u 2 ) ) , h U 4 / U 2 ; U 3 ( h U 4 / U 3 ( u 4 / u 3 ) , h U 2 / U 3 ( u 2 / u 3 ) )
By inverting, we obtain:
C V / U 1 , U 2 , U 3 , U 4 , U 5 1 α / u 1 , u 2 , u 3 , u 4 , u 5 = h V / U 1 1 h V / U 2 ; U 1 1 h V / U 3 ; U 1 , U 2 1 h V / U 4 ; U 1 , U 2 , U 3 1 h V / U 5 ; U 1 , U 2 , U 3 , U 4 1 α , h U 3 / U 1 ; U 2 h U 3 / U 2 ( u 3 / u 2 ) , h U 1 / U 2 ( u 1 / u 2 ) , h U 4 / U 1 ; U 2 , U 3 h U 4 / U 2 ; U 3 h U 4 / U 3 ( u 4 / u 3 ) , h U 2 / U 3 ( u 2 / u 3 ) , h U 1 / U 3 ; U 2 h U 1 / U 2 ( u 1 / u 2 ) , h U 3 / U 2 ( u 3 / u 2 ) , h U 5 / U 1 ; U 2 , U 3 , U 4 h U 5 / U 2 ; U 3 , U 4 h U 5 / U 3 ; U 4 h U 5 / U 4 ( u 5 / u 4 ) , h U 3 / U 4 ( u 3 / u 4 ) , h U 2 / U 4 ; U 3 h U 2 / U 3 ( u 2 / u 3 ) , h U 4 / U 3 ( u 4 / u 3 ) , h U 1 / U 4 ; U 2 , U 3 h U 1 / U 3 ; U 2 h U 1 / U 2 ( u 1 / u 2 ) , h U 3 / U 2 ( u 3 / u 2 ) , h U 4 / U 2 ; U 3 h U 4 / U 3 ( u 4 / u 3 ) , h U 2 / U 3 ( u 2 / u 3 ) , h U 2 / U 1 ( u 2 / u 1 ) , u 5 .
We proceed in a similar way to obtain the quantiles of d = 1 h, , 12 h by reducing the D-vine dimension and writing the appropriate quantile expressions each time.

References

  1. Miller, J.; Taylor, C.; Guichard, F.; Peyrillé, P.; Vischel, T.; Fowe, T.; Panthou, G.; Visman, E.; Bologo, M.; Traore, K.; et al. High-impact weather and urban flooding in the West African Sahel–A multidisciplinary case study of the 2009 event in Ouagadougou. Weather. Clim. Extrem. 2022, 36, 100462. [Google Scholar] [CrossRef]
  2. Kouassi, A.; Nassa, R.; Yao, K.; Kouame, K.; Biemi, J. Modélisation statistique des pluies maximales annuelles dans le District d’Abidjan (Sud de la Côte d’Ivoire). Rev. Des Sci. L’Eau/J. Water Sci. 2018, 31, 147–160. [Google Scholar] [CrossRef] [Green Version]
  3. Kingumbi, A.; Mailhot, A. Intensity-duration-frequency (IDF) curves: Comparison of annual maximum and partial duration estimators. Hydrol. Sci. J. 2010, 55, 162–176. [Google Scholar] [CrossRef]
  4. Gu, X.; Ye, L.; Xin, Q.; Zhang, C.; Zeng, F.; Nerantzaki, S.D.; Papalexiou, S.M. Extreme precipitation in China: A review. Adv. Water Resour. 2022, 163, 104144. [Google Scholar] [CrossRef]
  5. Koutsoyiannis, D.; Kozonis, D.; Manetas, A. A mathematical framework for studying rainfall intensity-duration-frequency relationships. J. Hydrol. 1998, 206, 118–135. [Google Scholar] [CrossRef]
  6. Reder, A.; Raffa, M.; Padulano, R.; Rianna, G.; Mercogliano, P. Characterizing extreme values of precipitation at very high resolution: An experiment over twenty European cities. Weather. Clim. Extrem. 2022, 35, 100407. [Google Scholar] [CrossRef]
  7. Mohymont, B.; Demarée, G.; Faka, D. Establishment of IDF-curves for precipitation in the tropical area of Central Africa-comparison of techniques and results. Nat. Hazards Earth Syst. Sci. 2004, 4, 375–387. [Google Scholar] [CrossRef]
  8. Mohymont, B.; Demarée, G.R. Courbes intensité-durée-fréquence des précipitations à Yangambi, Congo, au moyen de différents modèles de type Montana. Hydrol. Sci. J. 2006, 51, 239–253. [Google Scholar] [CrossRef]
  9. Van de Vyver, H. Bayesian estimation of rainfall intensity–duration–frequency relationships. J. Hydrol. 2015, 529, 1451–1463. [Google Scholar] [CrossRef]
  10. Zahiri, E.P.; Bamba, I.; Famien, A.M.; Koffi, A.K.; Ochou, A.D. Mesoscale extreme rainfall events in West Africa: The cases of Niamey (Niger) and the Upper Ouémé Valley (Benin). Weather. Clim. Extrem. 2016, 13, 15–34. [Google Scholar] [CrossRef] [Green Version]
  11. Ouarda, T.B.; Yousef, L.A.; Charron, C. Non-stationary intensity-duration-frequency curves integrating information concerning teleconnections and climate change. Int. J. Climatol. 2019, 39, 2306–2323. [Google Scholar] [CrossRef] [Green Version]
  12. Moujahid, M.; Stour, L.; Agoumi, A.; Saidi, A. Regional approach for the analysis of annual maximum daily precipitation in northern Morocco. Weather. Clim. Extrem. 2018, 21, 43–51. [Google Scholar] [CrossRef]
  13. Muller, A.; Bacro, J.N.; Lang, M. Bayesian comparison of different rainfall depth–duration–frequency relationships. Stoch. Environ. Res. Risk Assess. 2008, 22, 33–46. [Google Scholar] [CrossRef] [Green Version]
  14. Gräler, B. Joint modeling of annual maximum precipitation across different duration levels. 2016. Available online: https://www.researchgate.net/publication/311230602_Joint_modeling_of_annual_maximum_precipitation_across_different_duration_levels (accessed on 17 June 2023).
  15. Mazo, G.; Girard, S.; Forbes, F. A flexible and tractable class of one-factor copulas. Stat. Comput. 2016, 26, 965–979. [Google Scholar] [CrossRef] [Green Version]
  16. Stephenson, A.G.; Lehmann, E.A.; Phatak, A. A max-stable process model for rainfall extremes at different accumulation durations. Weather. Clim. Extrem. 2016, 13, 44–53. [Google Scholar] [CrossRef] [Green Version]
  17. Gargouri-Ellouze, E.; Chebchoub, A. Modelling the dependence structure of rainfall depth and duration by Gumbel’s copula. Hydrol. Sci. J.-J. Sci. Hydrol. 2008, 53, 802–817. [Google Scholar] [CrossRef] [Green Version]
  18. Ariff, N.; Jemain, A.; Ibrahim, K.; Zin, W.W. IDF relationships using bivariate copula for storm events in Peninsular Malaysia. J. Hydrol. 2012, 470, 158–171. [Google Scholar] [CrossRef]
  19. Bezak, N.; Šraj, M.; Mikoš, M. Copula-based IDF curves and empirical rainfall thresholds for flash floods and rainfall-induced landslides. J. Hydrol. 2016, 541, 272–284. [Google Scholar] [CrossRef]
  20. Sklar, A. Fonctions de Répartition à n Dimensions et Leurs Marges; Publications of the Institute of Statistics of the University of Paris: Paris, France, 1959; Volume 8, pp. 229–231. [Google Scholar]
  21. Singh, V.P. Entropy Theory and Its Application in Environmental and Water Engineering; John Wiley & Sons: Hoboken, NJ, USA, 2013. [Google Scholar]
  22. Nelsen, R.B. An Introduction to Copulas; Springer Science & Business Media: Berlin/Heidelberg, Germany, 2007. [Google Scholar]
  23. Eschenburg, P. Properties of Extreme-Value Copulas. Ph.D. Thesis, Technische Universitat Munchen Fakultat fur Mathematik, Munchen, Germany, 2013. [Google Scholar]
  24. Hutchinson, T.P. Continuous Bivariate Distributions Emphasising Applications; Technical report; Springer: Berlin/Heidelberg, Germany, 1990. [Google Scholar]
  25. Joe, H. Families of m-Variate Distributions with Given Margins and m (m-1)/2 Bivariate Dependence Parameters; Lecture Notes-Monograph Series; Institute of Mathematical Statistics: Beachwood, OH, USA, 1996; pp. 120–141. [Google Scholar]
  26. Nelsen, R.B. Properties and applications of copulas: A brief survey. In Proceedings of the First Brazilian Conference on Statistical Modeling in Insurance and Finance; Citeseer: Princeton, NJ, USA, 2003; pp. 10–28. [Google Scholar]
  27. Chebana, F. Multivariate Frequency Analysis of Hydro-Meteorological Variables: A Copula-Based Approach; Elsevier: Amsterdam, The Netherlands, 2022. [Google Scholar]
  28. Aas, K.; Czado, C.; Frigessi, A.; Bakken, H. Pair-copula constructions of multiple dependence. Insur. Math. Econ. 2009, 44, 182–198. [Google Scholar] [CrossRef] [Green Version]
  29. Cooke, R.M.; Joe, H.; Aas, K. Vines arise. In Dependence Modeling: Vine Copula Handbook; World Scientific: Singapore, 2010; pp. 37–71. [Google Scholar]
  30. Joe, H. Multivariate extreme-value distributions with applications to environmental data. Can. J. Stat. 1994, 22, 47–64. [Google Scholar] [CrossRef]
  31. Xiong, L.; Yu, K.x.; Gottschalk, L. Estimation of the distribution of annual runoff from climatic variables using copulas. Water Resour. Res. 2014, 50, 7134–7152. [Google Scholar] [CrossRef]
  32. El Adlouni, S. Quantile regression C-vine copula model for spatial extremes. Nat. Hazards 2018, 94, 299–317. [Google Scholar] [CrossRef]
  33. Aas, K.; Berg, D. Models for construction of multivariate dependence–a comparison study. Eur. J. Financ. 2009, 15, 639–659. [Google Scholar] [CrossRef]
  34. Adlouni, S.; Ouarda, T. Comparaison des méthodes d’estimation des paramètres du modèle GEV non stationnaire. Rev. Sci. L’Eau/J. Water Sci. 2008, 21, 35–50. [Google Scholar] [CrossRef] [Green Version]
  35. Bedford, T.; Cooke, R.M. Vines: A new graphical model for dependent random variables. Ann. Stat. 2002, 30, 1031–1068. [Google Scholar] [CrossRef]
  36. Shlef, K.E.; Kunkel, K.E.; Brown, C.; Demissie, Y.; Lettenmaier, D.P.; Wagner, A.; Wigmosta, M.S.; Karl, T.R.; Easterling, D.R.; Wang, K.J.; et al. Incorporating non-stationarity from climate change into rainfall frequency and intensity-duration-frequency (IDF) curves. Journal of Hydrology 2022, 616, 128757. [Google Scholar] [CrossRef]
  37. Campos, J.N.B.; de Studart, T.M.C.; de Assis de Souza Filho, F.; Porto, V.C. On the rainfall intensity–duration–frequency curves, partial-area effect and the rational method: Theory and the engineering practice. Water 2020, 12, 2730. [Google Scholar] [CrossRef]
  38. Grace, A. Optimization Toolbox. In The MathWorks; Cochituate Place, Inc.: Natick, MA, USA, 1994. [Google Scholar]
  39. Konapala, G.; Mishra, A.K.; Wada, Y.; Mann, M.E. Climate change will affect global water availability through compounding changes in seasonal precipitation and evaporation. Nat. Commun. 2020, 11, 3044. [Google Scholar] [CrossRef]
  40. Tabari, H.; Madani, K.; Willems, P. The contribution of anthropogenic influence to more anomalous extreme precipitation in Europe. Environ. Res. Lett. 2020, 15, 104077. [Google Scholar] [CrossRef]
  41. Taylor, K.E.; Stouffer, R.J.; Meehl, G.A. An overview of CMIP5 and the experiment design. Bull. Am. Meteorol. Soc. 2012, 93, 485–498. [Google Scholar] [CrossRef] [Green Version]
  42. Silva, D.F.; Simonovic, S.P.; Schardong, A.; Goldenfum, J.A. Assessment of non-stationary IDF curves under a changing climate: Case study of different climatic zones in Canada. J. Hydrol. Reg. Stud. 2021, 36, 100870. [Google Scholar] [CrossRef]
  43. Martel, J.L.; Brissette, F.; Troin, M.; Arsenault, R.; Chen, J.; Su, T.; Lucas-Picher, P. CMIP5 and CMIP6 model projection comparison for hydrological impacts over North America. Geophys. Res. Lett. 2022, 49, e2022GL098364. [Google Scholar] [CrossRef]
  44. Kraus, D.; Czado, C. D-vine copula based quantile regression. Comput. Stat. Data Anal. 2017, 110, 1–18. [Google Scholar] [CrossRef] [Green Version]
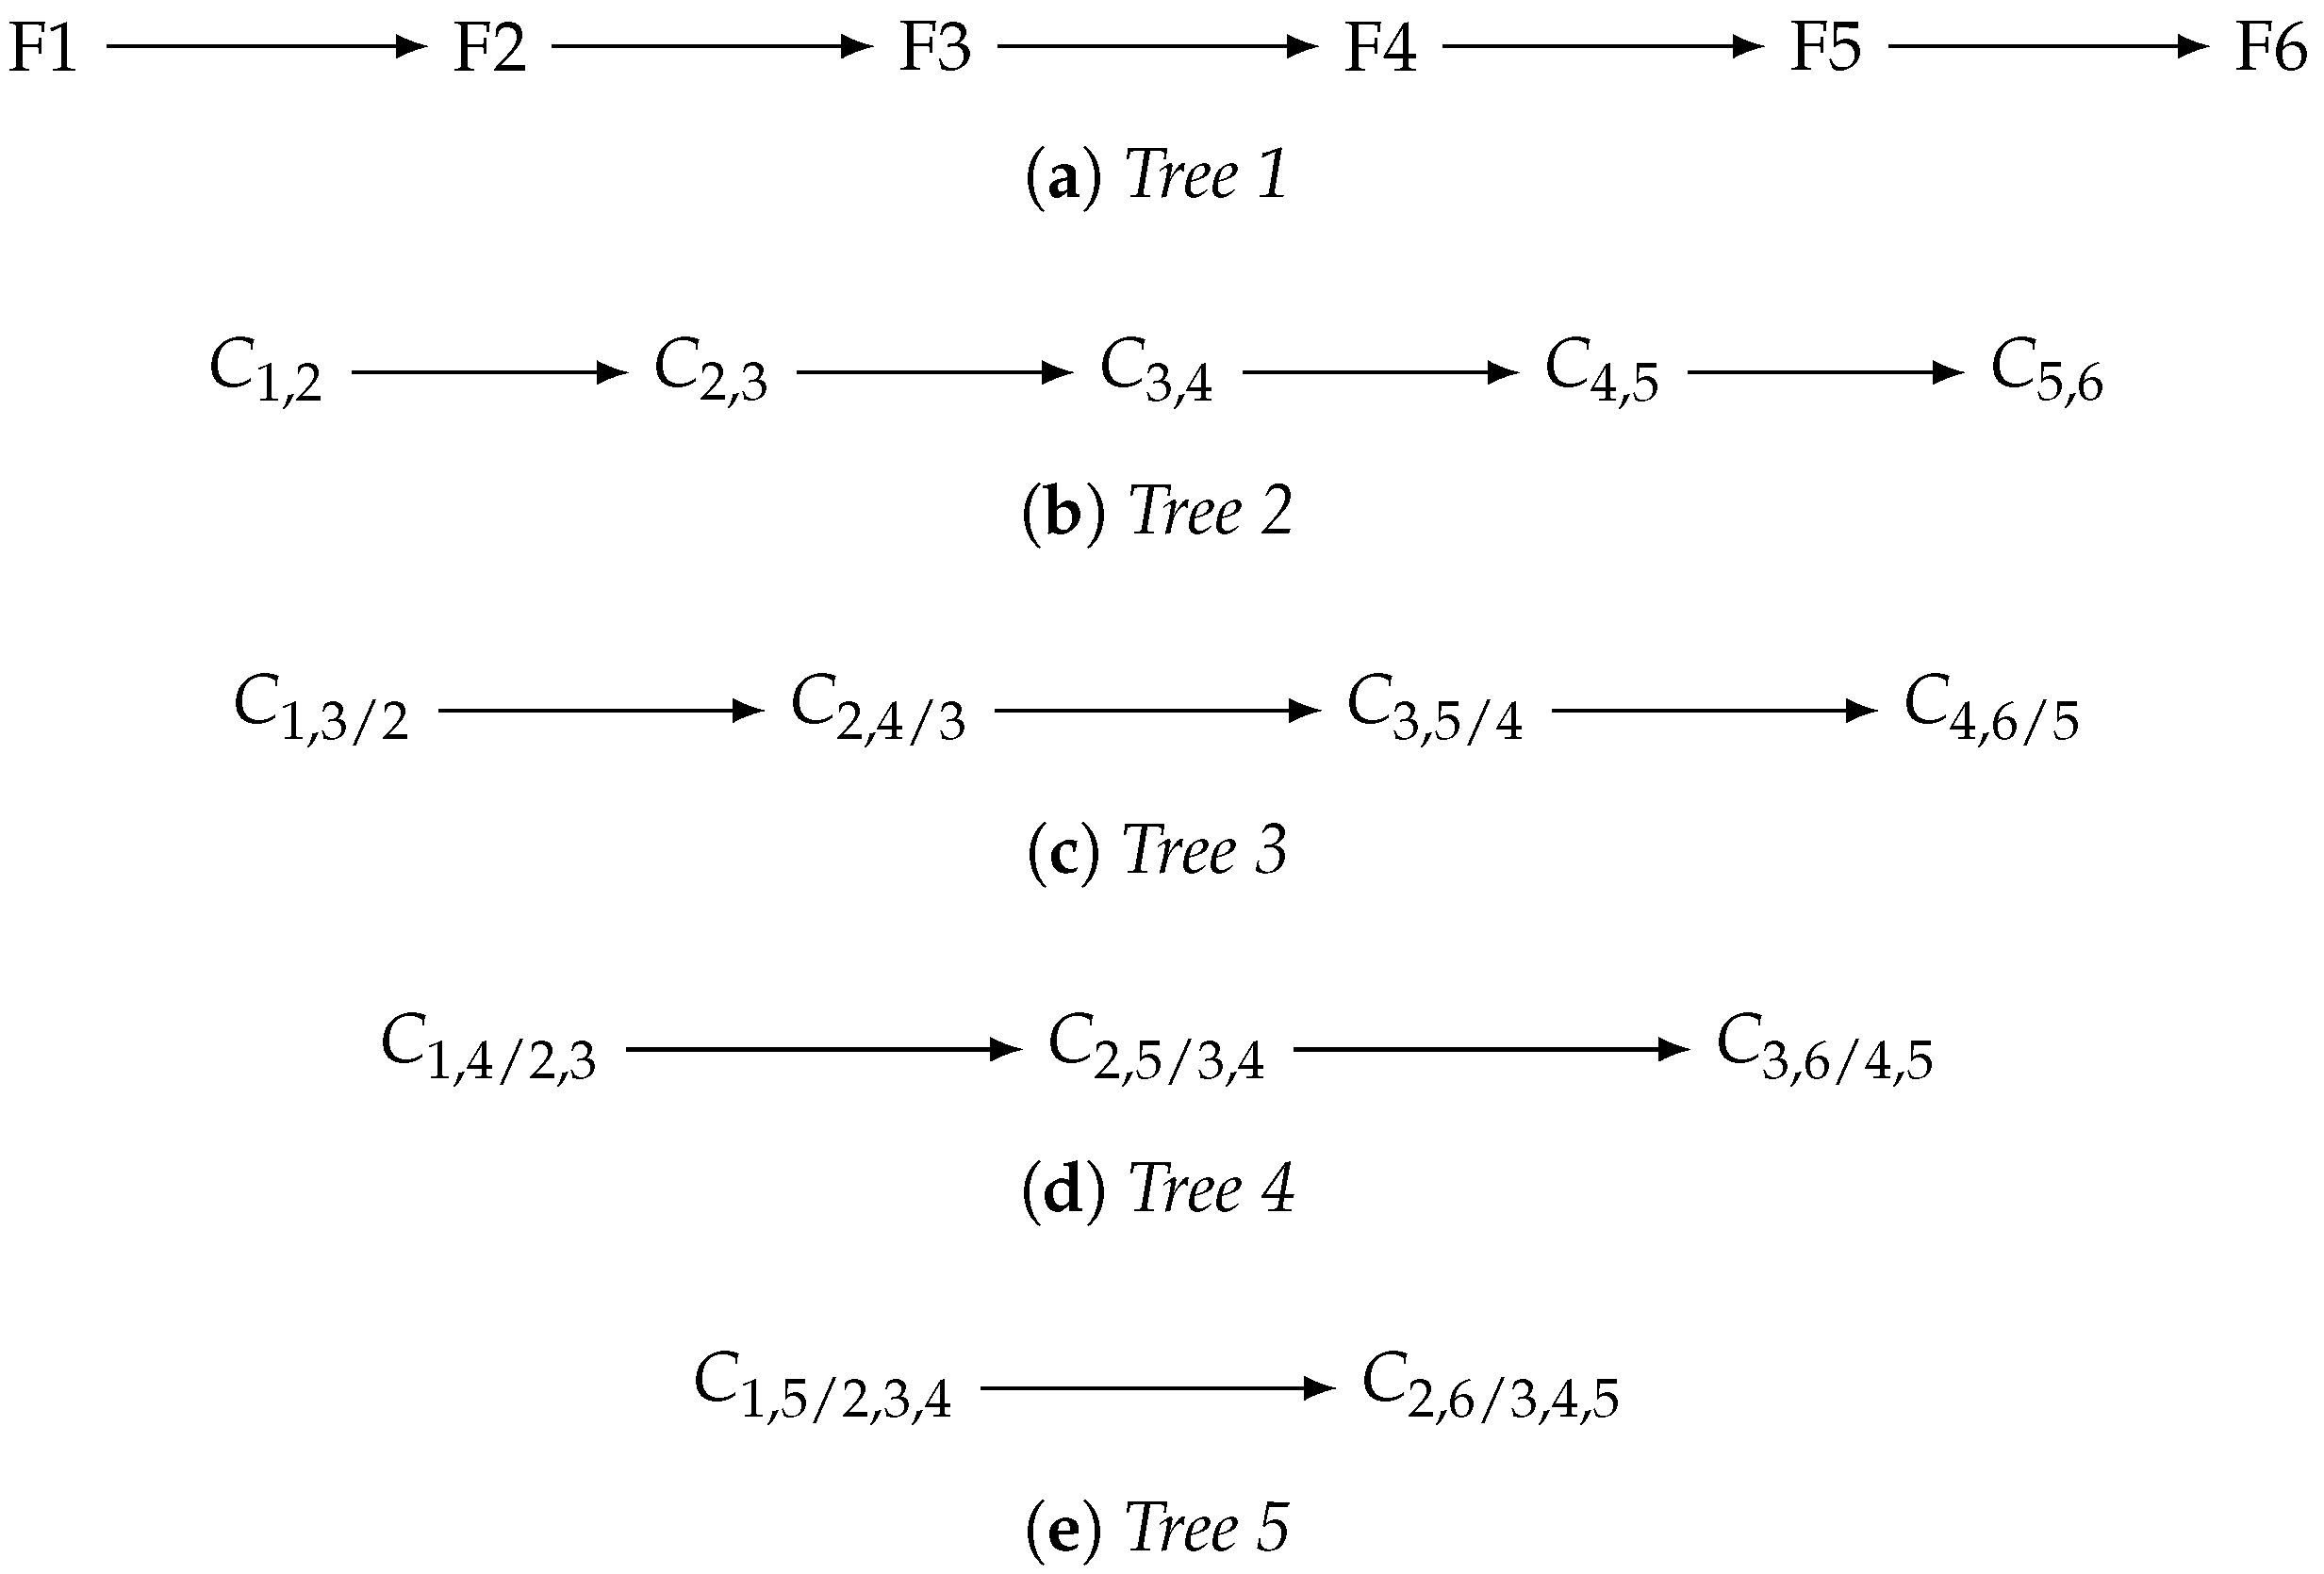
Figure 1. Directed acyclic graph for a vine copula model with six durations showing the hierarchical representation by bivariate copulas. In tree 1, the first node (F1) represents the distribution of one of the four subhourly rainfall intensities ( d 1 , d 2 , d 3 or d 4 ), and the rest of the nodes ( F 2 , , F 6 ) are the distributions of the five hourly rainfall intensities ( d 5 , , d 9 ) . The edges of tree k, k = 1 , , 4 become nodes in trees k + 1, i.e., bivariate copulas for tree 2 and conditional bivariate copulas for the rest.
Water 15 02641 g001
Figure 2. Moncton weather station (Canada).
Water 15 02641 g002
Figure 3. Monthly average of total precipitation records for the Moncton location for the 1899–2010 period.
Water 15 02641 g003
Figure 4. Annual maximum rainfall intensity densities at Moncton station (1946–2016).
Water 15 02641 g004
Figure 5. Comparison between the quantiles obtained from the typical GEV model and quantile points from the copula method.
Water 15 02641 g005
Figure 6. Comparison between the IDF curves obtained from the typical IDF empirical formula and IDF points from the copula method.
Water 15 02641 g006
Figure 7. Spatial interpolation of the IDF curves for the RCP2.6 annual maximum series given by the proposed model for the Moncton location.
Water 15 02641 g007
Table 1. Description of the selected station.
StationIDLat.Long.Alt (m)YearsStartEnd
Moncton Int ANB- 10320146 7 N64 41 W706719462016
Table 2. Copulas and conditional copulas of the D-vine structures.
TreeEdge d 1 d 2 d 3 d 4
12,1Sur BB8 (6, 0.57)N (0.7)N (0.76)N (0.88)
3,2Gumbel (2.57)Gumbel (2.57)Gumbel (2.57)Gumbel (2.57)
4,3N (0.76)N (0.76)N (0.76)N (0.76)
5,4N (0.90)N (0.90)N (0.90)N (0.90)
6,5N (0.92)N (0.92)N (0.92)N (0.92)
23,1;2I (0)I (0)I (0)I (0)
4,2;3r270 BB7 ( 1.14 , 0.66 )r270 BB7 ( 1.14 , 0.66 )r270 BB7 ( 1.14 , 0.66 )r270 BB7 ( 1.14 , 0.66 )
5,3;4r90 Joe ( 1.47 )r90 Joe ( 1.47 )r90 Joe ( 1.47 )r90 Joe ( 1.47 )
6,4;5Frank ( 2.45 )Frank ( 2.45 )Frank ( 2.45 )Frank ( 2.45 )
34,1;3,2I (0)I (0)I (0)I (0)
5,2;4,3Frank (1.5)Frank (1.5)Frank (1.5)Frank (1.5)
6,3;5,4I (0)I (0)I (0)I (0)
45,1;4,3,2I (0)I (0)I (0)I (0)
6,2;5,4,3I (0)I (0)I (0)I (0)
56,1;5,4,3,2Frank ( 2.15 )r90 Clayton ( 0.25 )r90 Clayton ( 0.24 )Frank ( 1.38 )
Table 3. Comparison of the estimated quantiles according to the two approaches.
Intensities over the Different Durations
T (Years) d 1 = 5 min d 2 = 10 min d 3 = 15 min d 4 = 30 min
i GEV T i cop T Δ i GEV T i cop T Δ i GEV T i cop T Δ i GEV T i cop T Δ
274.676.62.752.551.8 1.4 40.740.2 1.2 27.127.20.3
5106.2115.98.474.582.69.857.363.810.237.240.78.7
10128.5140.28.390.1106.815.769.382.916.544.451.714.1
25158.4168.25.8110.8141.621.785.7111.623.254.268.220.6
50181.7191.45.0127.1172.126.198.9137.428.061.982.525.0
100206.0215.24.3144.1203.629.2112.9165.031.670.198.528.9
Table 4. The hourly quantiles of extreme rainfall.
Intensities over the Different Durations
T (Years) d 5 = 1 h d 6 = 2 h d 7 = 6 h d 8 = 12 h d 9 = 24 h
218.012.26.64.12.4
524.416.28.65.43.3
1029.619.59.96.43.9
2537.624.511.67.64.7
5044.729.112.88.55.3
10052.934.414.09.45.9
Table 5. Rainfall intensities (mm/h) for historical data and future IDF curves for Moncton station and three RCP emission scenarios (RCP2.6; RCP4.5; RCP8.5) with different durations and return periods (2; 10; 100 years).
DurationRCP2.6RCP4.5RCP8.5Observations
2 Years10 Years100 Years2 Years10 Years100 Years2 Years10 Years100 Years2 Years10 Years100 Years
5 min119178.8260129.4198.7293.2126.4188.6273.171.3113.1155.3
10 min72.2108.6157.878.6120.617876.7114.5165.850.279.2108.4
15 min53.981.1117.958.790.1132.957.385.5123.840.562.785.1
30 min32.849.271.635.654.780.734.851.975.22740.754.5
1 h19.929.943.421.633.24921.131.545.617.925.533.2
2 h12.118.126.413.120.229.712.819.127.712.116.821.5
6 h5.58.21269.113.55.88.712.66.59.612.7
12 h3.357.33.65.58.23.55.37.64.168
24 h234.42.23.452.13.24.62.43.64.8
Table 6. Relative changes in the rainfall intensity (in %) between historical and future periods (RCP2.6; RCP4.5; RCP8.5) of the IDF curves for Moncton with different durations and return periods (2; 10 and 100 years).
DurationRCP2.6RCP4.5RCP8.5
2 Years10 Years100 Years2 Years10 Years100 Years2 Years10 Years100 Years
5 min675867827689776776
10 min443746565264534553
15 min332939454456413646
30 min212131323448292838
1 h111731213048182438
2 h08238203861429
6 h−16−14−6−9−56−11−10−1
12 h−18−17−10−11−82−13−13−5
24 h−16−16−9−9−73−11−11−4
Disclaimer/Publisher’s Note: The statements, opinions and data contained in all publications are solely those of the individual author(s) and contributor(s) and not of MDPI and/or the editor(s). MDPI and/or the editor(s) disclaim responsibility for any injury to people or property resulting from any ideas, methods, instructions or products referred to in the content.