Article

Assessment of Integrated Soil and Water Conservation Practices on Soil Erosion Risk in a Typical Red-Beds Watershed in South China

1
School of Geography and Remote Sensing, Guangzhou University, Guangzhou 510006, China
2
Rural Non-Point Source Pollution Comprehensive Management Technology Center of Guangdong Province, Guangzhou University, Guangzhou 510006, China
3
Natural Resources Bureau, Nanxiong City, Shaoguan 512400, China
*
Authors to whom correspondence should be addressed.
Water 2023, 15(14), 2613; https://doi.org/10.3390/w15142613
Submission received: 18 June 2023 / Revised: 10 July 2023 / Accepted: 15 July 2023 / Published: 19 July 2023
(This article belongs to the Section Soil and Water)

Abstract

:
Soil erosion is the primary factor inducing soil deterioration in large river basins. Management and conservation of the soil erosion of the red bed desert, a unique gully landform shaped by intensive weathering and hydraulic erosion under the humid climate in south-eastern China, is crucial for its long-term sustainable development. This study, focusing on the Nanxiong Basin, a representative area with red beds, applied Gaofen(Gf)-2 satellite images to the RUSLE Model to analyze soil erosion modulus before and after implementing treatment for soil erosion control. We qualified the volume of soil erosion and mapped the spatial erosion variability in the basin. The results exhibited a decrease in the average erosion modulus from 3943.56 t·km−2·yr−1 to 2023.1 t·km−2·yr−1, which caused a reduction in total soil loss from 4.64 million tons to 2.38 million tons after treatment, with a reduction of about 48.7%. The mitigation reduced soil erosion from a moderate level to a light level. The areas that integrated soil and water conservation practices (SWCP) with management measures showed evident improvement in soil erosion, with a dramatic reduction in areas with annual erosion of a strong level (5000~8000 t·km−2·yr−1), extremely strong level (8000~15,000 t·km−2·yr−1), and severe level (>15,000 t·km−2·yr−1). Despite spatial heterogeneity in soil erosion intensity in the basin, this study demonstrates the great performance of SWCP in mitigating red bed degradation. The study provides a solid scientific basis for soil erosion control using ecological engineering in the Nanxiong Basin. It can also serve as an illustrative case study for further applications on soil erosion assessment in similar small basins.

1. Introduction

Soil erosion is a widespread and persistent global ecological problem that leads to land degradation, soil nutrient loss, and surface pollution, thereby increasing the risk of floods and droughts [1,2,3]. It poses a serious to threat food security, biodiversity, and the sustainable development of resources, both locally and globally. Globally, nearly one-third of high-fertility soils are degraded by soil erosion annually, resulting in an annual loss of about 7.6 million tons of cereal production [4]. China is significantly impacted by soil erosion, experiencing extensive land degradation and massive erosion issues [5,6,7]. As of 2020, soil erosion in China has affected an area of 2,672,700 km2, representing 28.06% of the country’s land surface [8]. Hydraulic erosion accounts for 1,120,000 km2 of this total amount [9]. Evaluation of the regional soil erosion status is of great relevance to ecological management in this urgent context.
A large number of empirical statistical models and physical process models, such as the Universal Soil Loss Equation (USLE) and the Soil and Water Assessment Tool (SWAT), have been developed to estimate and predict soil erosion processes at different scales [10,11]. Physical models, such as the Soil and Water Assessment Tool (SWAT), are known for their high accuracy [12]. However, they often require extensive efforts in parameter calibration [13], which limits their wider use [8]. On the other hand, commonly used empirical statistical models such as the Universal Soil Loss Equation (USLE) and the Revised Universal Soil Loss Equation (RUSLE) [14] offer advantages such as their less complex structure, low cost, high applicability, ease of use, availability of input data, and suitability for various land use scenarios [15]. The Revised Universal Soil Loss Equation (RUSLE) provides a simplified and comprehensive framework for soil erosion assessment by considering model inputs such as the rainfall erosivity factor (R), soil erodibility factor (K), slope length and steepness factor (LS), cover management factor (C), and conservation practice factor (P), along with their interactions on soil conditions. It plays an important role in studying soil erosion characteristics, particularly in hydraulic erosion on stable gully terrains such as sloping arable land, forest land, and barren hills [16,17,18,19,20].
At the watershed scale, measuring soil erosion becomes complex due to the spatial variations in rainfall intensity, rainfall, soil type, land use, and topography. In situ measurement of soil erosion processes is time consuming and applicable only to small-scale sites [21]. To overcome these challenges, the integration of remote sensing and spatial data with the Revised Universal Soil Loss Equation (RUSLE) model has become a commonly adopted approach for estimating regional soil erosion [22,23,24,25,26]. However, many studies utilizing low- to medium-resolution remote sensing images often concentrate on slope and watershed scales, and the resolution of the data used may not fully meet the of commonly used soil erosion models in terms of establishment conditions and input parameter requirements [27]. In recent years, advancements in Geographic Information System (GIS) and remote sensing (RS) technology have made it more cost-effective to incorporate input parameters for RUSLE models, while maintaining reasonable accuracy [4]. These improvements have resulted in an increasing number of studies focusing on accurate soil erosion evaluation at small scales [28,29]. These studies leverage high-resolution remote sensing and drone technologies to perform a site-specific analysis of impact factors within the model, enabling better the prediction of soil erosion. For instance, Mhaske S N et al. [30] integrated the RUSLE model with GIS to estimate the annual mean soil erosion in the mining watershed of Saranda Peak as 76 tons per hectare per year (t ha−1yr−1). Approximately 63% of the total area is categorized under the very low to low erosion category, and the relevant area is mainly covered by forest land, whereas the mining region comprises less than 1% of the total study area with an extremely high soil erosion (156 t ha−1 yr−1) potential. Similarly, Kebede Y S et al. [31] assessed the spatial pattern of soil erosion risk in the Upper Beles watershed of the Blue Nile River Basin, Ethiopia, and mapped the annual soil loss rate. The result shows that high soil erosion prevails at steep slopes and mountainous areas with no vegetation cover and extensively cultivated areas.
The Nanling Mountains area in northern Guangdong Province hold great importance as a water-conserving region in the upper reaches of the Beijiang and Dongjiang Rivers, which are tributaries of the Pearl River [32]. However, in recent years, a combination of local natural conditions and human activities has caused varying degrees of damage to the ecological environment of certain lands in the area. This has led to increasingly prominent problems and an elevated regional ecological risk [33]. The Nanxiong Basin, located in the southern part of the Nanling Mountains, features extensive mountainous hills and the growth of multiple Danxia landforms. In particular, the Danxia landform area has experienced significant soil erosion, especially as it approaches the center of the basin. This is primarily attributed to the predominance of Danxia landforms composed of silt and mud-soft rocks, which are highly susceptible to weathering and water erosion [34,35,36]. The intensity of land degradation in this area is remarkable, with the soil erosion rate in the central area exceeding the soil formation rate. Consequently, a rapid land degradation process affects the red beds, resulting in the formation of extensive areas of red sandbags on the ground, creating the unique phenomenon known as the ‘red-beds desert’ [37]. This degradation involves the exposed bedrock undergoing physical weathering and denudation caused by runoff, leading to fragmentation and gully formation. The resultant poor land becomes less productive and irreversibly threatens the ecological sustainability of the region [38].
This study aimed to address the urgent need for effective soil erosion assessment by utilizing the RUSLE model on high-resolution GF-2 images. The primary objectives of this study encompass a quantitative assessment of soil erosion and the investigation of its spatial distribution within the Nanxiong Basin. Furthermore, the study sought to analyze the efficacy of ecological restoration measures in representative areas dedicated to soil erosion control. The findings obtained from this study will be a valuable reference for the supervision and targeted management of soil erosion and ecological restoration in similar small-scale areas.

2. Materials and Methods

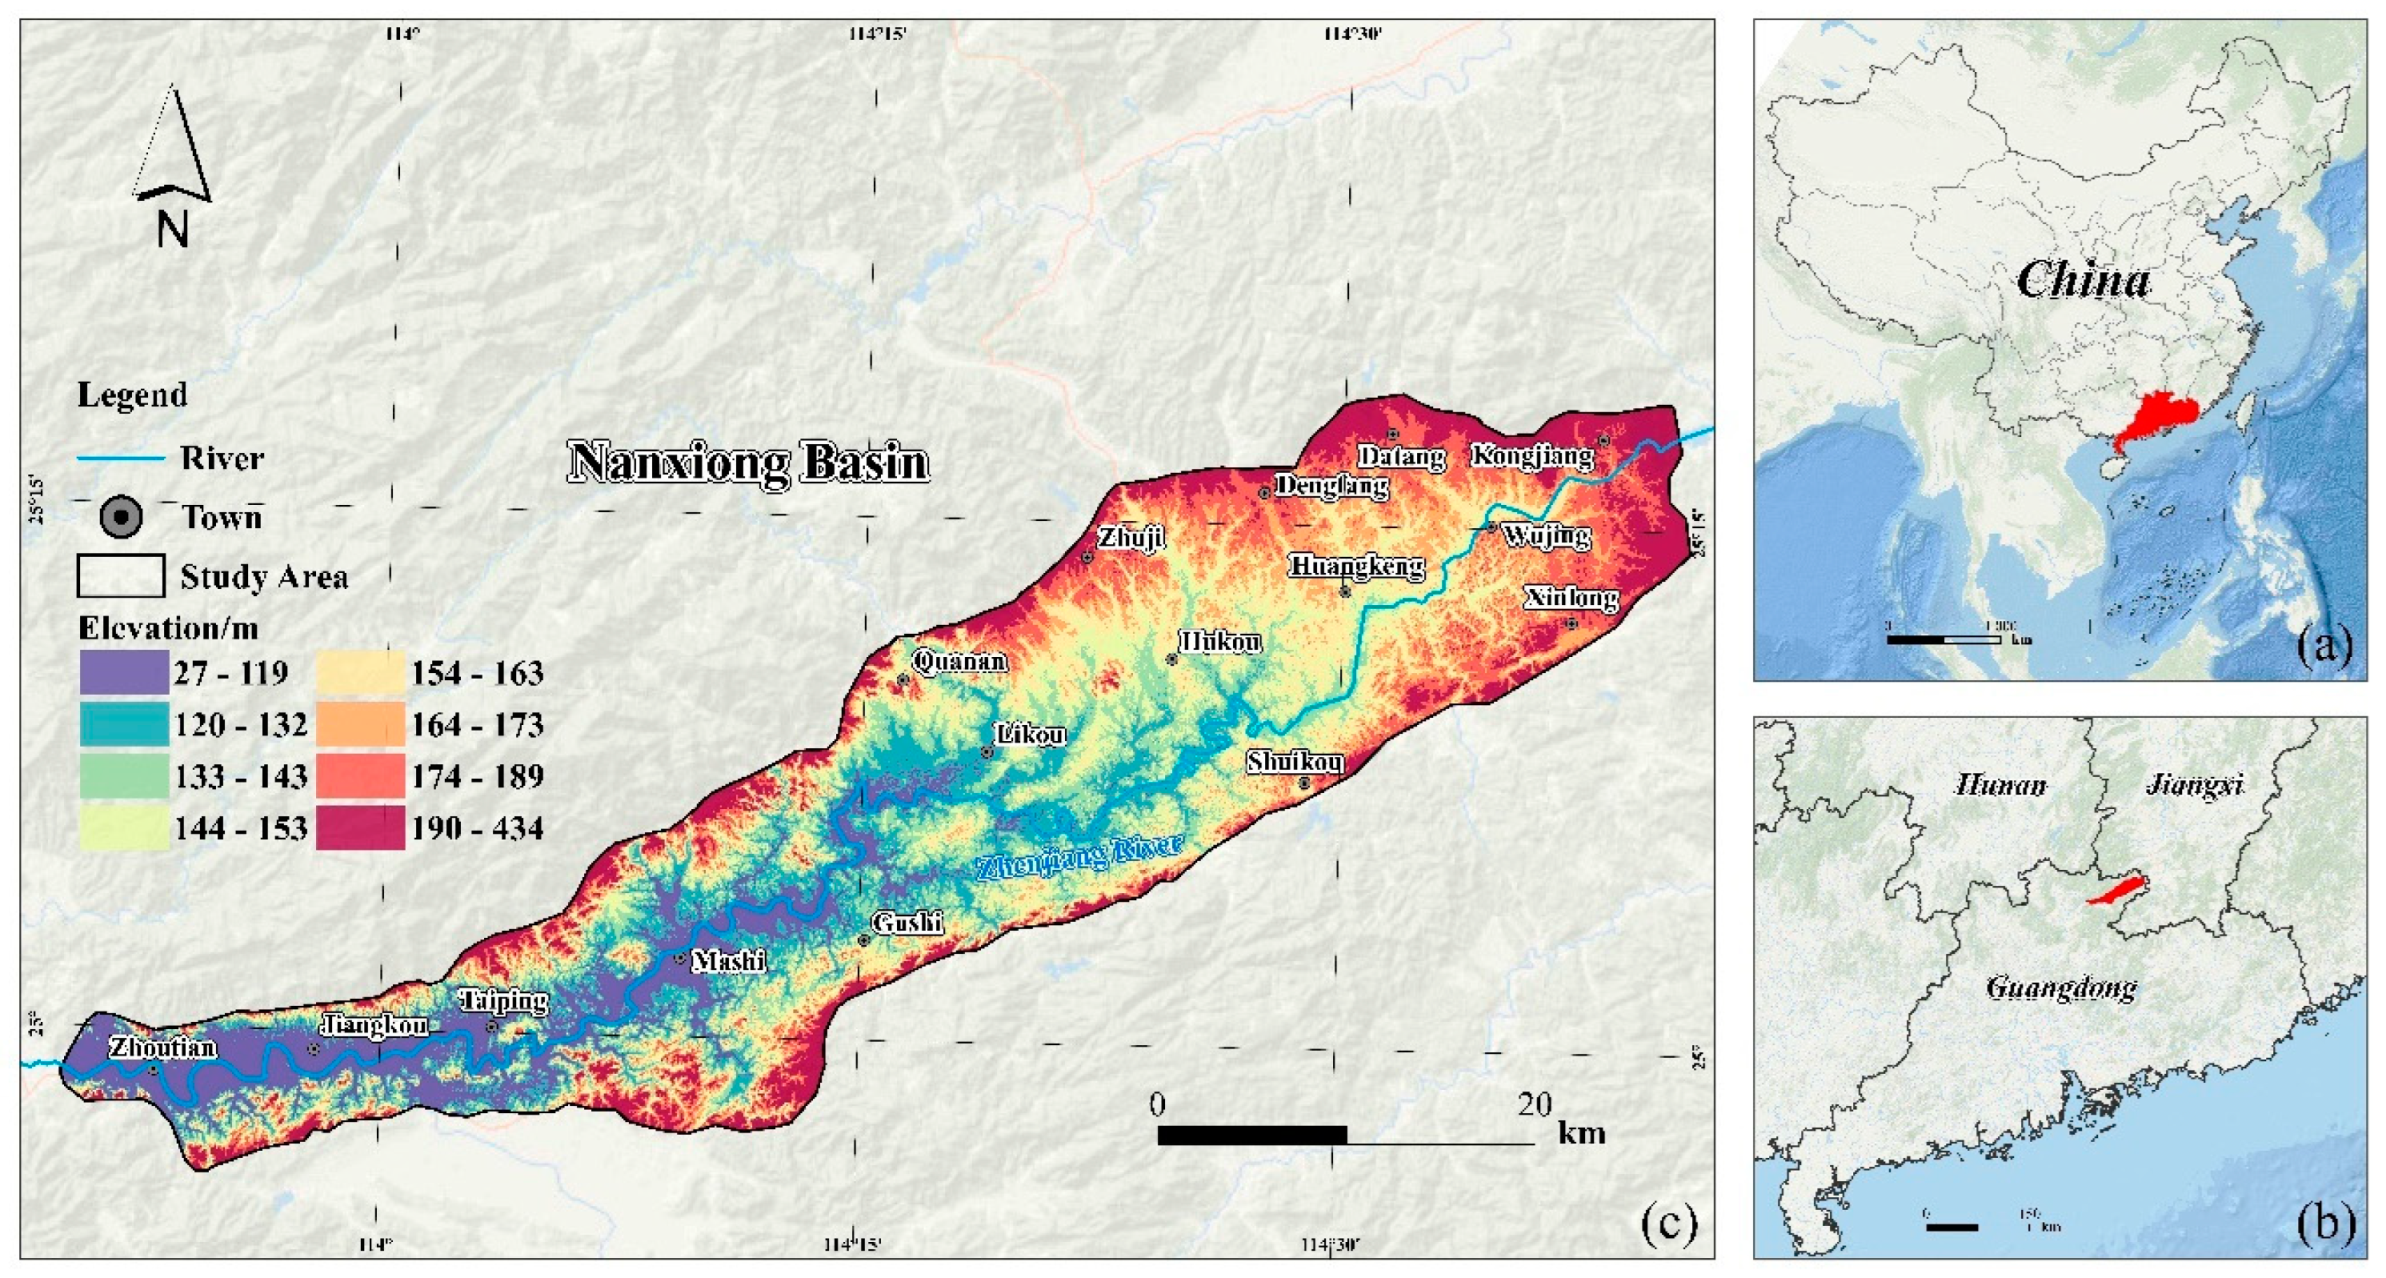
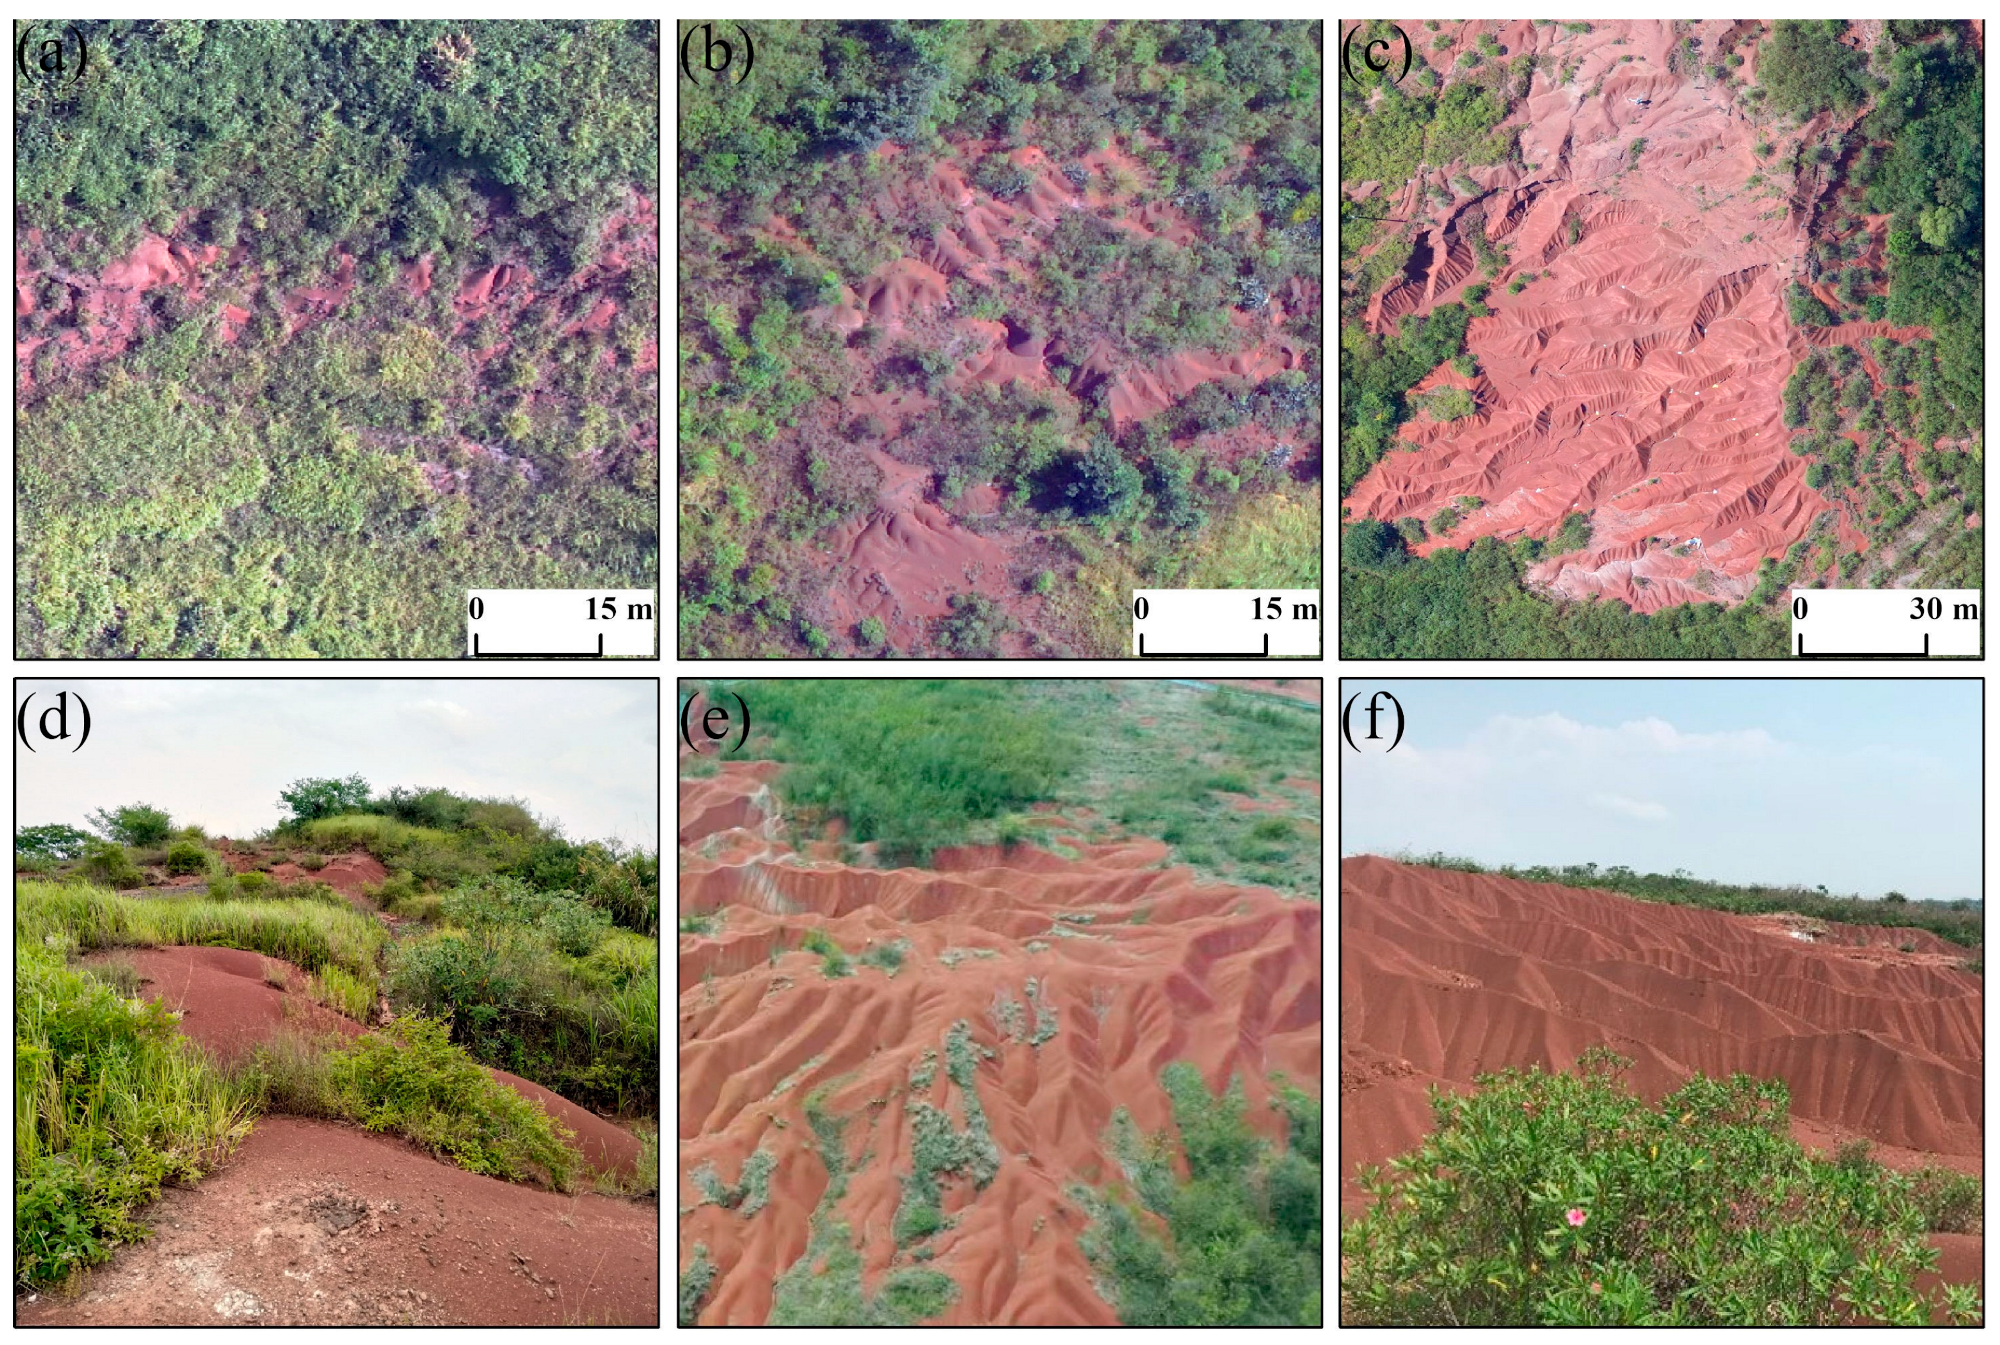
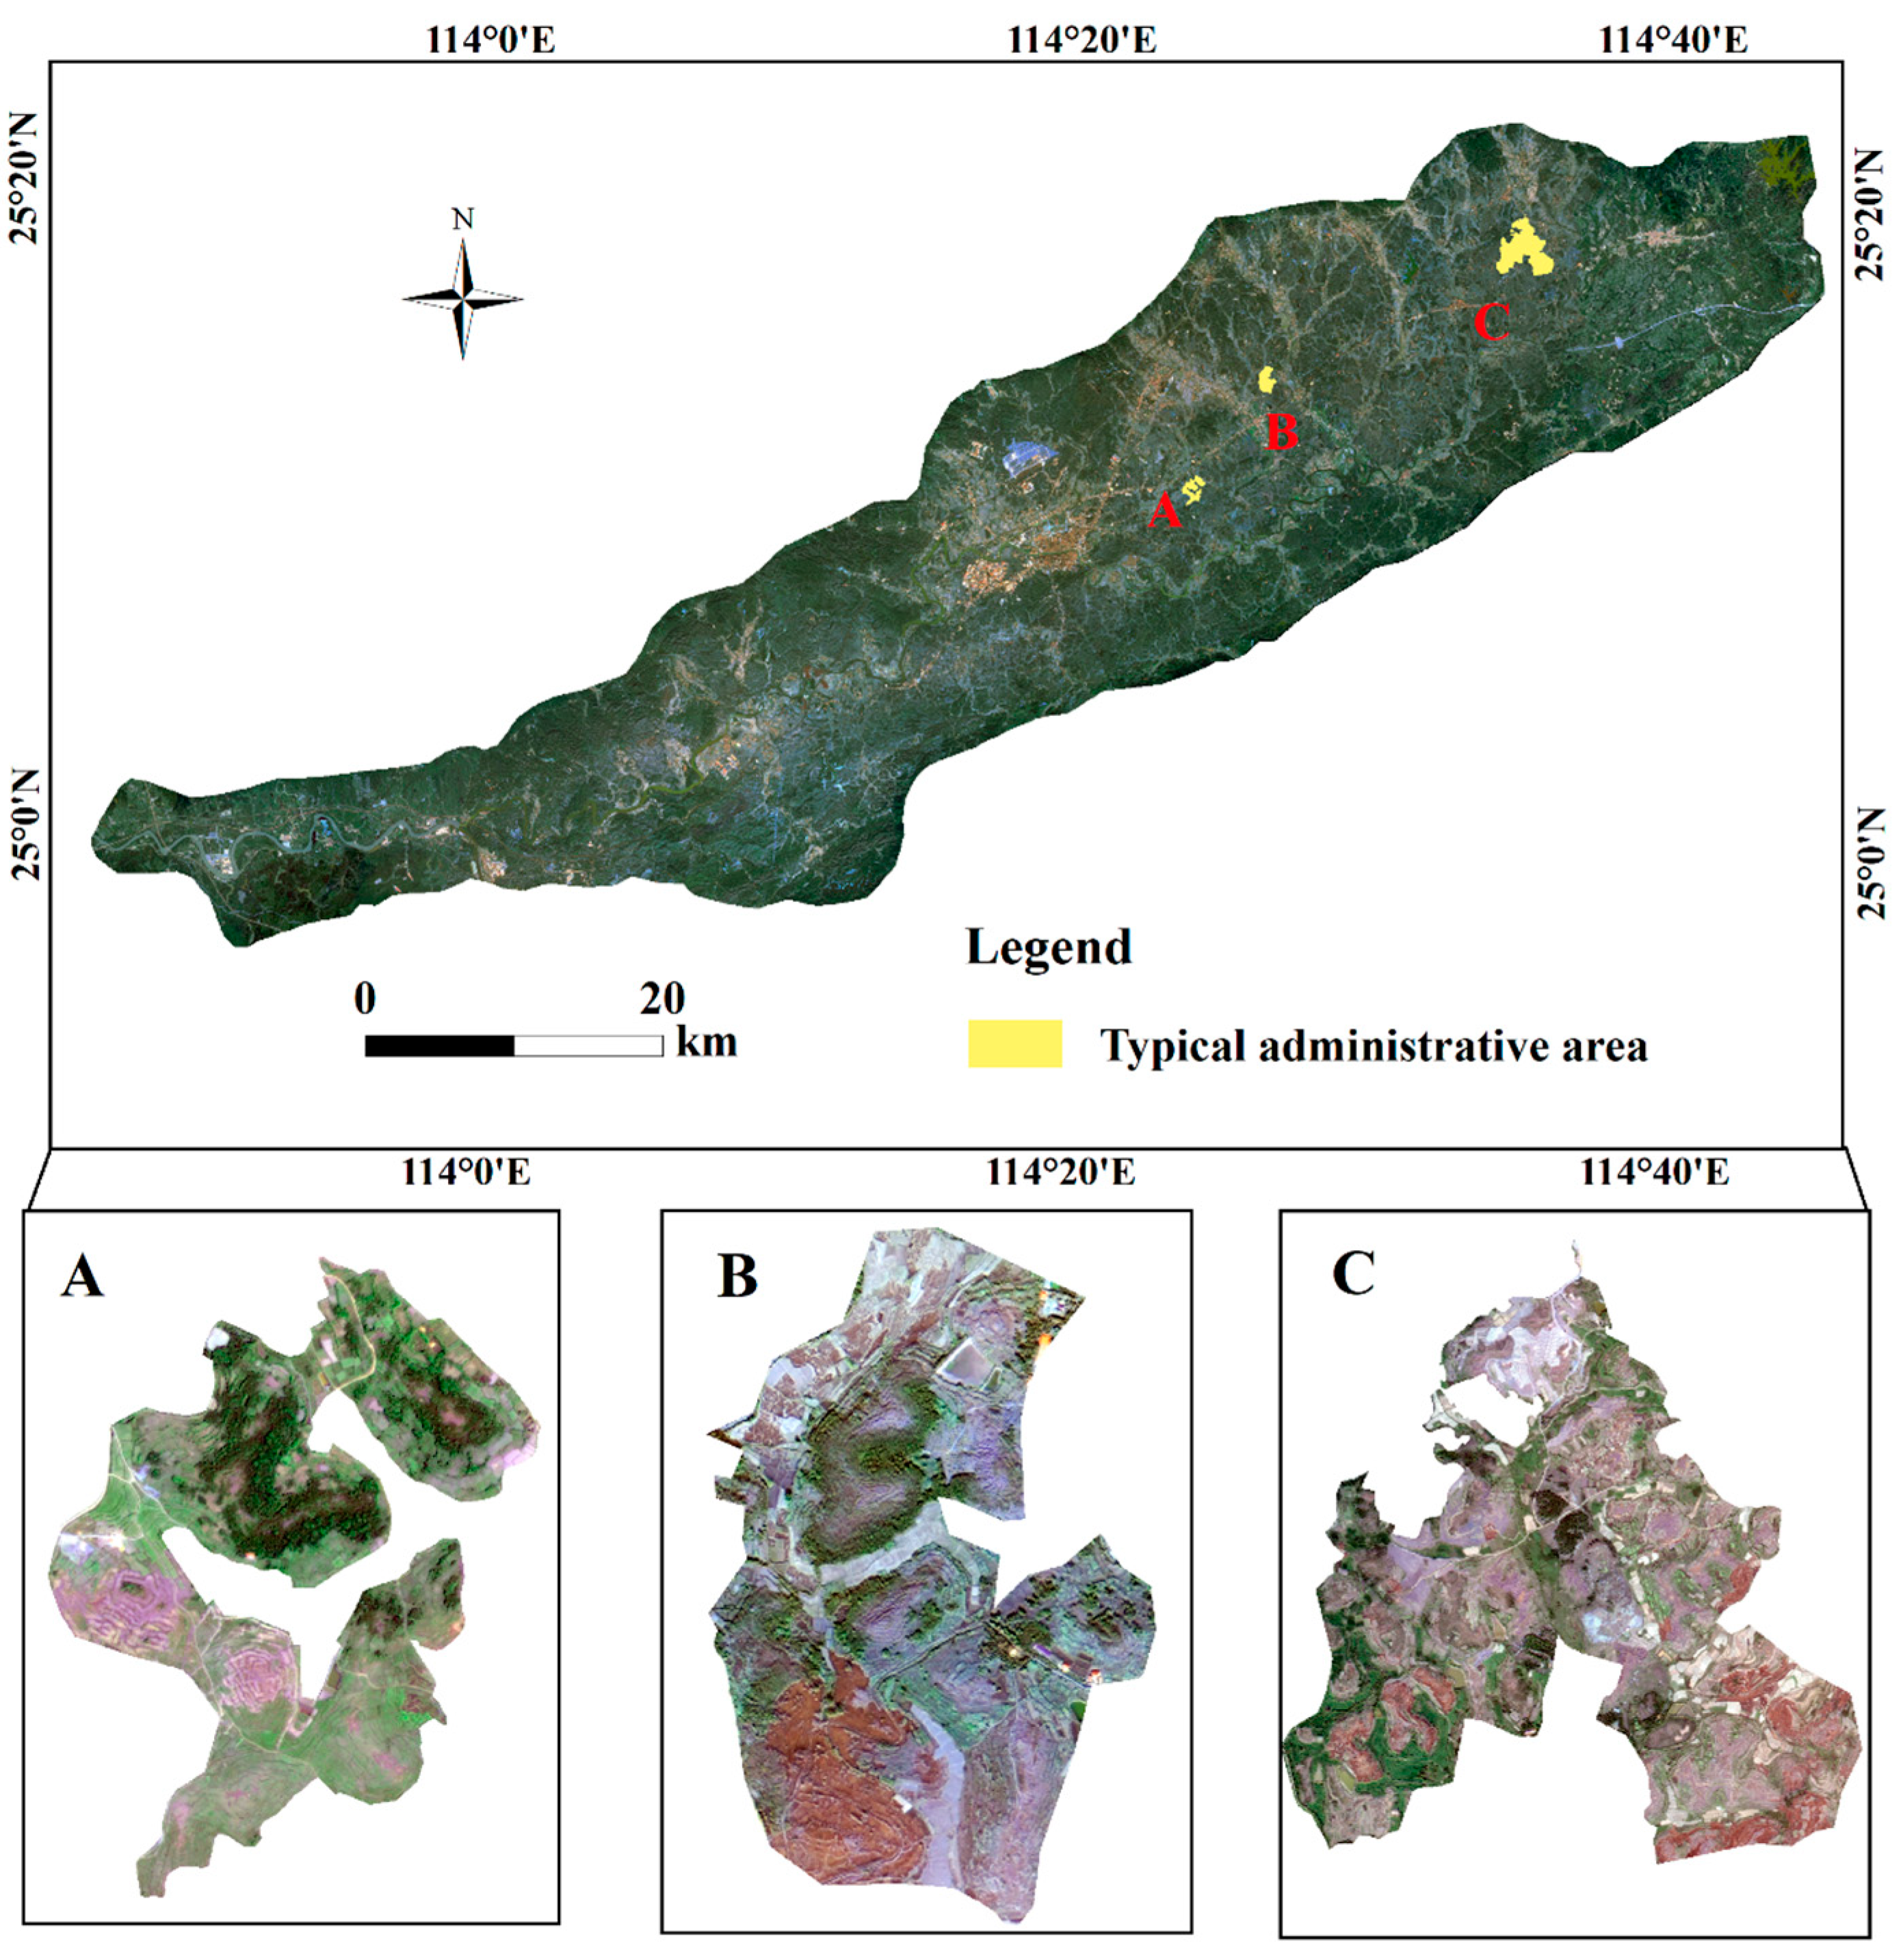
2.1. Overview of the Study Area

The Nanxiong Basin (24°33′–25°24′ N, 113°52′–114°45′ E) is located in the northern region of the Beijiang tributary within the Pearl River basin in China. It is located at the southern foothills of the Dagengling Mountains, surrounded by mountains on three sides. The basin has an elongated and narrow shape, spanning across 17 towns within the Nanxiong and Shixing counties, covering an area of approximately 2200 km2 (Figure 1) with an altitude ranging from 27 m to 434 m. This region experiences a subtropical monsoon climate characterized by long summers and short winters, with an average annual temperature of 20.2 °C (average temperature of the meteorological monitoring stations in the Nanxiong Basin for the period 2020–2022). The average annual precipitation is 1555.1 mm, while the potential evaporation is 1678.7 mm. The rainy season primarily occurs between March and August. The Nanxiong Basin is predominantly composed of purple sand shales. These shales undergo significant weathering during autumn and winter and are highly susceptible to erosion during summer. Because of their weakly crystalline nature, the shales flake off in layers, resulting in exposed red mounds formed through erosion. These mounds typically retain only debris and parent material layers, commonly referred to as the ‘red sand ridge’. The red-beds desert area exhibits distinct characteristics, including severe soil erosion, limited land-bearing capacity, inadequate recovery ability, and a fragile ecological environment. Failure to implement restoration measures promptly could result in vegetation succession deviating from the ecological trajectory of wet zones, leading to the establishment of dry scrub communities. Ultimately, this can lead to a loss of biological productivity, resulting in bare ground devoid of any grass (Figure 2). Thus, the priority lies in the ecological protection of mountains, water, forests, fields, waters, and grasslands to facilitate the restoration of degrading ecosystems.

2.2. Sources of Information and Pre-Processing

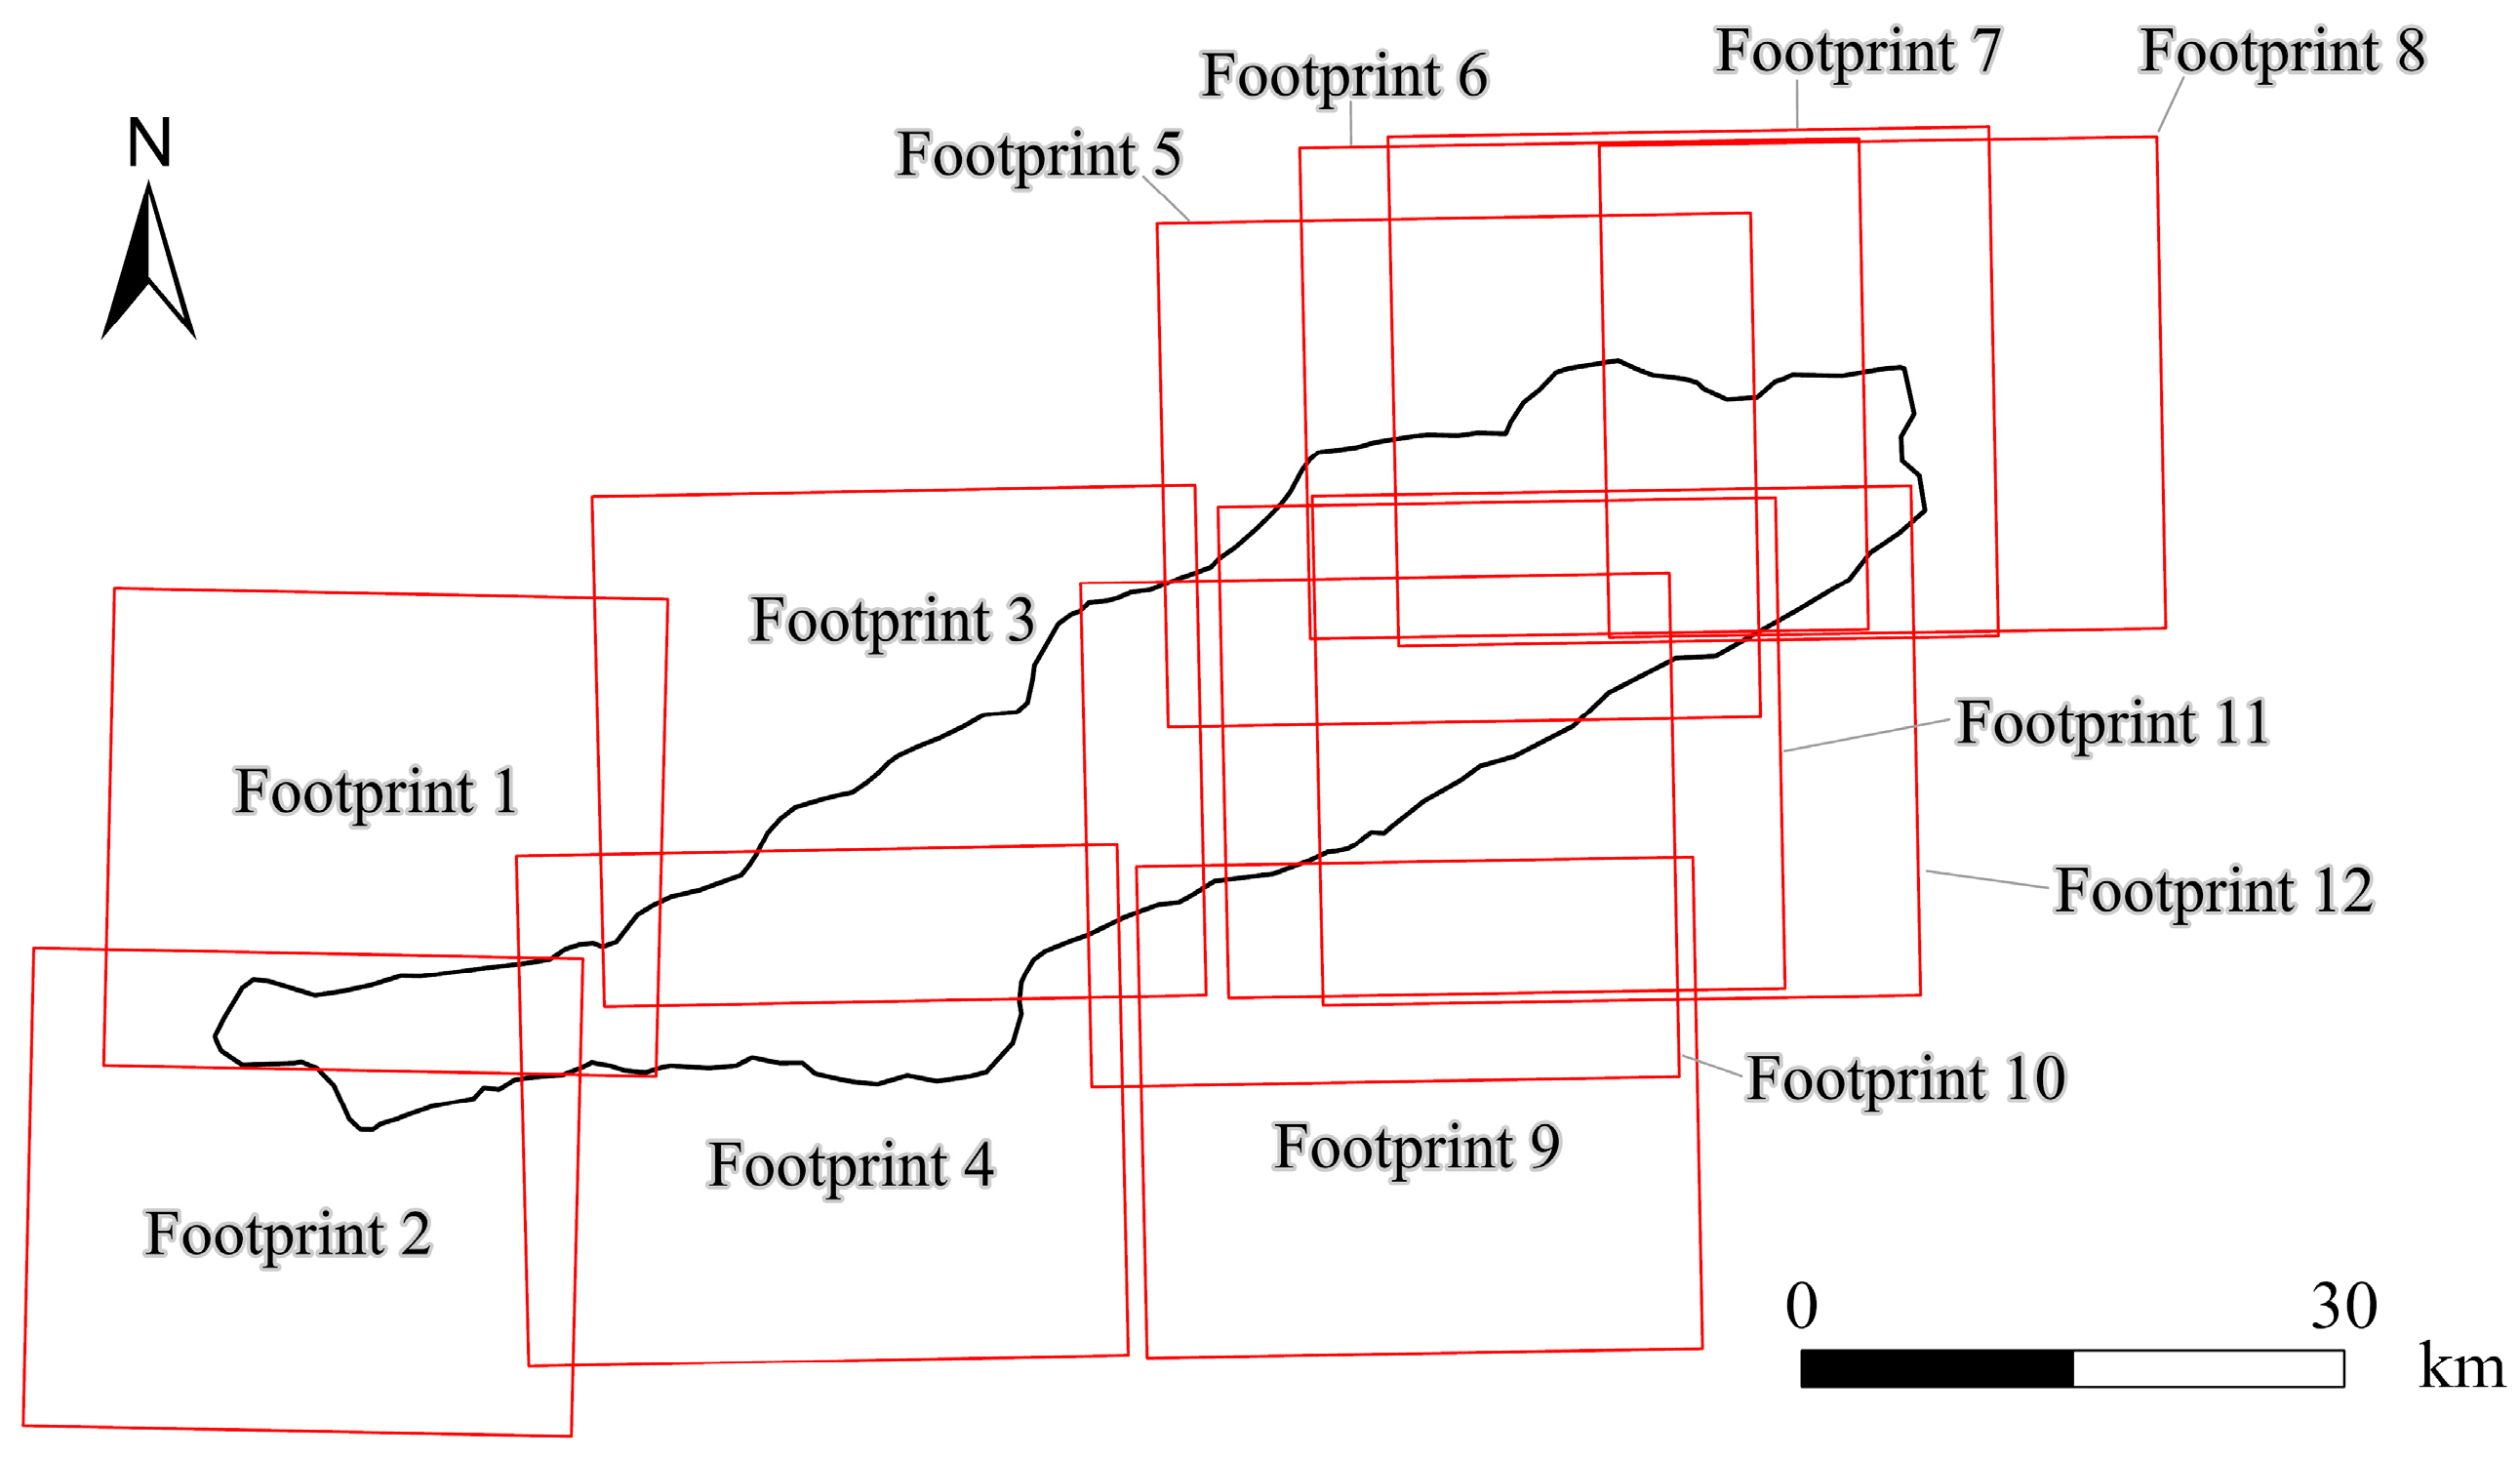
2.2.1. Remote Sensing Data

In this study, 24 images obtained from the Gaofen-2 Earth observation satellite (GF-2) between 2020 and 2022 were selected as the data sources (Figure 3). The GF-2 satellite, launched on 19 August 2014, with a 1 m resolution panchromatic and 4 m resolution multispectral optical cameras (Table 1). With a width of 45 km, GF-2 offers several advantages, including high resolution, fast data transmission speed, and good image quality [39]. The pre-processing of the images involved three steps: radiometric calibration, atmospheric calibration, and orthorectification. Radiometric calibration was performed using the absolute radiometric calibration coefficients provided in the GF-2 metadata and the radiometric calibration tool. Atmospheric calibration was conducted using the FLAASH module. For orthorectification, the rational polynomial coefficients (RPCs) derived from the GF-2 data were referenced to NASA’s 30 m resolution DEM (NASADEM) data, released in February 2020, as the calibration reference. The preprocessed multispectral and panchromatic images were fused using the Gram-Schmidt Pan Sharpening tool (ENVI 5.3)to facilitate the calculations of the C- and P-factors.

2.2.2. Other Data Materials

Other information, including rainfall, soil properties, topography, and site survey data, was also incorporated into this study. The rainfall data were obtained from monthly records from 30 meteorological stations by the local meteorological office. To obtain the rainfall distribution across the study area, kriging interpolation was applied. A total of 39 sets of soil data were collected from different land use types in the study area, and their mechanical composition content and physicochemical properties were determined through laboratory analysis. Soil data consisted of the location of the field sampling sites, soil mechanical composition, organic carbon content, and other soil properties. Field survey data mainly included drone images, field erosion data, and site survey photos. Topographic data were derived from a digital elevation model (DEM) created using USGS SRTM data, with a resolution of 30 m. The land use data were extracted from the GF-2 satellite imagery and interpreted using a combination of supervised classification and manual interpretation. Finally, to ensure consistency, all data were projected and resampled to a uniform 1 m spatial resolution before conducting soil loss analysis. In addition, unmanned aerial survey techniques were used to obtain high-resolution DOM images to capture changes in ecological elements in a typical red-beds desert landscape before and after ecological restoration. 2017 images reflect the original condition before any measures were implemented, 2021 images reflect changes that occurred during the treatment process, and 2022 shows the state of vegetation restoration after the implementation of soil and water conservation measures.

2.3. Research Methods

The RUSLE model (Revised Universal Soil Loss Equation) is a revised and more widely applicable version derived from the Universal Soil Loss Equation (USLE), originally revised and implemented by the US Department of Agriculture in 1997 [40]. The RUSLE model has been applied nationally and regionally as a reliable tool for predicting soil erosion in various studies.
A = R × K × LS × C × P
where A is the estimated soil loss per unit area in a specific period (t·ha−1·yr−1), R represents the erosion force factor of precipitation (MJ·mm·ha−1·ha−1·yr−1), K is the soil erodibility factor (Mg·ha·h·MJ−1·mm−1·ha−1), LS is the factor accounting for slope length and slope gradient (dimensionless), C is the factor related to vegetation cover and management practices (dimensionless), and P represents soil and water conservation measures (dimensionless). These components collectively contribute to the comprehensive assessment of soil erosion in the RUSLE model.

2.3.1. Rainfall Erosivity Factor (R)

Rainfall erosion force represents the potential capacity of rainfall to cause erosion and serves as a fundamental factor in the soil loss equation. Rainfall is recognized as the main driving force behind soil erosion [41]. In China, the estimation of the R factor primarily relies on annual and monthly rainfall data. In this study, we adopted a simplified algorithm proposed by Arnoldus [42] to calculate the R-value, which considers both the monthly average rainfall and the annual average rainfall. By substituting the appropriate values into the formula, we can quantify the erosive power of annual rainfall within watersheds.
MFI = i = 1 12 p i 2 p
R = 1.05 × MFI
where p is the mean annual rainfall (mm), p i is the mean rainfall in the month i (mm), and R is the mean multi-year rainfall erosion force (MJ·mm·ha−1·ha−1·yr−1).

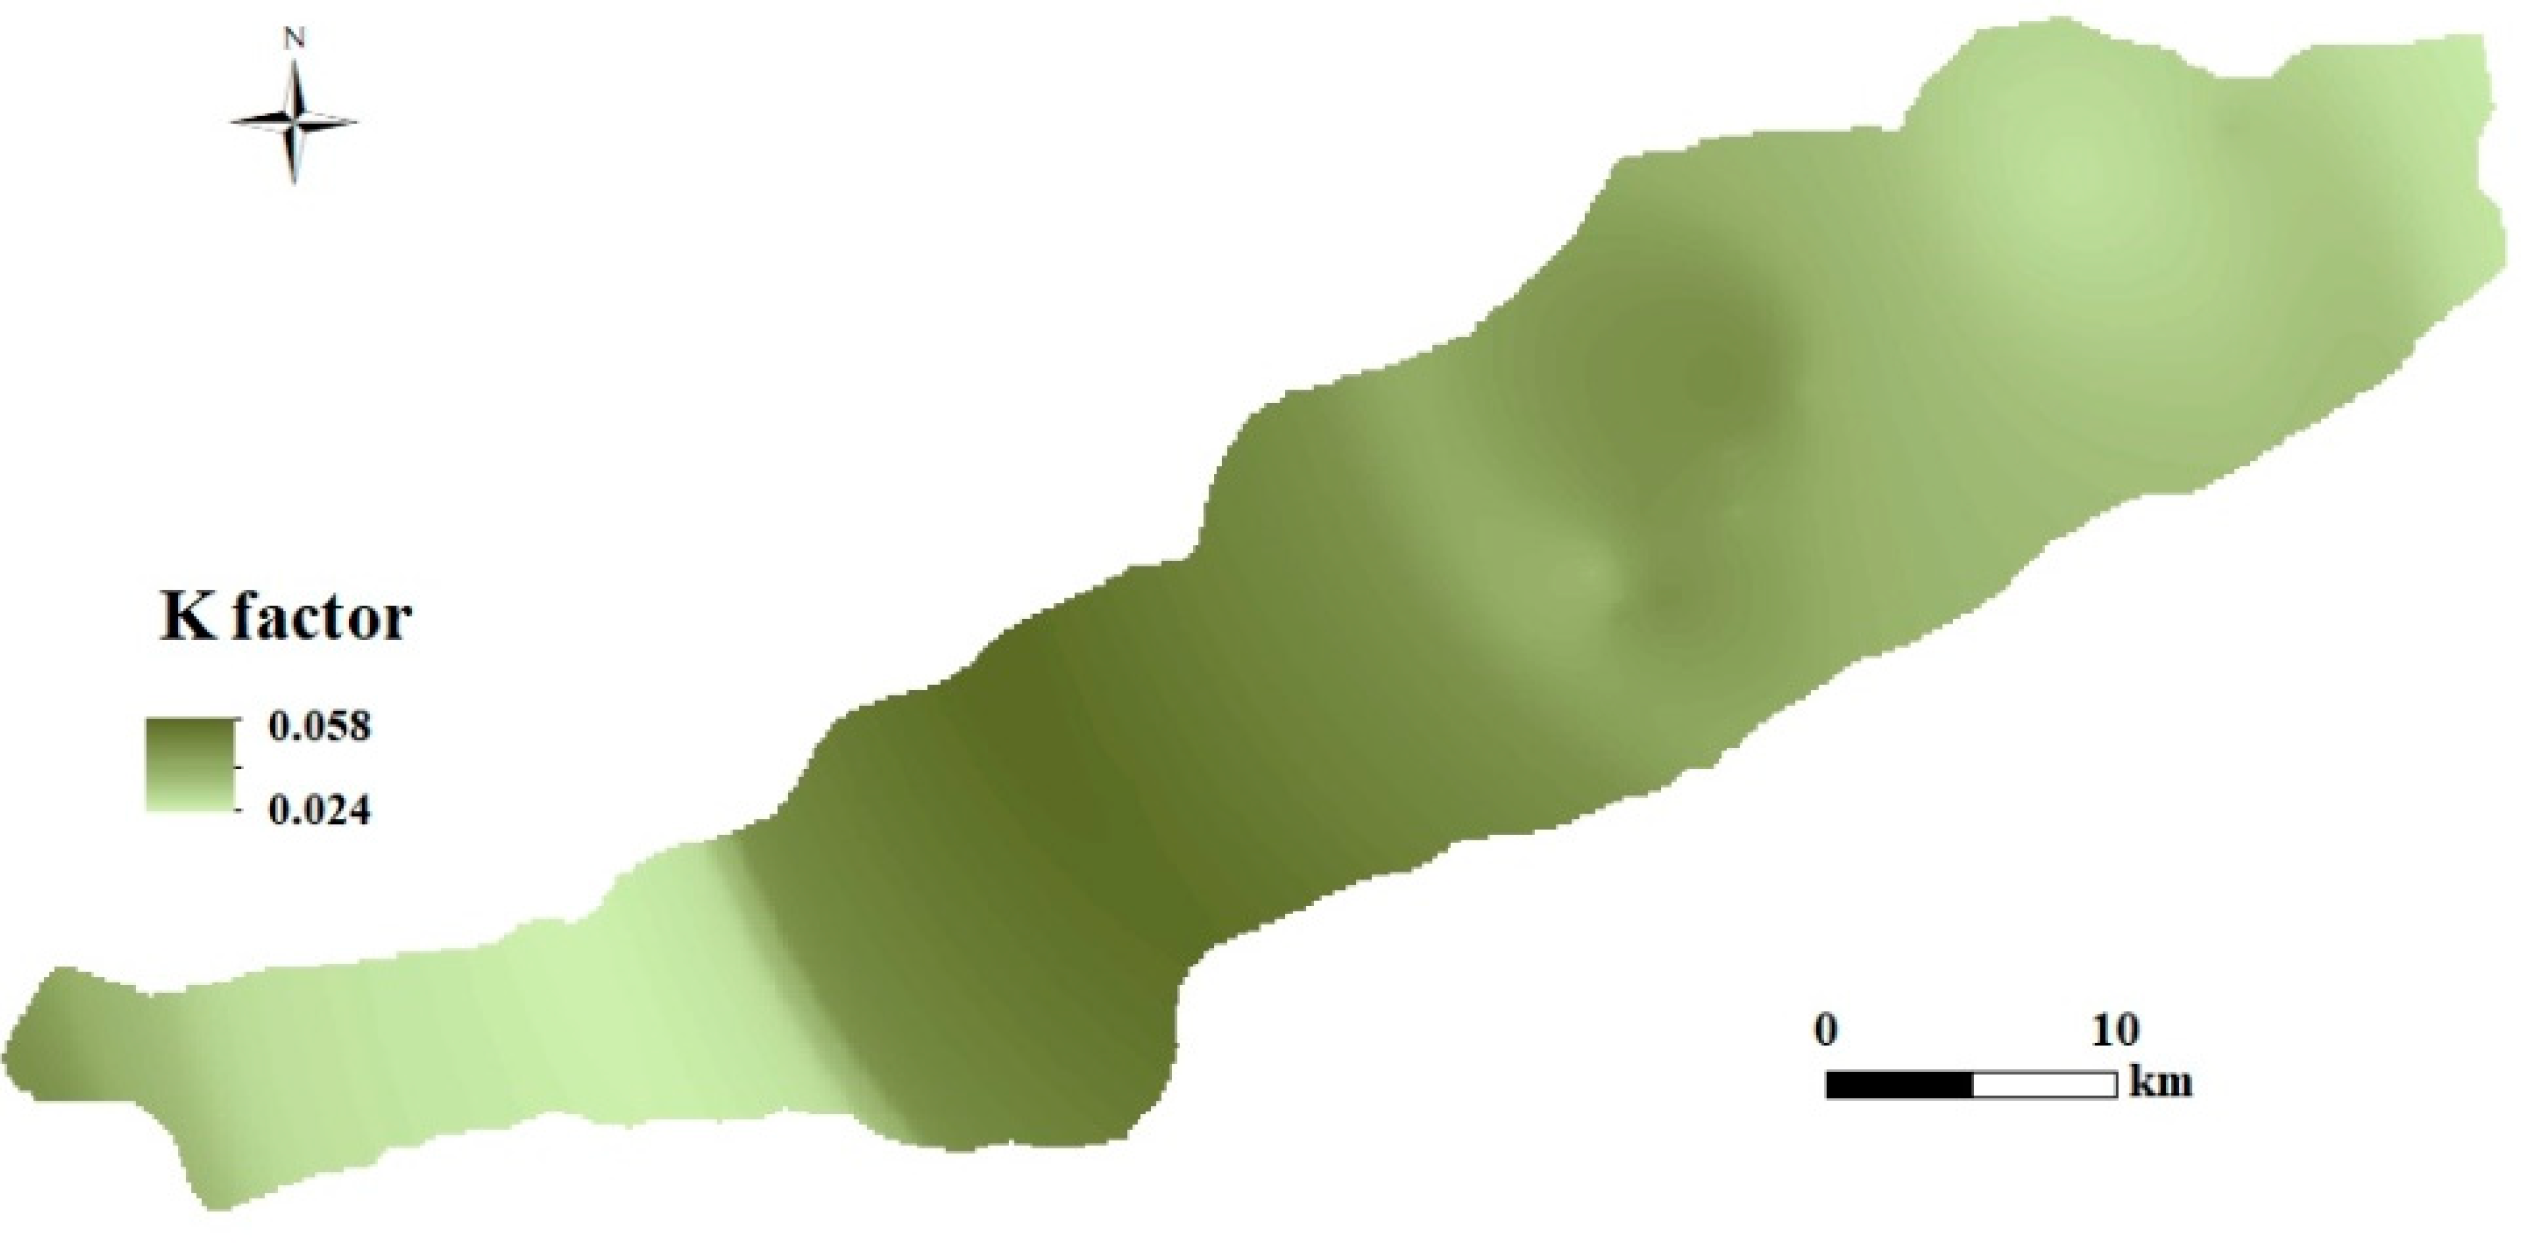
2.3.2. Soil Erodibility Factor (K)

Soil erodibility reflects the soil’s susceptibility to erosion and its capacity to be detached, transported, and washed away by rainfall erosive forces. The soil K value serves as a comprehensive indicator of the soil’s resistance to water erosion. Higher K values indicate a weaker ability of the soil to resist water erosion, making it more susceptible to erosion, while lower K values indicate a stronger resistance [43]. In this study, the soil data collected in the field were used to determine soil mechanical composition and organic carbon content using the equations from the erosion-productivity evaluation model EPIC, as proposed by Williams [44].
K = 0.1317 0.2 + 0.3 e x p 0.0256 · S A N 1 S I L 100 × S I L C L A + S I L 0.3 × 1 0.25 C C + e x p 2.95 C + 3.72 × 1 0.7 S N 1 S N 1 + e x p 5.51 + 22.9 S N 1
S N 1 = 1 - SAN / 100
where K is the soil erodibility factor measured in Mg·ha·h·MJ−1·mm−1·ha−1, SAN represents the mass fraction (%) of sand grains ranging from 0.020 to 2.000 mm, SIL represents the mass fraction (%) of silt grains ranging from 0.002 to 0.020 mm, CLA represents the mass fraction (%) of clay grains smaller than 0.002 mm, and C indicates the mass of soil organic carbon (%). The original ground US unit (sht·t·a·h/(100·ft·sht·t·ac·int)) is converted to the international unit (Mg·ha·h·MJ−1·mm−1·ha−1) by multiplying it by 0.1317.

2.3.3. Slope Length–Steepness Factor (LS)

Slope length refers to the distance along a slope from the starting point where surface runoff begins to the point where it converges into a gully. A longer slope results in a higher runoff velocity, higher surface flow, and greater erosive power [45]. Slope, on the other hand, indicates the steepness of the terrain at a specific location. It is a crucial factor influencing soil erosion in a region as it affects the flow velocity, infiltration rate, runoff volume, and soil scouring intensity [46]. To assess slope length and slope gradient at the watershed level, digital elevation DEM can be used. The slope length factor (L) is calculated using the slope length factor formula proposed by Desmet [47], while the slope gradient is determined using the formula developed by Liu Baoyuan [48]:
L = λ 22.13 n       n = 0.2 0.3 0.4 0.5       θ < 5 °       5 ° θ < 10 °       θ 10 °       θ 1 °  
S = 10.8 sin θ + 0.03 16.8 sin θ 0.50 21.9 sin θ 0.96 ( θ < 5 ° ) ( 5 ° θ < 10 ° ) θ 10 °
where θ is the slope in degree (°), extracted from DEM data; n represents the slope length index; and λ is represents slope length (m).

2.3.4. Vegetation Cover and Management Factors (C)

The vegetation cover and management factor is an important indicator for evaluating the capacity of vegetation to resist soil erosion. It refers to the ratio of soil loss on land with specific vegetation cover or field management to soil loss on bare land with no cover and clear tillage under similar soil, slope, and rainfall conditions. It ranges between 0 to 1, indicating the extent of protection provided by the vegetation [49]. To calculate the vegetation cover and management factor (C-factor), the normalized vegetation index (NDVI) is the most commonly used. In this study, we employed the method proposed by VanderKnijff et al. [50], which utilizes NDVI data, to determine the C-factor. This approach allowed us to measure the influence of vegetation cover on soil erosion accurately.
C = e x p α × N D V I / β N D V I
where α and β are dimensionless factors that determine the C-factor against NDVI. α = 2 and β = 1 are recommended by VanderKnijff as reasonable values.

2.3.5. Conservation Practice Factor (P)

The pre-processed remote sensing images underwent supervised classification using the Support Vector Machine (SVM) classifier. The classification results were then manually corrected through visual interpretation to obtain accurate land use data for the Nanxiong Basin, both before and after treatment. The classification criterion used was based on the Nanxiong Basin land cover classification criterion, in combination with field survey data. The land use in the study area was categorized into six classes: water bodies, forest land, grassland, built-up land, bare land, and cropland. To minimize the presence of isolated pixels and improve the overall quality of the classification, a 3 × 3 majority filtering technique was applied to the land use data. The overall accuracy of the classification was determined to be 89%, with a Kappa coefficient of 0.85, indicating a reliable classification result. In the RUSLE model, the determination of p value in RUSLE is primarily influenced by the combination of land use and slope [51].
The conservation practice factor represents the ratio of soil loss with specific measures in place to soil loss without any conservation measures, particularly down-slope planting. The main control measures for improving the P-factor are contour ploughing, contour strip planting, and terracing. These measures aim to mitigate soil erosion. Values ranging from 0 to 1 indicate the degree of erosion prevention, where a value of 0 signifies no soil erosion occurs due to effective soil and water conservation measures, and a value of 1 indicates the absence of any measures or complete ineffectiveness [52]. Studies have demonstrated that land use information can indirectly reflect the implementation of soil and water conservation measures. Assigning values to different land use types provides insights into their effectiveness. Woodland, grassland, and bare land typically receive a value of 1, indicating effective conservation measures. Water bodies and built-up areas receive a value of 0, indicating no measures are in place. For cultivated land, the slope gradient is taken into consideration. Generally, the steeper slopes require more prominent role of soil and water conservation measures. For instance, horizontal terraces have a P-factor of 0.1, while sloping cropland with control measures falls between 0.2 to 0.9. Previous studies suggest assigning a value of 0.4 for these categories [53,54].

2.3.6. Erosion Intensity Classification

According to the SL190-2007 Soil Erosion Classification and Grading Standard [55] issued by the Chinese Ministry of Water Resources, the soil erosion intensity in various plots within the Nanxiong Basin is classified into different grades. In the southern red loam hilly area, the allowable soil loss is defined as <500 t·km−2·yr−1. To assess the soil erosion across the study area, the soil erosion modulus was re-classified into several categories: slight erosion (<500), mild erosion (500–2500), moderate erosion (2500–5000), strong erosion (5000–8000), extremely strong erosion (8000–15,000), and severe erosion (>15,000), with the classification unit being t·km−2·yr−1. This classification provides the erosion intensity assessment for the Nanxiong Basin before and after treatment. By comparing indicators such as eroded area, total erosion volume, and average erosion modulus for different classifications of soil erosion intensity, a comprehensive evaluation can be conducted.

2.3.7. Soil and Water Conservation Measures

The integrated management of the Nanxiong Basin encompasses four program implementation blocks: forestry and grass measures, soil and water conservation engineering measures, comprehensive land consolidation, and enclosure monitoring. The forestry and grassland measures encompass an area of 93 km2. By growing grasses first then combining trees to turn the landcover into mixed coniferous forests, the vegetation cover is increased and a flourishing plant community is formed. Water and soil conservation projects cover an area of 25.2 km2. The slope is generally dammed, valley slopes are built, and ditches are opened to reduce the slope and reduce runoff. The land comprehensive improvement area holds the largest coverage and represents a long-term project, including farmland reclamation, water-saving irrigation techniques, soil improvement strategy, increased infrastructure development, and the promotion of non-agricultural industrial activities. Enclosure monitoring encompasses an area of 54.1 km2 and primarily involves afforestation and ecological monitoring.

3. Results

3.1. Dynamics of Single Factors

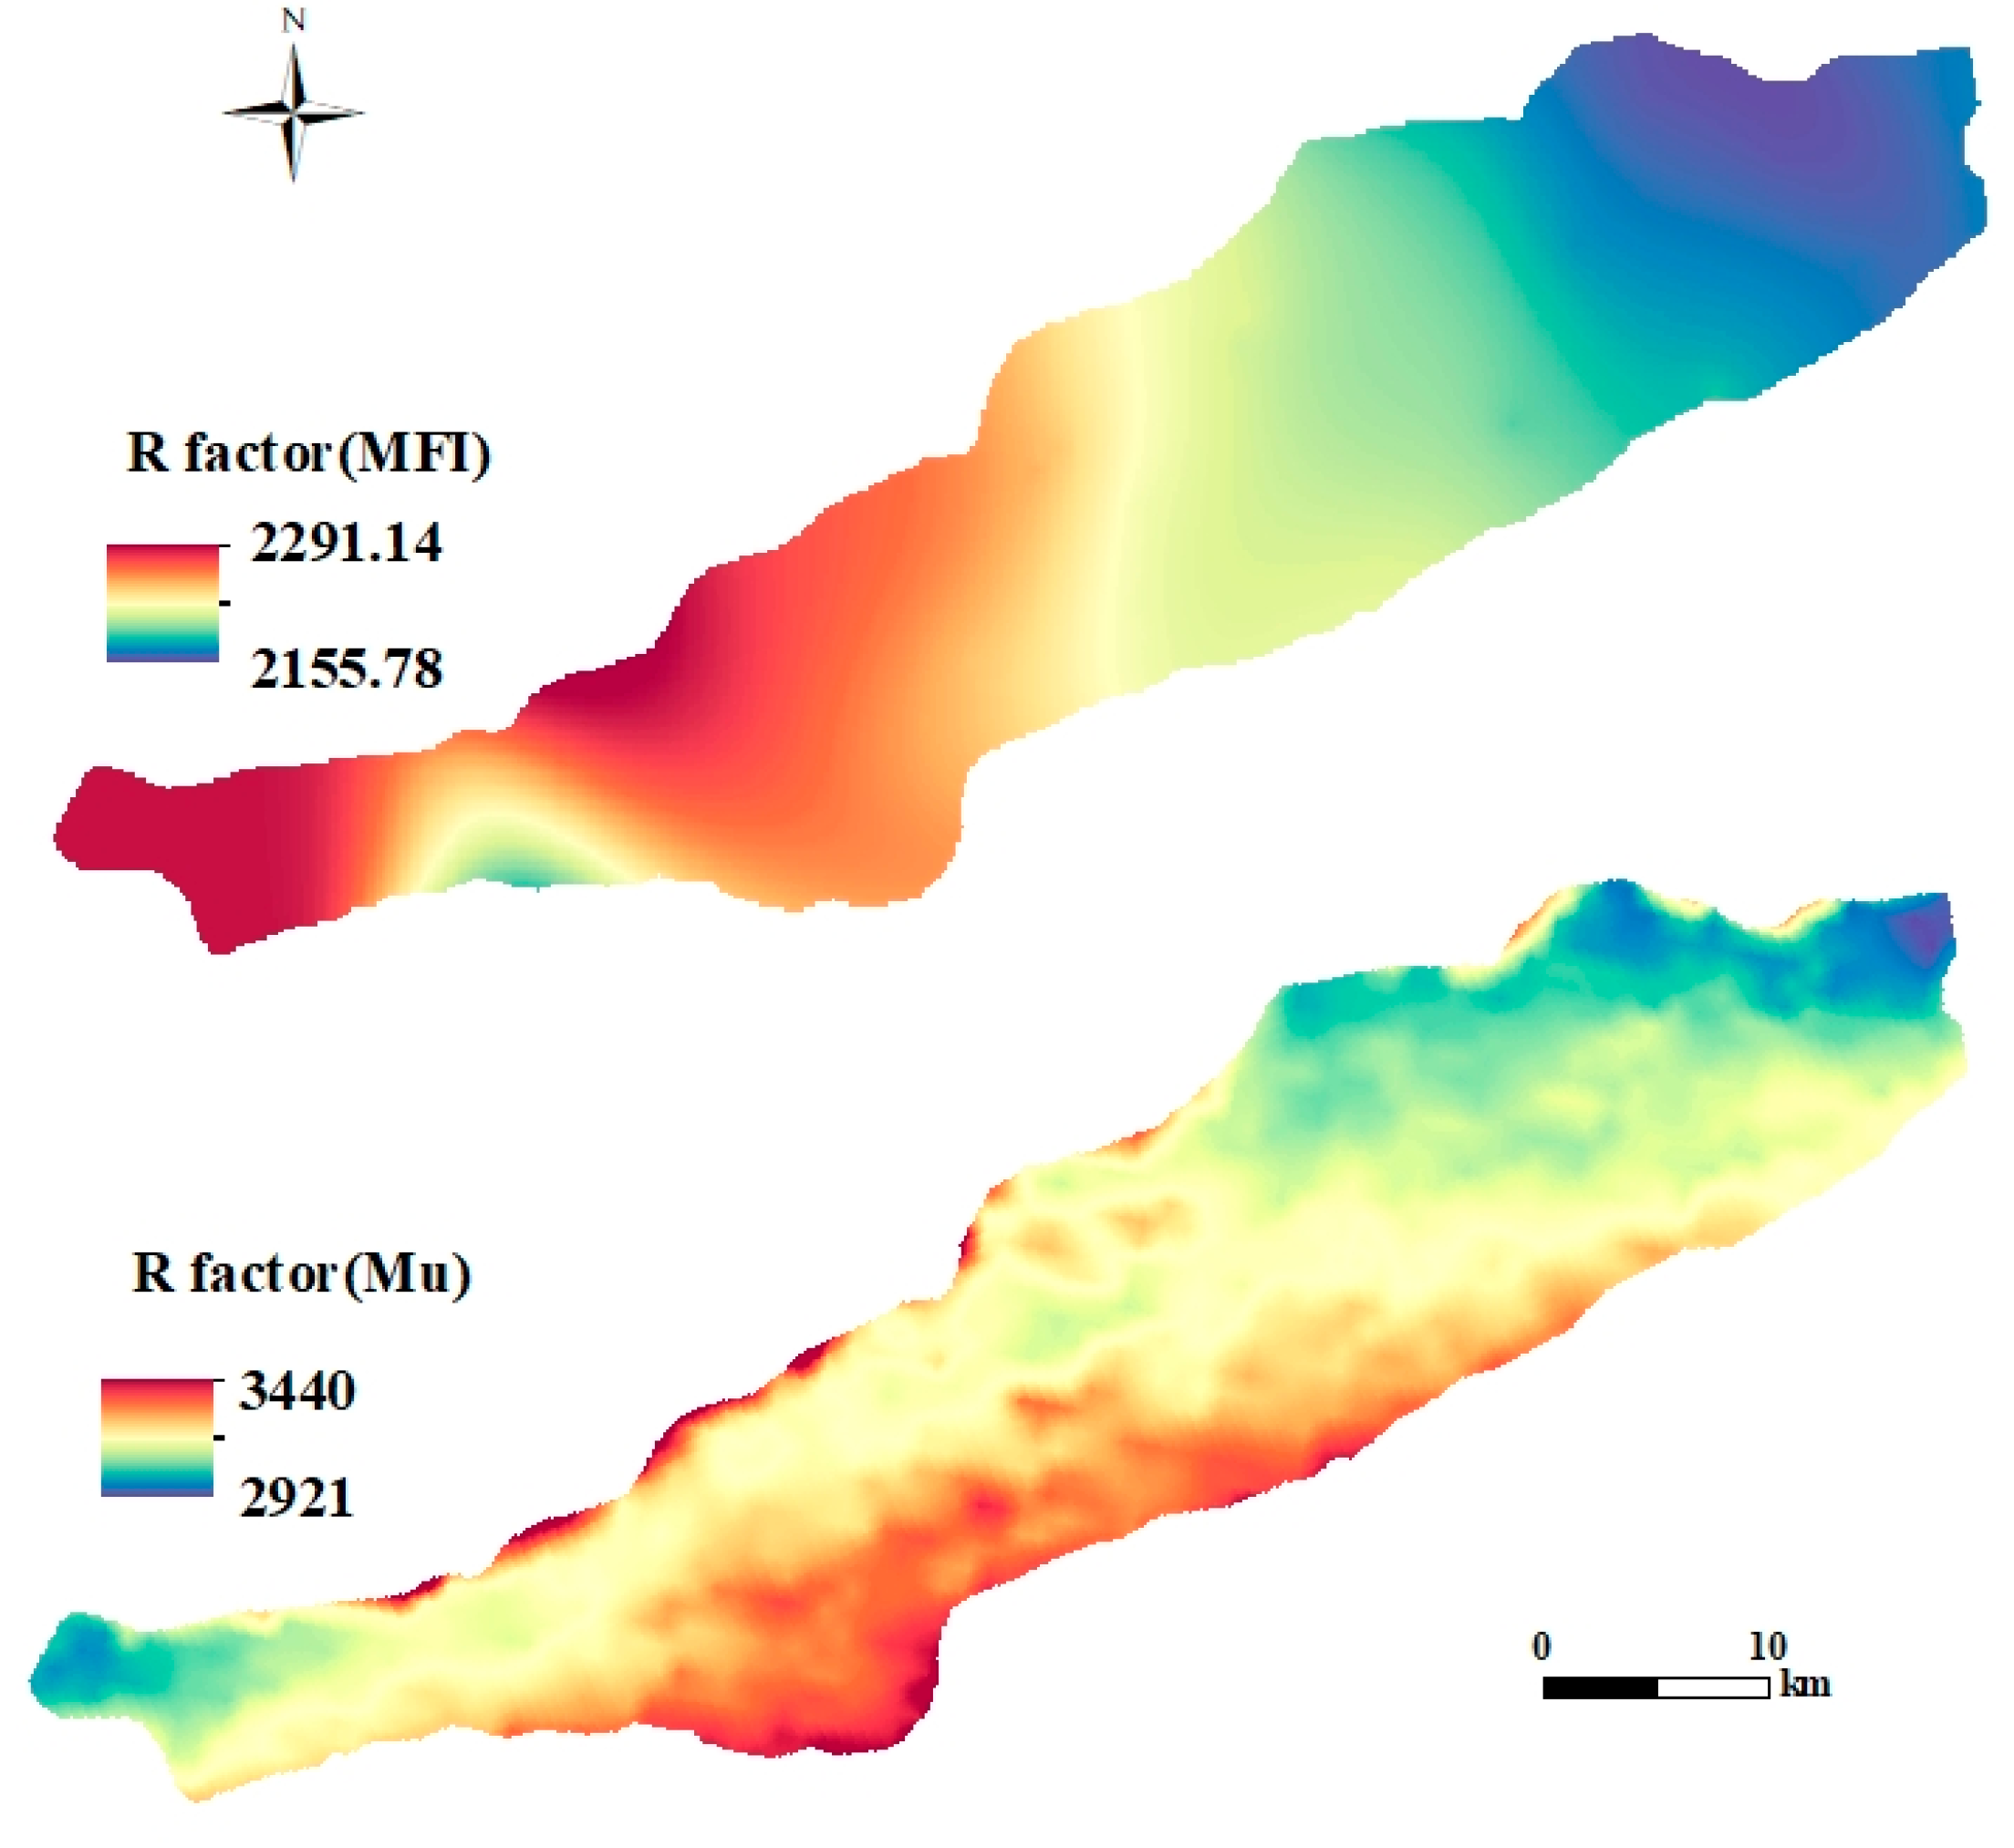
3.1.1. Rainfall Erosivity Factor (R)

Rainfall erosion forces are often influenced by the duration and intensity of rainfall, which are expressed as R-factor values [56]. In this study, monthly rainfall data from 30 rainfall stations were utilized to calculate the R-factor using Equation (3) (Figure 4). The calculated values of rainfall erosion force factors ranged from 2155.78 to 2962.39 MJ·mm·ha−1·ha−1·yr−1, with mean values of 2216.70 and 2680.76 MJ·mm·ha−1·ha−1·yr−1 in 2020 and 2022, respectively, primarily during the spring and summer seasons. The study revealed that the overall rainfall erosion force was higher in 2022 compared with 2020. Specifically, the average rainfall erosion force in the study area during June 2022 reached 2590.0 MJ·mm·ha−1·ha−1·yr−1, mainly due to the exceptionally heavy rainfall in Nanxiong City during that month. To visualize the spatial distribution of rainfall erosion forces, kriging interpolation was applied (Figure 4), revealing a notable clustering effect. The values of rainfall erosion force increased when moving towards the central part of the study area. Consequently, these areas may experience extensive sheet and rill erosion due to the substantial runoff generated.

3.1.2. Soil Erodibility Factor (K)

This study was conducted based on 39 soil samples collected during field surveys to determine the particle composition and organic matter content. Subsequently, soil erodibility factors in the study area were calculated using Equations (4) and (5), and the corresponding results are presented in Table 2. The findings reveal that sandy loamy soils predominate the entire study area, with sand grains constituting more than 50% of all sites. Notably, in the red-beds desert, the proportion of sand grains in the red-beds desert exceeds 85%, indicating a low cohesive capacity between soil particles. Consequently, the soil exhibits characteristics such as coarse grains, poor cohesiveness, and a loose structure. The soil erodibility factor K exhibited maximum, minimum, and mean values of 0.058, 0.024, and 0.043, respectively. Significantly, the mean value of the K factor in the study area exceeded that previously reported for the entire Guangdong region [51]. Despite the Nanxiong Basin’s location in the northeast of the Nanling Mountains, the presence of the red-beds desert has resulted in a continual decrease in soil water content. The desert’s influence has led to the loosening and sanding of the topsoil, thereby exacerbating erodibility over time. Furthermore, the sensitivity of soil erosion in the study area is demonstrated by employing the kriging method for spatial interpolation of the soil erodibility K-factor, enabling the mapping of its spatial distribution (Figure 5). Overall, the soil erodibility is low in the central part, gradually increasing from the central area towards the east, reaching a maximum K factor in the north-western region. However, in the western part, there is an opposite trend with the K factor gradually decreasing. This pattern is attributed to the overall loose soils in the eastern part of the Nanxiong Basin and the extensive distribution of the red-beds desert.

3.1.3. Slope Length–Steepness Factor (LS)

Soil erosion rates are influenced by the energy and velocity of water flow, which increase as lengths become longer and slopes become steeper [57]. The slope length (LS) factor was calculated using Equations (6) and (7) utilizing a 30 m resolution Shuttle Radar Topography Mission (SRTM) Digital Elevation Model (DEM) in ArcGIS. Figure 6 illustrates the variability of the LS factor in the study area, ranging from 0 to 214.62, with a mean value of 6.00. Areas characterized by high and steep slopes tend to exhibit a higher LS factor, while catchments with low slopes generally have a lower LS factor. Additionally, the LS factor gradually increases along the river channel.

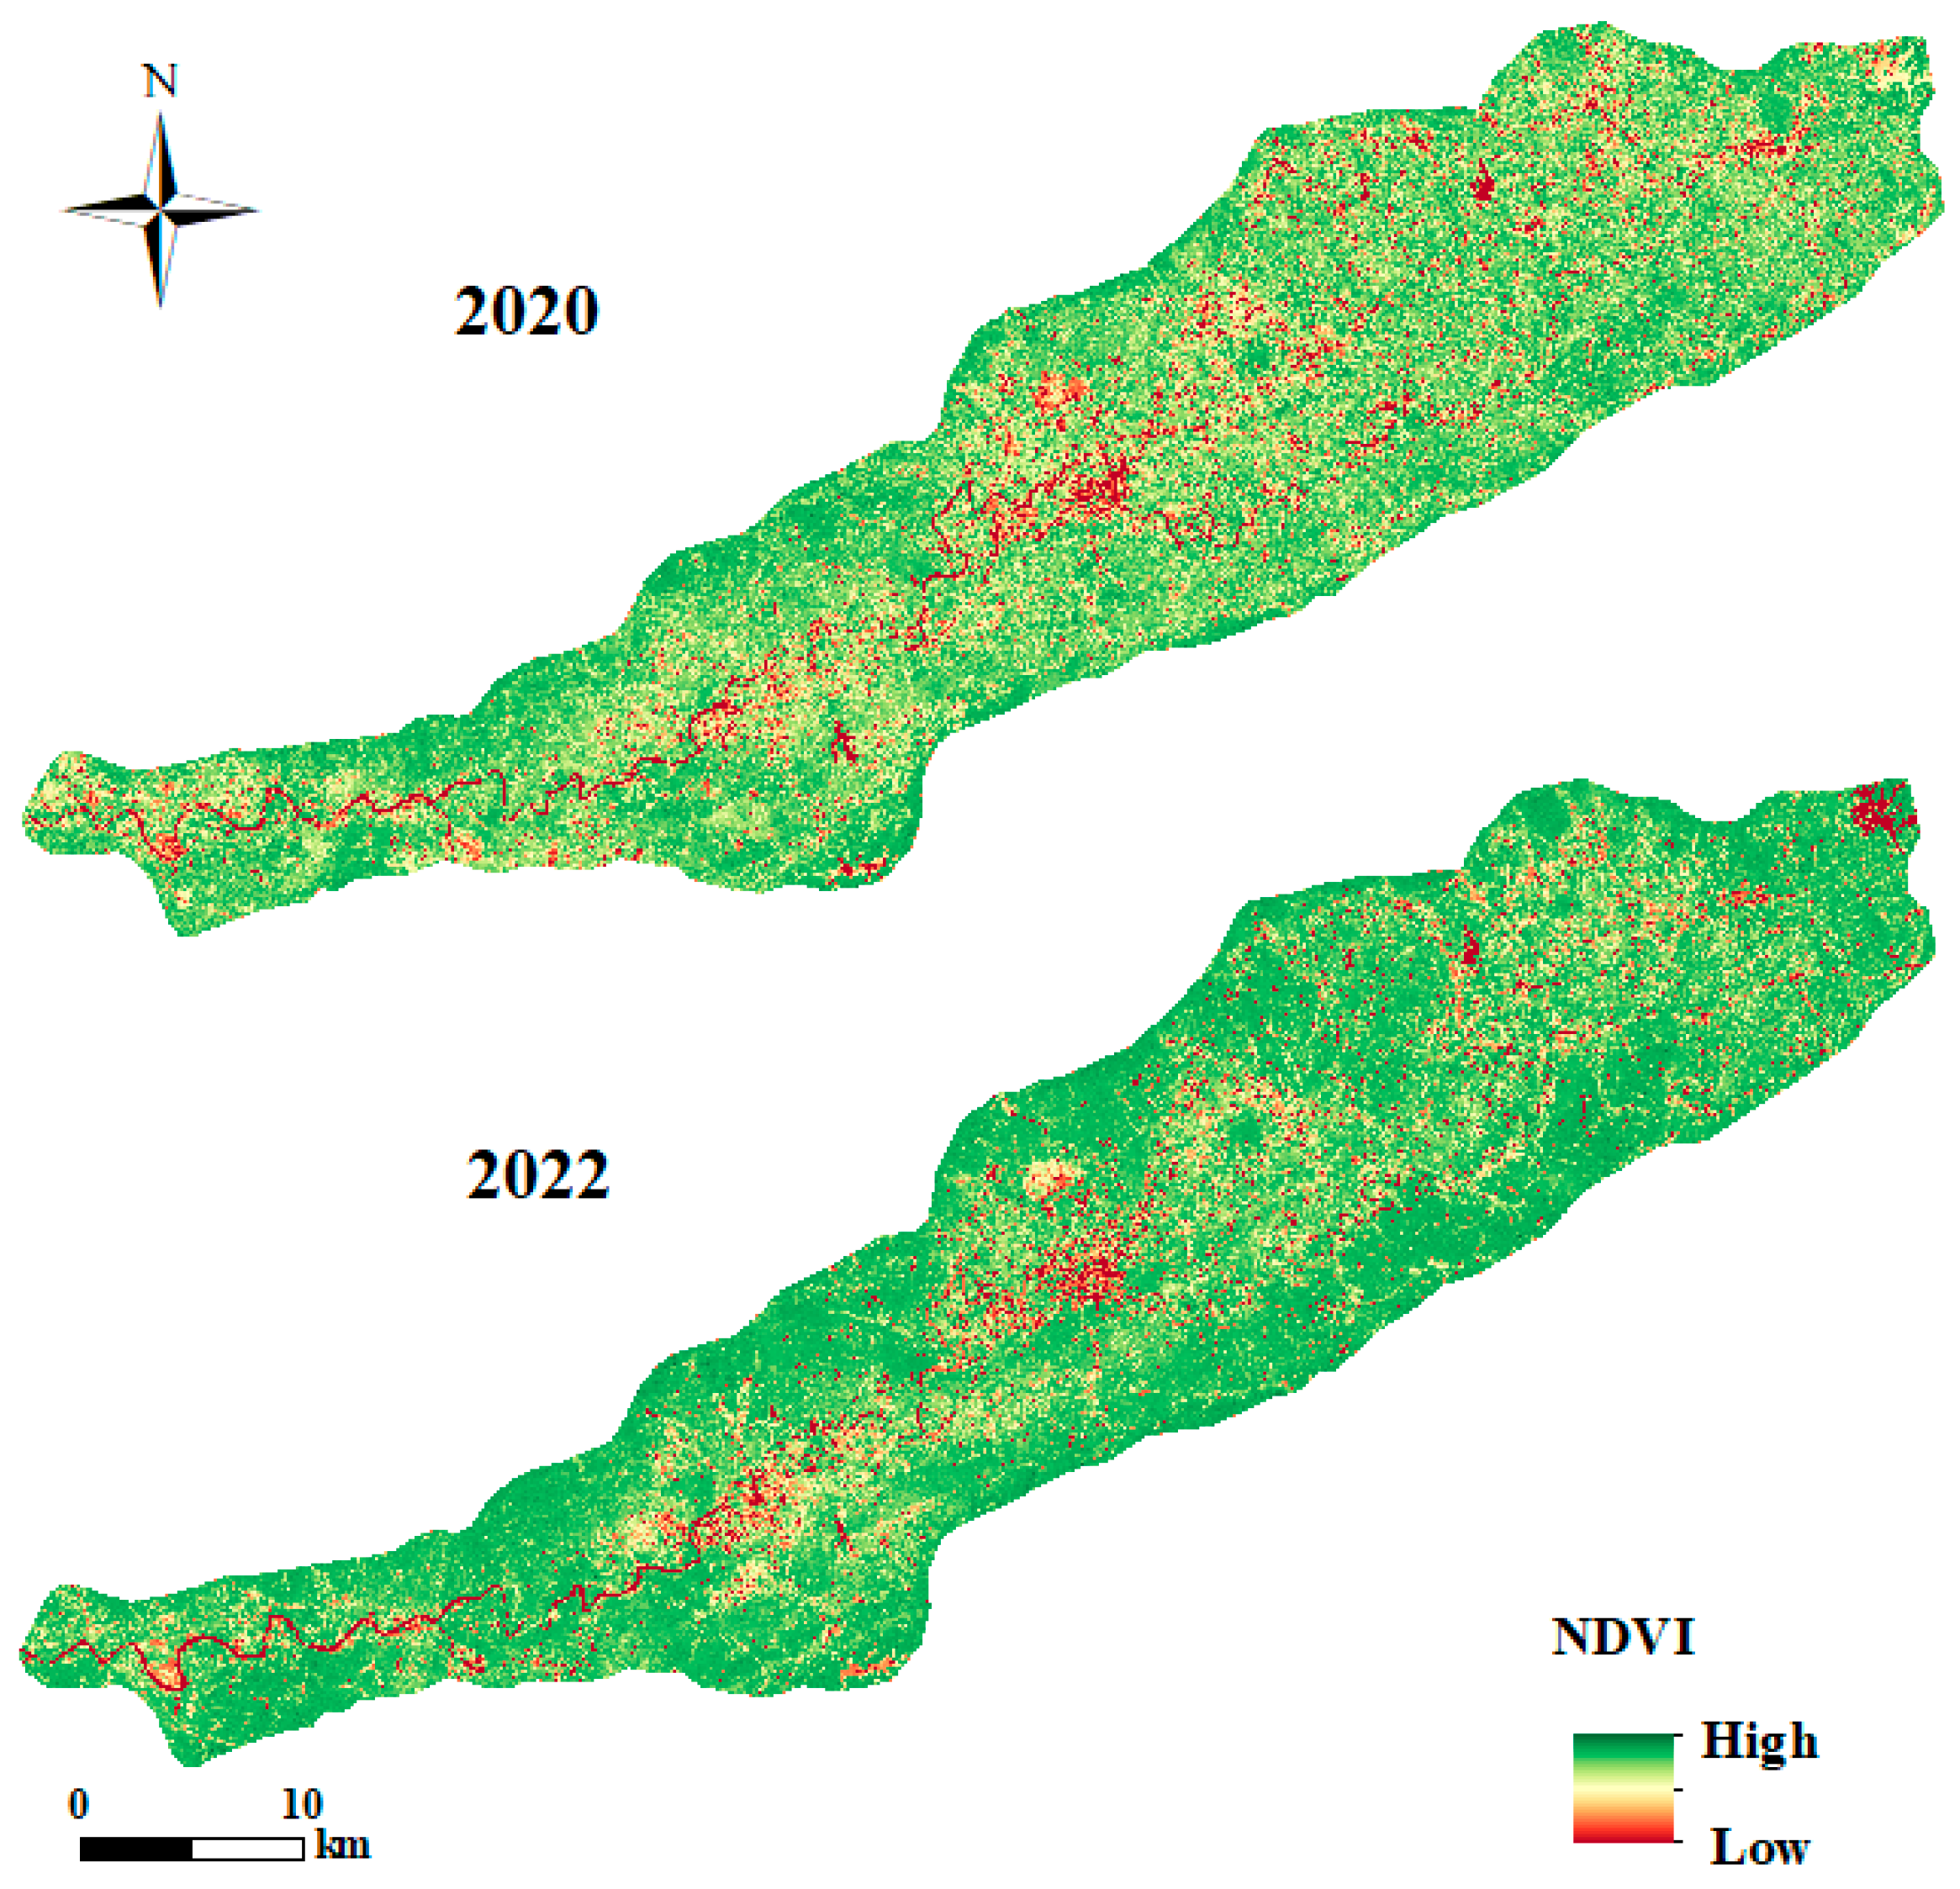
3.1.4. Vegetation Cover and Management Factor (C)

The average NDVI value in the study area showed an increase from 0.49 before the treatment to 0.60 after treatment, suggesting a progressive expansion of vegetation cover in the Nanxiong Basin over time. Spatially (Figure 7), NDVI exhibited an increasing trend from the basin’s center towards its edges, with a greater prevalence of woodland cover near the basin’s margins. Notably, the central flatlands, characterized by significantly populated areas, exerted a pronounced influence on the ecological environment. The calculation of vegetation cover and management factors is based on Equation (8). The C factor demonstrated a negative correlation with NDVI; where a higher NDVI corresponded to lower C factors, and vice versa. This correlation aligns with the spatial distribution pattern observed for NDVI. The treatment resulted in a reduction in high C-factor within the Nanxiong Basin, with the highest values predominantly occurring in the central and northeastern regions. This observation suggests a continuous improvement in the vegetation condition across the Nanxiong Basin (Figure 8).

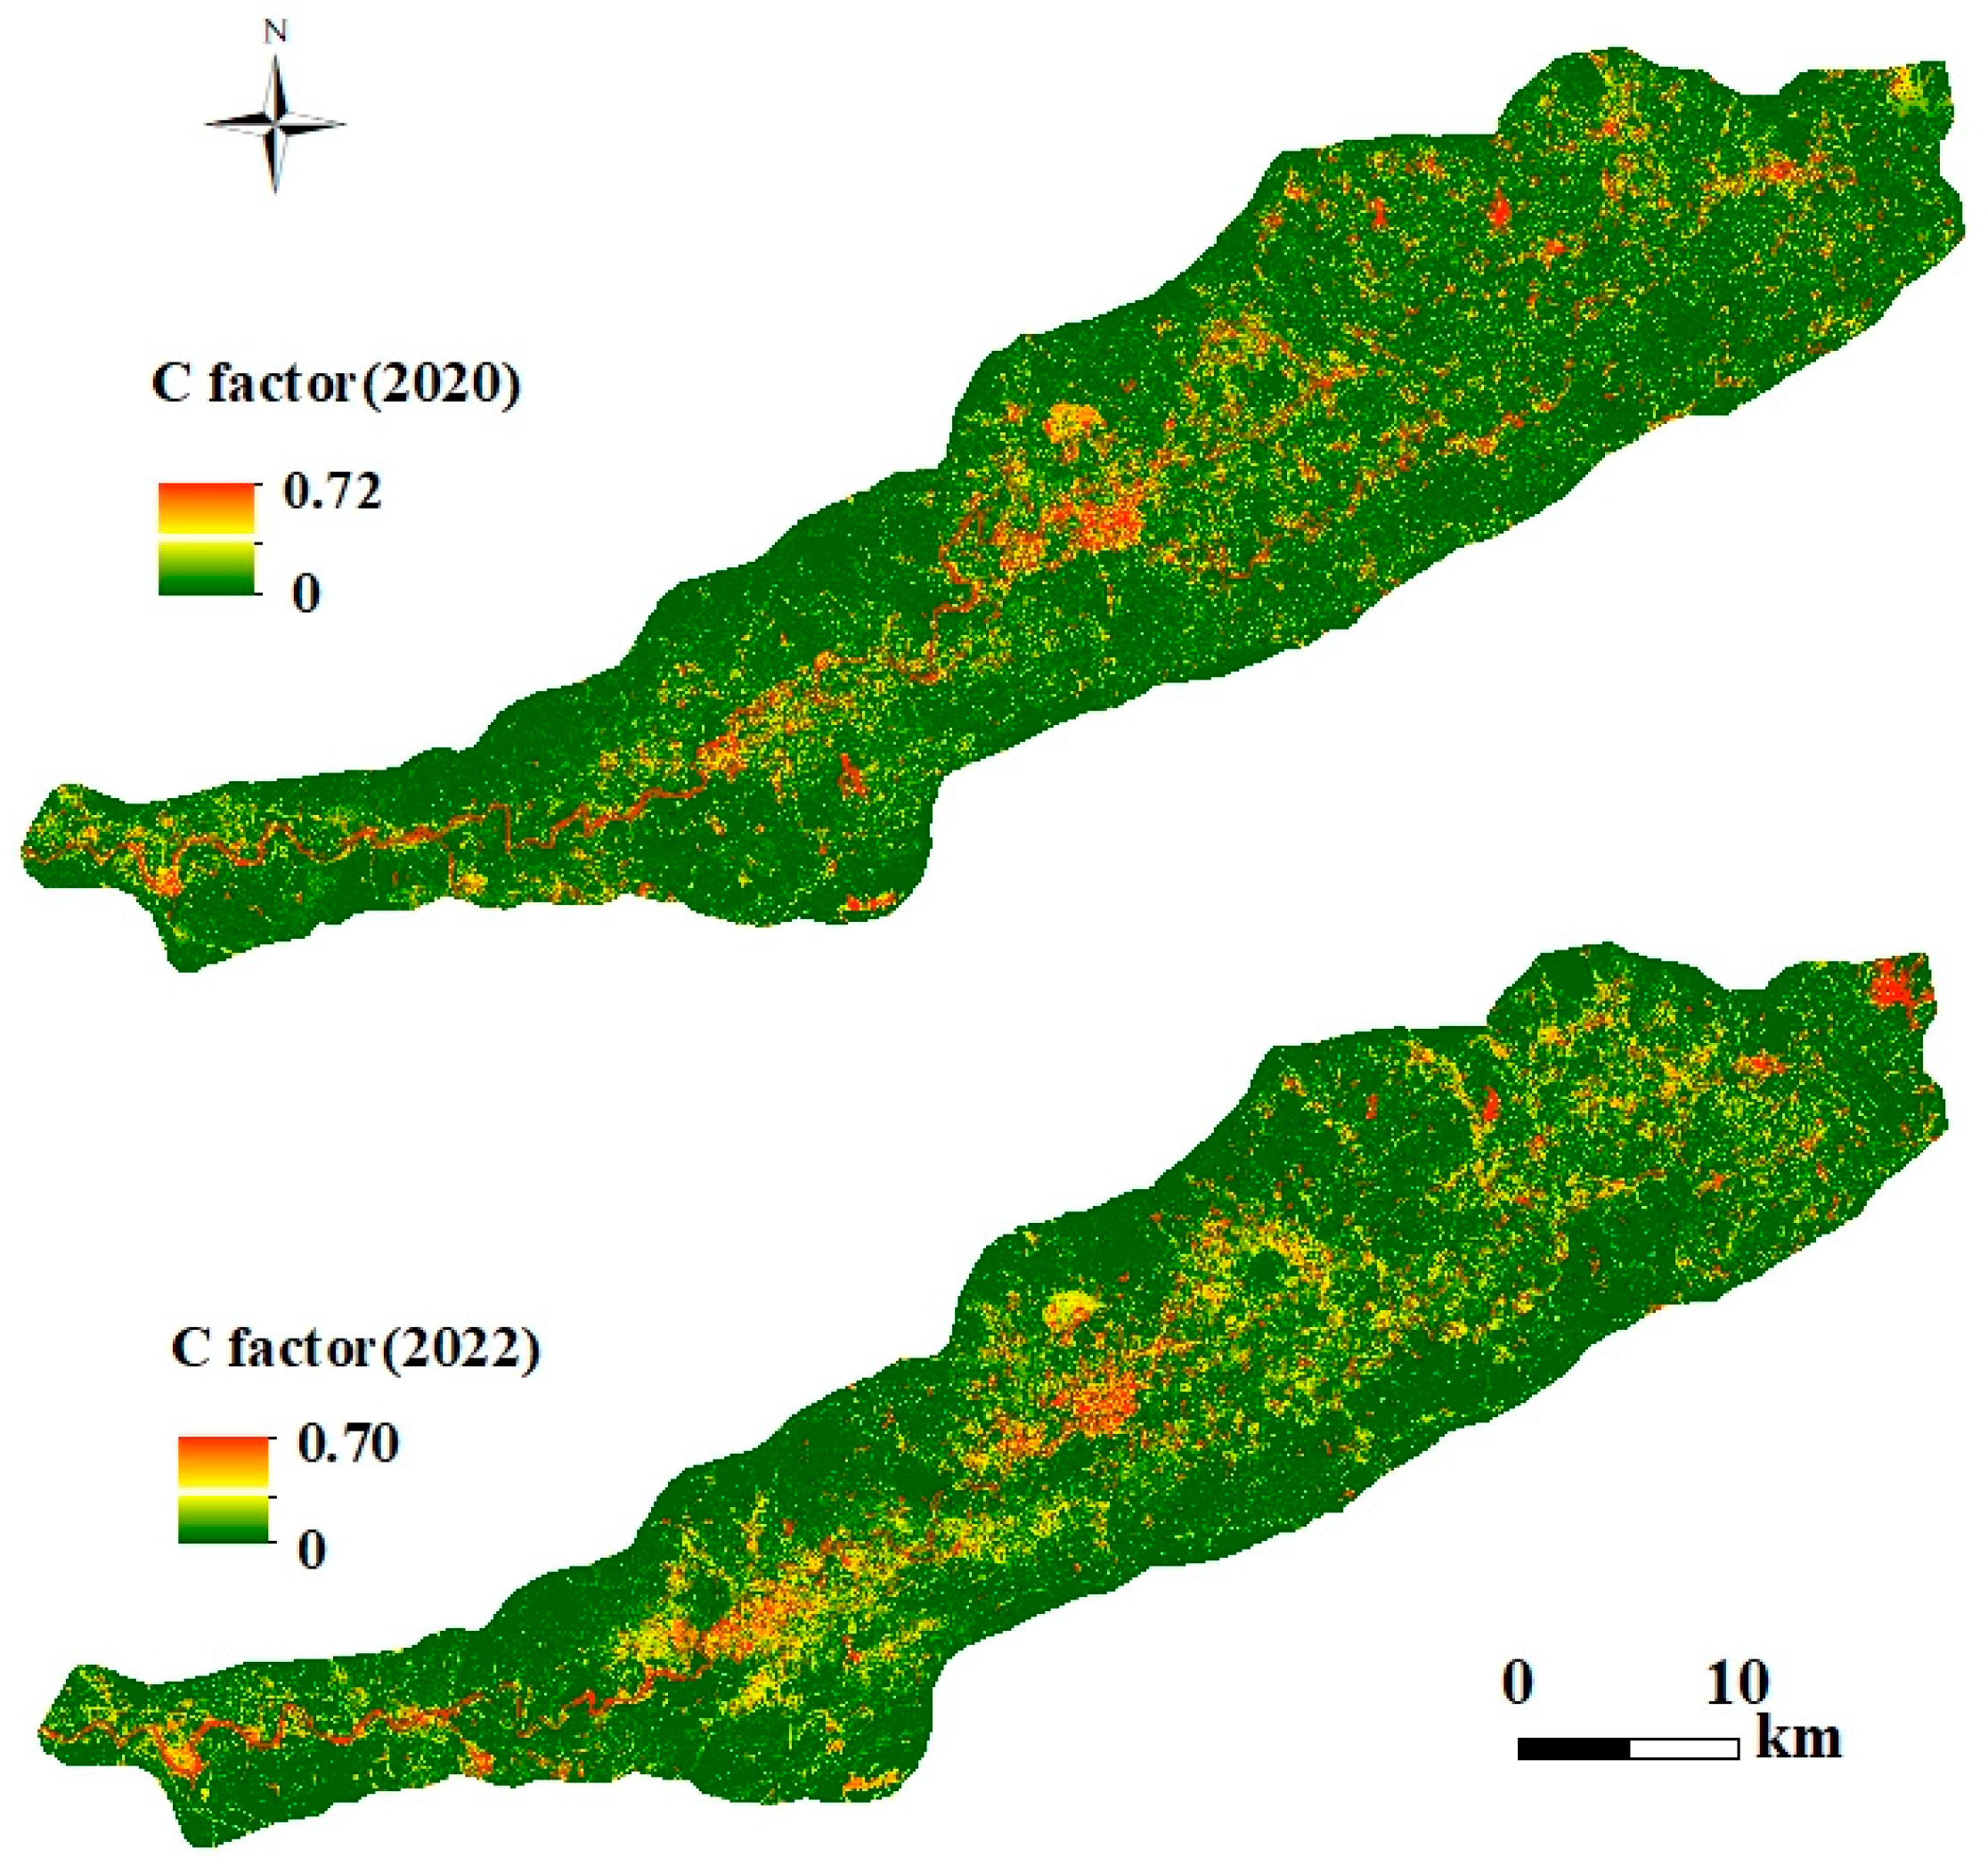
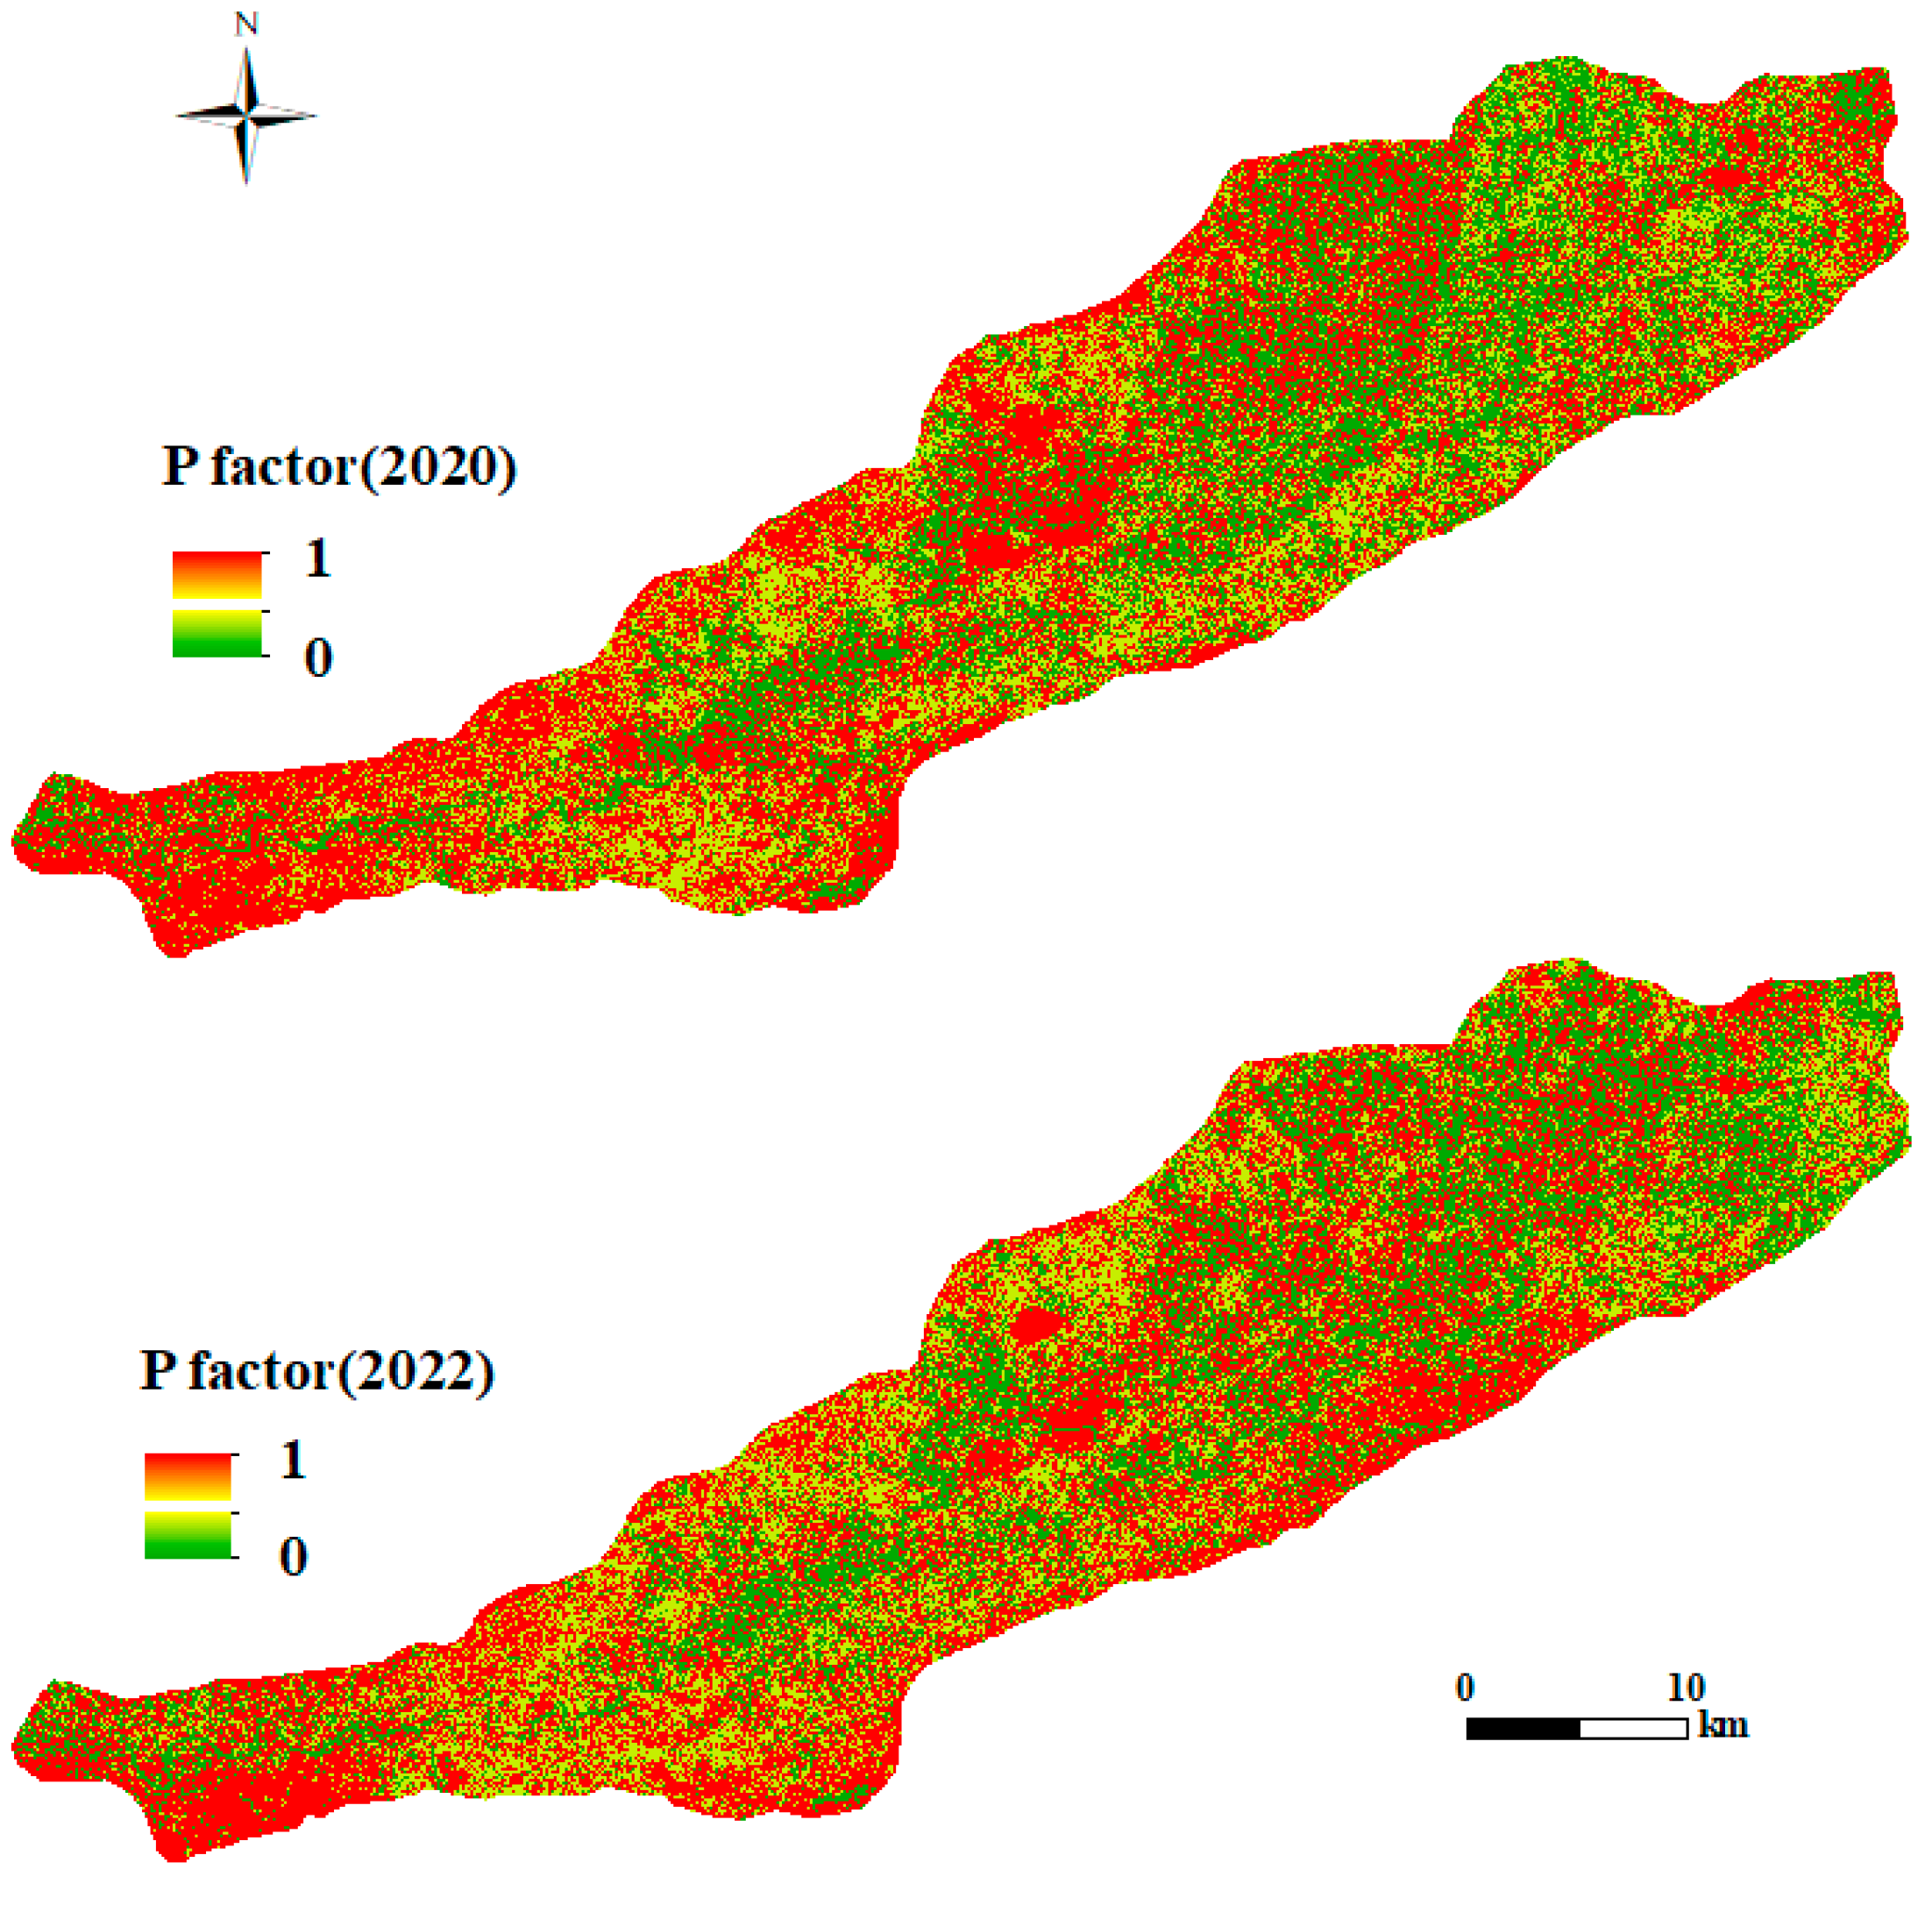
3.1.5. Conservation Practice Factor (P)

The conservation practice factor ranges from 0 to 1, with lower values indicating better conservation practices, and vice versa. As shown in Figure 9, the spatial distribution of the P-factor in the Nanxiong Basin before the treatment exhibited higher values near the basin’s margins and in the central region. These areas experienced greater anthropogenic disturbances, coexisting with the ‘red sand ridge’ landscape, and had limited implementation of soil and water conservation measures, leading to a higher P-factor. However, following the treatment, a general downward trend was observed, attributing the expansion of woodland areas in the northern region and the reclamation and reforestation of certain previously barren lands. Consequently, there was a reduction in the P-factor. Despite the further expansion of the town’s built-ups in the central region, the range of high P-factor decreased. This reduction can be attributed to the implementation of impervious surface extensions and urban reforestation measures, which have reinforced soil and water conservation efforts and reduced soil erosion.

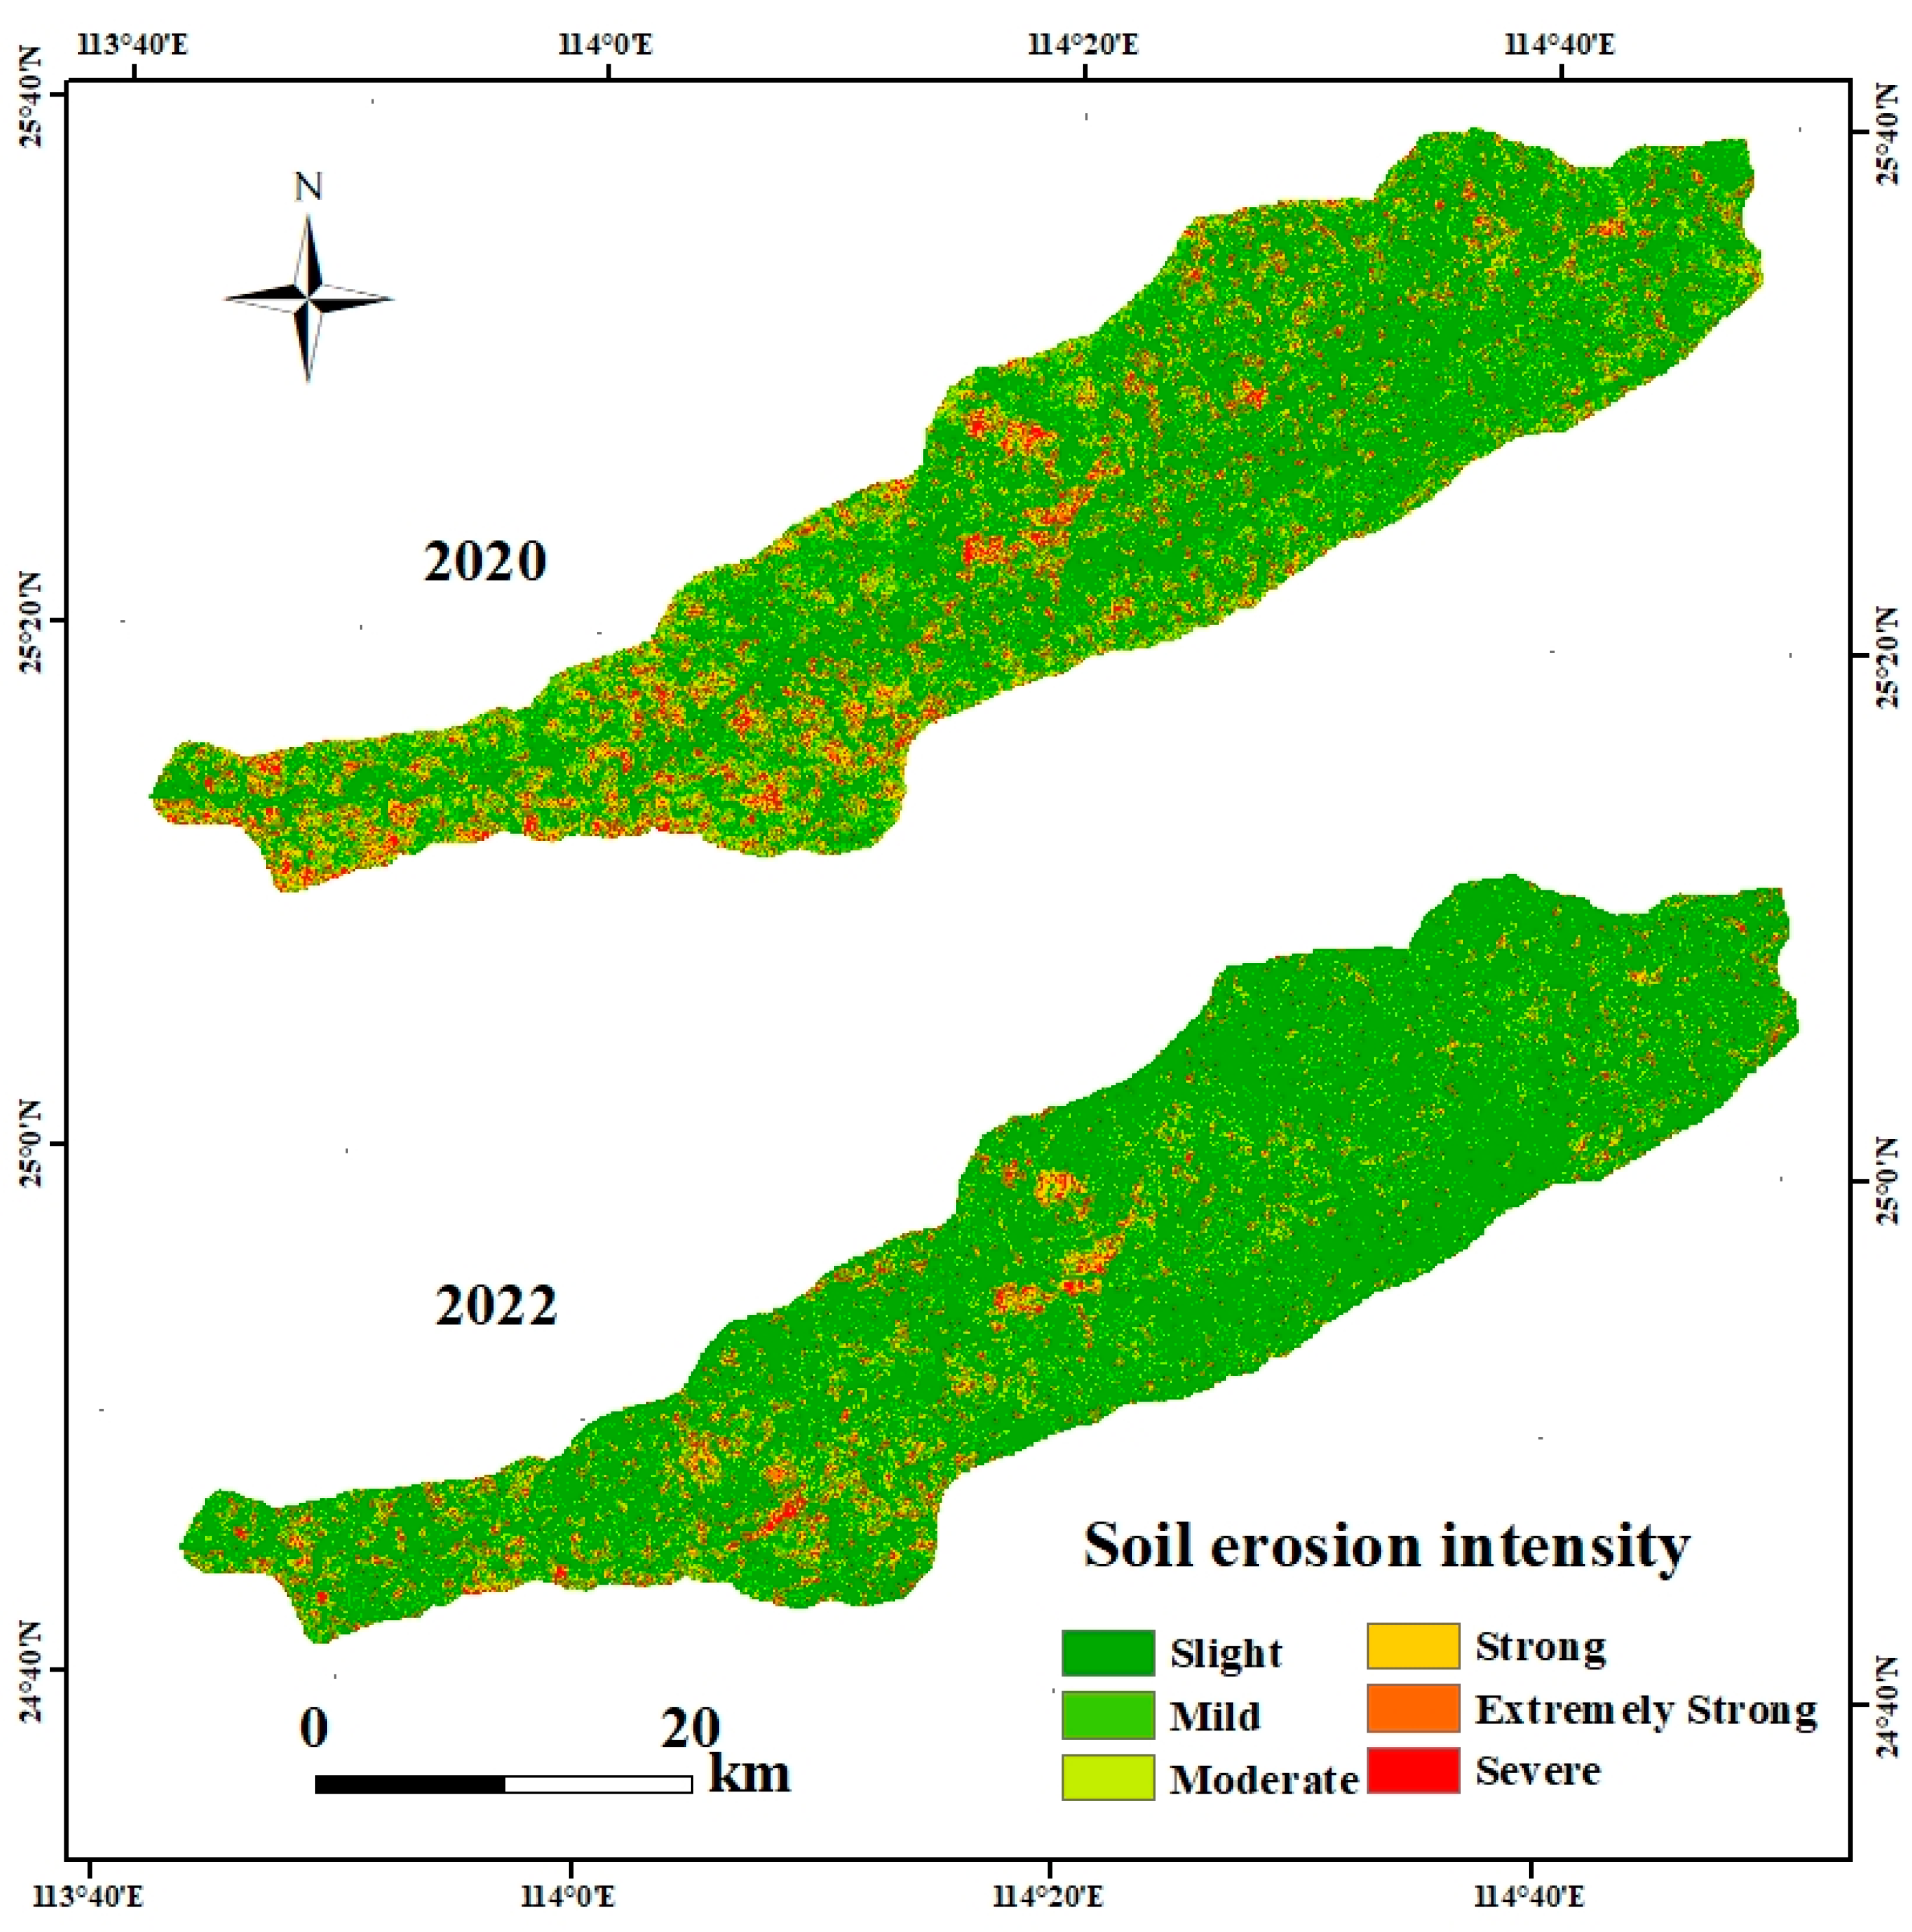
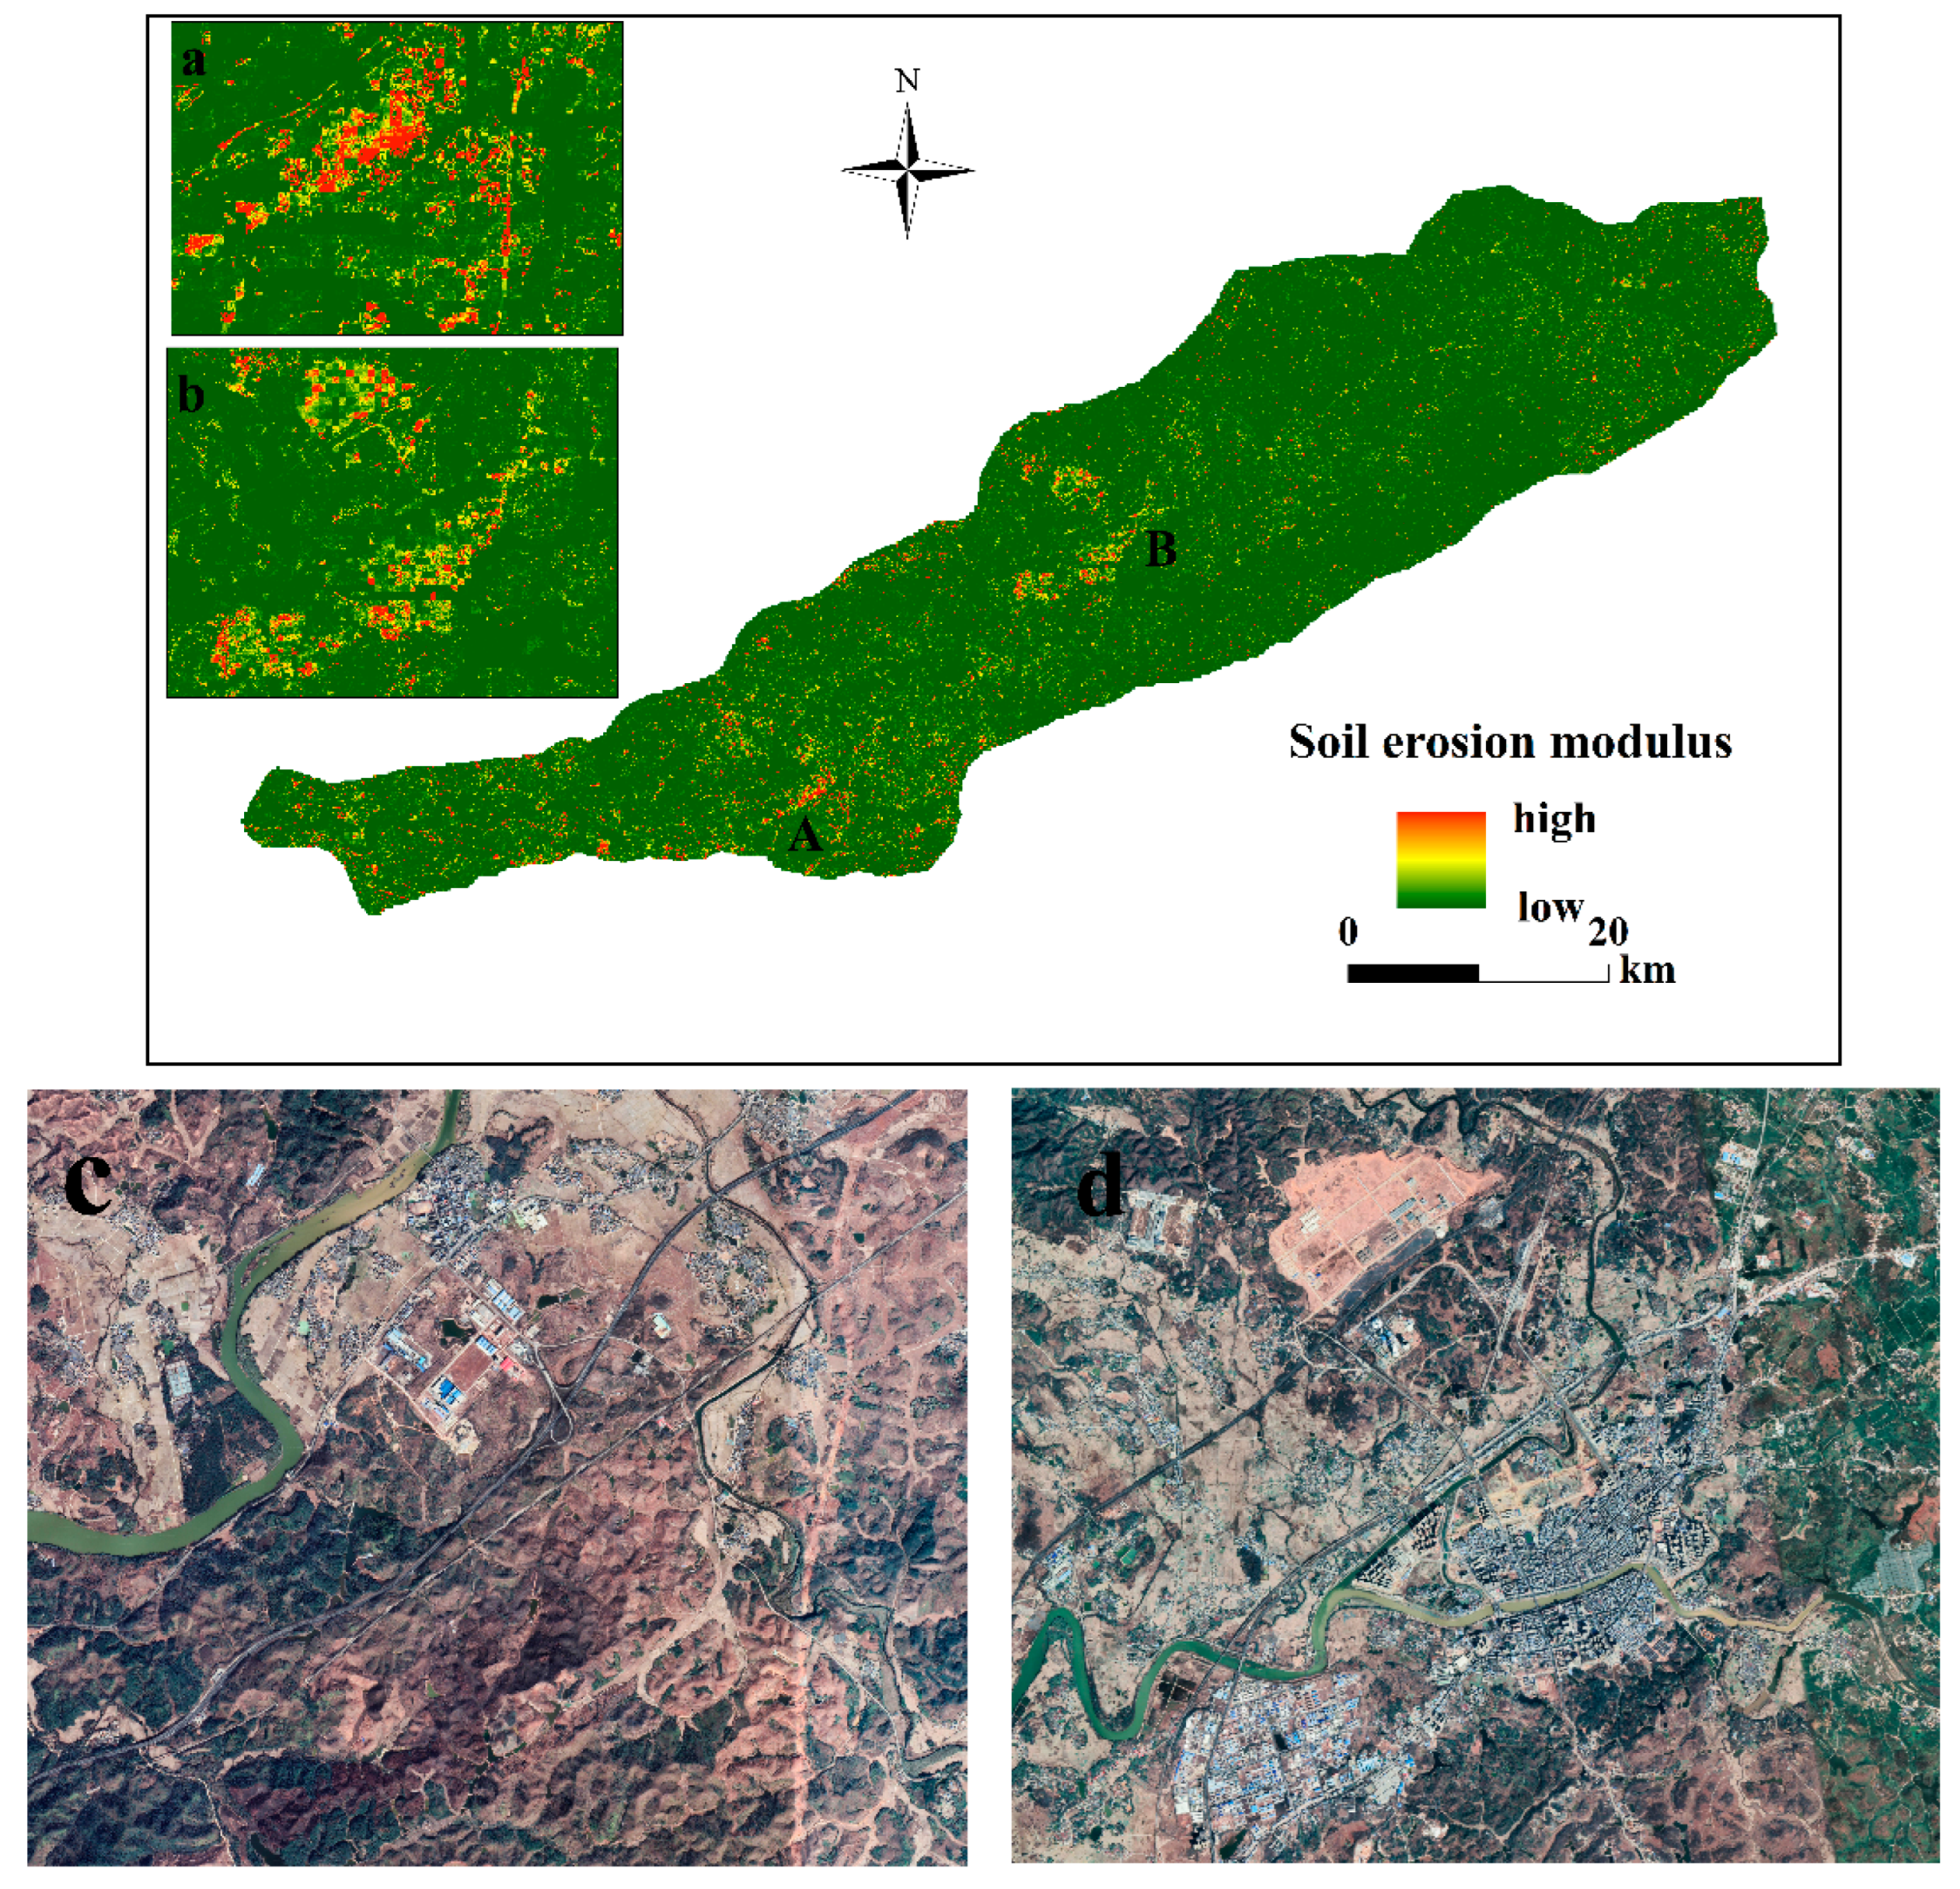
3.2. Spatiotemporal Patterns of Soil Erosion

Before the treatment in 2020, the average soil erosion rate in the Nanxiong Basin was 3943.56 t·km−2·yr−1, resulting in a total soil erosion of 4.64 million tons, indicating a moderate level of erosion. In terms of the area and soil erosion volume, the largest proportions were attributed to very slight erosion and mild erosion, covering areas of 712.8 km2 and 196.6 km2, accounting for 65.54% and 18.08%, respectively. However, the corresponding volume of soil erosion was relatively small, with very slight erosion contributing only 52,698.45 tons per year. Subsequently, moderate erosion and severe erosion accounted for areas of 58.5 km2 and 55.8 km2, representing 5.38% and 5.13% of the total soil erosion area, respectively. Notably, extremely severe-level erosion exhibited a soil erosion rate of 48,802.4 t·km−2·yr−1. The corresponding erosion volume for extremely severe-level erosion could reach 2,723,173.9 tons per year, approximately 50 times greater than the total volume of very slight erosion. This severe level of erosion predominates the Nanxiong Basin. The areas affected by strong and extremely strong erosion were relatively small, accounting for only 2.84% and 3.03%, respectively (Table 3). Examining the distribution of erosion (Figure 10), slight erosion and mild erosion primarily occurred in the low-lying flat areas before the treatment. Moderate erosion predominantly affected low-altitude regions near farmlands. Strong erosion, extremely strong erosion, and severe erosion were mainly in the areas with low vegetation coverage and higher altitudes, particularly within the red-beds desert and built-up areas.
Following the treatment in 2022, the average soil erosion rate in the Nanxiong Basin was recorded as 2023.1 t·km−2·yr−1, resulting in a total soil erosion of 2.38 million tons, indicating mild-level erosion. When considering the extent and quantity of soil erosion, slight erosion and mild erosion are major levels, with slight erosion covering the largest area of 907.8 km2 (80.96%), followed by mild erosion, which accounted for 9.77% of the area. Moderate erosion exhibited a greater extent compared with the other categories, covering an area of 35.5 km2, accounting for 3.17% of the total area. In contrast, severe erosion reduced to an area of 28.4 km2, accounting for only 2.66% of the area. Notably, the average erosion rate remained highest at 43,213.8 t·km−2·yr−1, with a corresponding erosion volume of 1.23 million tons (Table 3). Analyzing the distribution of erosion (Figure 10) for the post-treatment period, it is observed that slight- and mild-level erosion primarily occurred in the low-altitude flat areas. Additionally, numerous red-beds desert landforms are concentrated in the northeastern region of the study area. Extensive ecological restoration and treatment efforts have led to a gradual increase in vegetation cover. Consequently, there has been a shift towards slight-level erosion, accompanied by a reduction in the occurrence of strong, extremely strong, and severe levels of erosion. These areas are primarily located in central residential areas and the red-beds desert in the eastern part of the basin.
The soil erosion intensity transfer matrix, presented in Table 4, illustrates the changes in soil erosion intensity before and after treatment. Overall, there was a notable trend of soil erosion intensity shifting towards lower levels. Nevertheless, it is observed that small areas that previously experienced low intensity showed a gradual shift towards higher levels after treatment. It is important to note that these transformation areas were relatively small in size. This occurrence could potentially be attributed to the expansion of urban areas within the basin in recent years. Over the past few years, with the rapid economic development in both urban and rural areas of Nanxiong, along with the expansion of towns and villages, there has been an overall exacerbation of soil erosion to some extent. Therefore, it is not uncommon to observe a minor reversal of erosion intensity during the treatment process.

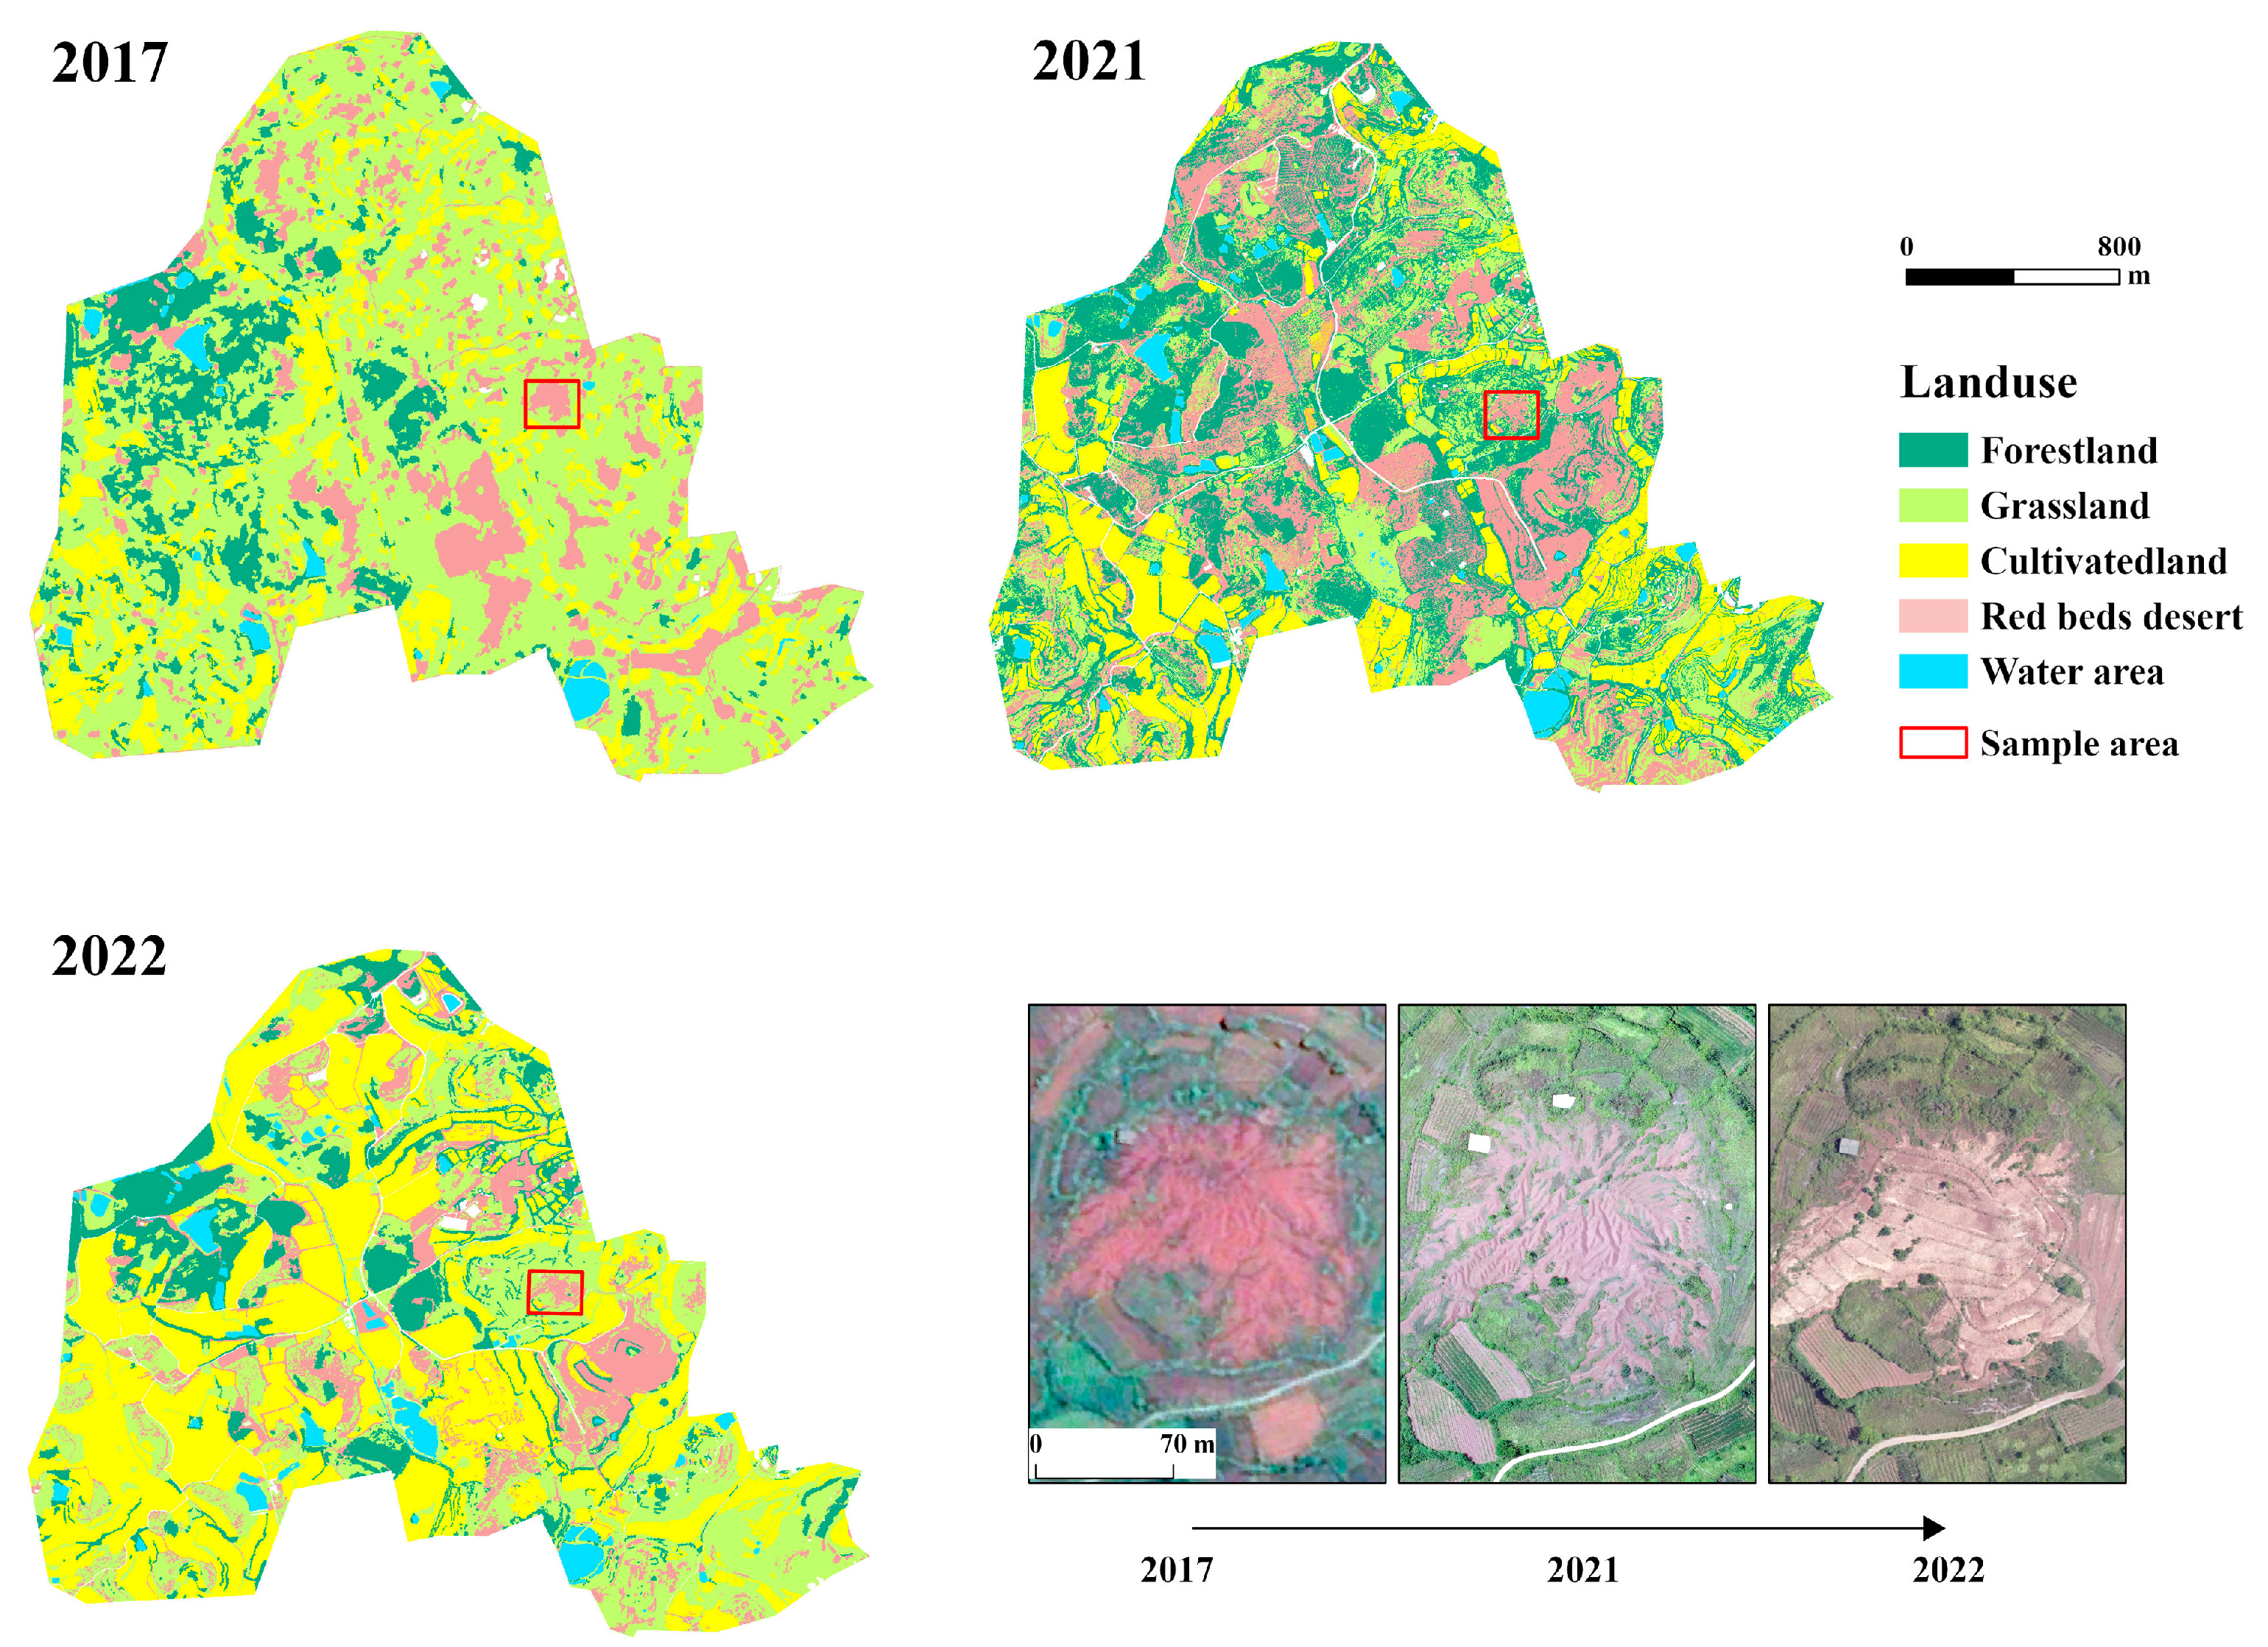
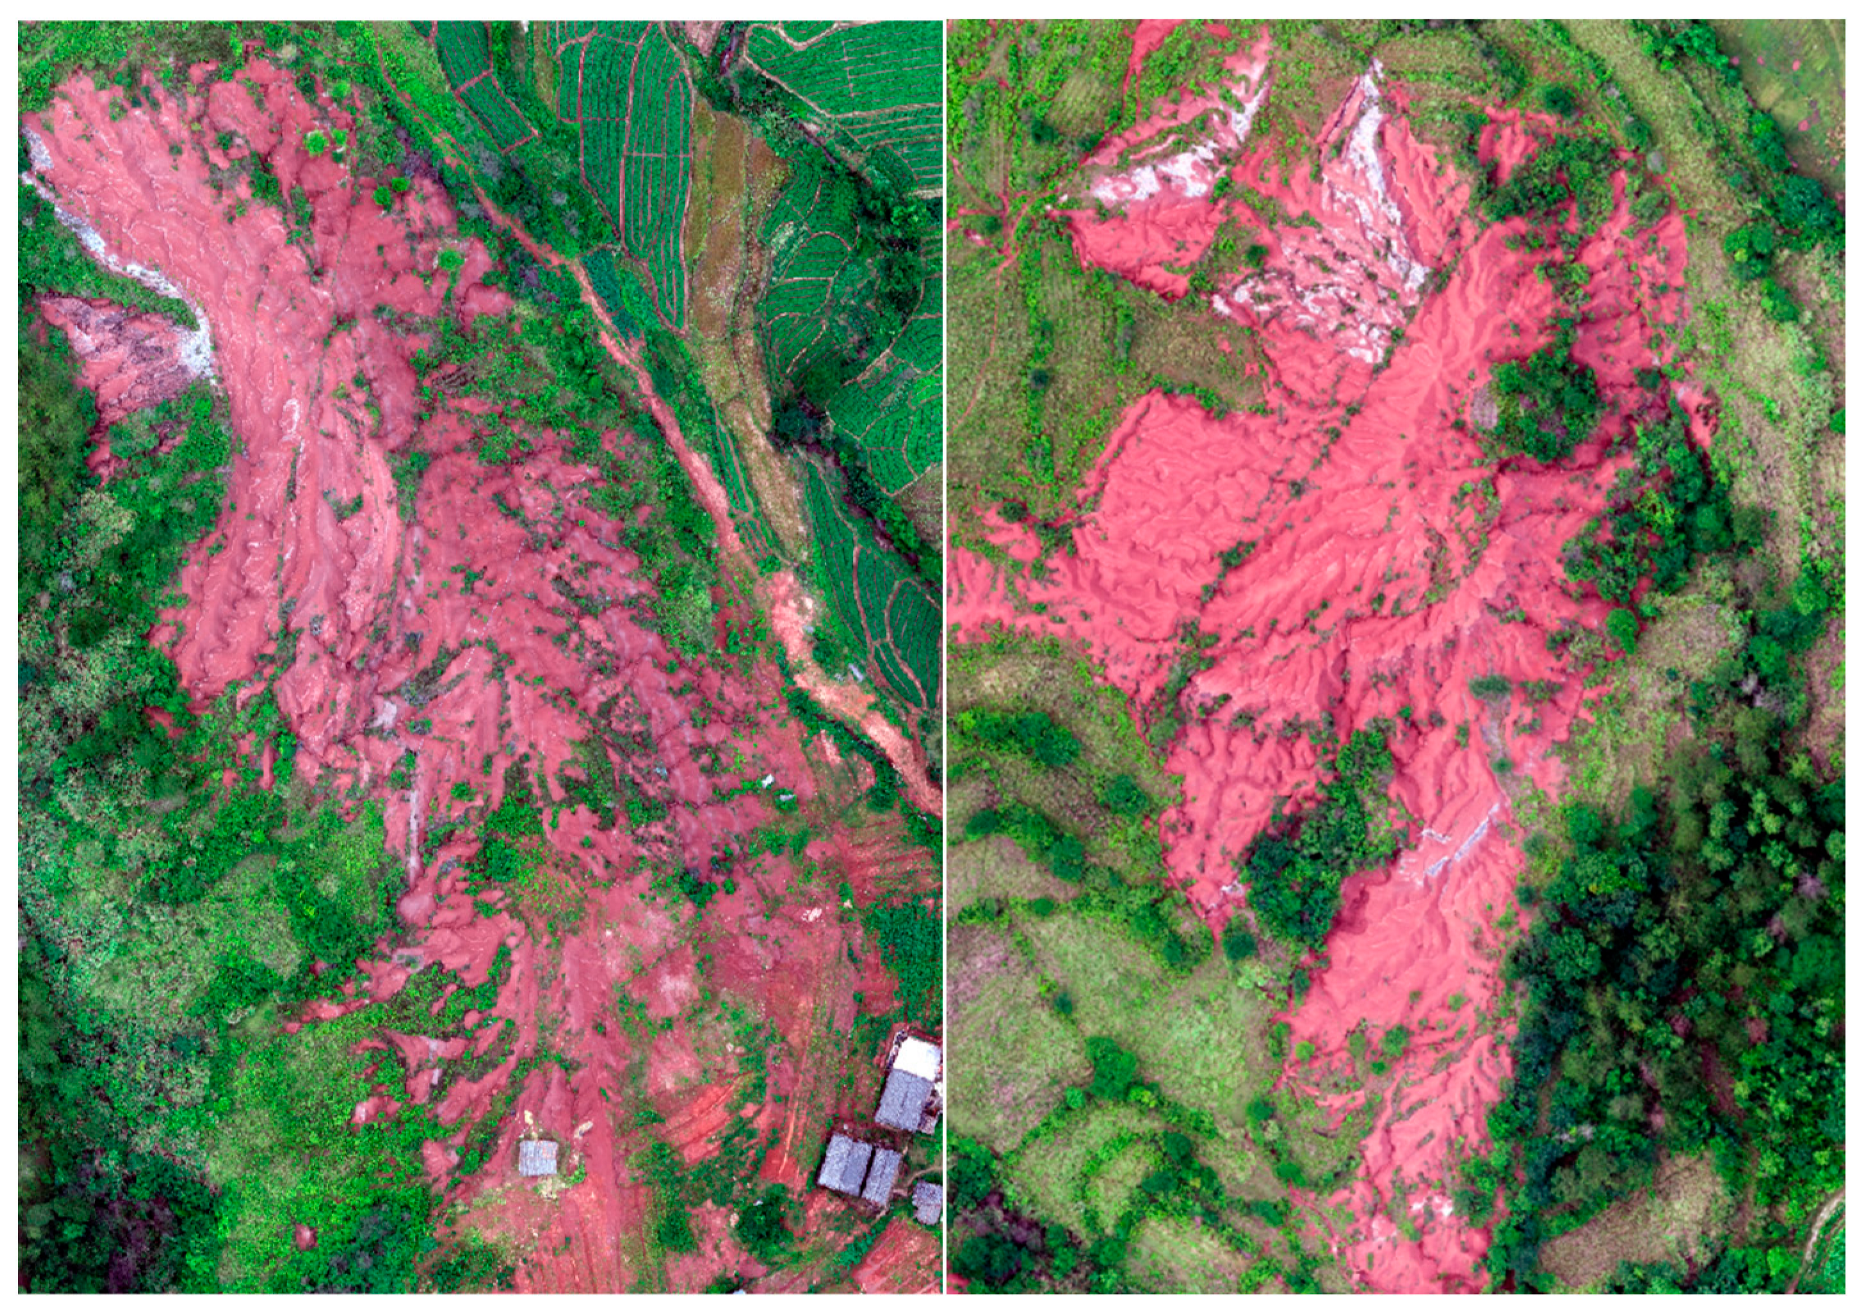
3.3. Consequences of Ecological Restoration in Representative Areas with Conservation Practices

High-resolution DOM images were utilized to systematically assess the ecological status, offering a more accurate and objective understanding of the red-beds desert ecosystem’s disturbance by natural and anthropogenic factors. Furthermore, they helped elucidate the changes in the ecological environment resulting from the implementation of management measures (Figure 11). Three representative areas, namely Chengping Village (A), Changshi Village (B), and Youshan Town (C), were chosen to depict various red-beds desert geomorphic environments, different stages of red-beds desert management, and distinct patterns of geomorphic landscape distribution. Chengping and Changshi villages have the most characteristic red-beds desert landscapes. After the treatment (Table 5), the total erosion in Chengping Village decreased from 24.9 t to 10.8 t, while in Changshi Village, it declined from 15.5 t to 3.7 t. Youshan Town’s ecological zone experienced more pronounced impacts from human activities, particularly agricultural practices. However, after treatment, erosion in this area decreased significantly from 199.03 t to 55.16 t. This reduction highlights the effectiveness of ecological restoration efforts in mitigating soil erosion, ultimately halting it to a significant extent.
During the transition from the untreated stage (2017) to the early stage of treatment (2021), Chengping Village (A) experienced a substantial increase in the red sand ridge area. The transformation involved the conversion of a significant portion of grassland and agricultural land on the north, east, and west sides of Chengping Village (A) into red-beds desert. Additionally, the grassland in the southern area was converted to agricultural land, primarily dedicated to cultivating commercial crops such as navel orange trees (Figure 12). In Changshi Village (B), the central, east parts, and southern Hemp Ridge area observed the conversion of a significant portion of grassland into red-beds desert. Furthermore, a portion of the grassland in the southwest area was abounded and red bed desert appeared. (Figure 13). In Youshan Town (C), the major part of grassland in the eastern and northern areas was converted into the red-beds desert. There was also a substantial increase in the area occupied by shrubs in the northern and eastern parts. Additionally, croplands expanded in the southwestern and southeastern areas, but decreased in the northern and central parts (Figure 14). The ecological zones of Chengping (A) and Changshi (B) are presently in the initial stages of ecological restoration and transformation. During this phase, a considerable number of natural ecological elements, particularly grassland, have been cleared, aligning with a transitional period characterized by the renewal of ecological elements. Consequently, there has been a notable increase in the Red Sand Ridge landscape. The ecological restoration and remediation efforts in the Youshan Eco-region have been extensive, and the initial outcomes of these restoration initiatives are already discernible.
Between 2021 and 2022, significant changes occurred in Chengping Village (A), with the red sand ridge in the northern and east–west regions experiencing significant conversion into grassland and agricultural land. However, in the southern area, agricultural land was converted into red-beds desert due to the initial stages of cash crop cultivation in that area (Figure 12). In Chang Shi Village (B), a substantial portion of the red sand ridge in the central, eastern, and southern regions of the Dama Ridge area was converted into cropland. Additionally, the northern grassland experienced partial conversion into cropland, with the majority transformed into areas for shrubs. A small section of grassland in the southwest area was also converted into cropland (Figure 13). In Youshan Town (C), a significant number of shrubs in the central and northern regions were transformed into cropland, leading to a significant expansion and increase in the agricultural land area throughout the region. Additionally, the red-beds desert in the southwest and central areas experienced a considerable reduction, primarily converted into grassland (Figure 14). In comparison with the initial stage of ecological restoration in 2021, Chengping Village (A) has made significant improvements. The majority of the area has been successfully transformed into a combination of mixed trees, shrubs, broad-leaf forest, and a large area of commercial crops. Consequently, the red sand ridge landscape has predominantly transferred into cropland and grassland. Following one year of treatment, a significant portion of the red sand ridge landscape in Chang Shi Village (B) underwent rapid conversion into cultivated land. Moreover, Youshan Town (C) has effectively addressed soil erosion reduction by implementing measures such as terracing, biological dams, and extensive cultivation of heat- and drought-tolerant crops. These ecological restoration efforts have proven to be effective.

4. Discussion

4.1. Uncertainty and Applicability of the RUSLE Model

In this study, we employed the RUSLE model to estimate the spatial distribution of soil erosion in the Nanxiong Basin. Our findings in 2020 revealed that the majority of the Nanxiong Basin exhibited a moderate level of soil erosion, aligning with the findings reported by Yan et al. [58] in 2019. To assess the accuracy of the soil erosion modelling, we conducted a comparative analysis to verify the erosion estimates for the RUSLE model with the results of remote sensing image interpretation. This analysis demonstrated a high degree of agreement between the areas of severe erosion predicted by the RUSLE model and the actual soil erosion areas. Figure 14 illustrates the comparisons between the simulated and actual results. In Figure 15, enlargement “A” represents a mixed area consisting of red-beds desert and shrubs, characterized by sparse vegetation and extensive bare land, resulting in ecological degradation (Figure 15a), which closely represents the actual environment (Figure 15c). Panel “B” depicts a residential area with cultivated land (Figure 15d), where soil stability has been significantly modified due to road construction (Figure 15b). These examples highlight the capability of the RUSLE model to represent the soil erosion patterns in small scale regions when high-quality data are available. Overall, our study demonstrates that the RUSLE model is a valuable tool for assessing soil erosion, and its application can provide reliable insights into the soil erosion dynamics in a given area.
However, it is important to acknowledge that the resampling of all raster data into a unified resolution during the calculation of the soil erosion modulus may cause slight value changes during raster resampling, although this effect should be negligible. Accurate rainfall data are crucial for capturing the influence of rainfall on soil erosion [59]. Unfortunately, due to the absence of long-term data, we employed a simplified model developed in previous studies [60], which incorporates the correlation between the R factor and the monthly and annual rainfall to estimate rainfall erosivity. The Modified Fournier Index (MFI) yielded the most favorable values among various evaluation indicators across different time periods (R2 > 0.9) [42], which is supported by the findings of Mu et al. [22] in 2020 (Figure 16). However, it is worth noting that Mu et al. [22] employed a data resolution of 1 km, which may cause a low performance of the R factor for small-scale regions. In our study, we utilized monthly rainfall data obtained from hydrological stations to assess the annual rainfall patterns in the Nanxiong Basin, allowing for a more comprehensive depiction of spatial variations in rainfall-induced erosion. It is worth noting that our study did not account for the influence of rainfall intensity and concentration in a short period, which could potentially impact the accuracy of the R factor [42].
Obtaining detailed information on vegetation coverage and crop types for the calculation of the C factor can also be challenging. The NDVI data, although not reflective of the resistance of litter against raindrop erosion [61], provide valuable information about vegetation conditions. Hence, we utilized NDVI to assess vegetation coverage and management conditions [50]. To ensure the accuracy of the data, we generated NDVI data and land use data by interpreting high-resolution satellite imagery from the GF-2 satellite.
In this study, empirical values for the P factor were assigned ranging from 0 to 1 based on land conditions. However, it should be noted that the effects of contour farming and terrace cultivation were not considered here [52]. Although the P factor has minimal impact on the calculation of soil erosion modulus, different land uses can have a significant influence on the spatial distribution of soil erosion and introduce additional uncertainty. To obtain information on land uses, we employed high-resolution GF-2 satellite imagery. This imagery was complemented by field surveys and drone imagery, which allowed us to identify and correct land uses in selected representative regions.
The process of slope hydraulic erosion is influenced by several factors such as rainfall intensity and duration, terrain characteristics (slope length and steepness), and the composition of the land surface [62]. Slope length and steepness are important indicators in the calculation of soil erosion. However, it is important to acknowledge that utilizing DEM data as a representation of terrain have limitations such as being unable to fully capture the dynamic processes of soil infiltration and slope runoff over time. DEM data provide valuable insights into the general topography, but may not account for the intricate variations and temporal changes in soil erosion processes.

4.2. Major Factors Affecting Soil Erosion

4.2.1. Rainfall

Rainfall-induced runoff is the primary driver of soil erosion [63]. In the case of Nanxiong City, it receives an average of 167 rainy days per year, with a maximum annual rainfall of approximately 1880 mm. The region is characterized by frequent and abundant precipitation, making it prone to severe soil erosion and landslides. The high and extreme rainfall can lead to an increased risk of soil erosion and the occurrence of landslides in the area.

4.2.2. Steepness

The steepness of the terrain plays a significant role in soil erosion dynamics [18]. According to the steepness classification standard (SL190-2007) [55] issued by the Ministry of Water Resources, steepness is classified into five categories: 0°~5°, 5°~8°, 8°~15°, 15°~25°, and greater than 25°. To investigate the spatial distribution of soil erosion across different steepness levels, we conducted an overlay analysis between the steepness results and the soil erosion modulus. The results, as depicted in Table 6, demonstrate a positive correlation between steepness and the average erosion rate. Moreover, the distribution of different erosion intensities varies significantly among the steepness categories. As the steepness increases, the contribution of micro-erosion to the total erosion modulus decreases gradually. Notably, the area with a steepness range of 0°~5° exhibits the highest occurrence of soil erosion, accounting for 49.75% of the total erosion modulus. Therefore, this area becomes a priority for implementing soil erosion prevention and control measures, which may involve engineering interventions for micro-terrain modification and slope adjustment in sloping cropland.

4.2.3. Land use

Land use changes are widely considered the primary driver of soil erosion [64]. In this study, we also analyzed soil erosion intensity across different land uses. Table 7 provides an overview of the findings, indicating that grassland, cropland, shrubs, and red-beds desert predominantly experienced mild- to moderate-level soil erosion, while built-up land showed a mild level of soil erosion. Grassland exhibited a higher occurrence of mild erosion, which can be attributed to its relatively lower NDVI value. Forests, with their stable community structure and canopy interception effect, attenuate the kinetic energy of raindrops before they reach the ground. However, most grasslands located near the margins of red-beds desert landforms have sparse vegetation, making them vulnerable to rainfall erosion and loss. The red-beds desert, characterized by exposed red bedrock or weathered crust on bare purple sandstone residual hills, poses a challenging environment for plants and is prone to intense erosion due to its extremely poor water retention capacity. Cropland exhibits a relatively high intensity of erosion, which can be attributed to the historical agricultural practices and deforestation that have accelerated soil erosion in the Nanxiong Basin. The detrimental consequences of severe soil erosion include disruptions to the ecological cycle, reduced water production and storage, and increasing evaporation over time.
To control soil erosion in the Nanxiong Basin, it is crucial to prioritize the management of cultivated land, forest land, grassland, and red-beds desert. In areas characterized by steep slopes or high altitudes, a recommended approach is to consider converting farmland back to forest and grassland, as this promotes ecological restoration and enhances vegetation coverage. For regions dominated by red-beds desert and grassland, it is essential to implement soil and water conservation measures to strengthen ecological restoration efforts. These measures can significantly improve land productivity and prevent further degradation of grasslands. By adopting a comprehensive approach that combines land management strategies, the Nanxiong Basin can effectively mitigate soil erosion and ensure the long-term sustainability of its ecosystems.
The findings of our study reveal a different pattern regarding soil erosion in the Nanxiong Basin. Firstly, we observed that the average steepness of the forests in the Nanxiong Basin is more than twice as that of the cultivated land (Table 8). Secondly, the average NDVI for the cultivated land is nearly identical to that of the red-beds desert. Finally, the rainfall erosion factor for arable land is the smallest of the vegetated areas, mainly due to its lower slope, flatter topography, and relatively high vegetation cover, which further reduces rainfall erosion energy and thus soil erosion. Based on these observations, it is crucial to strengthen soil erosion conservation in mountainous areas. This can be achieved by implementing stricter controls on wood cutting, conducting large-scale afforestation and planting steep slopes with grass (>15°), and avoiding extensive large-scale conversion of cropland to forest and grassland on gentle slopes. Efforts should also be made to maintain the existing land status. Measures such as micro-terrain improvement and other engineering for ecological restoration should also be implemented. For areas facing severe erosion and adverse environmental conditions, it is advisable to construct water conservation and sediment control projects to mitigate erosion. By adopting these comprehensive approaches, the Nanxiong Basin can significantly improve soil erosion management and create a more sustainable environment for its inhabitants.

4.2.4. Socioeconomic Activities

The region of Nanxiong City is undergoing rapid urbanization, with towns and villages experiencing accelerated expansion. Located at the center of the basin, the red-beds desert area has become densely populated, characterized by an extensive network of roads and waterways. Unfortunately, the fast urbanization has severe consequences for the surrounding mountainous regions, resulting in significant damage—notably increased soil erosion and other ecological issues. The mountainous areas adjacent to the red-beds desert are renowned for their economically valuable vegetation, including Chinese fir and bamboo, which have long been utilized for timber production and various purposes. However, the cutting down of Chinese fir and bamboo is predominantly practiced. As a result, substantial amounts of vegetation have been removed, disturbing the natural balance of the ecosystem and leading to accelerated soil erosion (Figure 17). To address these challenges, it is crucial to acknowledge the adverse impacts of rapid urbanization on the environment and proactively implement measures to mitigate soil erosion and restore ecological balance. By promoting sustainable land management practices, conserving valuable vegetation through reasonable harvesting, adopting reforestation initiatives, and implementing effective erosion control measures, we can mitigate the negative effects of urbanization on the surrounding mountainous areas. These actions will contribute to the preservation of the ecosystem and the well-being of the local communities.
Soil erosion is a complex process influenced by various factors, such as vegetation cover, soil properties, rainfall patterns, land use practices, topography, and human activities. Recognizing the interplay of these factors, the implementation of effective ecological engineering measures becomes vital to enhance the overall ecological environment in the Nanxiong Basin. One key aspect in this endeavor is vegetation restoration, which plays a pivotal role in mitigating soil erosion and fostering ecosystem resilience. By promoting the growth and establishment of vegetation, we can enhance the stability of the soil, minimize surface runoff, and reduce the impact of erosive forces. Vegetation acts as a natural barrier, protecting the soil from the erosive effect of rainfall, while also facilitating water infiltration and promoting nutrient cycling.
To achieve successful vegetation restoration, it is crucial to consider the specific conditions and needs of the Nanxiong Basin. This entails selecting appropriate plant species that are well-adapted to the local climate, soil conditions, and hydrological patterns. Furthermore, employing sustainable land management practices, such as afforestation, reforestation, and agroforestry, can contribute to long-term ecological restoration and create a harmonious balance between human activities and the environment.
By implementing these ecological engineering measures and prioritizing vegetation restoration, we can effectively address soil erosion in the Nanxiong Basin, leading to improved soil health, enhanced biodiversity, and the preservation of valuable ecosystems.

4.3. Effectiveness of Water and Soil Erosion Control Engineering

The integrated management of the Nanxiong Basin adopts a regional differentiation strategy. This management approach aims for consistency within each area, while accommodating variations between different regions. Within the same regions, notable similarities in natural characteristics, socioeconomic conditions, and soil erosion patterns should prevail. Conversely, significant differences are expected between different regions. Forestry and grassland measures are implemented because of the thinness of the soils in the region, unfavorable soil physical and chemical properties, and limited human activity, and thus vegetation species resilient to high temperatures and drought conditions are usually planted to increase vegetation coverage. Water and soil conservation projects are mainly composed of ‘red sand ridge’. These measures aim to mitigate erosion and enhance water retention capacities. The land comprehensive improvement area experiences frequent human activities that result in significant disturbance and ecological damage. The measures are implemented, taking full advantage of local strengths, and aim to establish a more sustainable and resilient agricultural ecosystem while ensuring the responsible use of land resources management. Enclosure monitoring leverages the inherent restoration capabilities of the ecosystem to achieve the desired soil and water conservation outcomes. By implementing these integrated management measures across the different program blocks, the Nanxiong Basin can effectively address the ecological challenges, enhance soil and water conservation, and promote sustainable development in the region. The management of the Nanxiong Basin is a crucial demonstration project for ecological protection and restoration efforts in the northern Guangdong Nanling mountainous area. It fills the research gap in understanding soil erosion caused by red-beds desertification and provides a valuable technical reference for similar regions in China. Moreover, it establishes a solid scientific foundation for the implementation of effective water and soil conservation measures.

5. Conclusions

This study employed the RUSLE model to conduct a quantitative analysis of soil erosion characteristics within the Nanxiong Basin. The results revealed that human activities are the primary drivers of soil erosion in the region, while natural factors such as the red-beds desert and basin climate contribute to exacerbating soil erosion.
According to estimates, before the implementation of management measures in 2020, the Nanxiong Basin exhibited an average erosion modulus of 3943.56 t·km−2·yr−1, resulting in a total erosion of 4.64 million tons, indicating a moderate level of erosion. Following the implementation of measures, the average erosion modulus decreased to 2023.1 t·km−2·yr−1 with a total erosion of 2.38 million tons, decreasing to a mild level of erosion. These results indicate a positive trend of controlling soil erosion intensity to lower grades and demonstrate the effectiveness of the management interventions. These findings underscore the utility of the RUSLE model as a valuable tool for quantifying soil erosion in small watersheds. Furthermore, the findings support the development of effective restoration management strategies for overcoming the challenges posed by the degradation of the red-beds desert in the Nanxiong Basin.
The findings of our study shed light on the assessment of soil erosion in the Nanxiong Basin both before and after treatment interventions. To address this problem, the implementation of precise measures based on an accurate assessment of soil erosion is crucial for achieving sustainable ecological restoration. Through a comparison of ecological elements and erosion volumes using drone images across different typical treatment areas and analysis of factors regulating soil erosion, we highlighted the crucial role of precise management and human intervention in effective control of the degradation of the red-beds desert.
In future research, a more comprehensive understanding of the effect of soil conservation measures on soil erosion can be achieved by utilizing the slope classification of specific areas and incorporating relevant soil erosion monitoring data. This integration would enable a more refined assessment of the effectiveness of efforts in soil conservation. Furthermore, the utilization of multi-source spatiotemporal remote sensing data along with artificial intelligence algorithms also holds the promise for better extraction of information on crop types, crop rotation, replanting, and tillage practices, particularly in complex terrain areas. Such integration would greatly enhance our work to implement targeted and effective soil erosion control strategies.

Author Contributions

All of the authors have contributed extensively to the work presented here. Y.X., X.Y. and G.X. contributed to the theme of the study, the analysis of the study data, and the writing of the paper; J.F. provided data support; S.C., X.M., T.Z. and W.Z. revised the paper in post; J.C., L.L. and Z.X. proofread the data. All authors have read and agreed to the published version of the manuscript.

Funding

This study was funded by the Monitoring Analysis and Evaluation of the Comprehensive Management Project of Hong Sha Ling, Nanxiong City, Project (Grant No.: ZPSG2020ZB010 and ZPSG2020ZB045); The Natural Science Foundation of Guangdong Province (Grant No.: 2021A1515011533); and the Innovation Training Project for University Students of Guangzhou University, (Grant No.: S202211078185 and 202311078005).

Institutional Review Board Statement

Not applicable.

Informed Consent Statement

Not applicable.

Data Availability Statement

Not available.

Acknowledgments

We are grateful to the Natural Resources Bureau of Nanxiong City and the Institute of Remote Sensing and Digital Earth Research, Chinese Academy of Sciences for their data support; and to the anonymous reviewers and editors for their valuable comments to improve the quality of the paper.

Conflicts of Interest

The authors declare no conflict of interest.

References

  1. Wang, X.; Zhao, X.; Zhang, Z.; Yi, L.; Zuo, L.; Wen, Q.; Liu, F.; Xu, J.; Hu, S.; Liu, B. Assessment of Soil Erosion Change and Its Relationships with Land Use/Cover Change in China from the End of the 1980s to 2010. CATENA 2016, 137, 256–268. [Google Scholar] [CrossRef]
  2. Li, Z.; Fang, H. Impacts of Climate Change on Water Erosion: A Review. Earth-Sci. Rev. 2016, 163, 94–117. [Google Scholar] [CrossRef]
  3. Sartori, M.; Philippidis, G.; Ferrari, E.; Borrelli, P.; Lugato, E.; Montanarella, L.; Panagos, P. A Linkage between the Biophysical and the Economic: Assessing the Global Market Impacts of Soil Erosion. Land Use Policy 2019, 86, 299–312. [Google Scholar] [CrossRef]
  4. Sathiyamurthi, S.; Ramya, M.; Saravanan, S.; Subramani, T. Estimation of Soil Erosion for a Semi-Urban Watershed in Tamil Nadu, India Using RUSLE and Geospatial Techniques. Urban Clim. 2023, 48, 101424. [Google Scholar] [CrossRef]
  5. Wan, W.; Han, Y.; Wu, H.; Liu, F.; Liu, Z. Application of the Source–Sink Landscape Method in the Evaluation of Agricultural Non-Point Source Pollution: First Estimation of an Orchard-Dominated Area in China. Agric. Water Manag. 2021, 252, 106910. [Google Scholar] [CrossRef]
  6. Zheng, F.; Wang, Z.; Yang, Q. Review and prospects of scientific research on soil erosion in China. Chin. J. Nat. 2008, 30, 12–16+63. [Google Scholar] [CrossRef]
  7. Wang, Z. Analyses of Affecting Factors of Soil Erosion and Its Harms in China. J. Agric. Eng. 2000, 16, 32–36. [Google Scholar] [CrossRef]
  8. Guo, X.; Wang, T.; Cheng, S.; Li, Z. Progress of soil erosion models in recent 30 years. J. Sediment Res. 2023, 48, 65–72. [Google Scholar] [CrossRef]
  9. Zhang, K.; Cai, Q.; Ke, Q. Major Achievements and Future Key Fields of Soil Erosion Research in China. Bull. Soil Water Conserv. 2022, 42, 373–380. [Google Scholar] [CrossRef]
  10. Guo, Y.; Peng, C.; Zhu, Q.; Wang, M.; Wang, H.; Peng, S.; He, H. Modelling the Impacts of Climate and Land Use Changes on Soil Water Erosion: Model Applications, Limitations and Future Challenges. J. Environ. Manag. 2019, 250, 109403. [Google Scholar] [CrossRef]
  11. Li, P.; Mu, X.; Holden, J.; Wu, Y.; Irvine, B.; Wang, F.; Gao, P.; Zhao, G.; Sun, W. Comparison of Soil Erosion Models Used to Study the Chinese Loess Plateau. Earth-Sci. Rev. 2017, 170, 17–30. [Google Scholar] [CrossRef] [Green Version]
  12. Wischmeier, W.H.; Smith, D.D. Predicting Rainfall Erosion Losses: A Guide to Conservation Planning, U.S. Department of Agriculture: Washington, DC, USA, 1978, Agriculture Handbook No. 537. Available online: https://topsoil.nserl.purdue.edu/usle/AH_537.pdf (accessed on 6 April 2023).
  13. Xia, L.; Bi, R.; Song, X.; Lv, C. Dynamic Changes in Soil Erosion Risk and Its Driving Mechanism: A Case Study in the Loess Plateau of China. Eur. J. Soil Sci. 2021, 72, 1312–1331. [Google Scholar] [CrossRef]
  14. Renard, K.G. Predicting Soil Erosion by Water: A Guide to Conservation Planning with the Revised Universal Soil Loss Equation (RUSLE); USDA: Washington, DC, USA, 1997. [Google Scholar]
  15. Fernández, C.; Vega, J.A. Evaluation of the Rusle and Disturbed Wepp Erosion Models for Predicting Soil Loss in the First Year after Wildfire in NW Spain. Environ. Res. 2018, 165, 279–285. [Google Scholar] [CrossRef] [PubMed]
  16. Batista, P.V.G.; Davies, J.; Silva, M.L.N.; Quinton, J.N. On the Evaluation of Soil Erosion Models: Are We Doing Enough? Earth-Sci. Rev. 2019, 197, 102898. [Google Scholar] [CrossRef]
  17. Thomas, J.; Joseph, S.; Thrivikramji, K.P. Assessment of Soil Erosion in a Tropical Mountain River Basin of the Southern Western Ghats, India Using RUSLE and GIS. Geosci. Front. 2018, 9, 893–906. [Google Scholar] [CrossRef]
  18. Wang, F.; Liu, J.; Fu, T.; Gao, H.; Qi, F. Spatio-temporal variations in soil erosion and its influence factors in Taihang Mountain area based on RUSLE modeling. Chin. J. Eco-Agric. 2022, 30, 1064–1076. [Google Scholar] [CrossRef]
  19. Chen, H.; Jiang, X.; Ren, L.; Tang, X.; Xiao, X. Quantitative Evaluation of Soil Erosion in the Huaihe River Basin Based on RUSLE Model. Chin. J. Soil Sci. 2021, 52, 165–176. [Google Scholar] [CrossRef]
  20. Hu, X.; Jiang, X.; Pan, J.; Yang, S.; Zhang, C. GIS-Based Spatial Analysis and Evaluation of Soil Erosion in the Huaihe River Basin. Soils 2007, 39, 404–407. [Google Scholar] [CrossRef]
  21. Zhuang, Y.; Du, C.; Zhang, L.; Du, Y.; Li, S. Research Trends and Hotspots in Soil Erosion from 1932 to 2013: A Literature Review. Scientometrics 2015, 105, 743–758. [Google Scholar] [CrossRef]
  22. Mu, X.; Qiu, J.; Cao, B.; Cai, S.; Niu, K.; Yang, X. Mapping Soil Erosion Dynamics (1990–2020) in the Pearl River Basin. Remote Sens. 2022, 14, 5949. [Google Scholar] [CrossRef]
  23. Elnashar, A.; Zeng, H.; Wu, B.; Fenta, A.A.; Nabil, M.; Duerler, R. Soil Erosion Assessment in the Blue Nile Basin Driven by a Novel RUSLE-GEE Framework. Sci. Total Environ. 2021, 793, 148466. [Google Scholar] [CrossRef] [PubMed]
  24. Phinzi, K.; Ngetar, N.S. Land Use/Land Cover Dynamics and Soil Erosion in the Umzintlava Catchment (T32E), Eastern Cape, South Africa. Trans. R. Soc. S. Afr. 2019, 74, 223–237. [Google Scholar] [CrossRef]
  25. Xu, Z.; Zhang, S.; Zhou, Y.; Hou, X.; Yang, X. Characteristics of Watershed Dynamic Sediment Delivery Based on Improved RUSLE Model. CATENA 2022, 219, 106602. [Google Scholar] [CrossRef]
  26. Lu, R.; Dai, E.; Wu, C. Spatial and Temporal Evolution Characteristics and Driving Factors of Soil Conservation Services on the Qinghai-Tibet Plateau. CATENA 2023, 221, 106766. [Google Scholar] [CrossRef]
  27. Zhang, G. Several Ideas Related to Soil Erosion Research. J. Soil Water Conserv. 2020, 34, 21–30. [Google Scholar] [CrossRef]
  28. Huang, T.; Shi, Y.; Cao, Q.; Wang, L.; Yang, Y.; Liu, B. Soil erosion evaluation of Liudaogou catchment in the Loess Plateau during the past 30 years. Sci. Soil Water Conserv. 2020, 18, 8–17. [Google Scholar] [CrossRef]
  29. Wang, J.; Jia, Y.; Fan, H. Spatial distribution characteristics of sediment connectivity and soil erosion in a small watershed in brown soil hilly region of low mountains in western Liaoning Province, China. Chin. J. Appl. Ecol. 2023, 34, 726–732. [Google Scholar] [CrossRef]
  30. Mhaske, S.N.; Pathak, K.; Dash, S.S.; Nayak, D.B. Assessment and Management of Soil Erosion in the Hilltop Mining Dominated Catchment Using GIS Integrated RUSLE Model. J. Environ. Manag. 2021, 294, 112987. [Google Scholar] [CrossRef]
  31. Kebede, Y.S.; Endalamaw, N.T.; Sinshaw, B.G.; Atinkut, H.B. Modeling Soil Erosion Using RUSLE and GIS at Watershed Level in the Upper Beles, Ethiopia. Environ. Chall. 2021, 2, 100009. [Google Scholar] [CrossRef]
  32. Ministry of Environmental Protection, Chinese Academy of Sciences. National Zoning of Ecological Functions (Revised Version), Beijing, China, 2015. Available online: https://www.mee.gov.cn/gkml/hbb/bgg/201511/W020151126550511267548.pdf (accessed on 21 March 2023).
  33. Shao, S.; Wang, G.; Liao, L.; Li, H.; Huang, G. Research and practice of ecological protection and restoration of the mountain-river-forest-farmland-lake-grassland system in Nanling mountains area, northern Guangdong Province. J. Environ. Eng. Technol. 2020, 10, 779–785. [Google Scholar] [CrossRef]
  34. Peng, H.; Wu, Z. A Preliminary Study on the Characteristics and the Distribution of Red Beds. Acta Sci. Nat. Univ. Sunyatseni 2003, 42, 109–113. [Google Scholar] [CrossRef]
  35. Peng, H. A Survey of the Danxia Landform Research in China. Sci. Geogr. Sin. 2000, 20, 203–211. [Google Scholar] [CrossRef]
  36. Peng, H.; Yan, L.; Chen, Z.; SIMONSON, S.; Luo, G. A preliminary study of desertification in red beds in the humid region of Southern China. Acta Geogr. Sin. 2015, 70, 1699–1707. [Google Scholar] [CrossRef]
  37. Ye, C.; Zhong, P.; Zhang, Z. Study on Soil and Water Loss Control and Development and Utilization of Purple Sand Shale Region in the Upper Stream of Beijiang River. Soil Water Conserv. China 2007, 6, 26–28. [Google Scholar] [CrossRef]
  38. Chen, J.; Yu, S.; Fu, J.; Xu, G. Soil Quality Characteristics and Influencing Factors of Different Land Use in the Red Bed Landform Region of South China: Taking Nanxiong Basin as An Example. Ecol. Environ. Sci. 2022, 31, 918–930. [Google Scholar] [CrossRef]
  39. Pan, T.; Guan, H.; He, W. GF-2 Satellite Remote Sensing Technology. Spacecr. Recovery Remote Sens. 2015, 36, 16–24. [Google Scholar] [CrossRef]
  40. Phinzi, K.; Ngetar, N.S. The Assessment of Water-Borne Erosion at Catchment Level Using GIS-Based RUSLE and Remote Sensing: A Review. Int. Soil Water Conserv. Res. 2019, 7, 27–46. [Google Scholar] [CrossRef]
  41. Zhu, D.; Xiong, K.; Xiao, H. Multi-Time Scale Variability of Rainfall Erosivity and Erosivity Density in the Karst Region of Southern China, 1960–2017. CATENA 2021, 197, 104977. [Google Scholar] [CrossRef]
  42. Hernando, D.; Romana, M.G. Estimating the Rainfall Erosivity Factor from Monthly Precipitation Data in the Madrid Region (Spain). J. Hydrol. Hydromech. 2015, 63, 55–62. [Google Scholar] [CrossRef] [Green Version]
  43. Wang, G.; Gertner, G.; Liu, X.; Anderson, A. Uncertainty Assessment of Soil Erodibility Factor for Revised Universal Soil Loss Equation. CATENA 2001, 46, 1–14. [Google Scholar] [CrossRef]
  44. The Erosion-Productivity Impact Calculator (EPIC) Model: A Case History. Philos. Trans. R. Soc. Lond. B 1990, 329, 421–428. [CrossRef]
  45. Schmidt, S.; Tresch, S.; Meusburger, K. Modification of the RUSLE Slope Length and Steepness Factor (LS-Factor) Based on Rainfall Experiments at Steep Alpine Grasslands. MethodsX 2019, 6, 219–229. [Google Scholar] [CrossRef] [PubMed]
  46. Li, A.; Zhang, X.C. (John); Liu, B. Effects of DEM Resolutions on Soil Erosion Prediction Using Chinese Soil Loss Equation. Geomorphology 2021, 384, 107706. [Google Scholar] [CrossRef]
  47. Desmet, P.J.J.; Govers, G. A gis procedure for automatically calculating the usle ls factor on topographically complex landscape units. J. Soil Water Conserv. 1996, 51, 427–433. [Google Scholar] [CrossRef]
  48. Liu, B.Y.; Nearing, M.A.; Shi, P.J.; Jia, Z.W. Slope Length Effects on Soil Loss for Steep Slopes. Soil Sci. Soc. Am. J. 2000, 64, 1759–1763. [Google Scholar] [CrossRef] [Green Version]
  49. Liang, Y.; Liu, X.; Cao, L.; Zheng, F. Calculation and macroscopic distribution of soil erodibility K values in water erosion zones in China. Soil Water Conserv. China 2013, 35–40+79. [Google Scholar] [CrossRef]
  50. Van der Knijff, J.M.; Jones, R.J.A.; Montanarella, L. Soil Erosion Risk: Assessment in Europe. EUROPEAN SOIL DATA CENTRE, European Commission, 2000. Available online: https://esdac.jrc.ec.europa.eu/content/soil-erosion-risk-assessment-europe (accessed on 6 April 2023).
  51. Gong, W.; Liu, T.; Duan, X.; Sun, Y.; Zhang, Y.; Tong, X.; Qiu, Z. Estimating the Soil Erosion Response to Land-Use Land-Cover Change Using GIS-Based RUSLE and Remote Sensing: A Case Study of Miyun Reservoir, North China. Water 2022, 14, 742. [Google Scholar] [CrossRef]
  52. Tian, P.; Zhu, Z.; Yue, Q.; He, Y.; Zhang, Z.; Hao, F.; Guo, W.; Chen, L.; Liu, M. Soil Erosion Assessment by RUSLE with Improved P Factor and Its Validation: Case Study on Mountainous and Hilly Areas of Hubei Province, China. Int. Soil Water Conserv. Res. 2021, 9, 433–444. [Google Scholar] [CrossRef]
  53. Yang, R.; Xu, H.; Lin, N.; He, H.; Zeng, H. RUSLE-based quantitative study on the soil erosion of the Hetian basin area in County Changting, Fujian Province, China. Acta Ecol. Sin. 2013, 33, 2974–2982. [Google Scholar] [CrossRef] [Green Version]
  54. Yi, K.; Wang, S.; Wang, X.; Yao, H. The Characteristics of Spatial-temporal Differentiation of Soil Erosion Based on RUSLE Model: A Case Study of Chaoyang City, Liaoning Province. Sci. Geogr. Sin. 2015, 35, 365–372. [Google Scholar] [CrossRef]
  55. Ministry of Water Resources of the People’s Republic of China. Soil Erosion Classification and Grading Standard: SL190-2007, Beijing, China, 2008. Available online: https://slgcfy.ylvtc.cn/__local/D/6F/D7/6C04DCAF303494B02D6DBB6E965_8A1D4E97_BC696.pdf (accessed on 17 January 2023).
  56. Dabral, P.P.; Baithuri, N.; Pandey, A. Soil Erosion Assessment in a Hilly Catchment of North Eastern India Using USLE, GIS and Remote Sensing. Water Resour Manag. 2008, 22, 1783–1798. [Google Scholar] [CrossRef]
  57. Abdul Rahaman, S.; Aruchamy, S.; Jegankumar, R.; Abdul Ajeez, S. Estimation of Annual Avergfe Soil Loss, Based on RUSLE Model in Kallar Water Watershed, Bhavani Basin, Tamil Nadu, India. ISPRS Ann. Photogramm. Remote Sens. Spatial Inf. Sci. 2015, II-2/W2, 207–214. [Google Scholar] [CrossRef] [Green Version]
  58. Yan, L.; Kasanin-Grubin, M. Land Degradation and Management of Red Beds in China: Two Case Studies. J. Mt. Sci. 2019, 16, 2591–2604. [Google Scholar] [CrossRef]
  59. Wischmeier, W.H.; Smith, D.D. Rainfall Energy and Its Relationship to Soil Loss. Trans. AGU 1958, 39, 285. [Google Scholar] [CrossRef]
  60. Frédéric, F. CLIMAT ET ÉROSION: La Relation Entre l’érosion du sol par l’eau et les Précipitations Atmosphériques; Presses Universitaires: Paris, France, 1960. [Google Scholar]
  61. Mezősi, G.; Bata, T. Estimation of the Changes in the Rainfall Erosivity in Hungary. J. Environ. Geogr. 2016, 9, 43–48. [Google Scholar] [CrossRef] [Green Version]
  62. Teng, M.; Huang, C.; Wang, P.; Zeng, L.; Zhou, Z.; Xiao, W.; Huang, Z.; Liu, C. Impacts of Forest Restoration on Soil Erosion in the Three Gorges Reservoir Area, China. Sci. Total Environ. 2019, 697, 134164. [Google Scholar] [CrossRef]
  63. Su, Y.; Li, P.; Ren, Z.; Xiao, L. Effect of Slope Gradient on the Process of Runoff and Sediment Yieldand Water-Sediment Relationon the Loess Slope. Res. Soil Water Conserv. 2020, 27, 118–122. [Google Scholar] [CrossRef]
  64. Li, L.; Wang, Y.; Liu, C. Effects of Land Use Changes on Soil Erosion in a Fast Developing Area. Int. J. Environ. Sci. Technol. 2014, 11, 1549–1562. [Google Scholar] [CrossRef] [Green Version]
Figure 1. The geographical location of the study area: (a) mainland China, (b) Guangdong Province, and (c) the Nanxiong Basin.
Water 15 02613 g001
Figure 2. Images and photos for the study area were obtained during field investigations. (a,d) Initial bare bedrocks in the red layer; (b,e) various erosional gullies and bare bedrocks in the red beds; (c,f) desertification of contiguous red beds; (ac) UAV images; (df) photos taken in the field.
Water 15 02613 g002
Figure 3. Coverage of the GF-2 image in the study area.
Water 15 02613 g003
Figure 4. Spatial distribution of the R factor across the Nanxiong Basin.
Water 15 02613 g004
Figure 5. Spatial distribution of the K factor across the Nanxiong Basin.
Water 15 02613 g005
Figure 6. Spatial distribution of the LS factor across Nanxiong Basin.
Water 15 02613 g006
Figure 7. Spatial distribution of NDVI across the Nanxiong Basin.
Water 15 02613 g007
Figure 8. Spatial distribution of the C factor across the Nanxiong Basin.
Water 15 02613 g008
Figure 9. Spatial distribution of the P factor across Nanxiong Basin.
Water 15 02613 g009
Figure 10. Levels of soil erosion intensity across the study area.
Water 15 02613 g010
Figure 11. Typical control areas of water and soil erosion in Nanxiong Basin.
Water 15 02613 g011
Figure 12. Spatial distribution of land use classification changes in Taiping Village (A).
Water 15 02613 g012
Figure 13. Spatial distribution of land use changes in Changshi Village (B).
Water 15 02613 g013
Figure 14. Spatial distribution of land use changes in Youshan Town (C).
Water 15 02613 g014
Figure 15. Comparison of the spatial distribution of soil erosion modulus and Google Earth high-resolution images. (A,B) the case areas; (a,c) represent the results of soil erosion calculations and the corresponding real images for the red-beds desert and scrubland mixed area, respectively; (b,d) represent the results of soil erosion calculations and the corresponding real images for the settlements and cultivated land, respectively.
Water 15 02613 g015
Figure 16. Comparison of rainfall erosivity of MFI and Mu et al. [22] in 2020.
Water 15 02613 g016
Figure 17. Drone images of red-beds desert in 2020.
Water 15 02613 g017
Table 1. Sensor information of the Gf-2 satellite.
Parameter1 m Resolution Panchromatic/4 m Resolution Multispectral Camera
Spectral rangePanchromatic0.45~0.90 μm
Multispectral0.45~0.52 μm
Table 2. Properties of the 39 soil samples and their corresponding calculated values for the K factor.
IDLand UsemCla/%
(<0.002 mm)
mSil/% (0.002~0.05 mm)mSan/% (0.05~2.0 mm)C%K/(Mg·ha·h·MJ−1·mm−1·ha−1)
1red beds desert16.993.0080.010.560.036
215.903.9780.131.030.037
312.987.9979.040.460.048
413.918.4577.640.160.049
513.980.5085.520.180.024
614.491.5071.511.090.045
742.9616.4952.591.250.056
8grassland19.499.0072.550.510.045
913.9733.4472.570.810.041
1018.978.4974.030.530.036
1118.458.9871.511.180.035
1210.0028.4955.601.020.053
1316.988.9955.073.600.043
1419.499.0065.592.030.040
1510.4833.9251.10%1.170.052
1616.4828.4673.542.120.037
1720.4413.9662.021.520.051
1819.4629.4459.220.990.053
19woodland16.0011.5059.631.880.042
2016.489.9975.502.290.035
2113.4924.4957.651.100.043
2215.4225.3631.070.910.034
2320.4319.9461.571.650.028
2417.007.5027.541.900.024
2519.9322.4229.641.670.027
2648.9519.9859.692.810.050
2732.945.4955.002.250.056
2868.474.0044.981.180.039
2960.389.9870.042.700.046
3015.4324.8834.141.170.040
31farmland14.0031.0072.510.740.039
3235.2019.8358.511.560.048
3316.4813.4861.521.120.055
3449.3916.4664.560.920.050
3520.4920.9984.011.050.029
3616.4718.9740.131.020.049
3714.4745.4035.121.510.058
3818.4746.4240.160.500.056
3917.9541.8940.550.880.038
Table 3. The estimated soil erosion and corresponding proportion for each erosion level in Nanxiong Basin.
Erosion CategoryBefore Treatment (2020)After Treatment (2022)
Area
(km2)
Proportion
(%)
Erosion Rate
(t km−2 yr−1)
Total Erosion
(t yr−1)
Area
(km2)
Proportion
(%)
Erosion Rate (t km−2 yr−1)Total Erosion
(t yr−1)
Slight712.865.54%77.054,885.6907.880.96%53.748,748.9
Mild196.618.08%1223.3240,500.8109.59.77%1208.3132,308.9
Moderate58.55.38%3563.6208,470.635.53.17%3573126,841.5
Strong30.92.84%6333.1195,692.819.41.73%6340.2122,999.9
Extremely strong32.93.03%10,946.2360,129.920.71.85%10902.8225,688.0
Severe55.85.13%48,802.42,723,173.928.42.53%43213.81,227,271.9
Table 4. Transfer matrix of soil erosion intensity in the Nanxiong Basin (km2).
2022SlightMildModerateStrongExtremely StrongSevere
2020
Slight633.17157.4647.6124.0822.9628.58
Mild50.8831.4113.837.807.969.73
Moderate17.1010.015.273.634.145.22
Strong8.535.212.802.052.834.22
Extremely strong7.865.092.722.032.906.24
Severe7.016.373.352.302.9711.62
Table 5. Comparison of soil erosion in typical control areas before and after treatment.
Chengping VillageChangshi VillageYoushan Town
Soil Erosion/(t km−2yr−1)Total Erosion/(t yr−1)Soil Erosion/(t km−2yr−1)Total Erosion/(t yr−1)Soil Erosion/(t km−2yr−1)Total Erosion/(t yr−1)
before treatment30.7124.8720.0915.4745.86199.03
after treatment13.3210.794.753.6612.7155.16
Table 6. Statistical characteristics of soil erosion with different levels of terrain steepness in the Nanxiong Basin.
Slope Range
(°)
Area
(km2)
Erosion Modulus
(t·km−2·yr−1)
Slight
(km2)
Mild
(km2)
Moderate
(km2)
Strong
(km2)
Extremely Strong
(km2)
Severe
(km2)
0°~5°571.01181.8517.654.622.112.211.89.5
5°~8°249.81899.5179.625.79.35.55.96.9
8°~15°244.672731.7168.928.19.35.35.89.3
15°~25°72.94251.647.310.43.21.82.04.1
>25°9.58656.65.61.60.600.41.1
Table 7. Statistics of soil erosion intensity in different land use types in Nanxiong Basin (km2).
Land Use TypesSlight Mild ModerateStrong Extremely Strong Severe
Glass land236.6030.908.704.434.064.57
Cultivated land232.1717.187.223.953.743.81
Forest192.2218.554.442.191.982.55
Construction land59.9515.7910.457.328.499.3
Red-beds desert156.3836.3312.796.756.929.5
Water42.281.790.870.560.691.26
Table 8. Characteristics for different land use types in Nanxiong Basin.
Land Use TypeAverage Steepness/(°)NDVIRainfall Erosivity/(MJ·mm·ha−1·ha−1·yr−1)
Cultivated land3.60.5333.0
Forest9.50.7335.4
Grassland7.00.7336.4
Red-beds desert5.60.4335.3
Disclaimer/Publisher’s Note: The statements, opinions and data contained in all publications are solely those of the individual author(s) and contributor(s) and not of MDPI and/or the editor(s). MDPI and/or the editor(s) disclaim responsibility for any injury to people or property resulting from any ideas, methods, instructions or products referred to in the content.

