Article

Mesocosm Design and Implementation of Two Synchronized Case Study Experiments to Determine the Impacts of Salinization and Climate Change on the Structure and Functioning of Shallow Lakes

by
Korhan Özkan
1,2,*,
Mustafa Korkmaz
1,3,
Cihelio Alves Amorim
3,
Gültekin Yılmaz
1,
Meltem Koru
1,
Yasemin Can
1,4,
Juan Pablo Pacheco
5,6,
Vildan Acar
3,
Mehmet Arda Çolak
7,
Gül Canan Yavuz
3,
Lucía Cabrera-Lamanna
8,
Onat Arıkan
3,
Öykü Tanrıverdi
3,
Serhat Ertuğrul
1,
İrem Gamze Arık
3,
Hande Nesli
9,
İlker H. Tunur
10,
Burak Kuyumcu
1,
Zuhal Akyürek
7,11,
Can Özen
12,
Meryem Beklioğlu
2,3 and
Erik Jeppesen
1,2,3,13,14,15
add Show full author list remove Hide full author list
1
Institute of Marine Sciences, Middle East Technical University, 33731 Mersin, Türkiye
2
Centre for Ecosystem Research and Implementation (EKOSAM), Middle East Technical University, 06800 Ankara, Türkiye
3
Department of Biological Sciences, Middle East Technical University, 06800 Ankara, Türkiye
4
Gene Expression and Genotyping Core, Interdisciplinary Center for Biotechnology Research, University of Florida, Gainesville, FL 32610, USA
5
Centro Universitario de la Regional del Este (CURE), Universidad de la República, Maldonado 11200, Uruguay
6
Department of Ecoscience, Aarhus University, 8000 Aarhus, Denmark
7
Department of Geodetic and Geographic Information Technologies, Middle East Technical University, 06800 Ankara, Türkiye
8
Department of Aquatic Ecology and Environmental Biology, Radboud Institute for Biological and Environmental Sciences, Radboud University, 6500 GL Nijmegen, The Netherlands
9
Department of Electrical-Electronics Engineering, Faculty of Engineering, Mersin University, 33343 Mersin, Türkiye
10
Offshore Engineering Solutions Ltd., Mersin University, 33343 Mersin, Türkiye
11
Department of Civil Engineering, Middle East Technical University, 06800 Ankara, Türkiye
12
Department of Biotechnology, Middle East Technical University, 06800 Ankara, Türkiye
13
Department of Ecoscience and WATEC, Aarhus University, 8000 Aarhus, Denmark
14
Sino-Danish Centre for Education and Research (SDC), Beijing 101408, China
15
Institute for Ecological Research and Pollution Control of Plateau Lakes, School of Ecology and Environmental Sciences, Yunnan University, Kunming 650500, China
*
Author to whom correspondence should be addressed.
Water 2023, 15(14), 2611; https://doi.org/10.3390/w15142611
Submission received: 27 May 2023 / Revised: 4 July 2023 / Accepted: 11 July 2023 / Published: 18 July 2023
(This article belongs to the Special Issue Global Change Effects on Water Level and Salinity: Causes and Effects)

Abstract

:
Salinization of freshwater ecosystems is one of the major challenges imposed largely by climate change and excessive water abstraction for irrigated crop farming. Understanding how aquatic ecosystems respond to salinization is essential for mitigation and adaptation to the changing climate, especially in arid landscapes. Field observations provide invaluable data for this purpose, but they rarely include sufficient spatial and temporal domains; however, experimental approaches are the key to elucidating complex ecosystem responses to salinization. We established similar experimental mesocosm facilities in two different climate zones in Turkey, specifically designed to simulate the effects of salinization and climate change on shallow lake ecosystems. These facilities were used for two case-study experiments: (1) a salinity gradient experiment consisting of 16 salinity levels (range: 0–50 g/L); and (2) a heatwave experiment where two different temperature regimes (no heatwave and +6 °C for two weeks) were crossed with two salinity levels (4 and 40 g/L) with four replicates in each treatment. The experiments lasted 8 and 2 months, respectively, and the experimental mesocosms were monitored frequently. Both experiments demonstrated a significant role of salinization modulated by climate on the structure and function of lake ecosystems. Here, we present the design of the mesocosm facilities, show the basic results for both experiments and provide recommendations for the best practices for mesocosm experiments conducted under saline/hypersaline conditions.

1. Introduction

Climate change is predicted to result in dramatic changes in global temperature and precipitation patterns. The Mediterranean climate zone as well as other regions with cold or hot semi-arid climates are expected to be strongly affected by these predicted changes. Specifically, the Mediterranean region is expected to receive a 25–30% decrease in precipitation, as well as an increase in evaporation by the end of the 21st century [1]. Moreover, we can expect a concurrent increase in water abstraction, particularly for irrigation purposes, in part because of the decrease in net precipitation. Furthermore, enhanced demand for food by a growing population, along with the shift, in part, from animal husbandry to crop farming in semi-arid areas, will accelerate the salinization of lakes due to a water budget deficiency [2,3] The consequent changes in salinities can induce dramatic changes in the structure and function of ecosystems [1].
The Central Anatolian Plateau in Turkey, a characteristic semiarid landscape, hosts diverse aquatic ecosystems with high endemism [2]. These biodiversity hotspots face impacts from both climate change and water abstraction for irrigated crop farming and, as a consequence, these valuable habitats are being lost at an alarming rate [4]. Recent studies have documented a dramatic decline in inland lake size and an increase in salinity in the semi-arid regions of Turkey, as well as a loss of associated biodiversity [2,3]. The extreme consequences of the complex pressures of climate change and water abstraction, especially in the form of species loss or range contraction, are easy to detect using field research. However, gradual changes, potentially leading to ecosystem state shifts or collapses in the long term as well as changes in structure and functioning, are more difficult in such studies that typically have a limited temporal and spatial scope. To develop a mechanistic understanding and predict the ecological consequences of salinization, multiple complementary approaches, especially mesocosm experiments, are therefore needed [1,5].
Smaller-scale laboratory microcosm experiments have been frequently used to relate the impact of salinization to the physiological state or population growth rate of organisms [5]; however, due to their limited realism, extrapolation of the results to natural ecosystems is difficult [6]. Mesocosm experiments are therefore more valuable for testing community- and ecosystem-level responses to changes as they, despite limited replications, can include greater biological complexity at a larger scale. Mesocosm experiments can also help to distinguish direct from indirect effects over generations, especially for taxa that cannot be housed in microcosms. Experimental studies in microcosms and mesocosms allow the testing of multiple environmental stressors, both isolated and in interaction, the structure and functioning of ecosystems, as well as the mechanisms involved [7]. Experiments can reveal causality and the underlying mechanisms, but it is important to keep in mind that they are still simplifications of the natural systems, particularly when conducted with a small spatial and temporal scope [6]. Nevertheless, mesocosm studies still provide replicable and traceable information that allows researchers to isolate various ecosystem effects and modify environmental conditions, which is generally not feasible in field research in natural ecosystems (e.g., controlled warming) [8,9].
Two types of experiments are typically used in large-scale mesocosm facilities [6]: (i) factorial-designed experiments with a limited set of treatments and 3–5 replicates and (ii) gradient-designed experiments with a wide set of treatments and a few or no replicates. While the first is suitable for studying the effects of one or a few treatments and their interactions (depending on the number of mesocosms available), the latter is especially suitable for studying threshold responses related to one or a few treatments.
Mesocosm experiments [10] have been used frequently in lakes (e.g., [11,12,13]) and marine studies (e.g., [14,15,16,17] also www.aquacosm.eu, accessed 1 May 2023), but only a few mesocosms studies on inland saline systems have been conducted [1,5]. Some mesocosm studies identified the effects of salinity on trophic structure in brackish lakes and the responses when certain salinity thresholds were surpassed (e.g., [18,19]. Others have studied the effects of road salts (e.g., [20,21]). A cattle-tank-type mesocosms study on the interactive effects of fish and road salts on trophic level dynamics found synergistic effects with the strongest cascading impact on zooplankton, which in turn led to higher phytoplankton biomass [20]. A comprehensive joint mesocosm salinity gradient experiment [22] conducted in North America and Europe found that the specific thresholds for salt in waters in these areas led to a substantial loss of key zooplankton groups, as judged from the results from most experimental set-ups [22,23]. They also found a loss of abundance and diversity of zooplankton along the salinity gradient. Despite the comprehensive nature of the study, the authors had difficulties identifying uniform shifts in trophic structure along a salinity gradient [22], that might be reflecting the selected non-standardized set-up as they used various existing available mesocosm facilities.
Here, we describe a novel mesocosm experimental set-up established at two sites in Turkey with contrasting climates: on the Mediterranean coast in the south (Mersin) and in the Central Anatolian highland (Ankara). We describe the experimental set-up and show some key time-aggregated results from two synchronized mesocosm experiments conducted in 2021 and 2022: (i) a salinity gradient experiment and (ii) a heat wave experiment crossed with two salinities with a factorial design, both replicated simultaneously at the two sites. We elucidate how the ecosystem’s structure and functioning reacted to a gradient in salinity, both in the short-term (weeks) and long-term (months). Our goal is to illustrate the value of using mesocosms for different kinds of salinity-climate interaction experiments, and we, therefore, only present aggregated data in brief instead of providing detailed data and discussion of results, which will be presented elsewhere in more specific topic-oriented manuscripts. Finally, we provide recommendations for the best practices for the design and implementation of mesocosm experiments in saline and hypersaline ecosystems.

2. Material and Methods

2.1. Mesocosm Location and Infrastructure

The mesocosm set-ups were designed to simulate the effects of climate and changes in salinization in shallow lakes in arid landscapes, such as the Central Anatolian plateau. We set up two mesocosm experimental facilities in two different climatic regions, one in Central Anatolia, Ankara (39°53′44.37″ N, 32°46′45.51″ E), and one in South Anatolia, Mersin (36°33′52.18″ N, 34°15′14.50″ E), both located at the campuses of the Middle East Technical University (Figure 1). Ankara has a cold semi-arid climate (Köppen-Geiger climate classification BSk), with an annual mean temperature of 12.1 °C, while Mersin has a hot and dry Mediterranean climate (Csa) with an annual mean temperature of 19.6 °C, (Figure 1, Turkish State Meteorological Service, 2021, https://mgm.gov.tr/, accessed 1 May 2023).
A total of 24 mesocosms were established at each location, allowing for a 3 × 2 factorial experimental design with four replicates per treatment. Each mesocosm was designed to replicate shallow lake characteristics in arid landscapes. The mesocosms had a diameter of 2 m, were 1.8 m high, and had a volume of 5 m3. They were made of high-density polyethylene (HDPE) due to the material’s resistance to high salinities and UV exposure. The mesocosms were manufactured with a minimum wall thickness of 6 mm for extra durability and positioned on concrete or compacted and padded sand floors for structural support. The mesocosms were buried at 1 m depth, and the exposed walls were insulated to minimize heat exchange. To facilitate infrastructure maintenance, the mesocosms were connected with underground channels.
To prevent stratification, the water in each mesocosm was circulated with an aquarium wave maker (5 watts of power) that was fixed 15 cm above the sediment and facing 45° upwards to the surface and ran throughout the experiment. Half of the mesocosms were equipped with glass heaters with a total capacity of 3–4 kW per mesocosm.
To provide dynamic heating for temperature increase simulations, selected mesocosms were heated according to measurements of reference non-heated mesocosms. All the mesocosms were equipped with a microprocessor-based (Arduino Nano) controller, temperature sensors, and a logging system. An open-source user interface controller program was developed in the Java programming language using the Processing 3 software program [24]. System communication was made based on the UDP protocol over the Ethernet network, which was the fastest method. The microprocessor controls the automatic activation and deactivation of the heating elements in the selected mesocosms according to the desired increase in mean temperature of the real-time measurements from the selected reference mesocosms. Each electronic board hosting four microprocessors is connected to Ethernet communication modules (Enc28j60), 12 K Type thermocouple temperature sensors (Max6675 module), Arduino-compatible RTC clock modules, solid-state relays to power heaters, an Ethernet switch, and a 5-volt power supply energy module. A series of alarms were designed in the event of potential failures. When the electronic cards detect an alarm, they are monitored in the interface program over the Ethernet network and broadcasted as a direct message instantly on a Twitter account. At the same time, the system software keeps an instant log of historical data in a file on the server and the cloud.

2.2. Mesocosm Ecosystems and Inoculation of Aquatic Communities

Each mesocosm received 30 cm of sediment to simulate realistic sediment biogeochemistry and redox gradient, which is especially important in greenhouse gas (GHG) dynamics research and for elucidating the benthic-pelagic coupling. The sediment was prepared with 50% silicate sand and 50% natural lake sediment collected from Lake Uyuz (salinity 1.64 g/L) and Lake Kozanlı (salinity 1.0 g/L) and transported to each facility simultaneously (Figure 1). The silicate sand and natural sediment were mixed thoroughly and distributed evenly to the mesocosms.
The mesocosms were filled with groundwater (1.2 m water column height), and water loss due to evaporation was compensated biweekly by groundwater addition. At all sites, the groundwater had high nutrient concentrations. We planned to run the experiment under eutrophic conditions (75 µg/L of TP and 1500 µg/L of TN) to reflect the structure of the targeted ecosystems [25,26], assuming a TN:TP weight ratio of ~20:1. Due to the high N concentration in the groundwater in both Ankara and Mersin, the desired ratio was not achieved. For the first experiment, the initial total phosphorus concentrations were 39.6 and 31 µg/L, and the total nitrogen concentrations were 3701 and 3972 µg/L in Ankara and Mersin, respectively. Based on this, 35.4 and 44 µg/L P were added in all mesocosms in Ankara and Mersin, respectively, to sustain the desired loading (no N was added). For the second experiment, the initial total phosphorus concentrations were 39 and 40 µg/L, and the total nitrogen concentrations were 1418 and 1809 µg/L in Ankara and Mersin, respectively. We then added 36 and 35 µg/L P in all mesocosms in Ankara and Mersin, respectively, and 390 µg/L N only in Ankara to compensate for the differences between places. We employed a fixed loading approach for the nutrient additions to compensate for nutrient loss during the experiments. We performed weekly additions of N and P as proposed by [11], with a 1:20 ratio of P:N by weight and assuming a monthly loss rate of 25% (18.75 µg/L/month of P and 375 µg/L/month of N) for the first experiment. For the second experiment, we assumed a monthly loss of 40% to prevent nutrient limitation (30 µg/L/month of P and 600 µg/L/month of N). We used NaH2PO4 as a source of P and Ca(NO3)2 and NH4Cl as sources of N.
Each mesocosm was stocked with submerged macrophytes from five coastal lagoons with markedly different salinities from the Göksu Delta area in Silifke, Mersin (Figure 1). The macrophytes were planted in the sediments of all the mesocosms immediately before the first experiment (eight clusters of around five shoots per mesocosm). The most abundant macrophyte in the mesocosms was the brackish species Ruppia cirrhosa (Petagna) Grande, followed by Stuckenia pectinata (L.) Börner. A few shots of the freshwater species Ceratophyllum demersum L. and Myriophyllum sp. emerged later, probably deriving from resting stages in the sediment added to the mesocosms from the low-saline Lakes Uyuz and Kozanlı (Figure 1).
Alburnus escherichii Steindachner, 1897, a native fish species of Anatolia, was stocked in the mesocosms due to its high salinity and eutrophication tolerance. Fish were collected overnight from Üçbaşlar pond (40°25′9.64″N, 32°41′40.75″ E) near Kızılcahamam, Ankara, using custom-made bait traps. The collected fish were kept oxygenated in 250-Liter tanks and distributed between the two facilities within 2 days. Each mesocosm received four fish; the fish were acclimated in 7 L of water from the stock aquarium and 7 L of water from the mesocosm for 10 min before being added to the mesocosms. Fish deaths were monitored in the mesocosms daily. Dead fish were removed from the mesocosms and substituted. As it was difficult to monitor fish presence in the turbid mesocosms, we set up baited fish traps that were hung 20 cm above the sediment. If no fish/fish movement was detected for >7 days, extra fish were added to compensate for the loss. We conducted fish stocking to compensate for fish deaths in the mesocosms with 0–14 g/L of salinity. However, no additional stocking was conducted when the mesocosms reached a salinity of 17 g/L or higher because it is known that A. escherichii has a salinity threshold of 12–17 g/L.
In addition to the initial stocking with natural sediment, macrophytes, and fish, each mesocosm received a living inoculum of plankton and lake sediment from five shallow coastal lakes and ponds in the Göksu River delta, Silifke, and Mersin, with contrasting salinities (8–36 g/L). Plankton was gathered by hauling it into the water with nets of different mesh sizes (20 and 140 µm). Sediment inoculum was taken with a sledge on the bottom and near the shore with a sweep net, and all was filtered on a 500 µm mesh. To equalize the effort, the sampling (hauling and sledging), conducted by six people, lasted for about 20 min at each site. All inoculums from the five sites were added to three 100-L tanks and kept oxygenated: one for sediment and macroinvertebrates, one for large-bodied plankton (>140 µm), and one for small plankton (unfiltered water + the 20 µm samples). All inoculum was distributed equally to the mesocosm facilities at each site within two days of sampling. Since all mesocosms were in a freshwater state when the inoculum was initially added, we added a second inoculum when the target salinity concentration was reached (first gradient experiment) on 8 December 2021. This time the inoculum was only taken from a high-saline lake, Lake Acıgöl, Konya, with a salinity of 68.8 g/L and high densities of Artemia sp. (Figure 1).

2.3. Experiment 1

To elucidate the threshold response of shallow lakes to increasing salinity, we conducted a salinity gradient experiment with 16 different salinity levels between 9 September 2021, and 13 May 2022. After the mesocosm set-up for sediment and biota inoculation, as explained above, salt treatments were applied. During the first month of the experiment, we studied the short-term response to increasing salinity by raising the salinity daily by 1/30 of the target concentration with salt additions (salinization phase). The salinity treatments were applied at 0, 2, 4, 6, 8, 10, 12, 14, 17, 20, 23, 26, 30, 35, 40, and 50 g/L salt concentrations. The selected salinity range reflected the observed salinities in the central Anatolian lakes sampled. We maintained the target concentration for the subsequent five months, including the winter (stable phase), followed by 50 days of desalinization, which was achieved by the daily removal of 10% of the mesocosm water and substituting it with groundwater (desalinization phase). This allowed us to study the effects of stable conditions and both sharp increases and decreases in salinities during autumn and winter at changing temperatures. As the same experiment was run synchronically in the two different climatic regions with different temperatures, the results also provide insights into climate differences, although the temperature was not included as a treatment as in a factorial-designed study (e.g., experiment 2).
The ion composition of the Central Anatolian lakes is constituted by common major ions (mainly NaCl) as well as sulfate (SO4), reflecting the sedimentary rock geology with the presence of gypsum in the catchment. Sulfate is especially important for methane efflux as it (i) favors sulfate-reducing bacteria, which in turn outcompete methane producers, and (ii) oxidizes methane in the water column [27,28]. Therefore, the salt treatments included a mixture of NaCl and SO4 (in the form of Na2SO4). The SO4 to chlorine (i.e., salinity) ratio is virtually constant in coastal wetlands; in inland waters, it is more variable, albeit generally higher than in seawater, reflecting the effects of local geology. Therefore, we used the nominal seawater ratio (2.69 g/L SO4 to 35 g/L salinity), as this provides adequate SO4 availability in the system [27,29]. Na2SO4 contributed nearly twice as much as NaCl to the total salinity [30], which was taken into account when calculating the needed amounts of salts to achieve the target salinities. Small changes in salinity resulting from evaporation or rainfall were effectively balanced by adding salts with the same SO4-to-chlorine ratio. The sampling methodology is described in Section 2.5.

2.4. Experiment 2

To elucidate how extreme heatwave events in combination with salinity stress affect the ecosystem structure and function of shallow lakes, we conducted a factorial-designed heatwave experiment, where two different temperature regimes (ambient temperature and a two-week heatwave with an increase in temperature of +6 °C) were crossed with two different salinity levels (4 and 40 g/L), all having four replicates. The experiment was conducted between 29 August and 3 November 2022.
Before the desalinization phase of the first experiment, four extra unused mesocosms at both sites received water from four mesocosms with similar salinities (final salinities of 3, 11, 21.5, and 39 g/L, obtained by combining water from the different treatments from experiment 1), acting as inoculum for the second experiment. Sediment, water, macrophytes, and fish from the experimental mesocosms were also kept at similar salinities and later used to back-inoculate the experimental mesocosms before the second experiment. The experimental mesocosms from the gradient experiment were randomly selected for the second experiment without disturbing the sediment. The water was completely removed and renewed with fresh groundwater many times until all mesocosms and sediments had similar low salinities. Later, the salinity was adjusted to two levels (4 and 40 g/L), as described above. Then, the water column in the mesocosms from each salinity treatment was homogenized by mixing the water column between each mesocosm (by high-capacity pumps in Ankara and a 20 m3 water tank in Mersin) many times to create similar water column starting conditions. The 4 and 40 g/L mesocosms were inoculated with sediment and water from the four local inoculation mesocosms. Furthermore, a mixture of inoculations was prepared from all mesocosms in each salinity group in both Ankara and Mersin facilities and cross-distributed between these two facilities. All mesocosms were further inoculated with submerged macrophytes (R. cirrhosa, and S. pectinata 10% coverage per mesocosm), and the ones with 4 g/L salinity received four fish per mesocosm (no fish at the high salinity, as fish would not survive). Furthermore, an extra inoculum of water and sediment from the high-saline Acıgöl Lake in Konya was added to all mesocosms, aiming to include Artemia sp. as an additional trophic level in the mesocosms with 40 g/L of salinity.
After creating homogeneous starting conditions, the mesocosms were left to settle for two weeks before sampling. The experiments were conducted in three phases: (i) three weeks of ambient temperatures; (ii) two weeks of a +6 °C heatwave and control treatment; and (iii) three weeks of ambient temperatures after the heatwave. So, we had three different periods during the experiment, which included: pre-heatwave, heatwave, and post-heatwave. The heatwave was applied over 3 days with a 2 °C increase at the start of each day or a 2 °C decrease at the end of each day. The sampling methodology is described in Section 2.5.

2.5. Sampling and Analyses

All mesocosms were sampled for the basic physicochemical and biological variables at varying frequencies, ranging from twice a week to once a month, reflecting the expected rate of change in the experimental tanks. For each sampling event, several variables were measured. First, temperature, conductivity, salinity, dissolved oxygen, and pH were logged with portable sensors (YSI ProDSS in Mersin and YSI 556 MPS in Ankara), and water transparency was measured with a Secchi disc. Second, mesocosm depth-integrated water column samples were taken with a tube sampler for water chemistry and plankton analyses. Water samples were stored in polyethylene bottles for analyses of chlorophyll-a (chl-a), suspended solids (SS), alkalinity, and nutrient concentrations. Chl-a concentrations were determined after pigment extraction with absolute ethanol, and the absorbances were measured in a spectrophotometer at 663 and 750 nm wavelength [31]. The SS was measured by filtering a known volume of water onto a pre-weighted GF-C filter and then oven-dried for 12 h at 105 °C. The difference between the final and initial weights was considered the SS concentration (mg/L). For alkalinity, we followed the method of [32], which recommends titration of unfiltered water using phenolphthalein, B.D.H. 4.5 indicator, and 0.01 N hydrochloric acid for determination of the concentration of bicarbonate and carbonate in the water.
Total phosphorus (TP) and soluble-reactive phosphorus (SRP) were determined by the ammonium molybdate and ascorbic acid reduction methods [33]. In the first experiment, the concentrations of nitrate (NO3) + nitrite (NO2) and total nitrogen (TN) were assessed by an automated Skalar N autoanalyzer. Total nitrogen samples were digested at 90 °C with an alkaline persulfate solution [34]. In the heatwave experiment (experiment 2), N analyses were carried out using a Seal Analytical (Norderstedt, Germany) AA3 autoanalyzer [35]. In this case, TN samples were autoclaved at 115 °C for 120 min with an alkaline persulfate solution with a ratio of 1:10 for digestion and then measured as NO3 [35].
We tested the potential effect of high salinities on the P and N analyses [33]. For this purpose, we prepared a set of treatments with known concentrations of P (0, 20, 40, 100, 200, and 400 µg/L) crossed with the salinities 0, 2, 4, 10, 26, and 50 g/L, or N (200, 800, and 1600 µg/L) crossed with the salinities 0, 4, 10, 17, 26, 35, and 50 g/L. The standard solutions were prepared using potassium phosphate (KH2PO4), potassium nitrate (KNO3), and sodium chloride (NaCl). After that, the samples were analyzed and calibrated with standards with different salinity matrixes: 0, 10, and 50 g/L for SRP; 0 and 50 g/L for TP, and 0 g/L for NO2, NO3, and TN. Salinity did not significantly interfere with the P or SRP analyses independent of the P concentration or salinity matrix used (0, 10, or 50 g/L) with an average error of 5%, confirming that the analysis method was accurate for both freshwater and saline samples in this experiment (Figure S1a–e). For the N analyses, a slight decrease in N concentrations was observed in the samples with 50 g/L salinity with an average error of 8%, which was considered acceptable for our purpose. Higher deviations were observed at low N concentrations (i.e., 200 µg/L) (Figure S1f).
The submerged macrophyte coverages were assessed at the end of the experiments. The macrophyte percent volume infested (PVI%) was calculated as coverage multiplied by plant height divided by mesocosm depth [36]. Fish were constantly monitored for presence and survival in the different treatments. Here, we only report the standard sampling protocol for both experiments including some key variables (e.g., salinity, temperature, water transparency, chl-a, SS, SRP, TP, NO3 + NO2, TN, and macrophytes PVI%), but several other parameters were also measured during the experiments (e.g., dissolved oxygen, pH, alkalinity, major ions, photosynthetic pigments, GHG emissions, metagenomics, periphyton, phyto- and zooplankton, etc.) depending on the specific research requirements, and the results of these measurements will be presented elsewhere.

2.6. Statistical Analyses

All the statistical analyses were performed in the programming language R (version 4.3.0) [37]. All the graphs were created using the package ggplot2 in R [38]. For the first experiment, we generated generalized additive models (GAM), assuming a Gaussian distribution of the data, to estimate the relationships between the response variables and salinity using the package mgcv in R [39]. For the second experiment, because of the presence of some non-normal or non-homogeneous data, we compared the effects of the factors place, salinity, heating, and phases of the experiment on the response variables with a four-way analysis of variance with aligned rank transformation (ART-ANOVA) using the package ARTool in R [40]. Significant differences between the means were further verified with the Tukey pairwise comparison test between the factors heating and phases.

3. Results and Discussion

3.1. Experiment 1

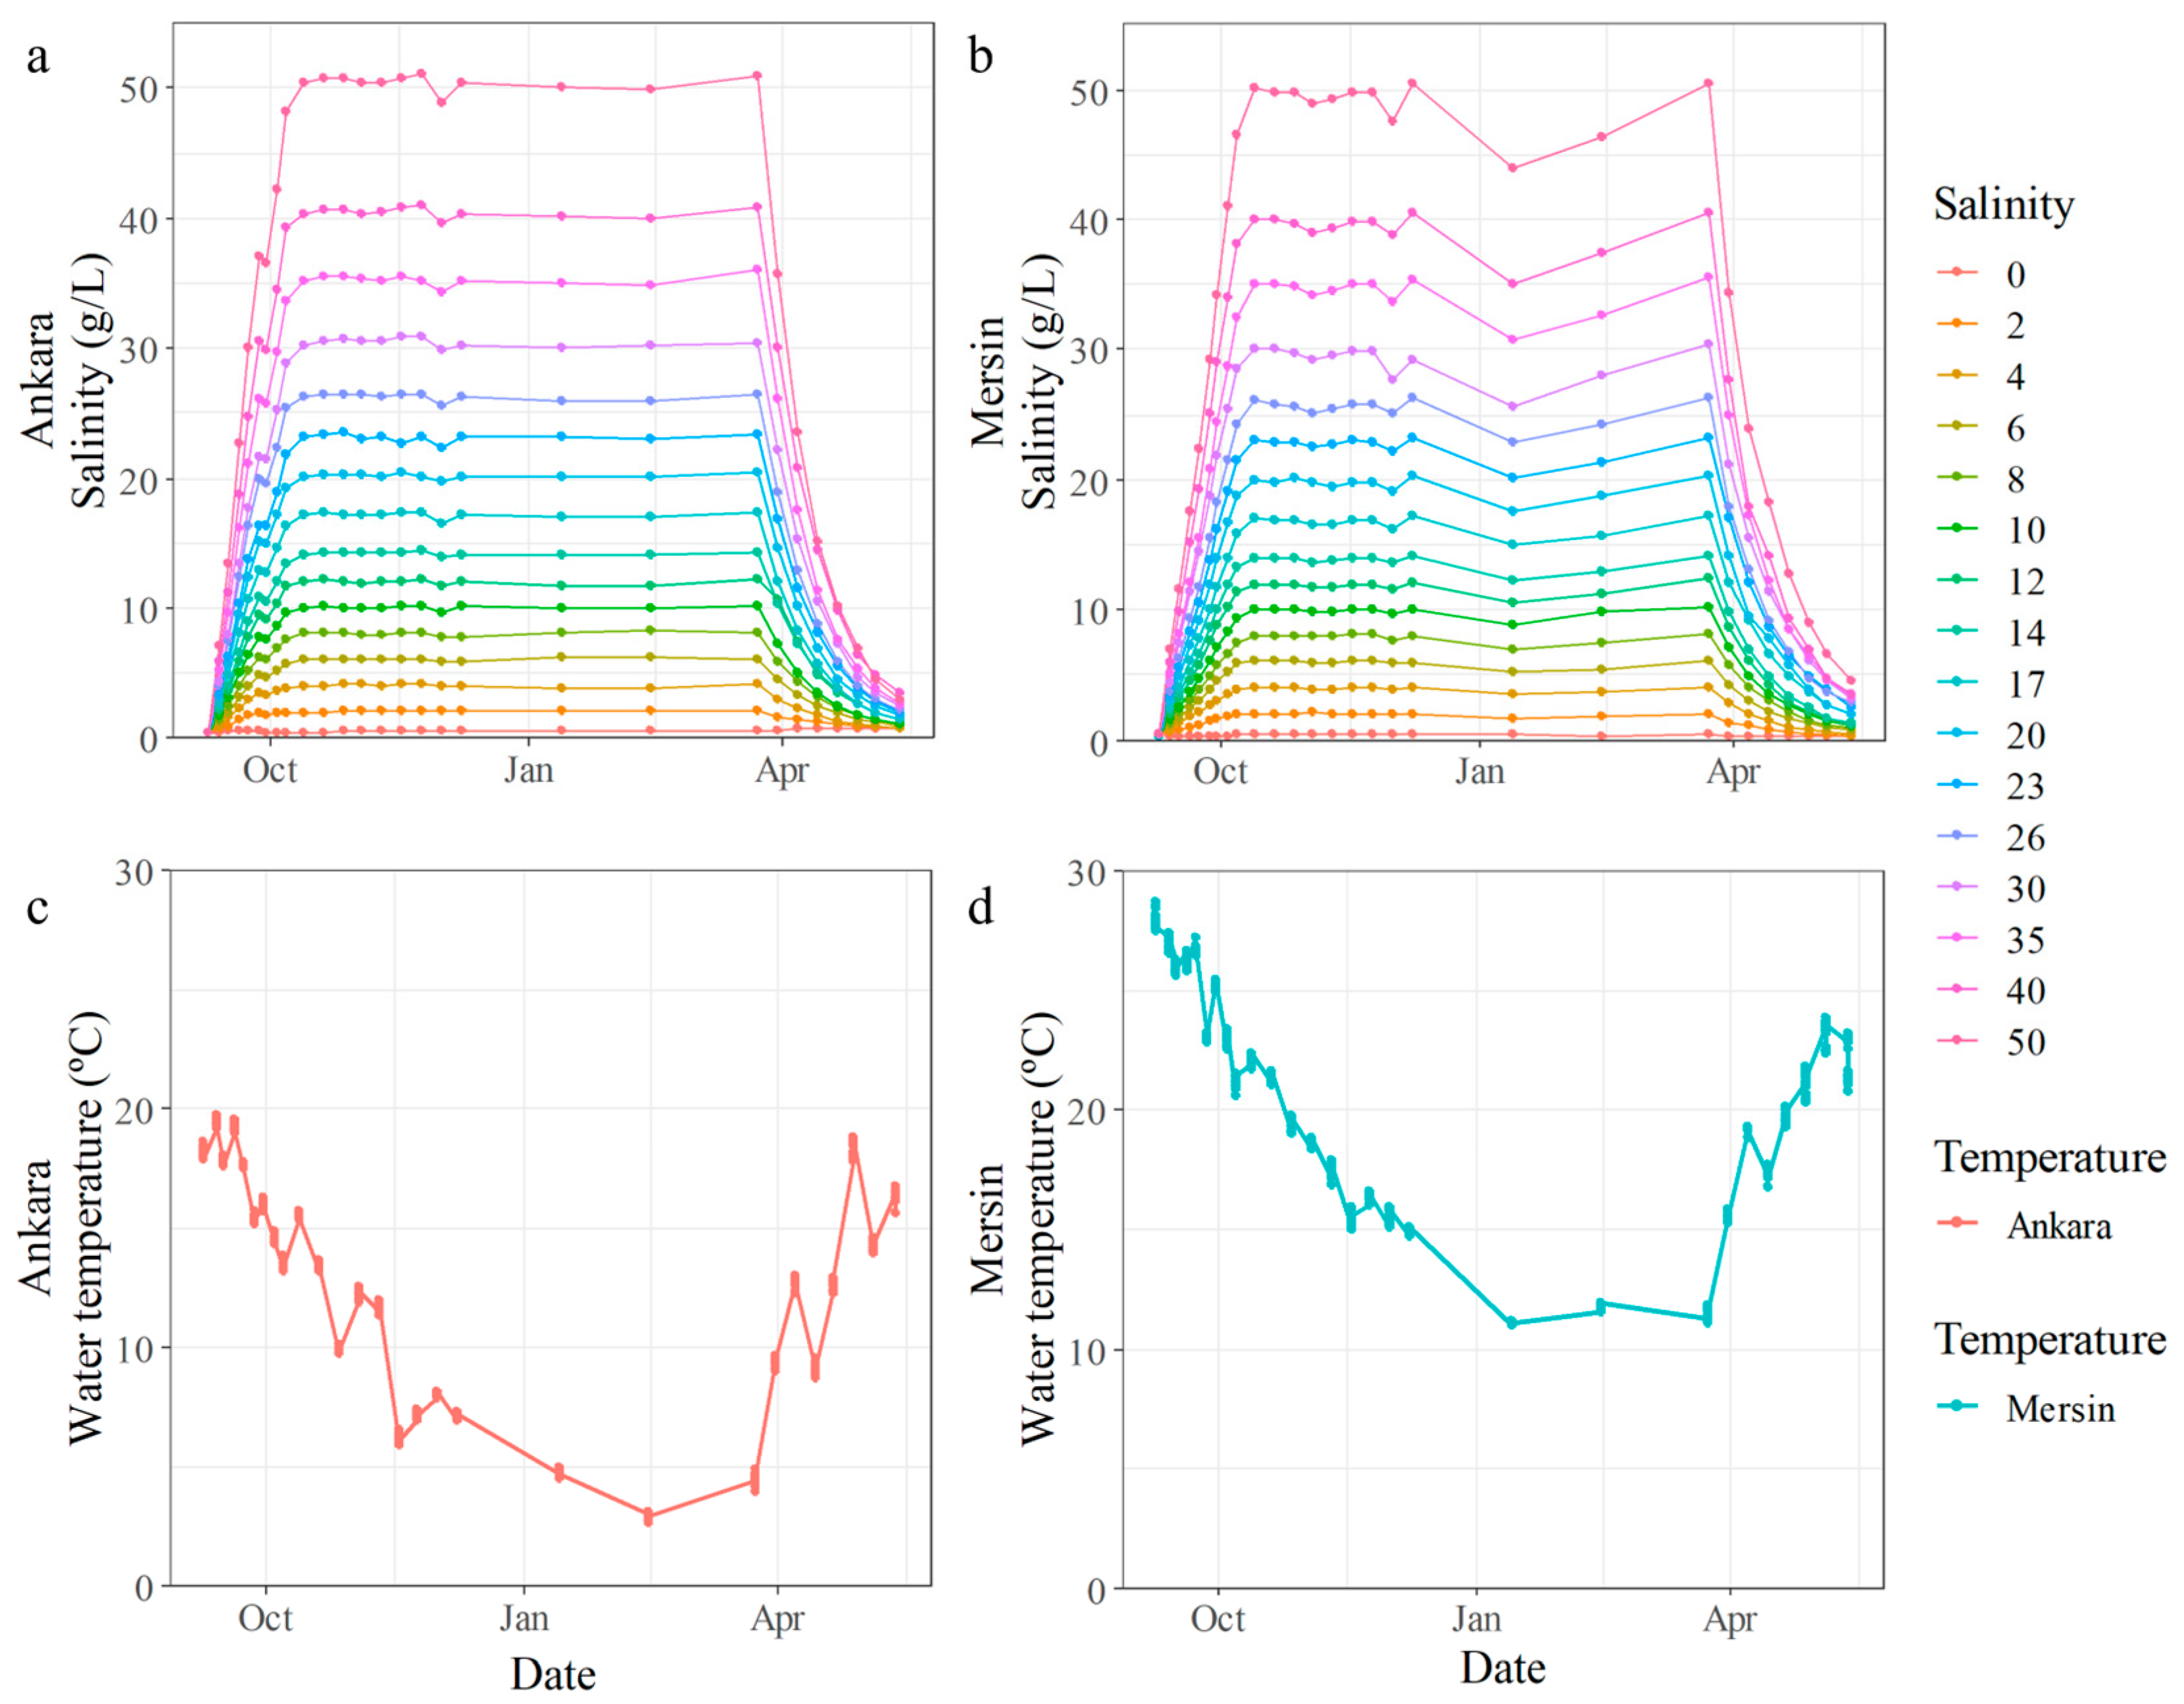
The salt concentrations increased linearly to the target salinity level during the first 30 days of the experiment, as planned (Figure 2a,b). The rate of salt loss to the sediment was lower than anticipated, and only ~5% extra salt was added whenever needed to maintain the desired stable salinity. We also observed water loss due to evaporation (on average: 120–150 L for Mersin and 60–120 L for Ankara, which was less than 4% of the volume at both sites). This was compensated for by adding fresh groundwater to the mesocosms whenever needed. The temperature differences between the two experimental facilities were reflected in the water temperature in the mesocosms, with differences ranging between 2.9 °C during spring and 9.7 °C during autumn (Figure 2c,d).
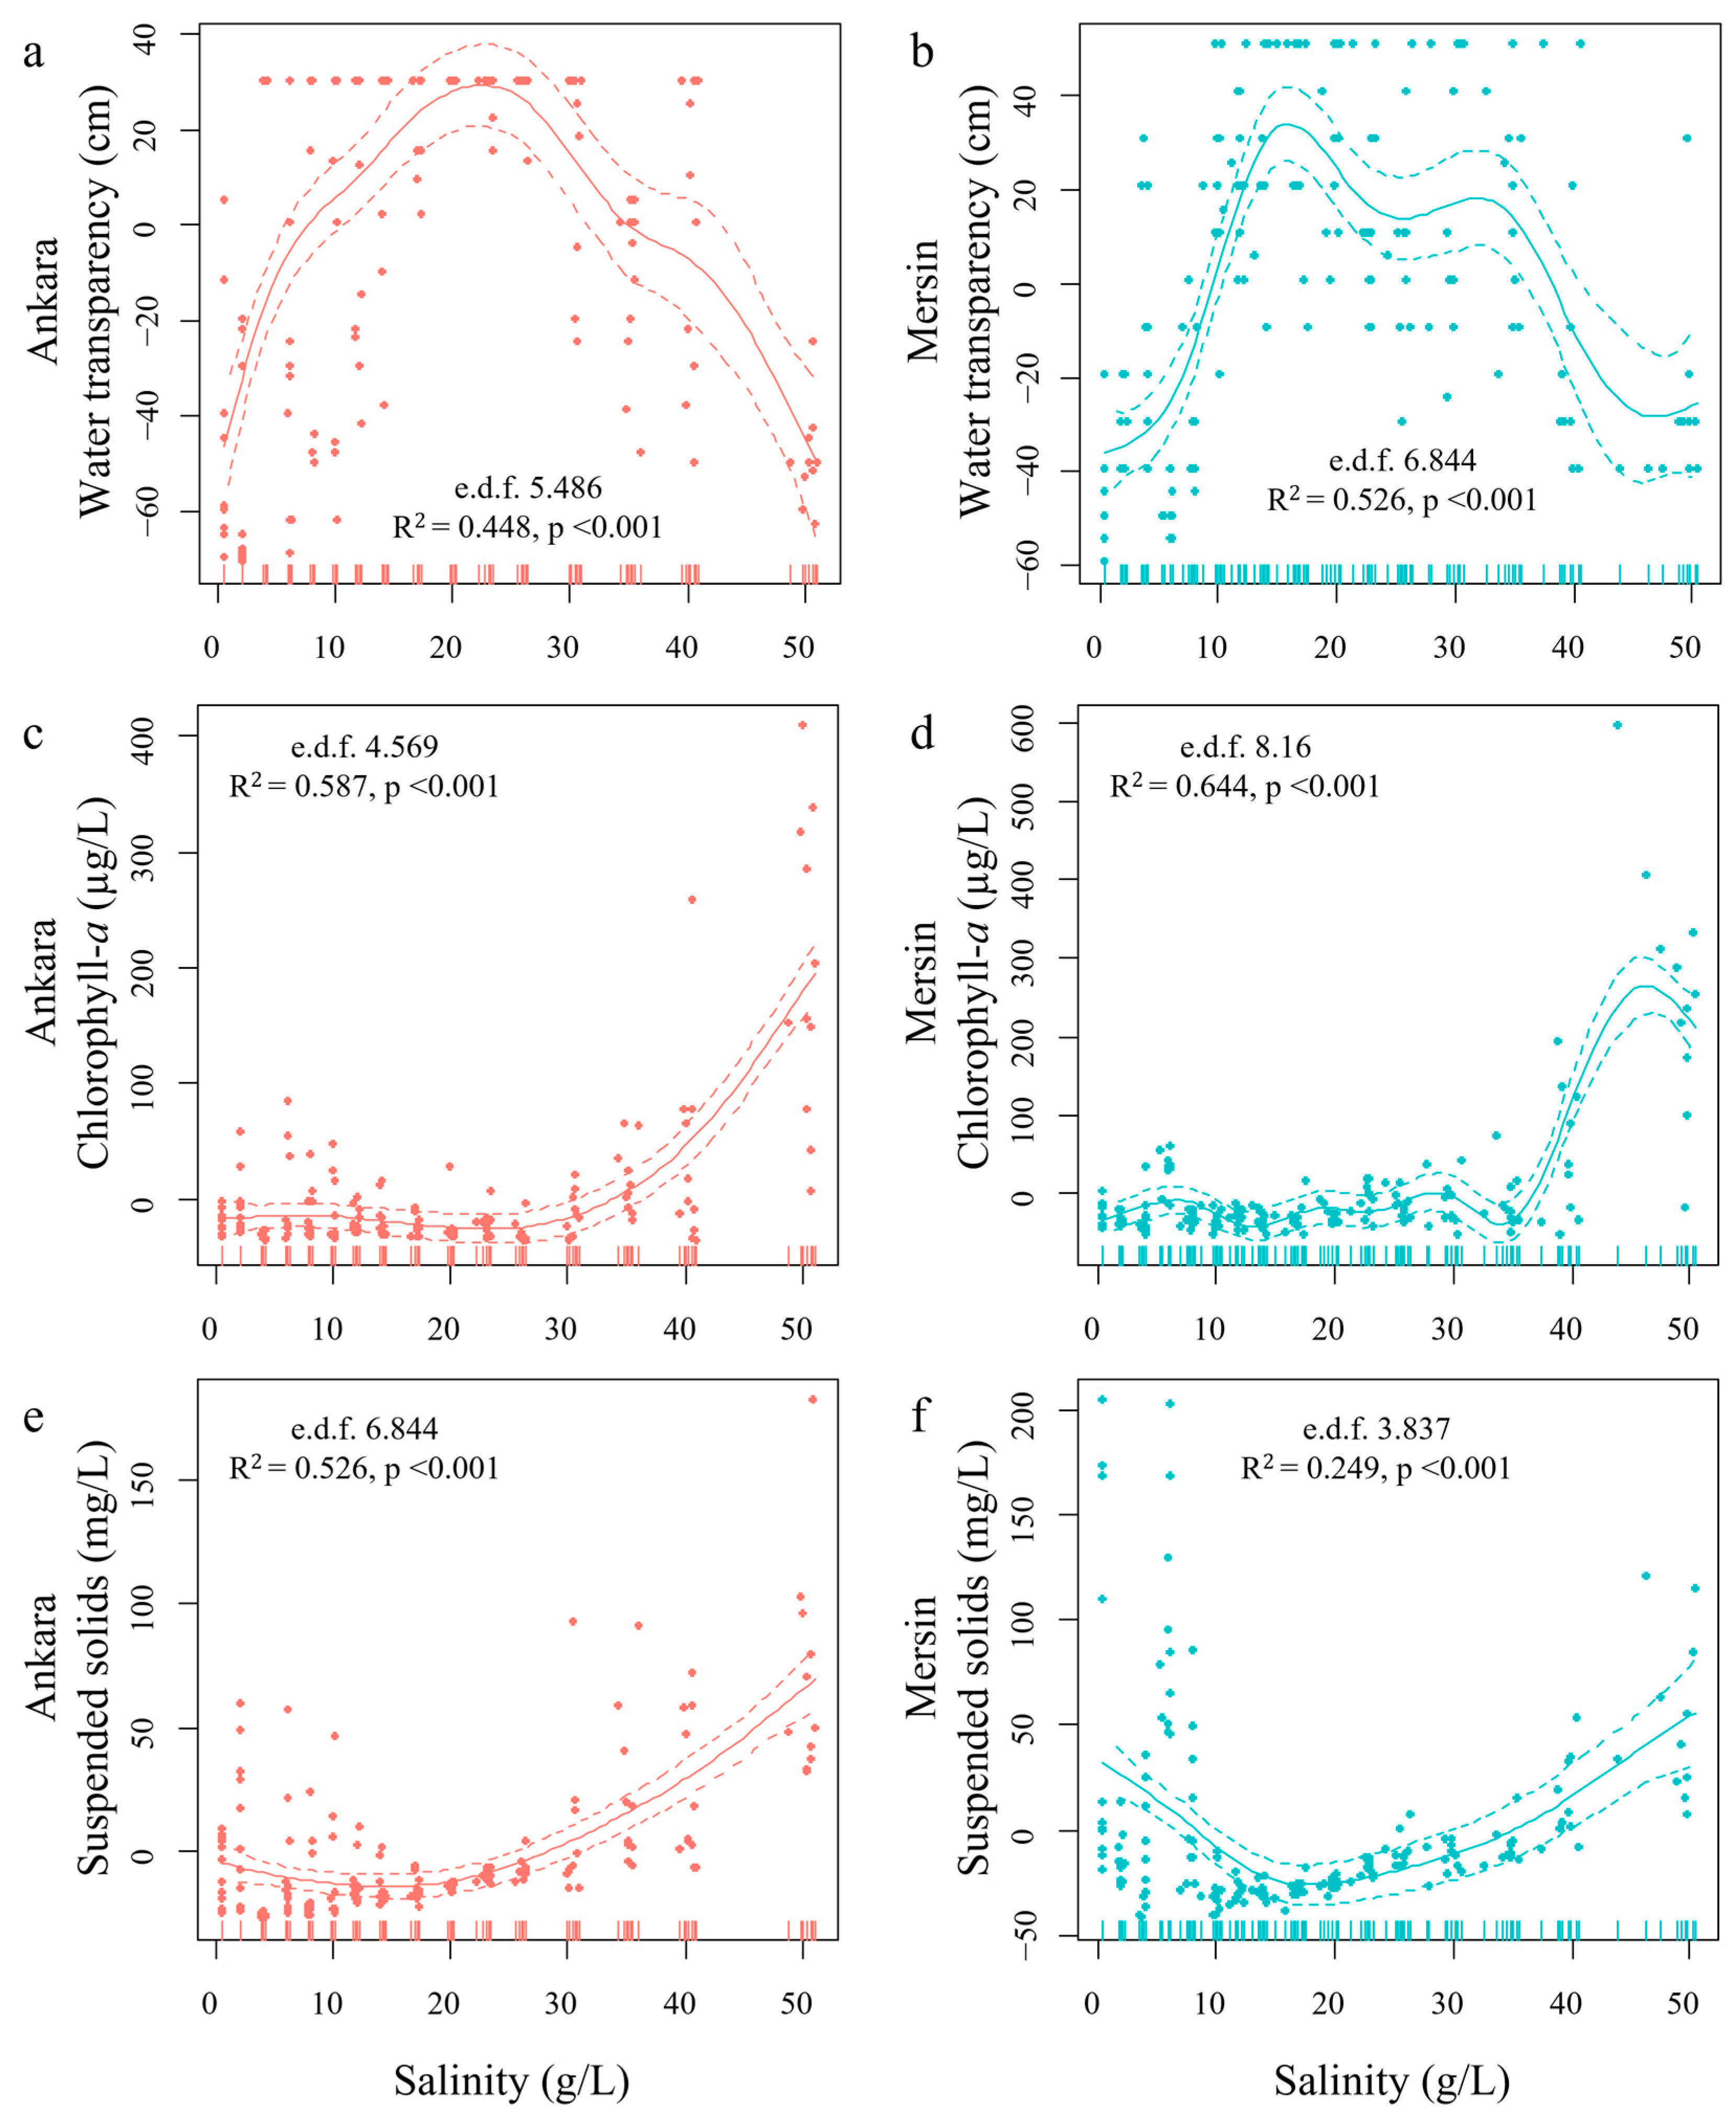
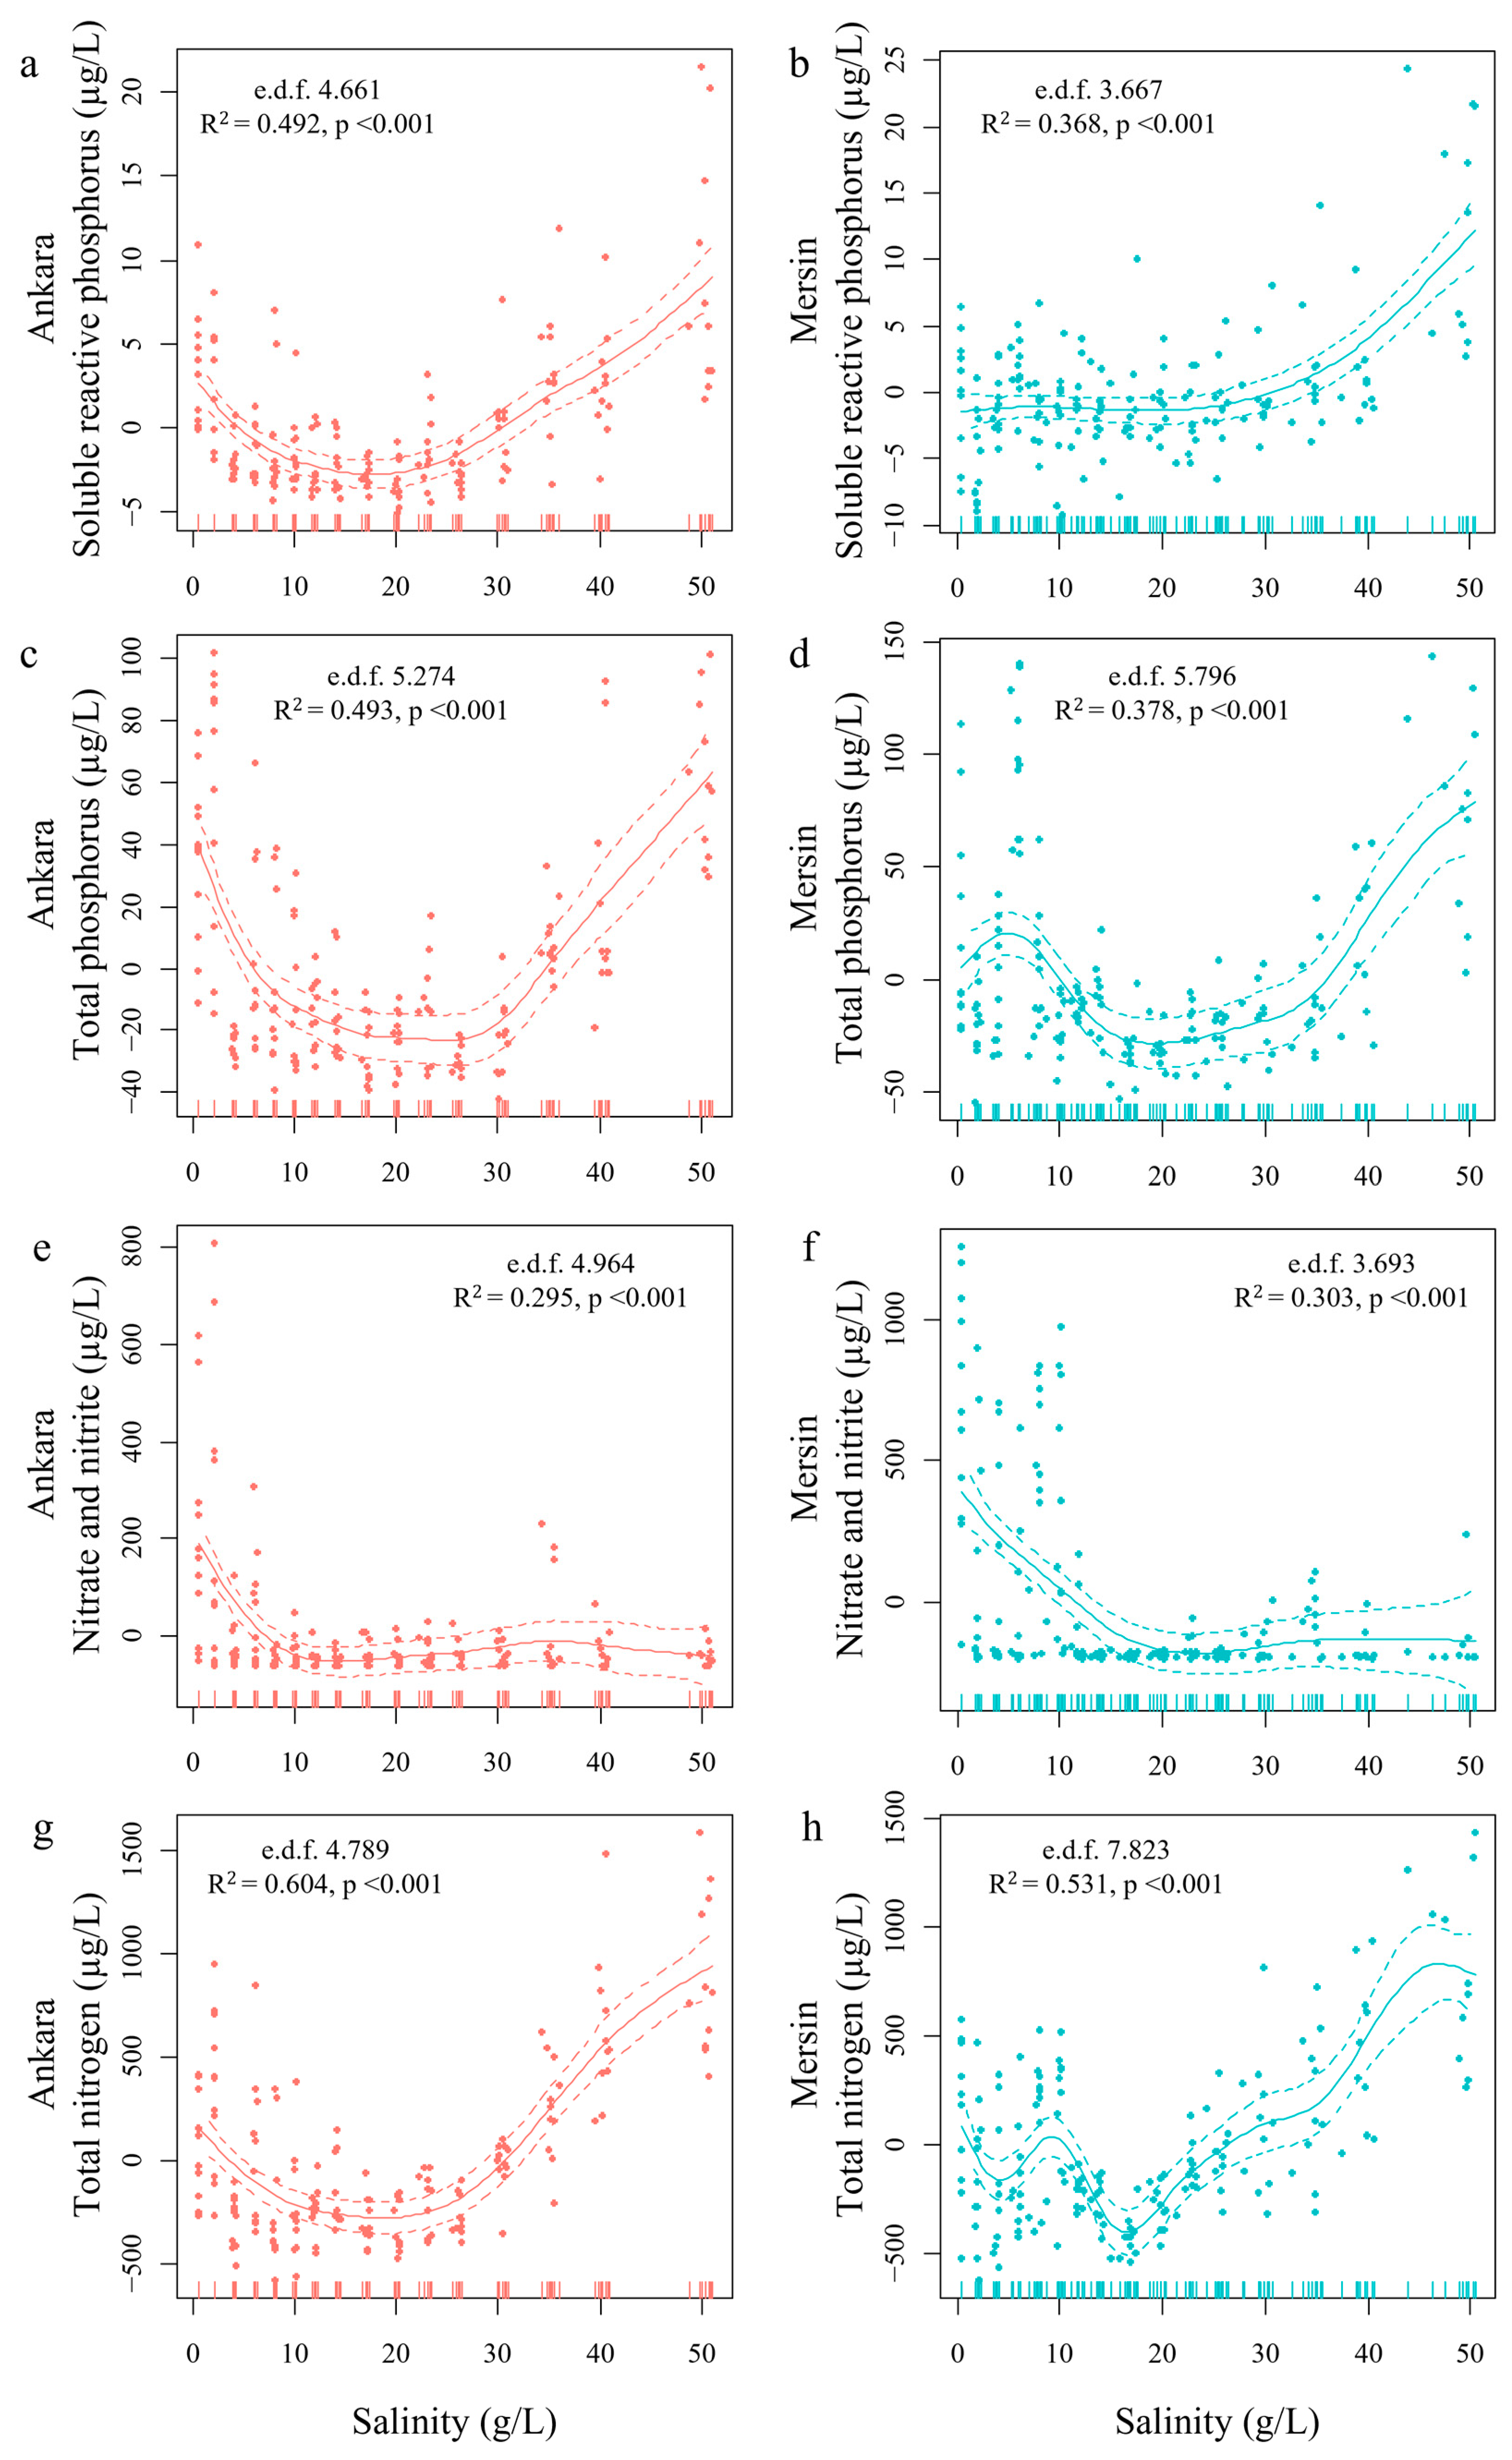
All water transparency and nutrient concentration variables showed a significant non-linear relationship with the salinity gradient during the stable phase (generalized additive models with p < 0.001; Figure 3 and Figure 4). There were similar patterns for most of the measured parameters between the Mersin and Ankara mesocosms, except for SS and SRP.
The mesocosms in both Ankara and Mersin had high water clarity in the mid-salinity range coupled with high turbidity in the low- and high-salinity ranges (Figure 3). However, the threshold salinities were different between the sites and the mesocosms in Mersin tended to be more turbid. Ankara mesocosms were clear from 4 to 40 g/L salinity (except 6 g/L), and water transparency reached the bottom on most sampling days. However, the water was turbid in most of the mesocosms with low salinity concentrations (0, 2, and 6 g/L salts) and 50 g/L concentration (Figure 3a). In Mersin, the mesocosms with low salinity concentrations (0–8 g/L) were turbid, whereas the mesocosms with intermediate salinity were clear (10–23 g/L), and the high salinity mesocosms were again turbid (26–50 g/L, except for 35 g/L) (Figure 3b). Lower chl-a concentrations were observed in Ankara from salinities of 0 to 26 g/L, which increased almost linearly from 30 g/L of salts (Figure 3c). In Mersin, chl-a concentrations showed some fluctuations along the gradient from 0 to 35 g/L and increased abruptly from 40 g/L (Figure 3d). In general, Mersin mesocosms had higher chl-a concentrations than those in Ankara. The SS concentrations remained low in Ankara at low and intermediate salinities (0–17 g/L), increasing almost linearly after this threshold (Figure 3e). In Mersin, however, SS concentrations were generally higher than in Ankara, decreased linearly from 0 to 17 g/L, and increased again after this salinity (Figure 3f).
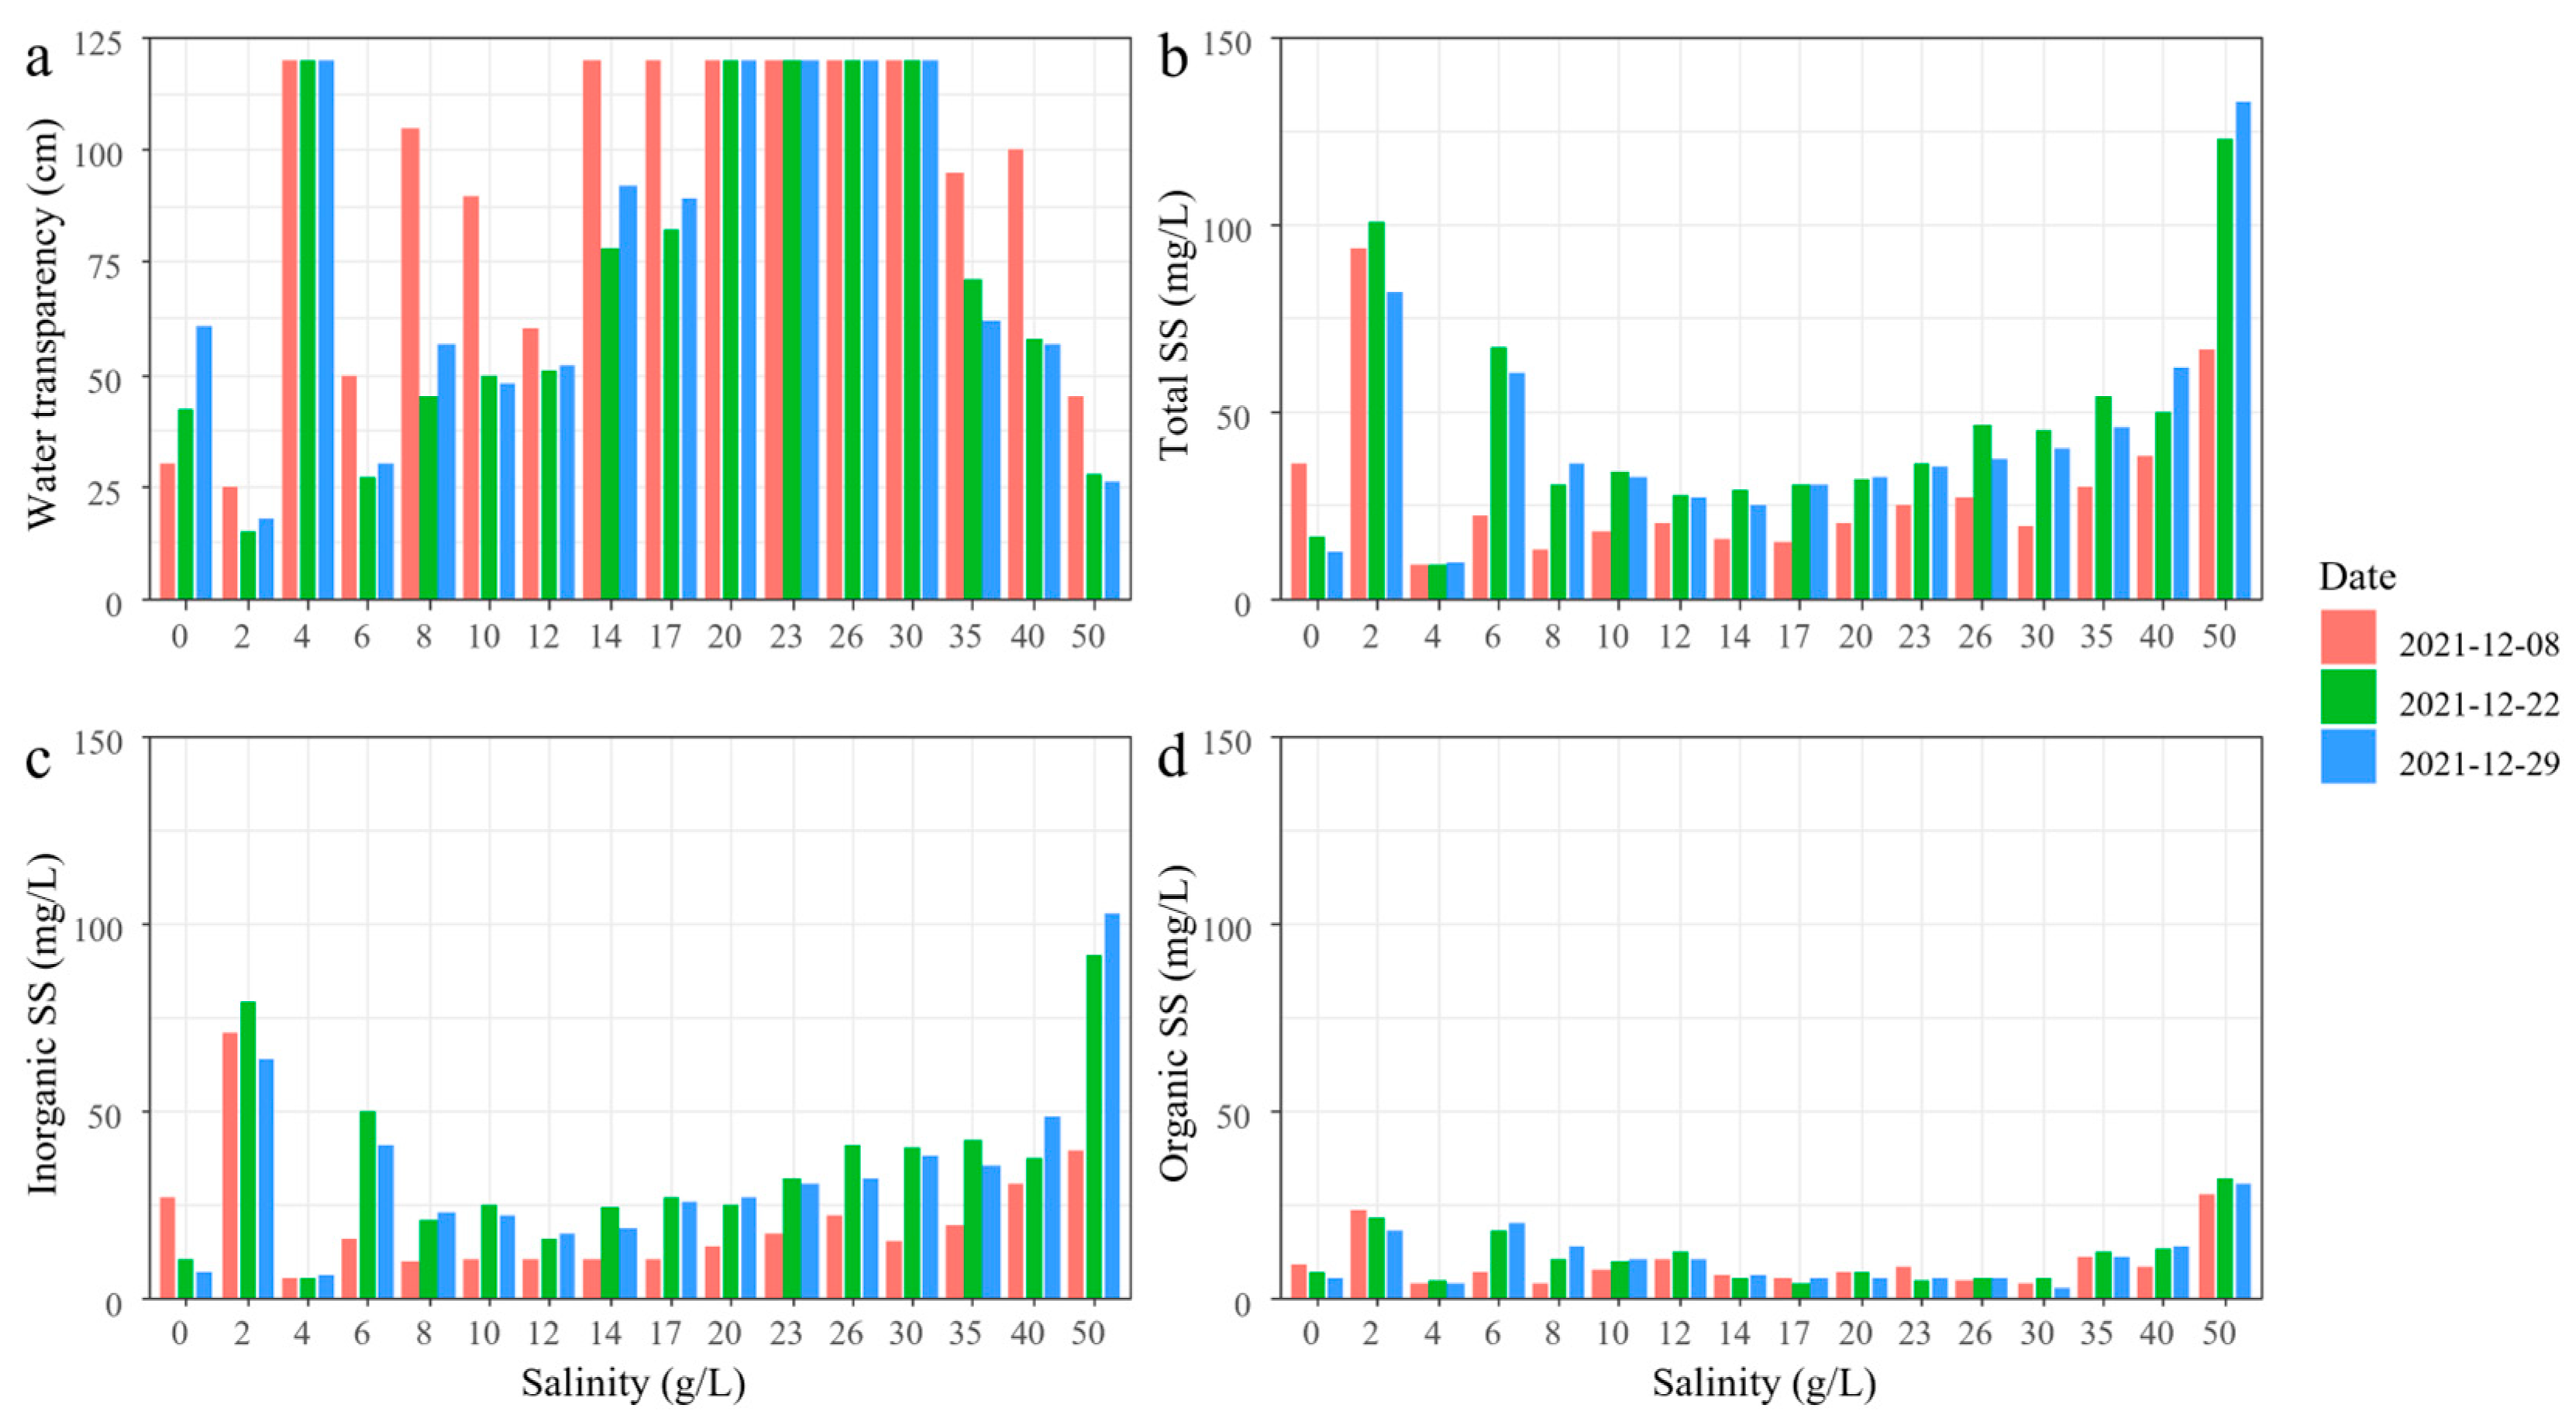
The turbidity at lower salinities was likely due to fish activity (see below), while at higher salinities, it was likely due to both high phytoplankton growth and inorganic turbidity triggered by high salinities (Figure 5). The physicochemical effect of high salinities on the flocculation dynamics of suspended particulate matter in the water column has been widely observed in brackish waters [41]. Fine-grained suspended particulate matter may aggregate to form larger and porous flocs in such waters as a result of biogeochemical conditions such as organic/inorganic content, ionic strength, and extracellular polymeric substances [42].
After some weeks, the low salinity mesocosms started to show high turbidity (Figure 5a) with a high inorganic fraction (>50%; Figure 5b,c). To elucidate the causes of this turbidity, we removed the fish for three weeks in the mesocosm with a salinity of 0 g/L. After that, total SS and the inorganic fraction decreased in that mesocosm, while the other mesocosms with fish (salinities 2–14 g/L) showed an increasing pattern over time. The organic SS remained constant in all treatments with lower salinities (Figure 5d). This clearly suggests that fish caused the resuspension of inorganic matter from the sediment, which has been widely observed in shallow lake ecosystems [43]. These changes were also reflected in the water transparency, which correlated negatively with SS (Figure 5a).
Even though we added the same amount of N and P to all mesocosms every week, the treatments showed different nutrient concentrations relative to the salinity treatments (Figure 4). In general, higher concentrations of P and N were observed in Mersin than in Ankara. The target phosphorus concentration was achieved in the second week of the experiment (16 September) after the initial additions of nutrients. After that, TP and TN concentrations showed a U-shaped response to the salinity gradient in both experimental facilities, with high concentrations in the freshwater and low salinity mesocosms (0–12 g/L of salts), decreasing concentrations in the intermediate salinity mesocosms, followed by another increase in the high salinity mesocosms (35–50 g/L salts). In both places, TP showed similar concentrations at both extremes of the salinity gradient, while TN presented higher concentrations at high salinities (Figure 4c,d,g,h). This is in line with previous studies, which have shown that salinization enhances nitrogen retention in semi-arid lakes [44]. The SRP concentrations were lower in the Ankara facility than in the Mersin facility. In Ankara, there was a U-shaped relationship in SRP concentrations with a decreasing pattern from 0 to 14 g/L followed by an increase after 20 g/L, while in Mersin SRP concentrations remained stable at low and intermediate salt concentrations followed by an increase after 30 g/L of salts (Figure 5a,b). The concentrations of NO3 + NO2 decreased markedly after the first phase of the experiment at both sites, with higher concentrations at salinities 0–6 and 0–10 g/L in Ankara and Mersin, respectively. After those thresholds, NO3 + NO2 concentrations markedly decreased along the salinity gradient (Figure 4e,f). This large reduction in NO3 + NO2 concentrations due to salinization may reflect the stimulatory effects of sulfide (as we added SO4 in a ratio of 2.69 g/L to 35 g/L of salinity) on dissimilatory nitrate reduction to ammonium, which can reduce NO3 levels but keep TN high [45].
During the desalinization phase of the experiment, the macrophytes showed different developments in the mesocosms in Ankara depending on light conditions and salinity. The turbid, less saline mesocosm (2 g/L), together with the high-salinity mesocosms (23–50 g/L), had a lower or zero macrophyte PVI% than the low and medium turbidity mesocosms (salinities 0 and 4–20 g/L). A similar pattern was observed in Mersin, however, with no or low macrophyte growth at some less saline mesocosms (0 and 6 g/L), where turbidity was high, and high salinity treatments (30–50 g/L). Salinity affected macrophyte PVI%, as almost no plant grew at 30–50 g/L salinity, even during desalinization, although some macrophytes remained alive for the duration of the experiment (Figure 6). During the stable phase, no fish survived at salinities between 17 and 50 g/L.

3.2. Experiment 2

The second synchronized mesocosm experiment tested the impact of a heatwave crossed with relatively low (4 g/L) and high salinities (40 g/L) in both mesocosm facilities. There was a gradual decrease in water temperatures (13.7 °C in Ankara and 10.1 °C in Mersin) over the two-month duration of the experiment reflecting the seasonal climatic pattern (Figure 7). An extra natural heatwave of c. 2.3 °C in Ankara and 2.9 °C in Mersin occurred during the induced heatwave period. After the initial three weeks of pre-heatwave, the temperature simulation successfully induced a 6 °C heatwave for two weeks in the respective treatments, followed by three weeks of post-heatwave period at ambient temperatures (Figure 7).
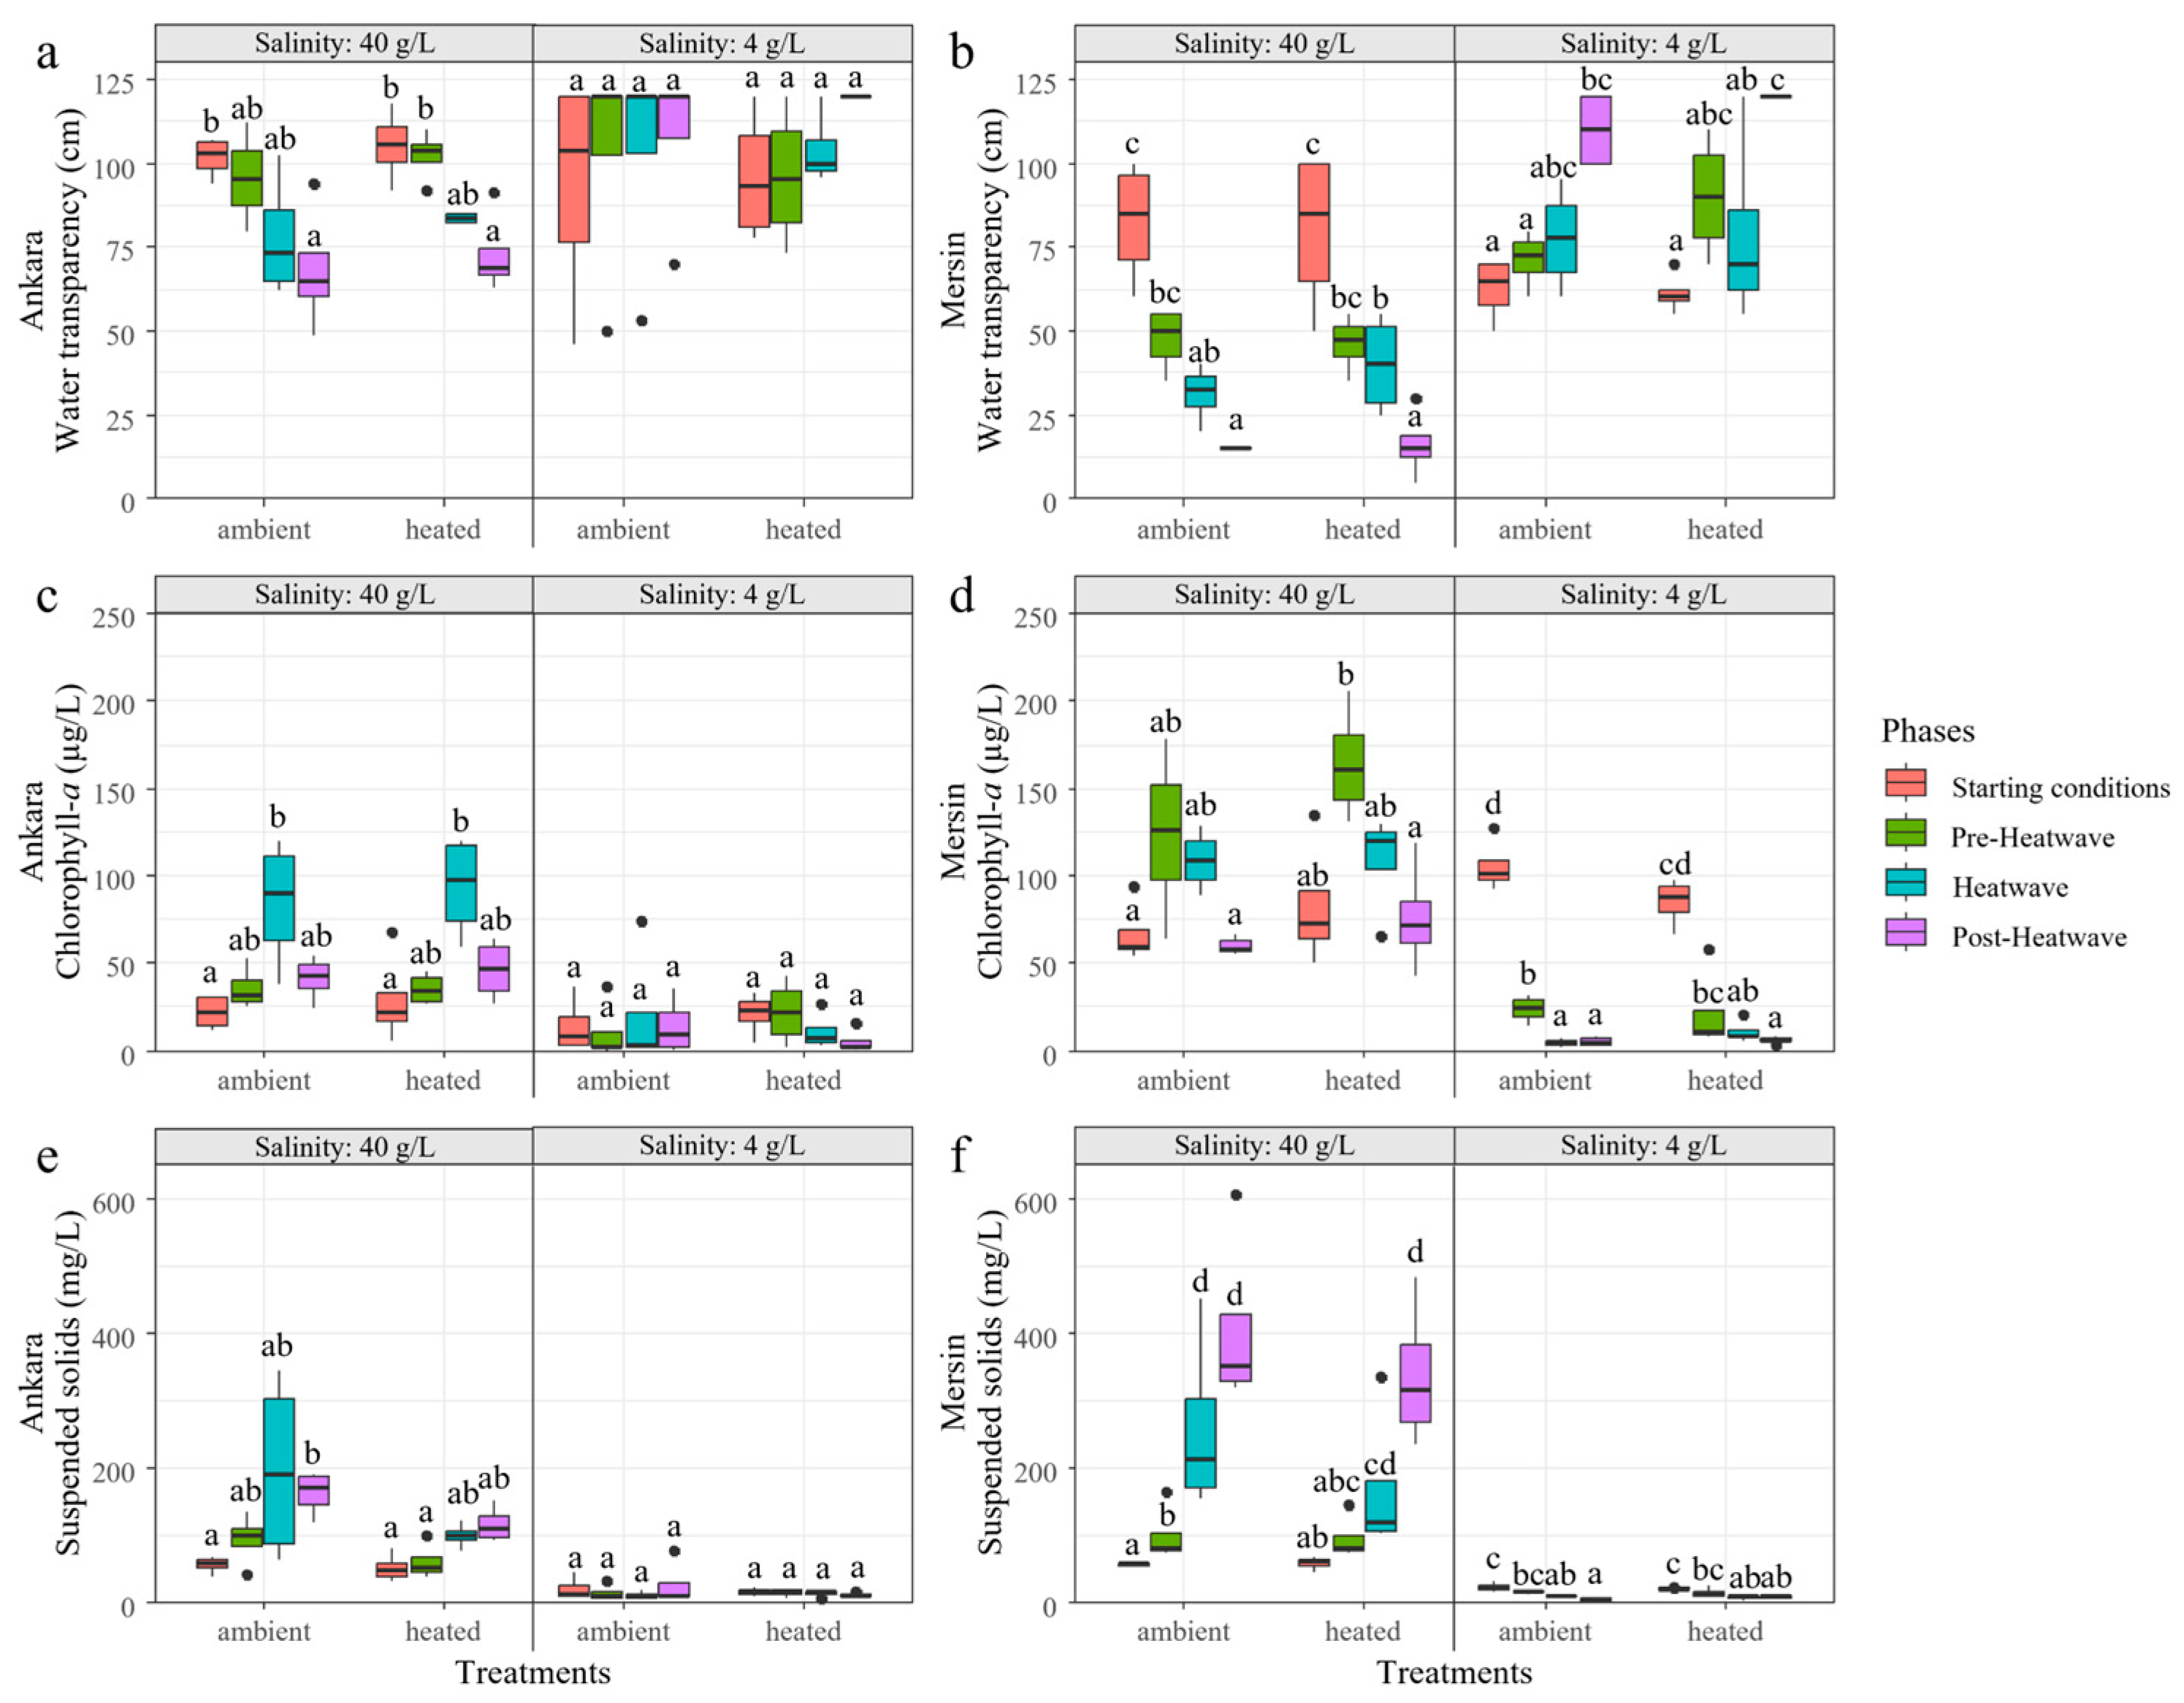
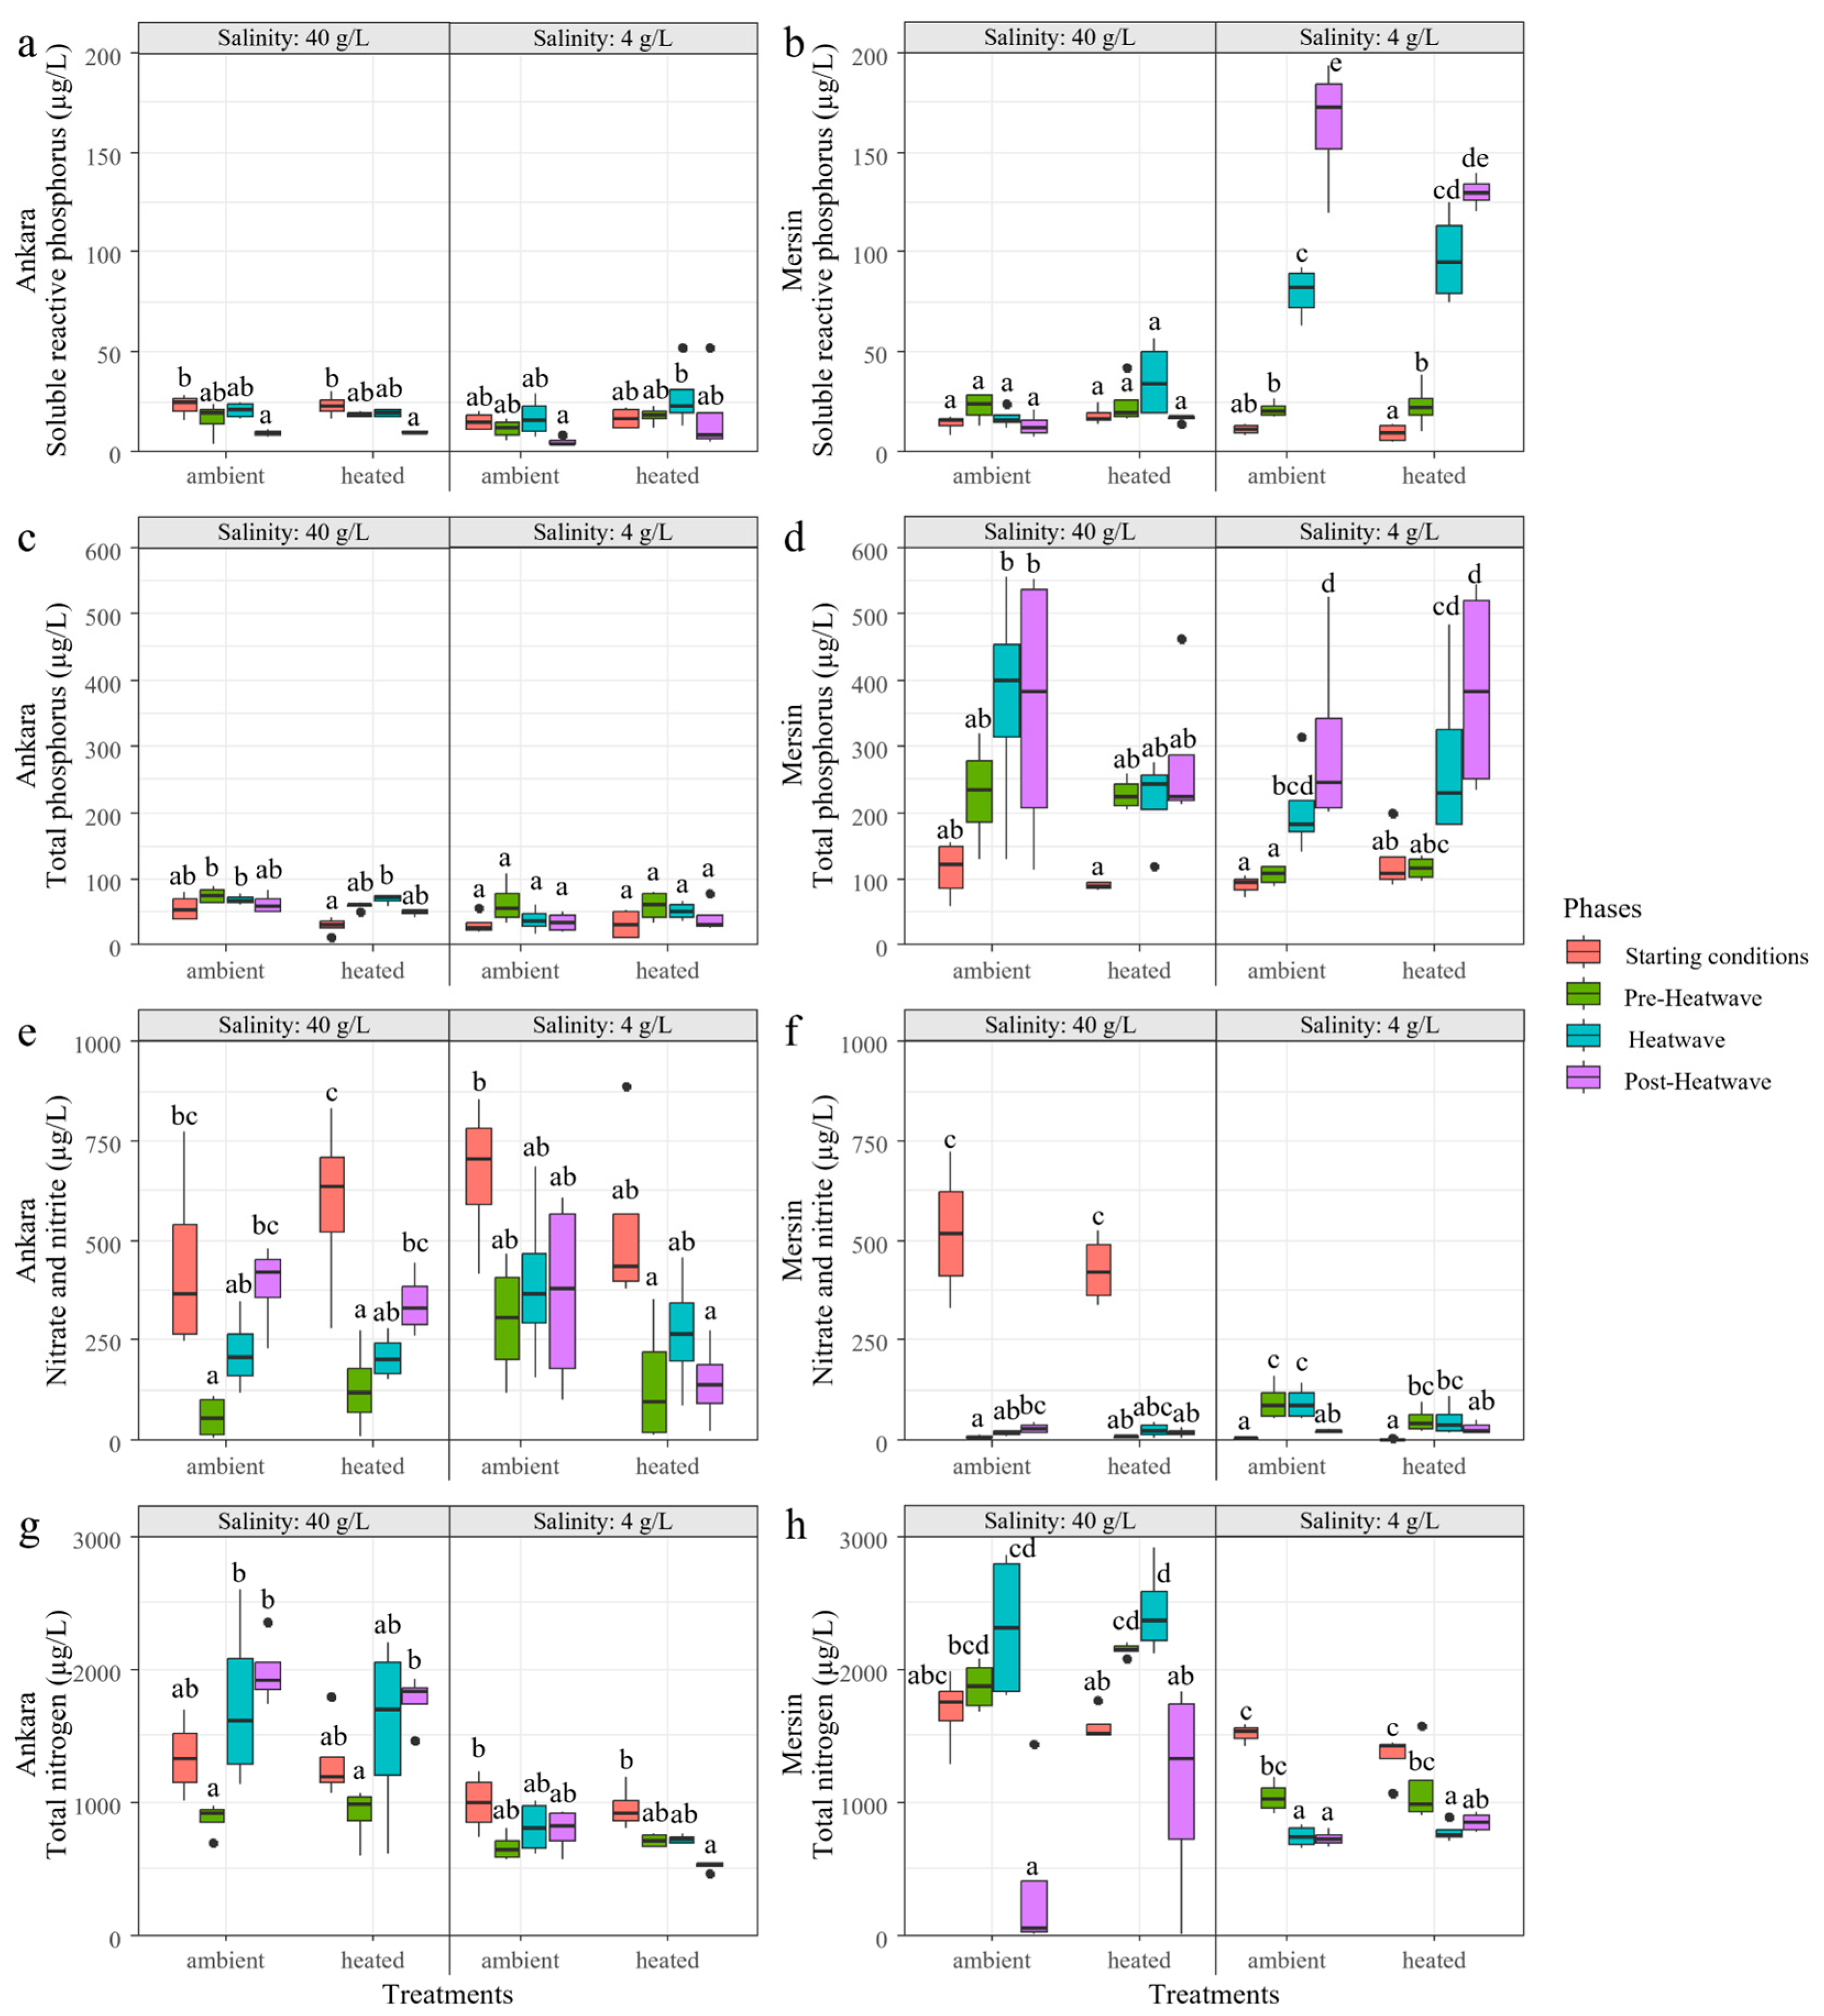
There were pronounced differences in water transparency, chl-a, SS, SRP, TP, NO3 + NO2, and TN between the colder Ankara and the warmer Mersin site, both between the salinities of 4 and 40 g/L (except for NO3 + NO2), as well as in the phases of the experiment. However, the response to the heating treatment was less clear (with significant differences only for SS and NO3 + NO2). Several significant interactions between the factors of place, salinity treatment, heating treatment, and phases were registered for different variables (Table S1). Overall, mesocosms in Mersin, or at salinity 40 g/L in both places, were more turbid with higher concentrations of chl-a, SS, TP, and TN. Higher SRP values were observed in Mersin or at a salinity of 4 g/L, while NO3 + NO2 was higher in Ankara or at a salinity of 40 g/L (Figure 8 and Figure 9, Table S1).
For the variables related to turbidity in Ankara, water transparency, chl-a, and SS did not differ among phases or heating treatments for the mesocosms with a salinity of 4 g/L. At a salinity of 40 g/L, the heating treatment delayed the effects of seasonality on SS, which did not differ between the phases, while in ambient temperature mesocosms, the post-heatwave showed higher SS concentrations than at the start of the experiment. Similar patterns between the heating and ambient temperature treatment were observed for water transparency and chl-a, which were caused by seasonality (Figure 8a,c,e).
In Mersin, at a salinity of 4 g/L, SS and chl-a concentrations during the heatwave and post-heatwave periods (and water transparency only during the post-heatwave) differed from the starting conditions in both heating and ambient temperature treatments, showing similar seasonal patterns. At a salinity of 40 g/L, water transparency showed a similar pattern between the phases for both heating and ambient temperature treatments. Chl-a at 40 g/L did not differ between the phases in the ambient temperature treatment, while the heating treatment had lower chl-a during the post-heatwave period than the pre-heatwave period. For SS at 40 g/L, there was again a delay in the seasonal response due to the heating treatment, i.e., no differences between the heatwave and pre-heatwave periods in heating treatment, while there was a significant increase during the heatwave period for the ambient temperature treatment (Figure 8b,d,f).
Regarding nutrient concentrations in Ankara mesocosms, SRP, TP, and NO3 + NO2 did not differ among phases or heating treatments in the 4 g/L salinity treatment. There was a significant effect of the heating treatment on TN concentrations at 4 g/L salinity, with differences between the post-heatwave and starting conditions, while no differences were observed in the ambient temperature treatment. At 40 g/L, the differences for SRP and NO3 + NO2 were due to seasonality as the differences were parallel in ambient temperature and heating treatments. Heating treatment affected TP during the heatwave, which differed from the starting conditions, while no differences were observed in the ambient temperature treatment. In ambient temperature treatment, both heatwave and post-heatwave periods had higher TN than the pre-heatwave, while in heating treatment this difference was delayed to the post-heatwave period (Figure 9a,c,e,g).
In Mersin, differences in NO3 + NO2 at 4 g/L were due to seasonality. However, SRP did not increase after the heatwave in the heating treatment to the extent as it did in the ambient temperature treatment. The same happened for TP, where the heatwave period did not increase compared to the pre-heatwave in heating treatment, contrasting with what was observed at ambient temperature treatment. The heatwave decreased TN, but it became similar to the pre-heatwave again after the heatwave in the heating treatment, while it remained lower at ambient temperature treatment. At 40 g/L in Mersin, SRP, and TP concentrations did not differ among phases or heating treatments. On the other hand, the heatwave period had a higher TN than the starting conditions for heating treatment, while these periods did not differ at ambient temperatures. NO3 + NO2 concentrations in the post-heatwave remained similar to the pre-heatwave in heated mesocosms, while they increased at ambient temperature treatment (Figure 9b,d,f,h).
Regarding macrophyte PVI, no macrophytes were observed in the 40 g/L mesocosms at the Mersin facility, and almost no macrophytes at the Ankara facility. Rigorous macrophytes development occurred in both the colder Ankara and the warmer Mersin in the 4 g/L salinity treatment, especially at the latter facility (100%), without any significant differences between the mesocosms with ambient temperature and heatwave treatments (Figure 10). All the stocked fish survived until the end of the experiment at 4 g/L salinity. However, the added Artemia sp. did not survive after the inoculations, even at 40 g/L, probably due to the contrasting environmental conditions between the natural field sites, where the inoculum was collected, and the mesocosms.

4. Conclusions and Recommendations

Both the salinity gradient and the factorial heatwave-salinity experiments demonstrated a strong role of salinity in ecosystem structure and functioning, which was further affected by the natural climate differences between the two facilities. The salinity gradient experiment revealed a strong response in productivity (i.e., chl-a) and water transparency modulated by the temperature. The effect of climate was very pronounced between the semi-dry central Anatolia and Mediterranean climates. However, no significant effect of the two-week heatwave in the second experiment was observed for either water transparency or nutrient concentrations. The results highlight the need for further experimental research into the combined effect of salinization and climate change (e.g., temperature) on aquatic ecosystems, especially in arid landscapes.
Conducting mesocosm experiments in saline and hypersaline environments presents challenges regarding logistics, ecosystem simulation, monitoring, control systems, and sampling. Here, we summarize the limitations and challenges that we encountered and provide the best practice recommendations for future research.
(1)
High salinities cause a corrosive working environment, which is further exacerbated by UV radiation in exposed mesocosms. Therefore, the design of the mesocosms, sensors, and all other design elements should be resistant to corrosion. HDPE tanks are readily available as they are also used in the food industry and are a good choice due to their resistance to salinity and UV. However, they have less structural durability and can easily be damaged by physical forces. Therefore, enforced ground (concrete or compacted sand if the groundwater table is high), as well as thick support material for walls, should be employed. Another advantage of HDPE tanks is that they can be repaired using heat in case of minor damage. The sensors should also be resistant to high corrosion environments, requiring the use of, for instance, plastic or titanium-coated materials. If stainless steel is desired, the type of steel used must be able to resist salinities higher than marine levels. The corrosion risk is especially concerning for heating elements. Conventional stainless steel or Teflon-coated heaters could easily fail as an electric field in saline waters entails fast corrosion of metal parts. Conventional aquarium heaters are resistant to saline waters, but they have limited capacity and require a large amount of heater use, and high-capacity aquarium heaters generally work with a circulation pump, which is not desired for natural experiments. We, therefore, recommend the application of specially designed high-capacity industrial heating elements enclosed in heat-resistant glass tubes.
(2)
High-salinity water has high conductivity for electricity, which poses challenges for elevated electrification hazards, especially if heating is involved. Frequent safety training as well as safety switches are recommended. Due to the high salinity and consequent high conductivity, there is also an increased risk of sensor interference. The sensors should be well grounded, and sensors with circuit-verified electricity shield components should be selected. A trial before a bulk purchase is recommended.
(3)
The majority of the sensors available on the market are focused on freshwater and marine research (salinity < 38 g/L). Therefore, the overall design and calibration algorithms are generally not optimized for very high salinities (>40 g/L). Consequently, it should be verified with the suppliers if the sensors are calibrated for high salinities and if the potential interferences with major ions are not a problem. It can also be checked with the suppliers to see if it is possible to add extra calibration parameters to the sensor algorithms.
(4)
High salinities create a challenge for chemistry analyses. The majority of the chemical analyses can only be conducted within specific salinity ranges, and some of the reactions are prone to interference at a high concentration of major ions, so the analysis matrix should correspond to the salinity range of the samples. Considering that the majority of traditional laboratory facilities optimize their workflow and know-how with a focus on either freshwater or marine ecosystems, the laboratory procedures should be thoroughly verified by the scientific and technical teams before designing and implementing a mesocosm experiment. Experimental salinity treatments may result in a large salinity gradient in the sample pool, which requires different salinity matrixes in the eluent as well as potentially different analysis methods. Dilution of samples, as long as the desired parameter has sufficiently high concentrations, could be applied. Therefore, grouping samples according to salinity concentrations and conducting the analyses according to salinity levels in these groups would be the best practice. Laboratories conducting experimental research on salinity gradients should be ready to work with different sample matrixes and analysis methods.
(5)
Experimental set-ups across large salinity gradients pose complications for biota inoculation. Even with a high salinity tolerance range, organisms require a longer adaptation time before being released into environments with different salinities. Therefore, higher logistics demand and longer handling times should be expected for successful inoculations. Several large and well-equipped inoculation adaptation mesocosms at targeted salinity levels could be useful for the experimental mesocosms. Furthermore, high mortality rates (of fish, for example) should be expected, and thus successive inoculations with larger inoculum populations should be anticipated.
Overall, a mesocosm experiment covering a large salinity gradient poses logistics constraints and implementation challenges beyond the traditional research realms of freshwater and marine ecosystems. Therefore, forming interdisciplinary research teams, facilitating know-how exchange, as well as careful evaluation of logistic needs, and analysis methods are needed for undertaking successful mesocosm experiments. According to the H2020-funded AQUACOSM and AQUACOSM-plus projects’ networks (www.aquacosm.eu, accessed on 1 May 2023), which is the largest aquatic mesocosms network in Europe, there are currently 58 mesocosm facilities located across Europe. Our newly established two facilities in central and south Anatolia add to the growing network of mesocosm facilities in Europe as well as expand the climate gradient and contribute to the advancement of experimental ecology research in the region.

Supplementary Materials

The following supporting information can be downloaded at: https://www.mdpi.com/article/10.3390/w15142611/s1, Figure S1: Effects of salinity on the method performance for soluble reactive phosphorus (SRP) (ac), total phosphorus (TP) (d,e), nitrite (NO2), nitrate (NO3), and total nitrogen (TN) (f) quantifications. The standards and samples were prepared with different phosphorus, nitrogen, and salinity concentrations and calibrated with different salinity matrixes (0, 10, and/or 50 g/L). Table S1: Results of four-way ART-ANOVA comparing water transparency, chlorophyll-a, total suspended solids, soluble reactive phosphorus, total phosphorus, nitrate and nitrite, and total nitrogen based on the factors Place, Salinity, Heating, Phases, and their possible interactions during the heatwave experiment. Bold values represent significant effects (p < 0.05).

Author Contributions

Conceptualization: E.J., K.Ö. and M.B.; methodology: K.Ö., C.A.A., M.K. (Mustafa Korkmaz), G.Y., C.Ö., M.B. and E.J.; controlling system and software: H.N., İ.H.T. and K.Ö.; samplings and analysis: C.A.A., G.Y., M.K. (Meltem Koru), Y.C., V.A., G.C.Y., O.A., Ö.T., S.E., İ.G.A., B.K. and L.C.-L.; investigation: K.Ö., C.A.A., M.K. (Mustafa Korkmaz), G.Y., M.A.Ç., Z.A., M.B. and E.J.; data curation: K.Ö., C.A.A., G.Y., M.K. (Meltem Koru), V.A., İ.G.A. and G.C.Y.; writing—original draft preparation: K.Ö., C.A.A., G.Y., E.J.; writing—review and editing: K.Ö., C.A.A., M.K. (Mustafa Korkmaz), G.Y., M.K. (Meltem Koru), Y.C., J.P.P., G.C.Y., O.A., B.K., Z.A., C.Ö., M.B. and E.J.; visualization: C.A.A., K.Ö., G.Y., M.K. (Mustafa Korkmaz), M.K. (Meltem Koru), and M.A.Ç.; supervision: K.Ö., M.K. (Mustafa Korkmaz), C.Ö., M.B., and E.J.; project administration: K.Ö., M.K. (Mustafa Korkmaz), Z.A., M.B. and E.J.; funding acquisition: E.J., K.Ö., Z.A. and M.B. All authors have read and agreed to the published version of the manuscript.

Funding

The mesocosm systems were initially established by the TÜBİTAK 118C250 project and further developed in the projects EU-H2020: AQUACOSM-plus (project no:871081), TÜBİTAK 121C273, and ADEP-108-2022-11195. The experiments were funded by the projects TÜBİTAK 118C250, EU-H2020: AQUACOSM-plus (project no: 871081), and TÜBİTAK 121C273. EJ, MK, CAA, GY, and GCY were funded by TÜBİTAK 118C250. EJ, MB, CAA, VA, and LC were funded by EU-2020: AQUACOSM-plus (project no:871081). CAA received support in part from the Coordenação de Aperfeiçoamento de Pessoal de Nível Superior—Brazil (CAPES)—Finance Code 001. MB was also funded by EU-H2020: Ponderful (project no:869296).

Data Availability Statement

The data are available from the authors upon reasonable request.

Acknowledgments

We are grateful to the efforts of Hasan Arslan, Bedirhan Işık, Nergis Yasav, Osman Berk Bile, Alican Erişti, Kardelen Anık, Aleyna Ekmekçi, Burak Kulaksız, Hasret Şerife Maslakçı, Mehmet Emin Polat, Kemal Yılmaz, Turan Uca, Zafer Şimşek, Savaş Varlık, Mehmet Nuri Evren, Bahri Dinç, Hasan Akdeniz, Nur Filiz and Gülce Yalçın during the construction of the facilities as well as the implementation of the experiments. We are grateful to Anne Mette Poulsen for linguistic improvements to the manuscript. We are also grateful to Şehmuz Başduvar and Emir Ahmet Kutluca for helping with chemical analyses at METU-IMS.

Conflicts of Interest

The authors declare no conflict of interest. The funders played no role in the design of the study; in the collection, analyses, or interpretation of data; in the writing of the manuscript; or in the decision to publish the results.

References

  1. Jeppesen, E.; Beklioğlu, M.; Özkan, K.; Akyürek, Z. Salinization Increase Due to Climate Change Will Have Substantial Negative Effects on Inland Waters: A Call for Multifaceted Research at the Local and Global Scale. Innovation 2020, 1, 10030. [Google Scholar] [CrossRef] [PubMed]
  2. Yılmaz, G.; Çolak, M.A.; Özgencil, İ.K.; Metin, M.; Korkmaz, M.; Ertuğrul, S.; Soyluer, M.; Bucak, T.; Tavşanoğlu, Ü.N.; Özkan, K.; et al. Decadal Changes in Size, Salinity, Waterbirds, and Fish in Lakes of the Konya Closed Basin, Turkey, Associated with Climate Change and Increasing Water Abstraction for Agriculture. Inland Waters 2021, 11, 538–555. [Google Scholar] [CrossRef]
  3. Çolak, M.A.; Öztaş, B.; Özgencil, İ.K.; Soyluer, M.; Korkmaz, M.; Ramírez-García, A.; Metin, M.; Yılmaz, G.; Ertuğrul, S.; Tavşanoğlu, Ü.N.; et al. Increased Water Abstraction and Climate Change Have Substantial Effect on Morphometry, Salinity, and Biotic Communities in Lakes: Examples from the Semi-Arid Burdur Basin (Turkey). Water 2022, 14, 1241. [Google Scholar] [CrossRef]
  4. Şekercioğlu, Ç.H.; Anderson, S.; Akçay, E.; Bilgin, R.; Can, Ö.E.; Semiz, G.; Tavşanoğlu, Ç.; Yokeş, M.B.; Soyumert, A.; İpekdal, K.; et al. Turkey’s Globally Important Biodiversity in Crisis. Biol. Conserv. 2011, 144, 2752–2769. [Google Scholar] [CrossRef]
  5. Cunillera-Montcusí, D.; Beklioğlu, M.; Cañedo-Argüelles, M.; Jeppesen, E.; Ptacnik, R.; Amorim, C.A.; Arnott, S.E.; Berger, S.A.; Brucet, S.; Dugan, H.A.; et al. Freshwater Salinisation: A Research Agenda for a Saltier World. Trends Ecol. Evol. 2022, 37, 440–453. [Google Scholar] [CrossRef]
  6. Stewart, R.I.A.; Dossena, M.; Bohan, D.A.; Jeppesen, E.; Kordas, R.L.; Ledger, M.E.; Meerhoff, M.; Moss, B.; Mulder, C.; Shurin, J.B.; et al. Mesocosm Experiments as a Tool for Ecological Climate-Change Research. Adv. Ecol. Res. 2013, 48, 71–181. [Google Scholar]
  7. Lampert, W.; Sommer, U. Limnoecology: The Ecology of Lakes and Streams, 2nd ed.; Oxford University Press: Oxford, UK, 2007. [Google Scholar]
  8. Benton, T.G.; Solan, M.; Travis, J.M.J.; Sait, S.M. Microcosm Experiments Can Inform Global Ecological Problems. Trends Ecol. Evol. 2007, 22, 516–521. [Google Scholar] [CrossRef]
  9. Fordham, D.A. Mesocosms Reveal Ecological Surprises from Climate Change. PLoS Biol. 2015, 13, e1002323. [Google Scholar] [CrossRef] [Green Version]
  10. Odum, E.P. The Mesocosm. Bioscience 1984, 34, 558–562. [Google Scholar] [CrossRef]
  11. Landkildehus, F.; Søndergaard, M.; Beklioglu, M.; Adrian, R.; Angeler, D.G.; Hejzlar, J.; Papastergiadou, E.; Zingel, P.; Çakiroğlu, A.I.; Scharfenberger, U.; et al. Climate Change Effects on Shallow Lakes: Design and Preliminary Results of a Cross-European Climate Gradient Mesocosm Experiment. Est. J. Ecol. 2014, 63, 71. [Google Scholar] [CrossRef] [Green Version]
  12. Liboriussen, L.; Landkildehus, F.; Meerhoff, M.; Bramm, M.E.; Søndergaard, M.; Christoffersen, K.; Richardson, K.; Søndergaard, M.; Lauridsen, T.L.; Jeppesen, E. Global Warming: Design of a Flow-through Shallow Lake Mesocosm Climate Experiment. Limnol. Oceanogr. Methods 2005, 3, 1–9. [Google Scholar] [CrossRef]
  13. Stephen, D.; Balayla, D.M.; Becares, E.; Collings, S.E.; Fernandez-Alaez, C.; Fernandez-Alaez, M.; Ferriol, C.; Garcia, P.; Goma, J.; Gyllstrom, M.; et al. Continental-Scale Patterns of Nutrient and Fish Effects on Shallow Lakes: Introduction to a Pan-European Mesocosm Experiment. Freshw. Biol. 2004, 49, 1517–1524. [Google Scholar] [CrossRef] [Green Version]
  14. Donaghay, P.; Klos, E. Physical, Chemical and Biological Responses to Simulated Wind and Tidal Mixing in Experimental Marine Ecosystems. Mar. Ecol. Prog. Ser. 1985, 26, 35–45. [Google Scholar] [CrossRef]
  15. Brockmann, U. Pelagic Mesocosms: II. Process Studies. Enclosed Exp. Mar. Ecosyst. A Rev. Recomm. 1990, 37, 81–108. [Google Scholar]
  16. Nejstgaard, J.; Hygum, B.; Naustvoll, L.; Båmstedt, U. Zooplankton Growth, Diet and Reproductive Success Compared in Simultaneous Diatom- and Flagellate-Microzooplankton-Dominated Plankton Blooms. Mar. Ecol. Prog. Ser. 2001, 221, 77–91. [Google Scholar] [CrossRef]
  17. Riebesell, U.; Czerny, J.; von Bröckel, K.; Boxhammer, T.; Büdenbender, J.; Deckelnick, M.; Fischer, M.; Hoffmann, D.; Krug, S.A.; Lentz, U.; et al. Technical Note: A Mobile Sea-Going Mesocosm System—New Opportunities for Ocean Change Research. Biogeosciences 2013, 10, 1835–1847. [Google Scholar] [CrossRef] [Green Version]
  18. Jeppesen, E.; Søndergaard, M.; Jensen, J.P.; Kanstrup, E.; Petersen, B. Macrophytes and Turbidity in Brackish Lakes with Special Emphasis on the Role of Top-Down Control. In The Structuring Role of Submerged Macrophytes in Lakes; Springer: New York, NY, USA, 1998; pp. 369–377. [Google Scholar]
  19. Christensen, I.; Pedersen, L.K.; Søndergaard, M.; Lauridsen, T.L.; Tserenpil, S.; Richardson, K.; Amorim, C.A.; Pacheco, J.P.; Jeppesen, E. Impact of Zooplankton Grazing on Phytoplankton in North Temperate Coastal Lakes: Changes along Gradients in Salinity and Nutrients. Hydrobiologia 2022, 27, 1–18. [Google Scholar] [CrossRef]
  20. Hintz, W.D.; Mattes, B.M.; Schuler, M.S.; Jones, D.K.; Stoler, A.B.; Lind, L.; Relyea, R.A. Salinization Triggers a Trophic Cascade in Experimental Freshwater Communities with Varying Food-Chain Length. Ecol. Appl. 2017, 27, 833–844. [Google Scholar] [CrossRef]
  21. Moffett, E.R.; Baker, H.K.; Bonadonna, C.C.; Shurin, J.B.; Symons, C.C. Cascading Effects of Freshwater Salinization on Plankton Communities in the Sierra Nevada. Limnol. Oceanogr. Lett. 2023, 8, 30–37. [Google Scholar] [CrossRef]
  22. Hintz, W.D.; Arnott, S.E.; Symons, C.C.; Greco, D.A.; McClymont, A.; Brentrup, J.A.; Cañedo-Argüelles, M.; Derry, A.M.; Downing, A.L.; Gray, D.K.; et al. Current Water Quality Guidelines across North America and Europe Do Not Protect Lakes from Salinization. Proc. Natl. Acad. Sci. USA 2022, 119, e2115033119. [Google Scholar] [CrossRef]
  23. Hébert, M.; Symons, C.C.; Cañedo-Argüelles, M.; Arnott, S.E.; Derry, A.M.; Fugère, V.; Hintz, W.D.; Melles, S.J.; Astorg, L.; Baker, H.K.; et al. Lake Salinization Drives Consistent Losses of Zooplankton Abundance and Diversity across Coordinated Mesocosm Experiments. Limnol. Oceanogr. Lett. 2023, 8, 19–29. [Google Scholar] [CrossRef]
  24. Reas, C.; Fry, B. Processing: Programming for the Media Arts. AI Soc. 2006, 20, 526–538. [Google Scholar] [CrossRef]
  25. Carlson, R.E. A Trophic State Index for Lakes1. Limnol. Oceanogr. 1977, 22, 361–369. [Google Scholar] [CrossRef] [Green Version]
  26. Kratzer, C.R.; Brezonik, P.L. A Carlson-Type Trophic State Index for Nitrogen in Florida Lakes. J. Am. Water Resour. Assoc. 1981, 17, 713–715. [Google Scholar] [CrossRef]
  27. Bartlett, K.B.; Bartlett, D.S.; Harriss, R.C.; Sebacher, D.I. Methane Emissions along a Salt Marsh Salinity Gradient. Biogeochemistry 1987, 4, 183–202. [Google Scholar] [CrossRef]
  28. Poffenbarger, H.J.; Needelman, B.A.; Megonigal, J.P. Salinity Influence on Methane Emissions from Tidal Marshes. Wetlands 2011, 31, 831–842. [Google Scholar] [CrossRef]
  29. Barnes, R.O.; Goldberg, E.D. Methane Production and Consumption in Anoxic Marine Sediments. Geology 1976, 4, 297. [Google Scholar] [CrossRef]
  30. Irakoze, W.; Prodjinoto, H.; Nijimbere, S.; Rufyikiri, G.; Lutts, S. NaCl and Na2SO4 Salinities Have Different Impact on Photosynthesis and Yield-Related Parameters in Rice (Oryza sativa L.). Agronomy 2020, 10, 864. [Google Scholar] [CrossRef]
  31. Jespersen, A.-M.; Christoffersen, K. Measurements of Chlorophyll-a from Phytoplankton Using Ethanol as Extraction Solvent. Arch. Hydrobiol. 1987, 109, 445–454. [Google Scholar] [CrossRef]
  32. American Public Health Association. Standard Methods for the Examination of Water and Wastewater; American Public Health Association: Washington, DC, USA, 1996.
  33. Mackereth, F.J.H.; Heron, J.; Talling, J.F. Water Analysis: Some Revised Methods for Limnologists. Freshw. Biol. Assoc. Sci. Pub. 1978, 36, 117. [Google Scholar]
  34. Kroon, F.J. Total Nitrojen. In Standard Methods for the Examination of Water and Wastewater; Kemp, A.L.W., Ed.; American Public Health Association: Washington, DC, USA, 1993; pp. 5–23. [Google Scholar]
  35. Grasshoff, K.; Kremling, K.; Ehrhardt, M. Methods of Seawater Analysis; Verlag Chemie Weinheim: Deerfield Beach, FL, USA, 1983; p. 419. [Google Scholar]
  36. Schriver, P.; Bogestrand, J.; Jeppesen, E.; Sondergaard, M. Impact of Submerged Macrophytes on Fish-Zooplanl Phytoplankton Interactions: Large-Scale Enclosure Experiments in a Shallow Eutrophic Lake. Freshw. Biol. 1995, 33, 255–270. [Google Scholar] [CrossRef]
  37. R Core Team. R: A Language and Environment for Statistical Computing; R Core Team: Vienna, Austria, 2023. [Google Scholar]
  38. Wickham, H.; Chang, W.; Wickham, M.H. Ggplot2: Elegant Graphics for Data Analysis; Springer: New York, NY, USA, 2016. [Google Scholar]
  39. Wood, S.N. Generalized Additive Models: An Introduction with R, 2nd ed.; CRS Press: Boca Raton, FL, USA, 2017. [Google Scholar]
  40. Kay, M.; Elkin, L.A.; Higgins, J.J.; Wobbrock, J.O. ARTool: Aligned Rank Transform for Nonparametric Factorial ANOVAs; R Core Team: Vienna, Austria, 2021. [Google Scholar]
  41. Droppo, I.G. Rethinking What Constitutes Suspended Sediment. Hydrol. Process. 2001, 15, 1551–1564. [Google Scholar] [CrossRef]
  42. Shen, X.; Lee, B.J.; Fettweis, M.; Toorman, E.A. A Tri-Modal Flocculation Model Coupled with TELEMAC for Estuarine Muds Both in the Laboratory and in the Field. Water Res. 2018, 145, 473–486. [Google Scholar] [CrossRef] [PubMed]
  43. Zambrano, L.; Scheffer, M.; Martínez-Ramos, M. Catastrophic Response of Lakes to Benthivorous Fish Introduction. Oikos 2001, 94, 344–350. [Google Scholar] [CrossRef] [Green Version]
  44. Jiang, X.; Liu, C.; Hu, Y.; Shao, K.; Tang, X.; Zhang, L.; Gao, G.; Qin, B. Climate-Induced Salinization May Lead to Increased Lake Nitrogen Retention. Water Res. 2023, 228, 119354. [Google Scholar] [CrossRef]
  45. Zhu, J.; He, Y.; Zhu, Y.; Huang, M.; Zhang, Y. Biogeochemical Sulfur Cycling Coupling with Dissimilatory Nitrate Reduction Processes in Freshwater Sediments. Environ. Rev. 2018, 26, 121–132. [Google Scholar] [CrossRef]
Figure 1. The two mesocosm facilities (MF) were established in the central Anatolian plateau and on the Mediterranean coastline to cover two dry climatic regions (a). Monthly variations of minimum and maximum air temperatures from Ankara (b) and Mersin (c) are shown as average historical data (1981–2010) and data from 2021. Aerial photos of the facilities in Ankara (d) and Mersin (e) are given below.
Water 15 02611 g001
Figure 2. Temporal changes in salinity (a,b) and average water temperatures (c,d) in the 16 different treatments of the gradient experiment in the Ankara and Mersin mesocosm facilities, respectively.
Water 15 02611 g002
Figure 3. Response variable values estimated through generalized additive models (GAM) for Secchi disc water transparency (a,b), chlorophyll-a concentrations (c,d), and total suspended solids (e,f) in Ankara and Mersin, respectively, and their response to the salinity gradient in the stable phase of the experiment. Effective degrees of freedom (e.d.f), R-squared (adjusted), and significance of the relationships (p-values) are provided. Solid lines are the estimated response variables and dashed lines represent the 95% confidence intervals. All models were highly significant (p < 0.001).
Water 15 02611 g003
Figure 4. Response variable values estimated through generalized additive models (GAM) for soluble reactive phosphorus (a,b), total phosphorus (c,d), nitrite and nitrate (e,f), and total nitrogen (g,h) in Ankara and Mersin, respectively, and their response to the salinity gradient in the stable phase of the experiment. Effective degrees of freedom (e.d.f), R-squared (adjusted), and significance of the relationships (p-values) are provided. Solid lines are the estimated response variables and dashed lines represent the 95% confidence intervals. All models were highly significant (p < 0.001).
Water 15 02611 g004
Figure 5. Variation of water transparency (a), total (b), inorganic (c), and organic (d) fractions of suspended solids (SS) in the mesocosms over time (8–29 December 2021) before and after the fish removal in the mesocosm with 0 g/L salinity on 8 December.
Water 15 02611 g005
Figure 6. Macrophyte percent volume infested (PVI%) in Ankara and Mersin and their response to the salinity gradient during the desalinization (13 May 2022) phase of the experiment.
Water 15 02611 g006
Figure 7. The water temperature changes in the ambient and heated mesocosms with salinities of 4 and 40 g/L in Ankara (a) and Mersin (b). The heatwave period started on 22 September and reached 6 °C compared to the ambient temperature in reference mesocosms on 26 September.
Water 15 02611 g007
Figure 8. Variation of water transparency (a,b), chlorophyll-a (c,d), and suspended solids (e,f) in the treatments with 4 and 40 g/L salinity crossed with ambient temperatures and heatwave treatments at the start of the experiment, at the beginning (Pre-Heatwave), during (Heatwave), and after (Post-Heatwave) the heatwave period in Ankara and Mersin mesocosm facilities. Boxplots are given with black lines representing the median, the limit of the boxes representing the 25th and 75th percentiles, and dots are the outliers. Different letters represent significant differences between the treatments and phases.
Water 15 02611 g008
Figure 9. Variation of soluble reactive phosphorus (a,b), total phosphorus (c,d), nitrite and nitrate (e,f), and total nitrogen (g,h) in the treatments with 4 and 40 g/L salinity crossed with ambient temperatures and heatwave treatments at the start of the experiment, at the beginning (Pre-Heatwave), during (Heatwave), and after (Post-Heatwave) the heatwave period in Ankara and Mersin mesocosm facilities. Boxplots are given with black lines representing the median, the limit of the boxes representing the 25th and 75th percentiles, and dots are the outliers. Different letters represent significant differences between the treatments and phases.
Water 15 02611 g009
Figure 10. Macrophyte percent volume infested (PVI%) in Ankara (a) and Mersin (b) and their response to the factorial salinity and heatwave treatments at the end of the experiment. Boxplots are given with black lines representing the median, the limit of the boxes representing the 25th and 75th percentiles, and dots are the outliers.
Water 15 02611 g010
Disclaimer/Publisher’s Note: The statements, opinions and data contained in all publications are solely those of the individual author(s) and contributor(s) and not of MDPI and/or the editor(s). MDPI and/or the editor(s) disclaim responsibility for any injury to people or property resulting from any ideas, methods, instructions or products referred to in the content.