Representation of Hydrological Components under a Changing Climate—A Case Study of the Uruguay River Basin Using the New Version of the Soil and Water Assessment Tool Model (SWAT+)
Abstract
:1. Introduction
2. Materials and Methods
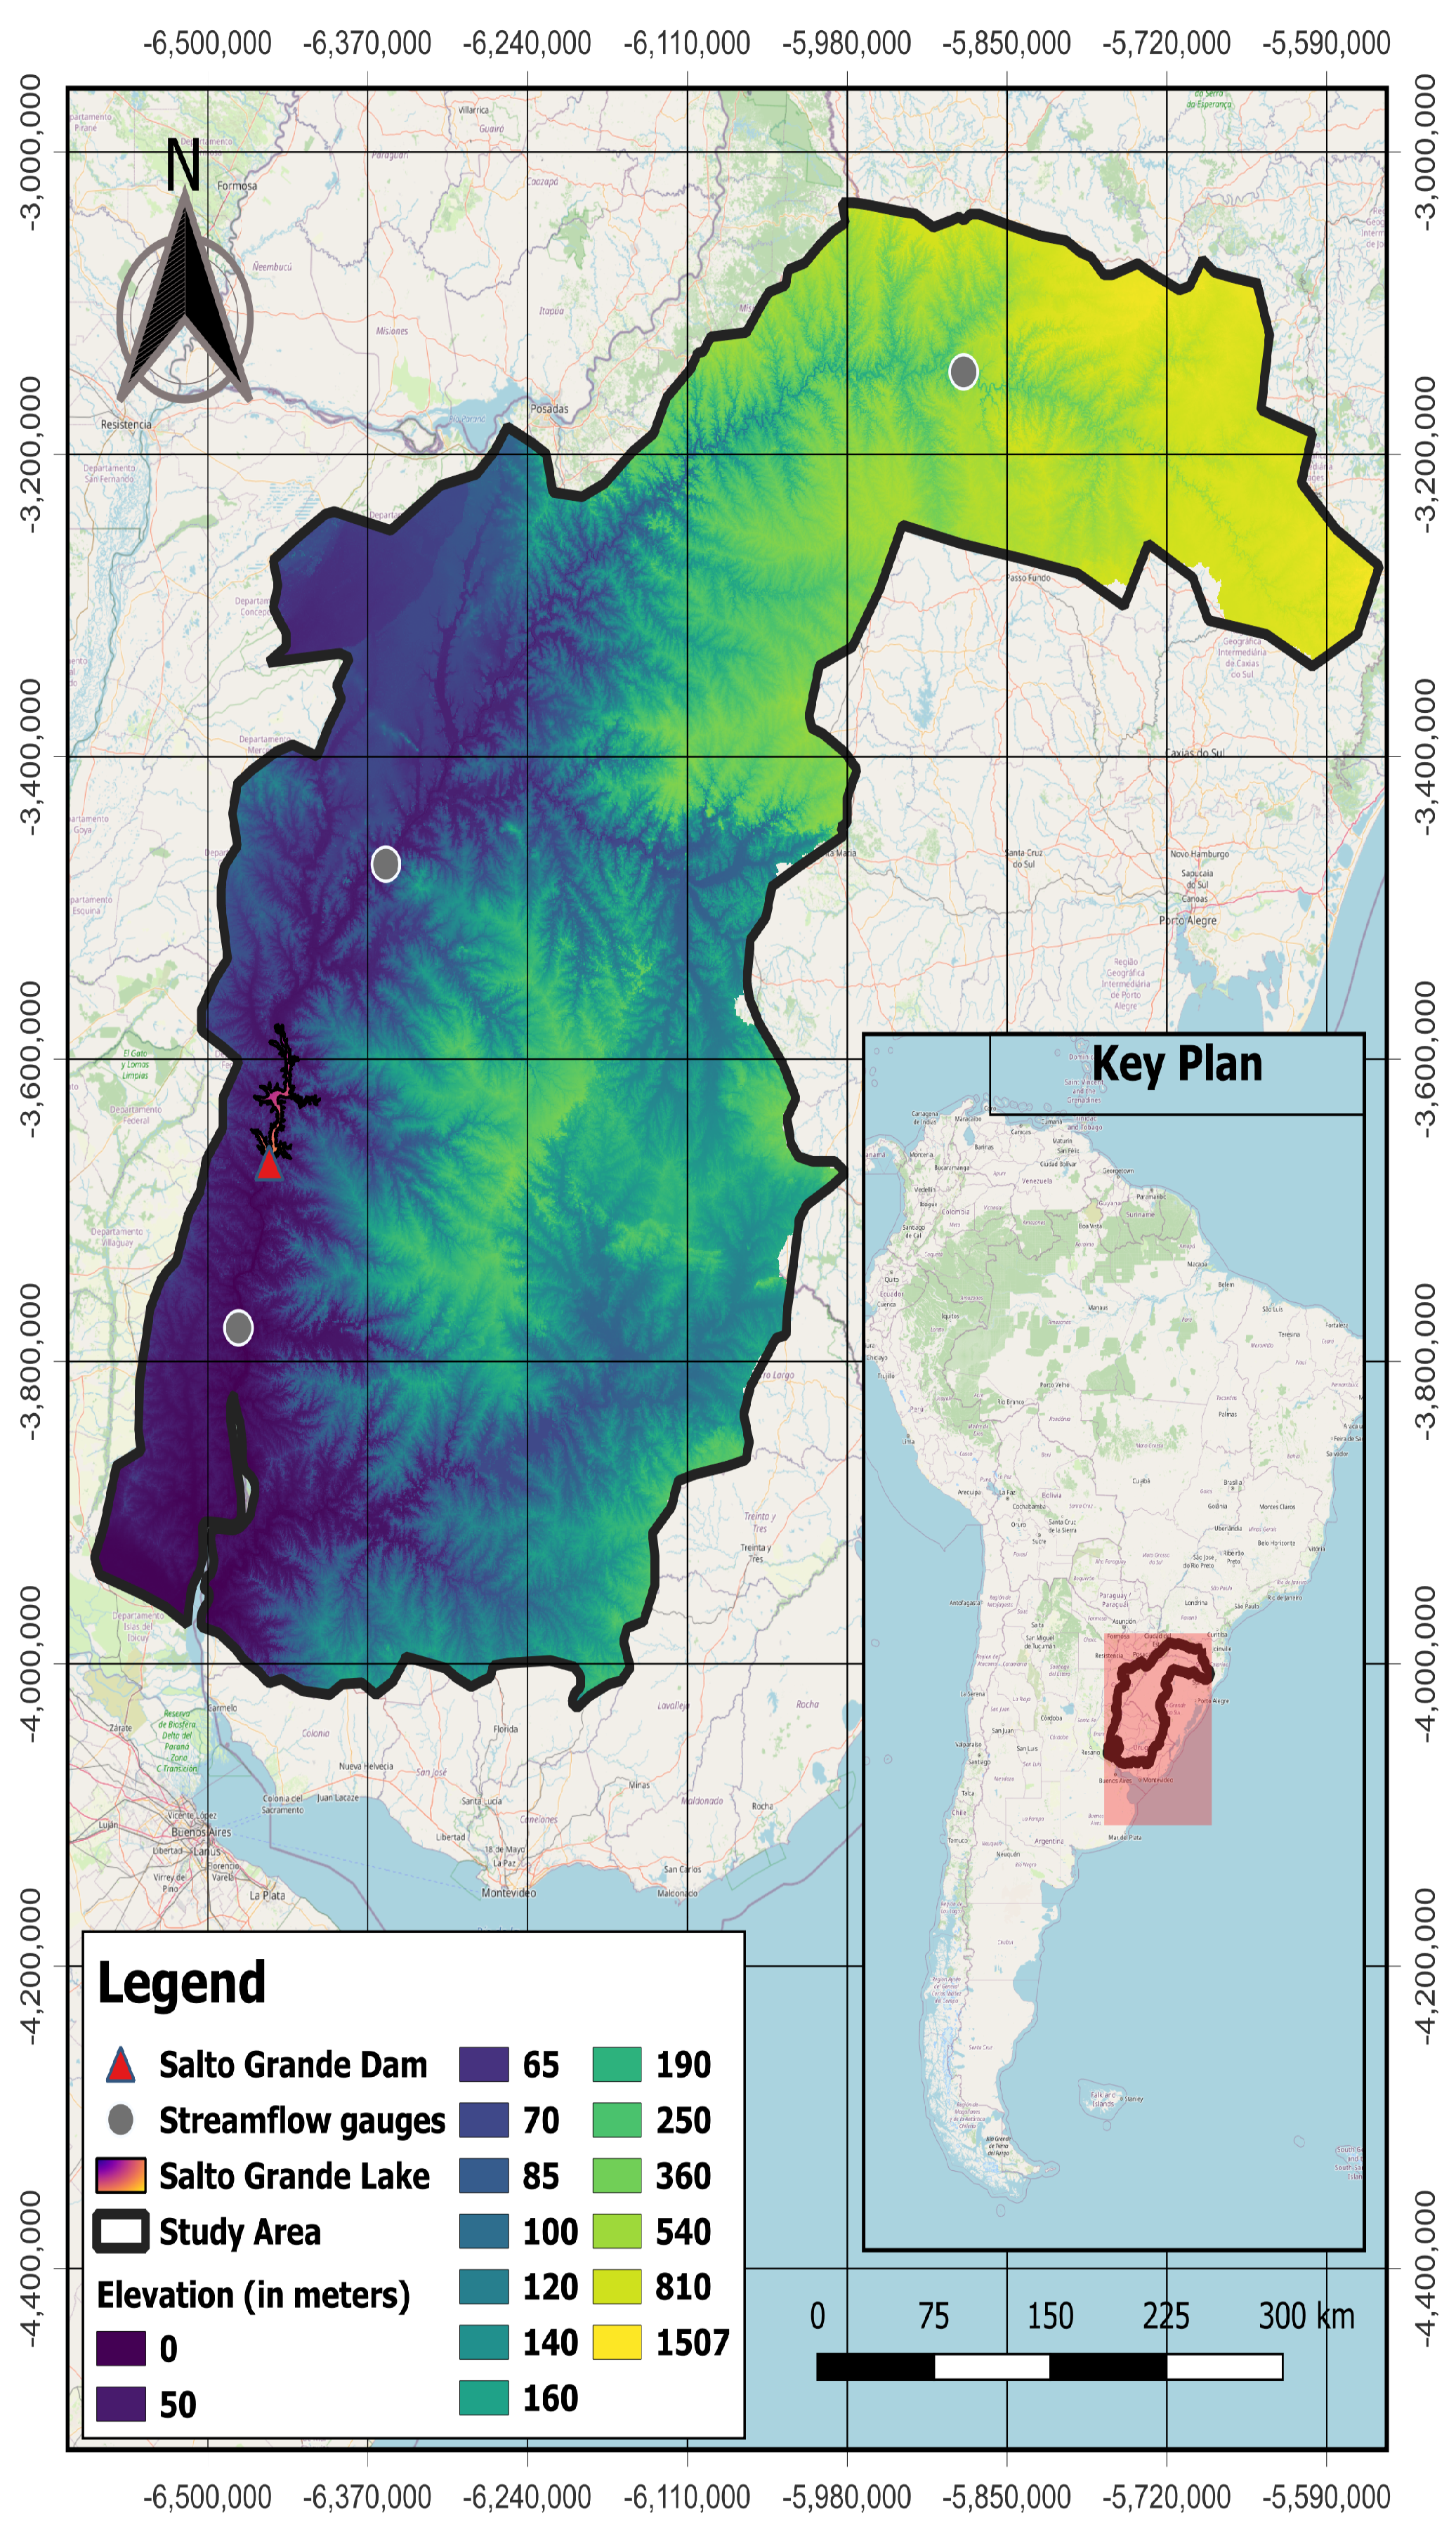
2.1. Study Region
2.2. The SWAT+ Model
- Spatial objects: Aquifers, channels, reservoirs, ponds, point sources, inlets, and HRUs are individual spatial objects, which do not require a rigid model structure anymore. This allows the modeller a better and more flexible option to represent the watershed characteristics with the conceptual model.
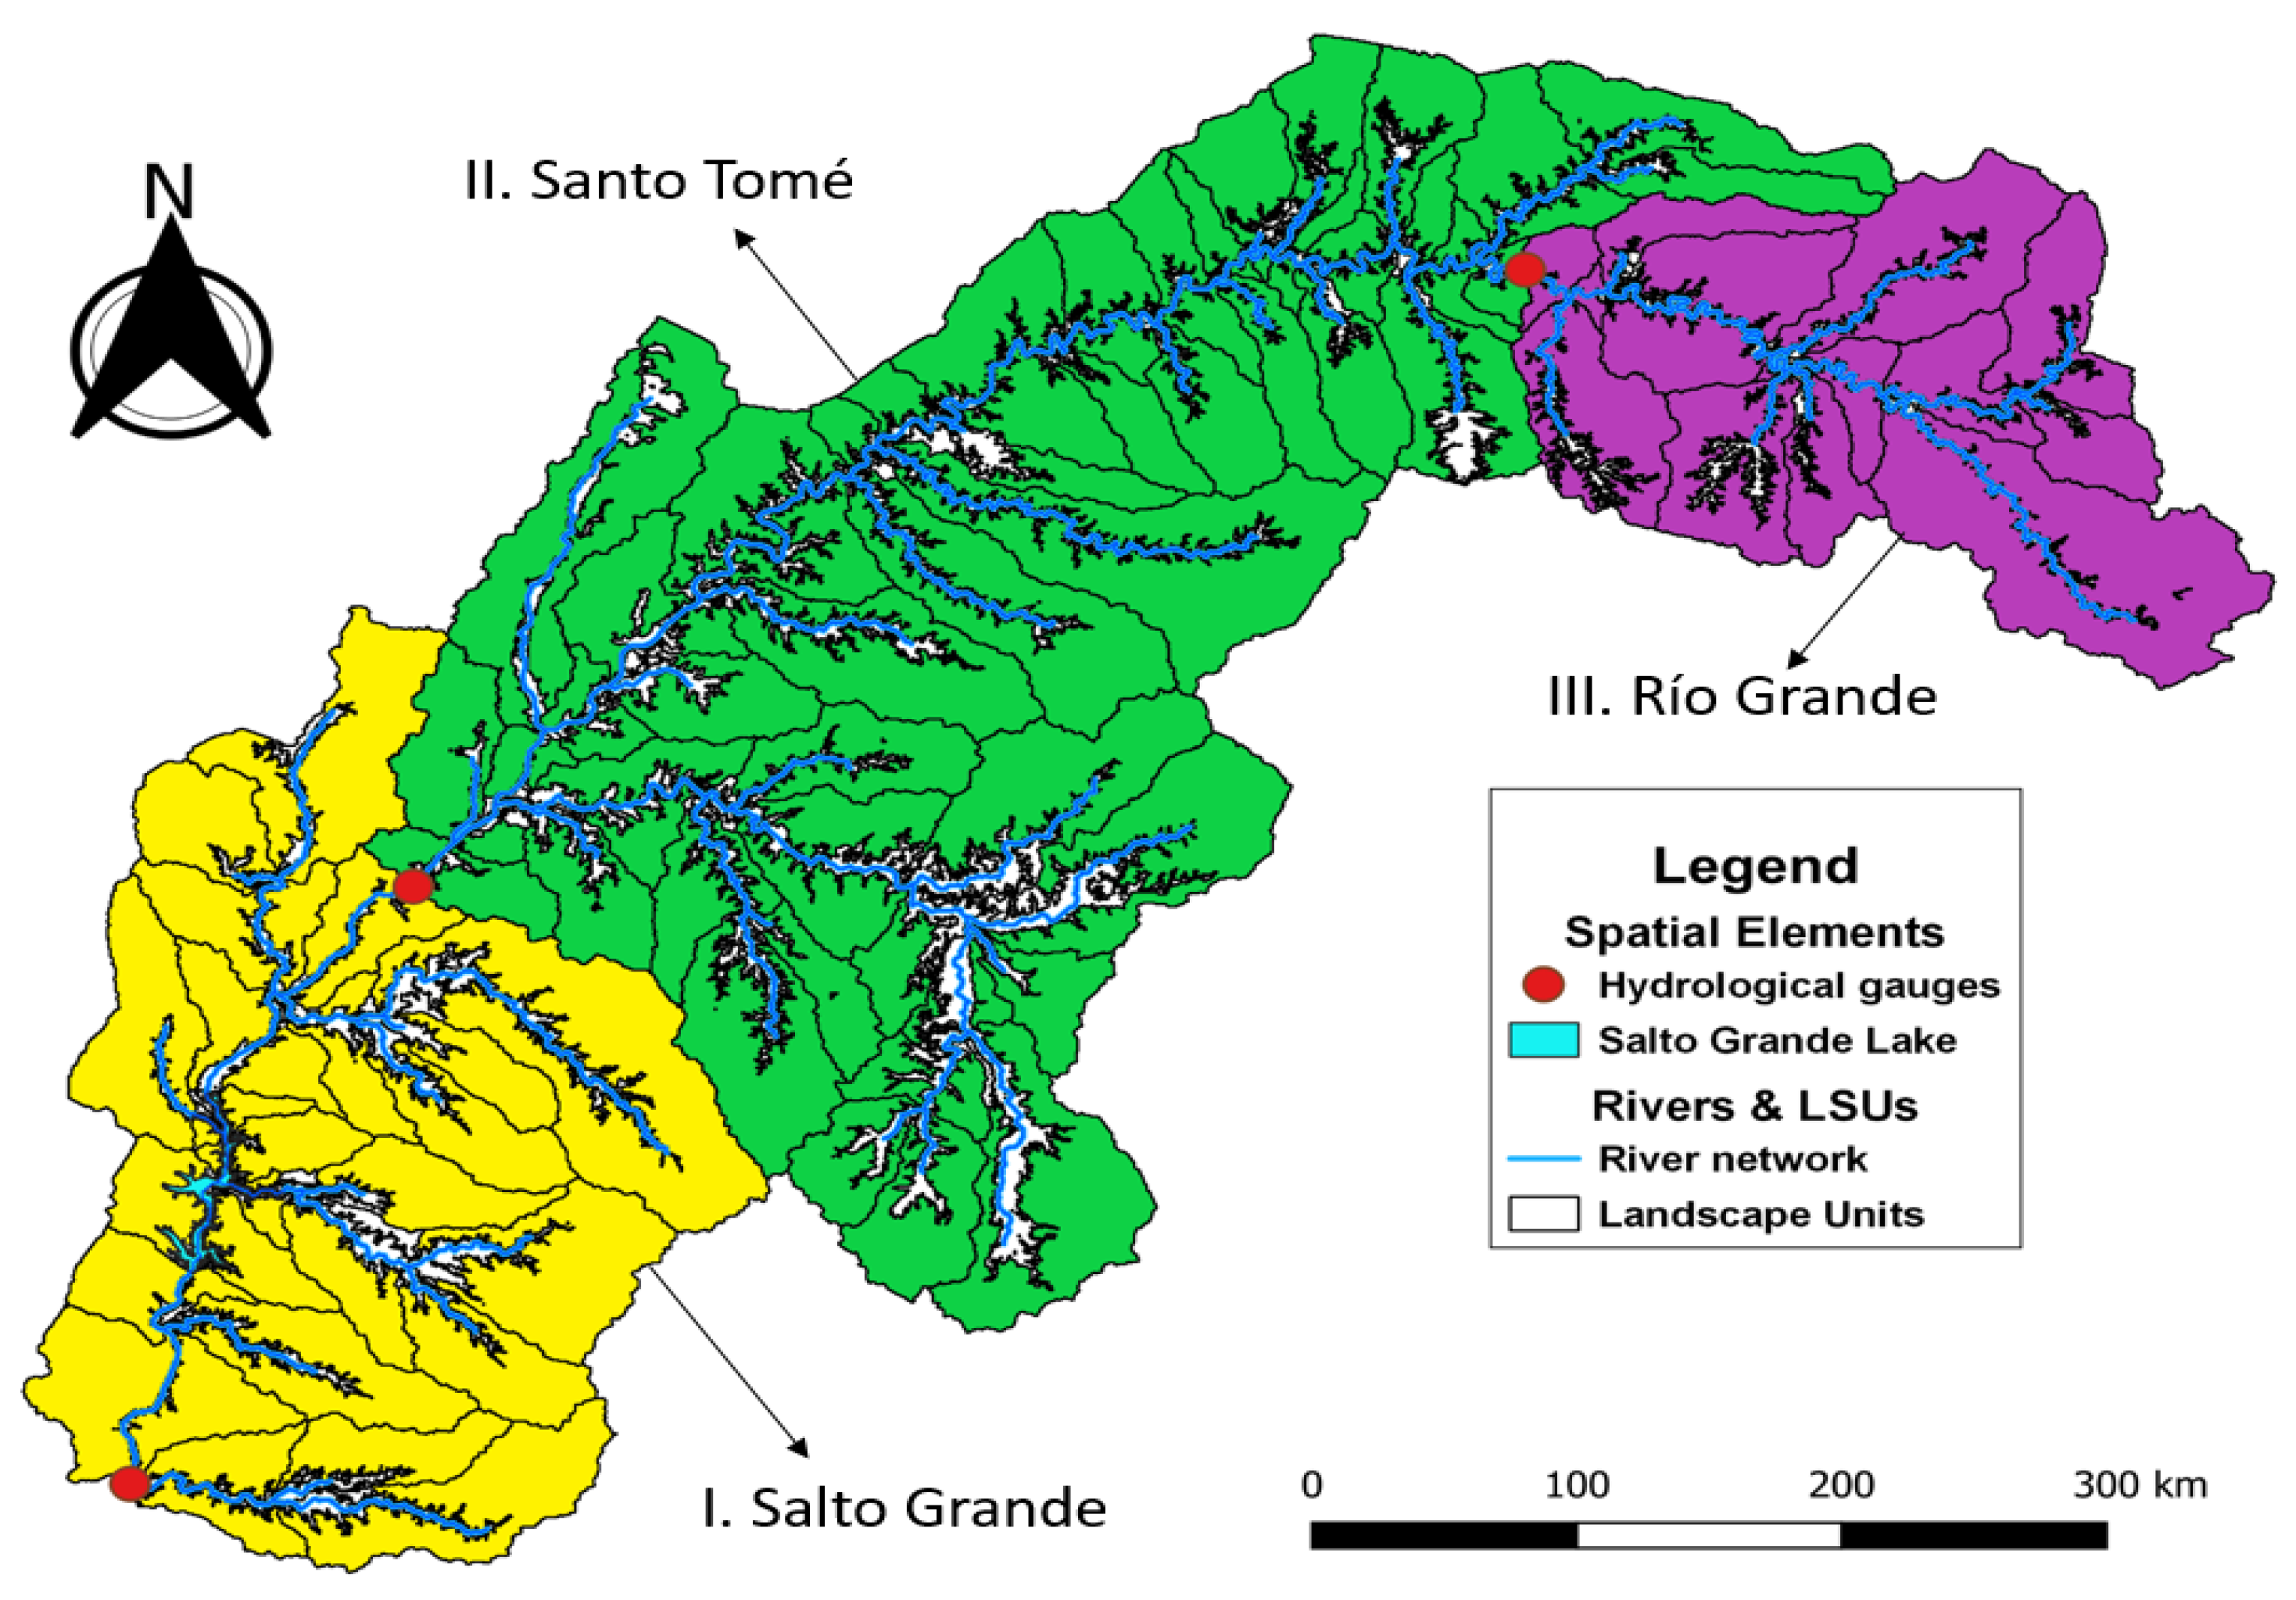
- Connectivity: SWAT+ allows one to flexibly connect the defined spatial objects of a model setup to route different fractions of runoff and fluxes of sediments or nutrients between them. A SWAT+ model setup with QSWAT+, for example, allows to include the landscape unit (LSU) concept in the model setup. With LSUs, the landscape which drains into a channel is divided into upland and a floodplain. The upland, for example, routes a certain fraction of water through the floodplain before it is finally routed into the channel (Figure 3). This is a major improvement over previous versions of SWAT [26] models, which followed, by default, a very rigid model structure and restricted the routing of water through the landscape.
- Decision tables: Decision tables allow representing rule sets and their corresponding actions to simulate management in the watershed [18]. In this work, we implemented rules to represent the release of the Salto Grande dam. The implementation of decision tables makes modelling more realistic as it provides to the user the possibility to set an easy or complex real-world decision-making process.
2.3. Water Balance Calculation
2.4. Data Description and Model Set Up
2.5. Meteorological Data
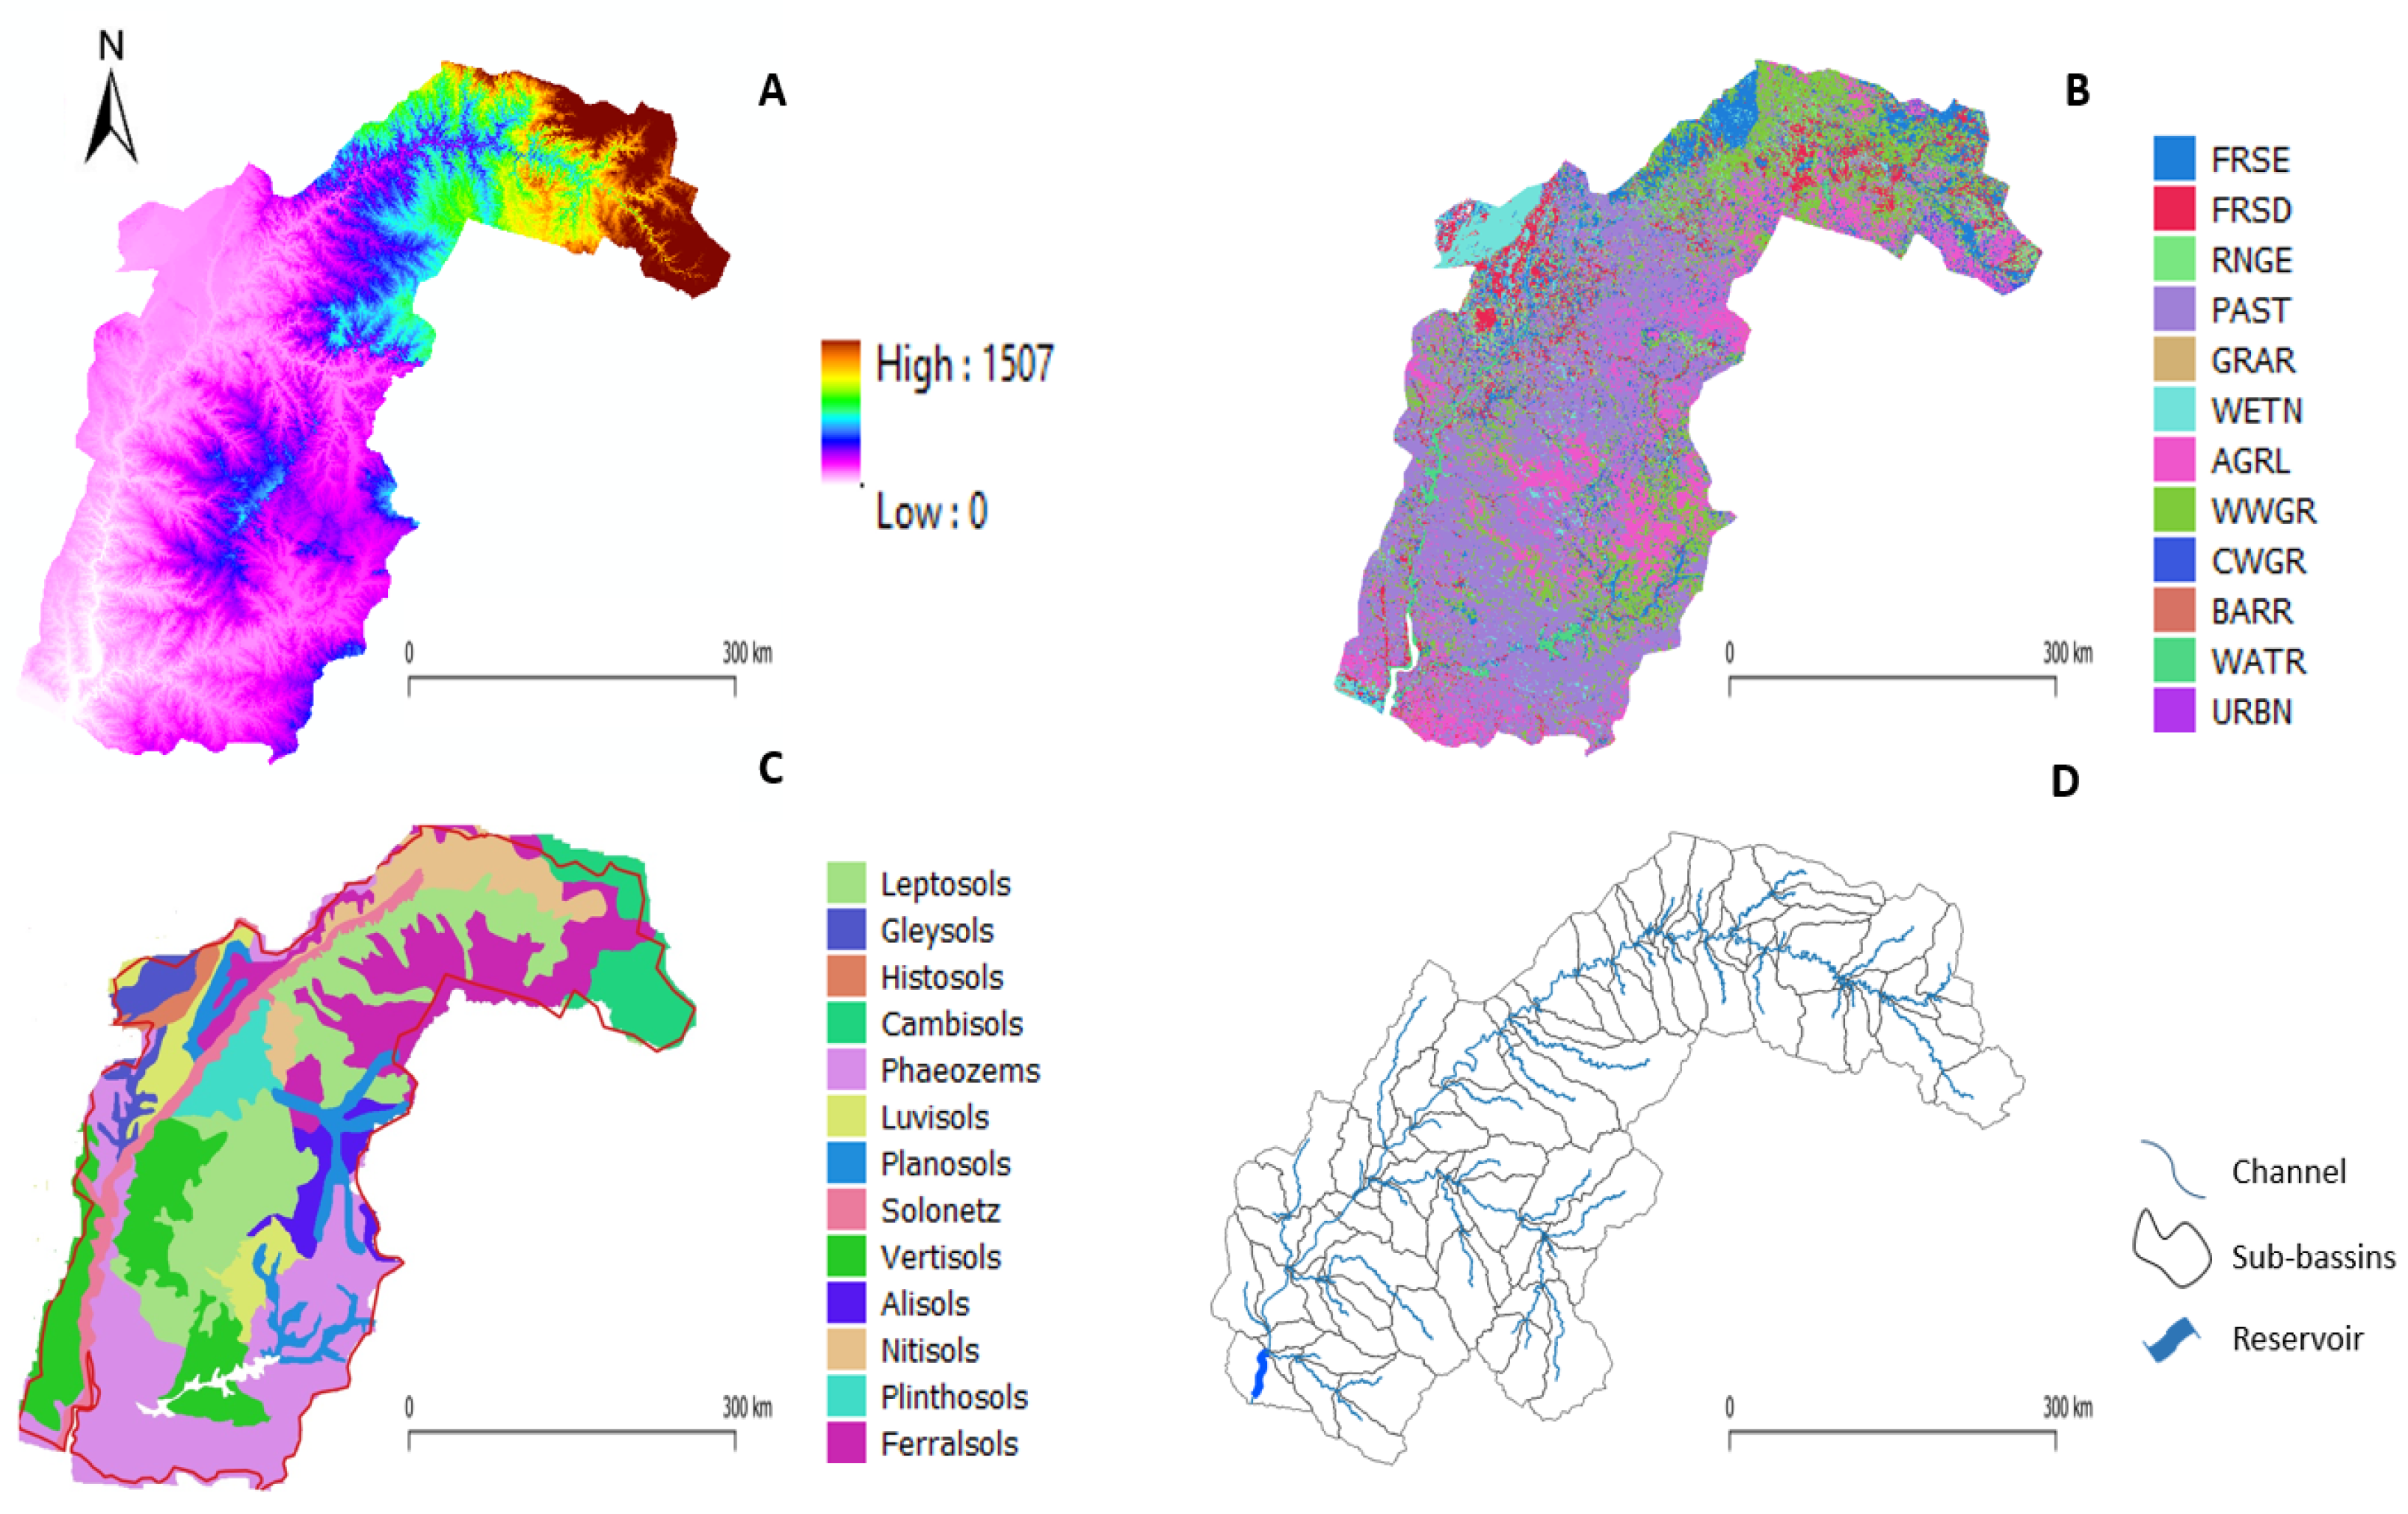
2.6. Topography
2.7. Soil Data
2.8. Land Use Land Cover Data
2.9. Model Set Up
2.10. River Discharge Data
- I.
- Salto Grande: from 1990 to 1997 and 1998 to 2001.
- II.
- Santo Tomé: from 1990 to 2010 and 2011 to 2020.
- III.
- Río Grande: from 1990 to 2000 and 2001 to 2010.
2.11. SPOTPY and Parameter Calibration
2.12. Decision Table for Salto Grande Dam
- If reservoir volume > e-pv * −14.92, reservoir volume < e-pv * 0.005, and month < 5.86, then release volume for multiple_use_fl.
- If reservoir volume > e-pv * −14.92, reservoir volume < e-pv * 0.005, and month > 10.06, then release volume for multiple_use_fl.
- If reservoir volume > e-pv * −14.92, reservoir volume < e-pv * 0.005, month > 5.864, and month < 10.06, then release volume for multiple_use_nf.
- If reservoir volume > e-pv * 0.005, reservoir volume < e-pv * 0.93, and month < 5.86, then release volume for sfl_cont+mu_fl.
- If reservoir volume > e-pv * 0.005, reservoir volume < e-pv * 0.93, and month > 10.06, then release volume for sfl_cont+mu_fl.
- If reservoir volume > e-pv * 0.005, reservoir volume < e-pv * 0.93, month > 5.86, and month < 10.06, then release volume for sfl_cont+mu_nf.
- If reservoir volume > e-pv * 0.929, then release volume for efc_cont.
3. Results
3.1. Model Parameterization
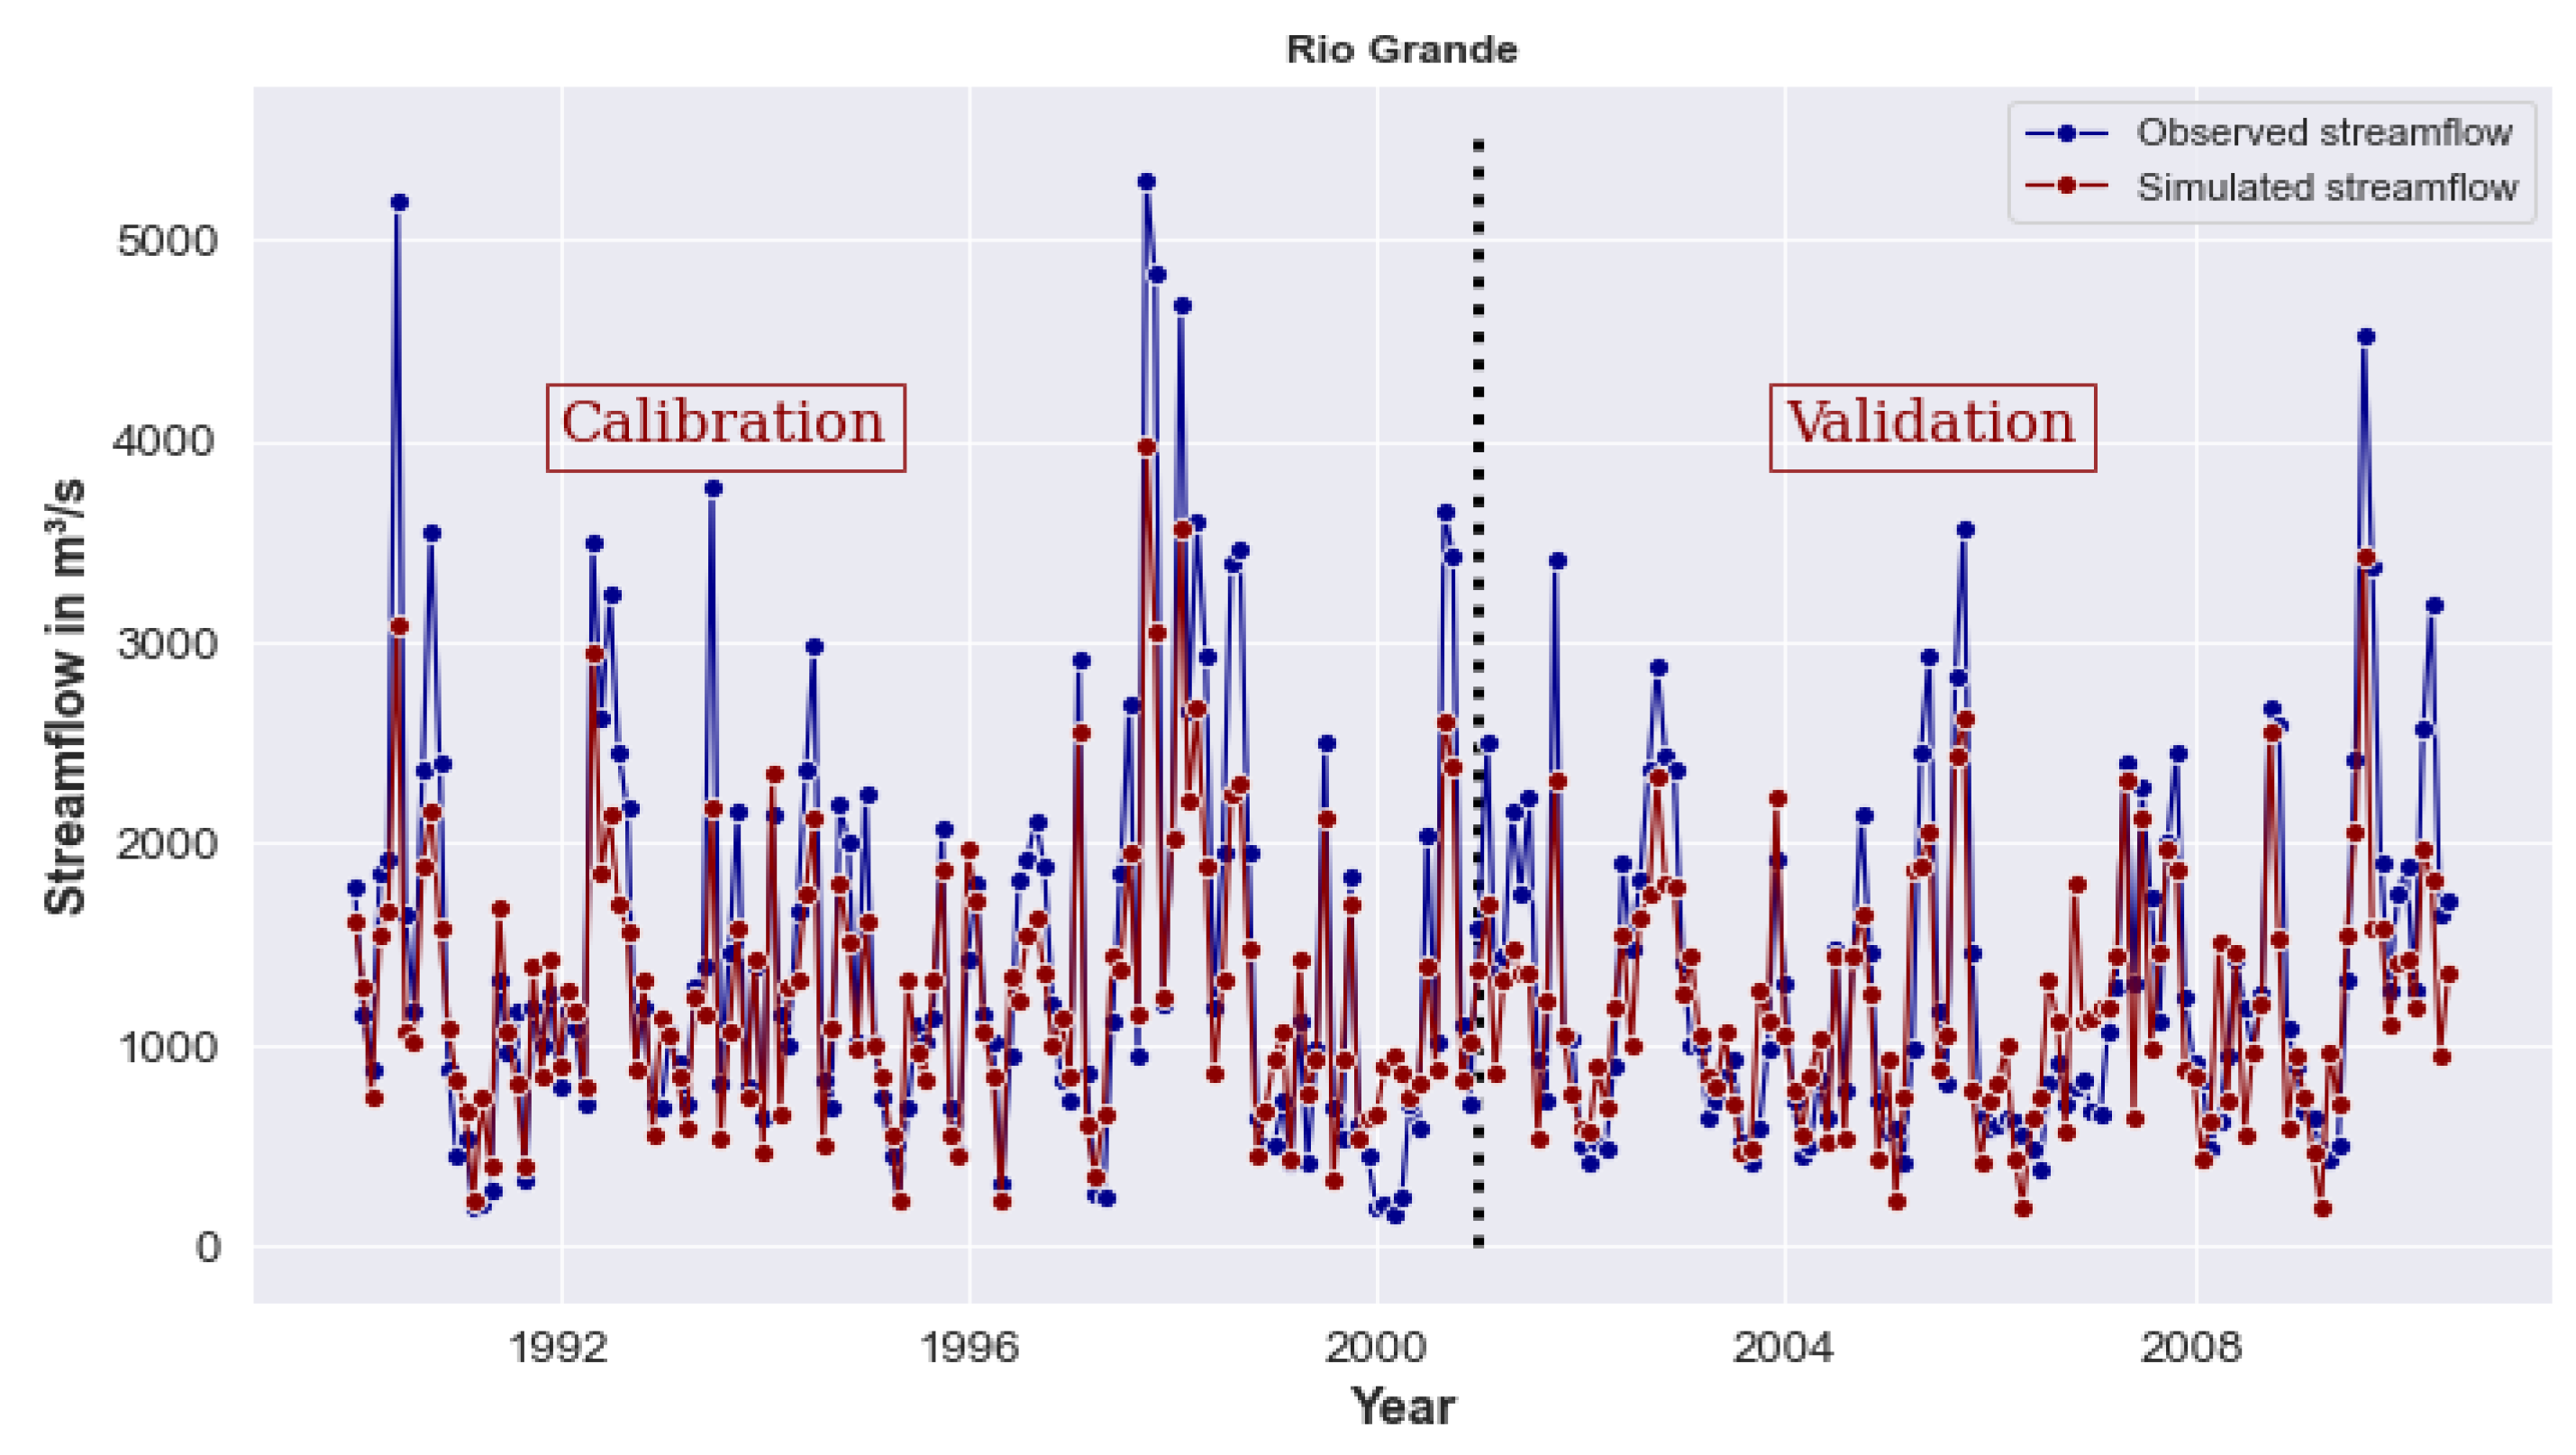
3.2. Model Performance
3.3. Water Balance Components
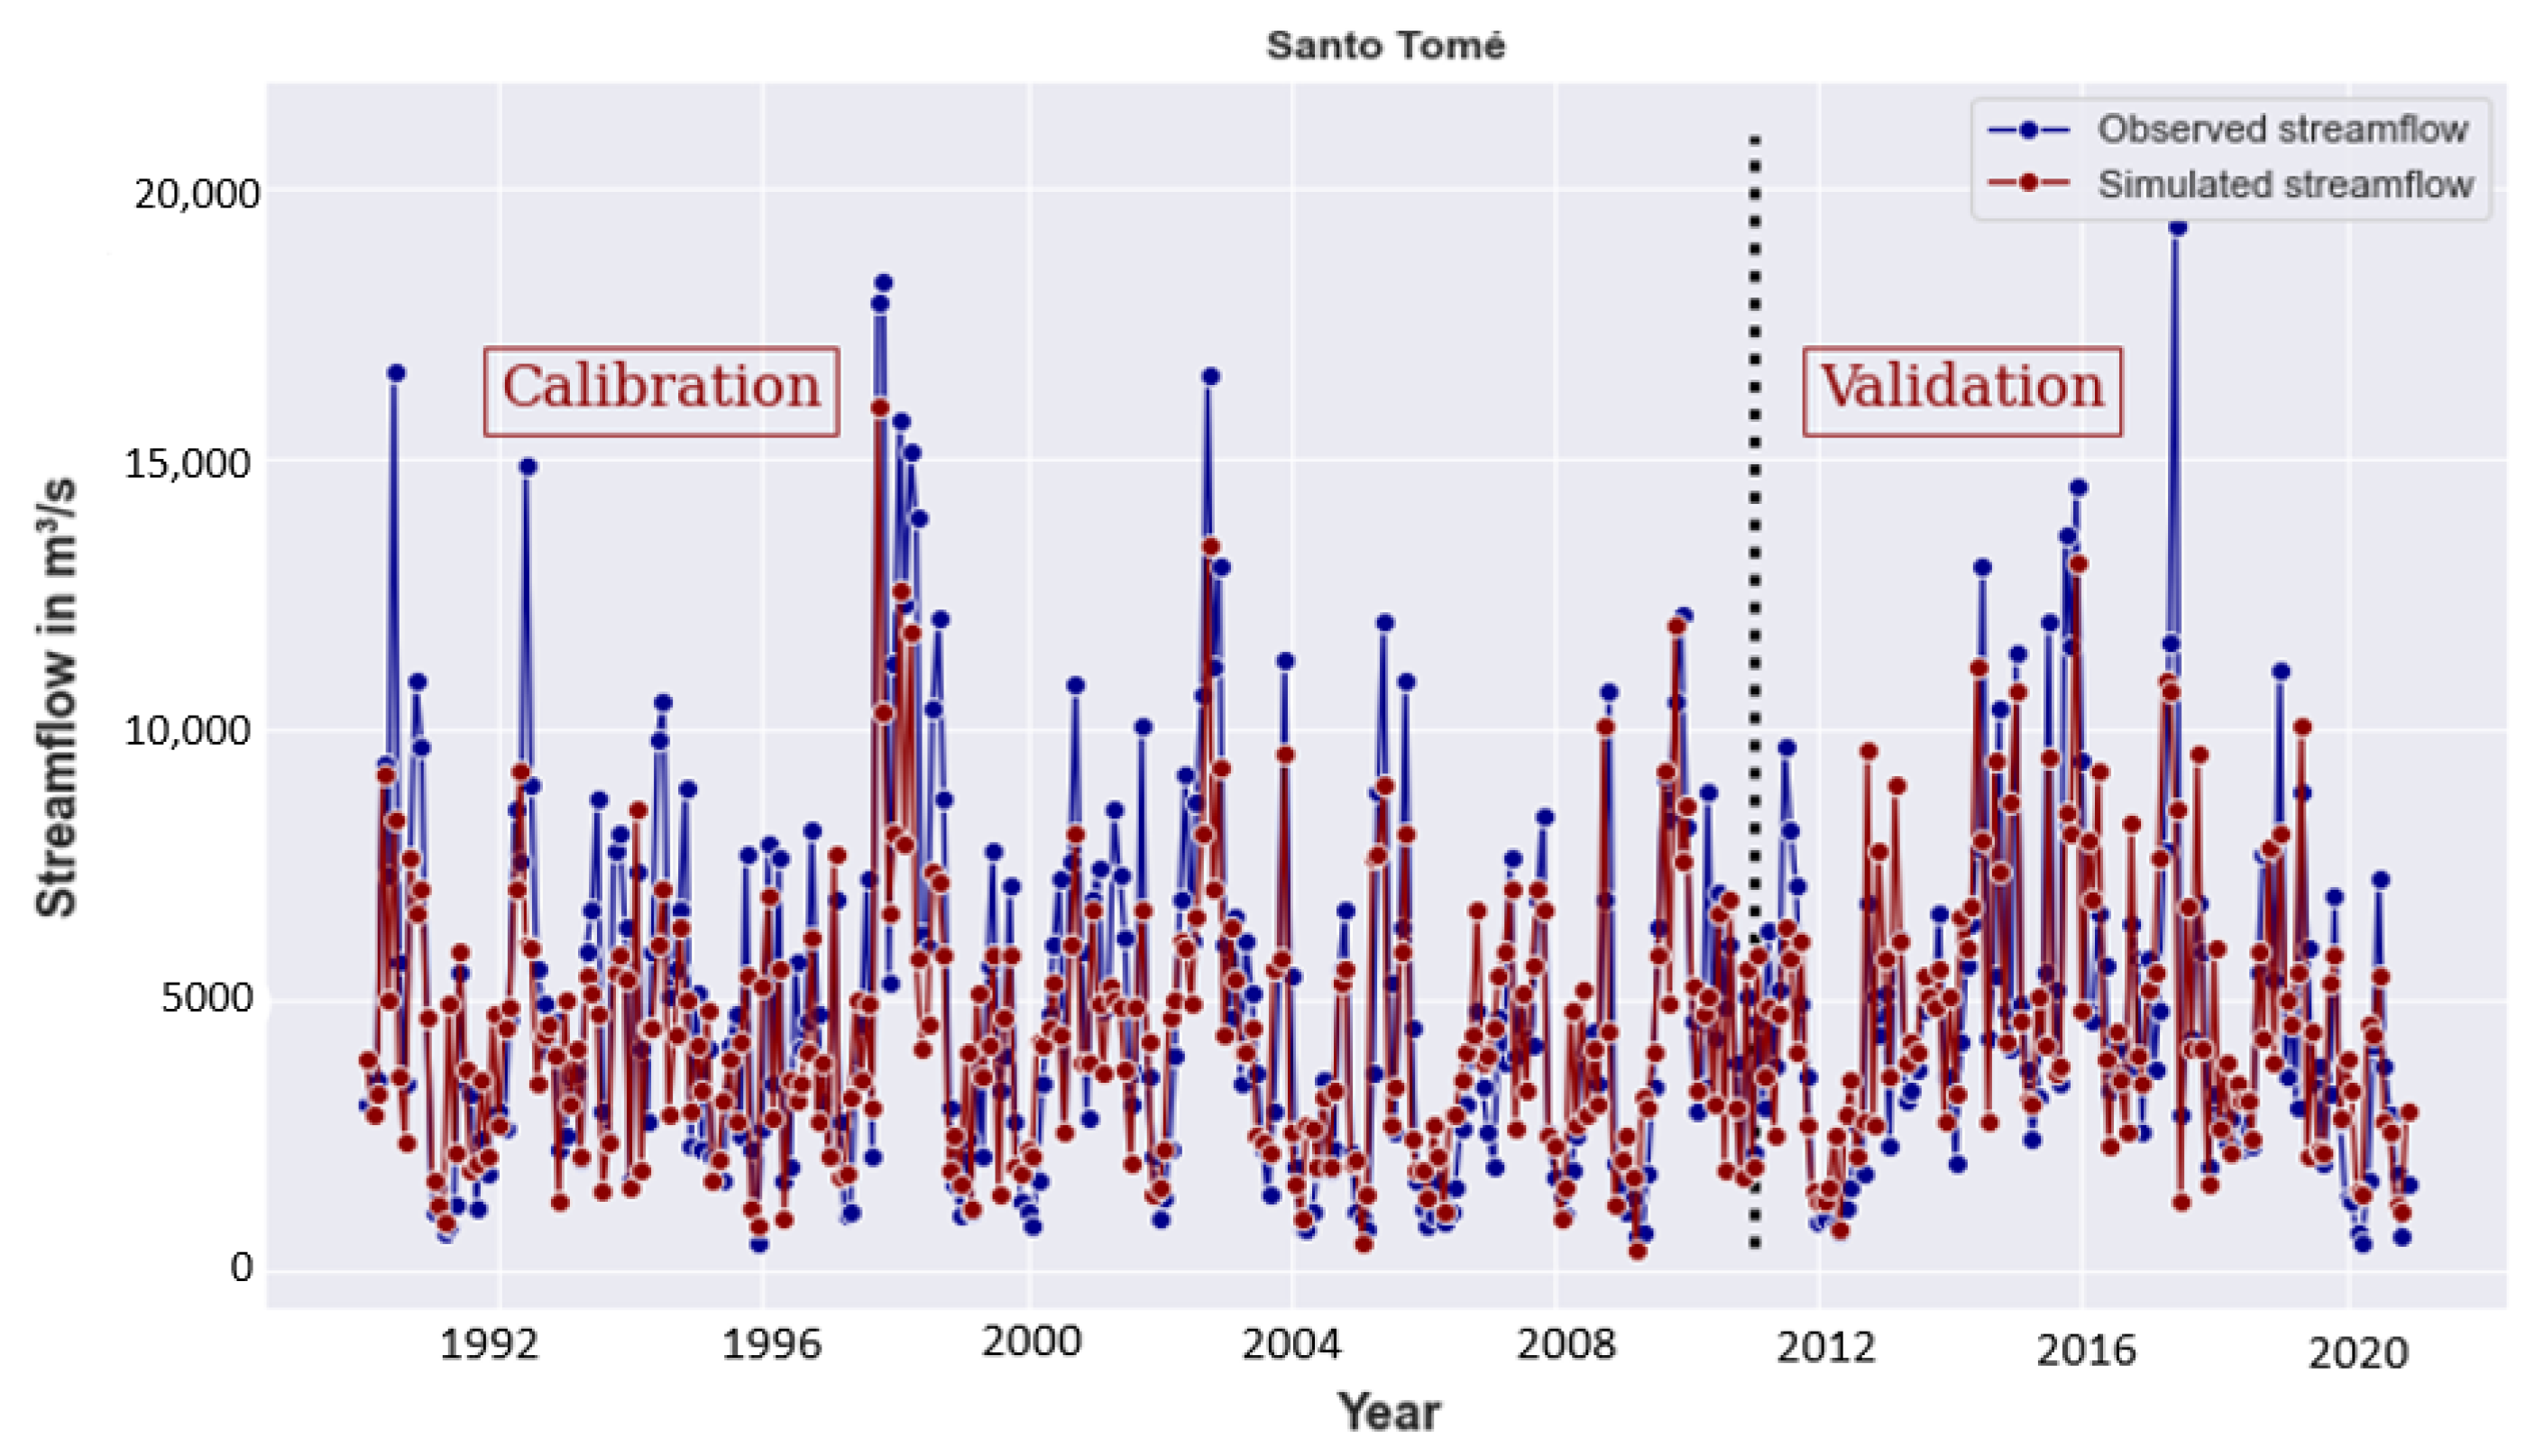
3.4. Observed and Simulated Data Evaluation
4. Discussion
4.1. Calibration and Validation Performance
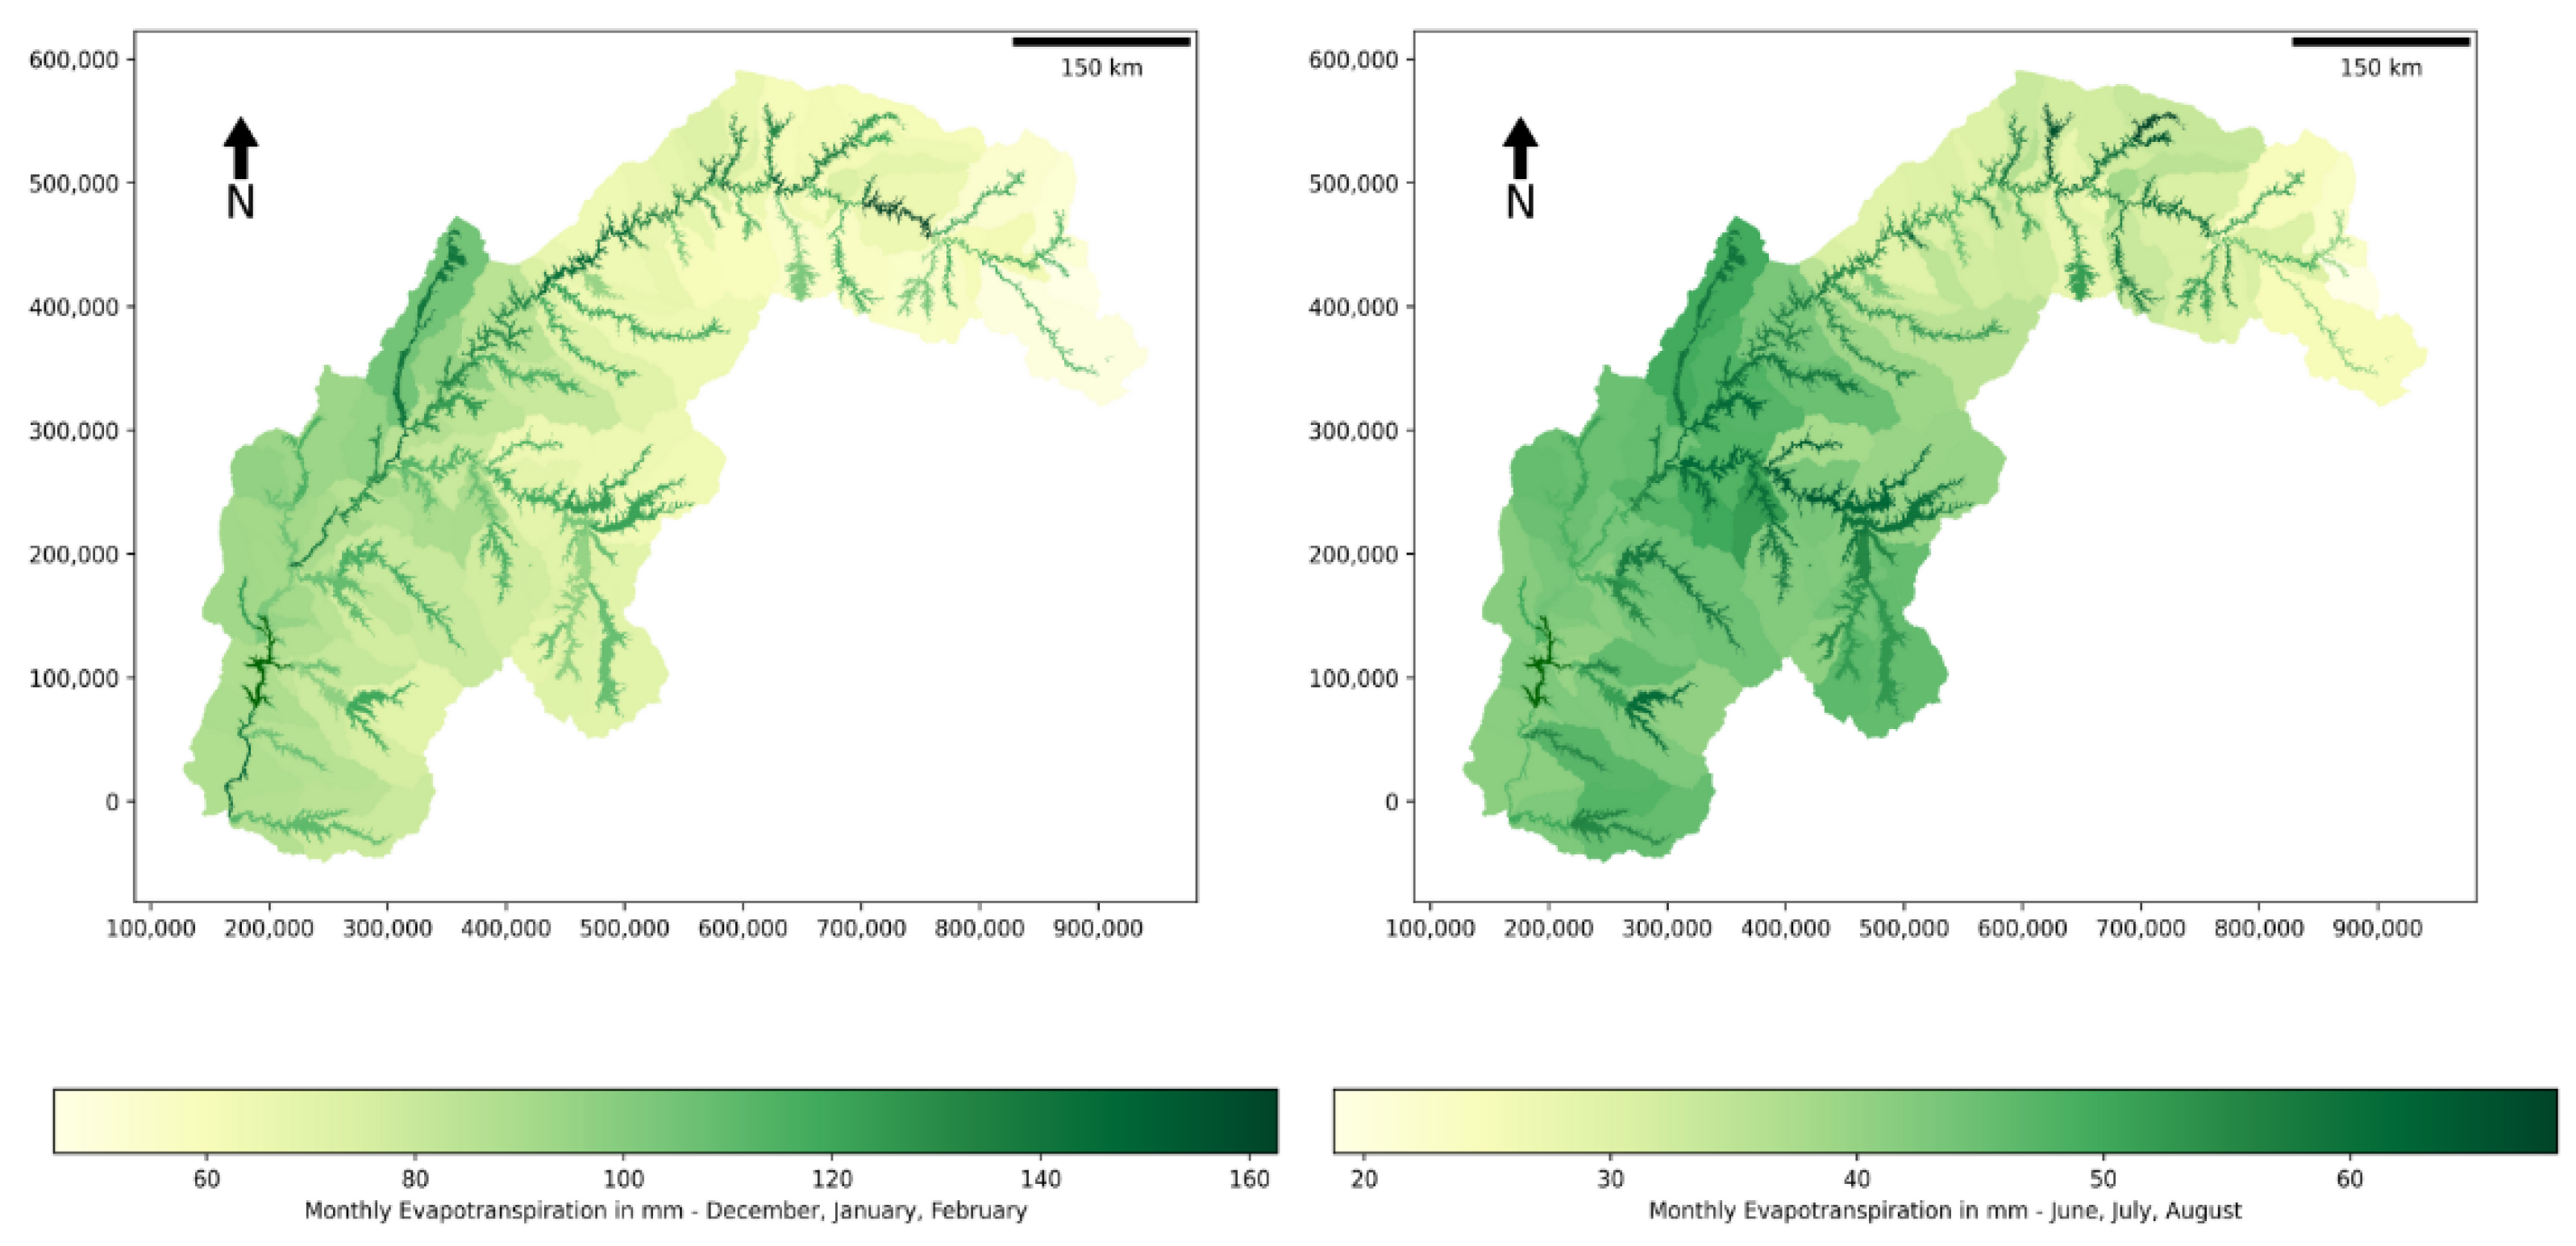
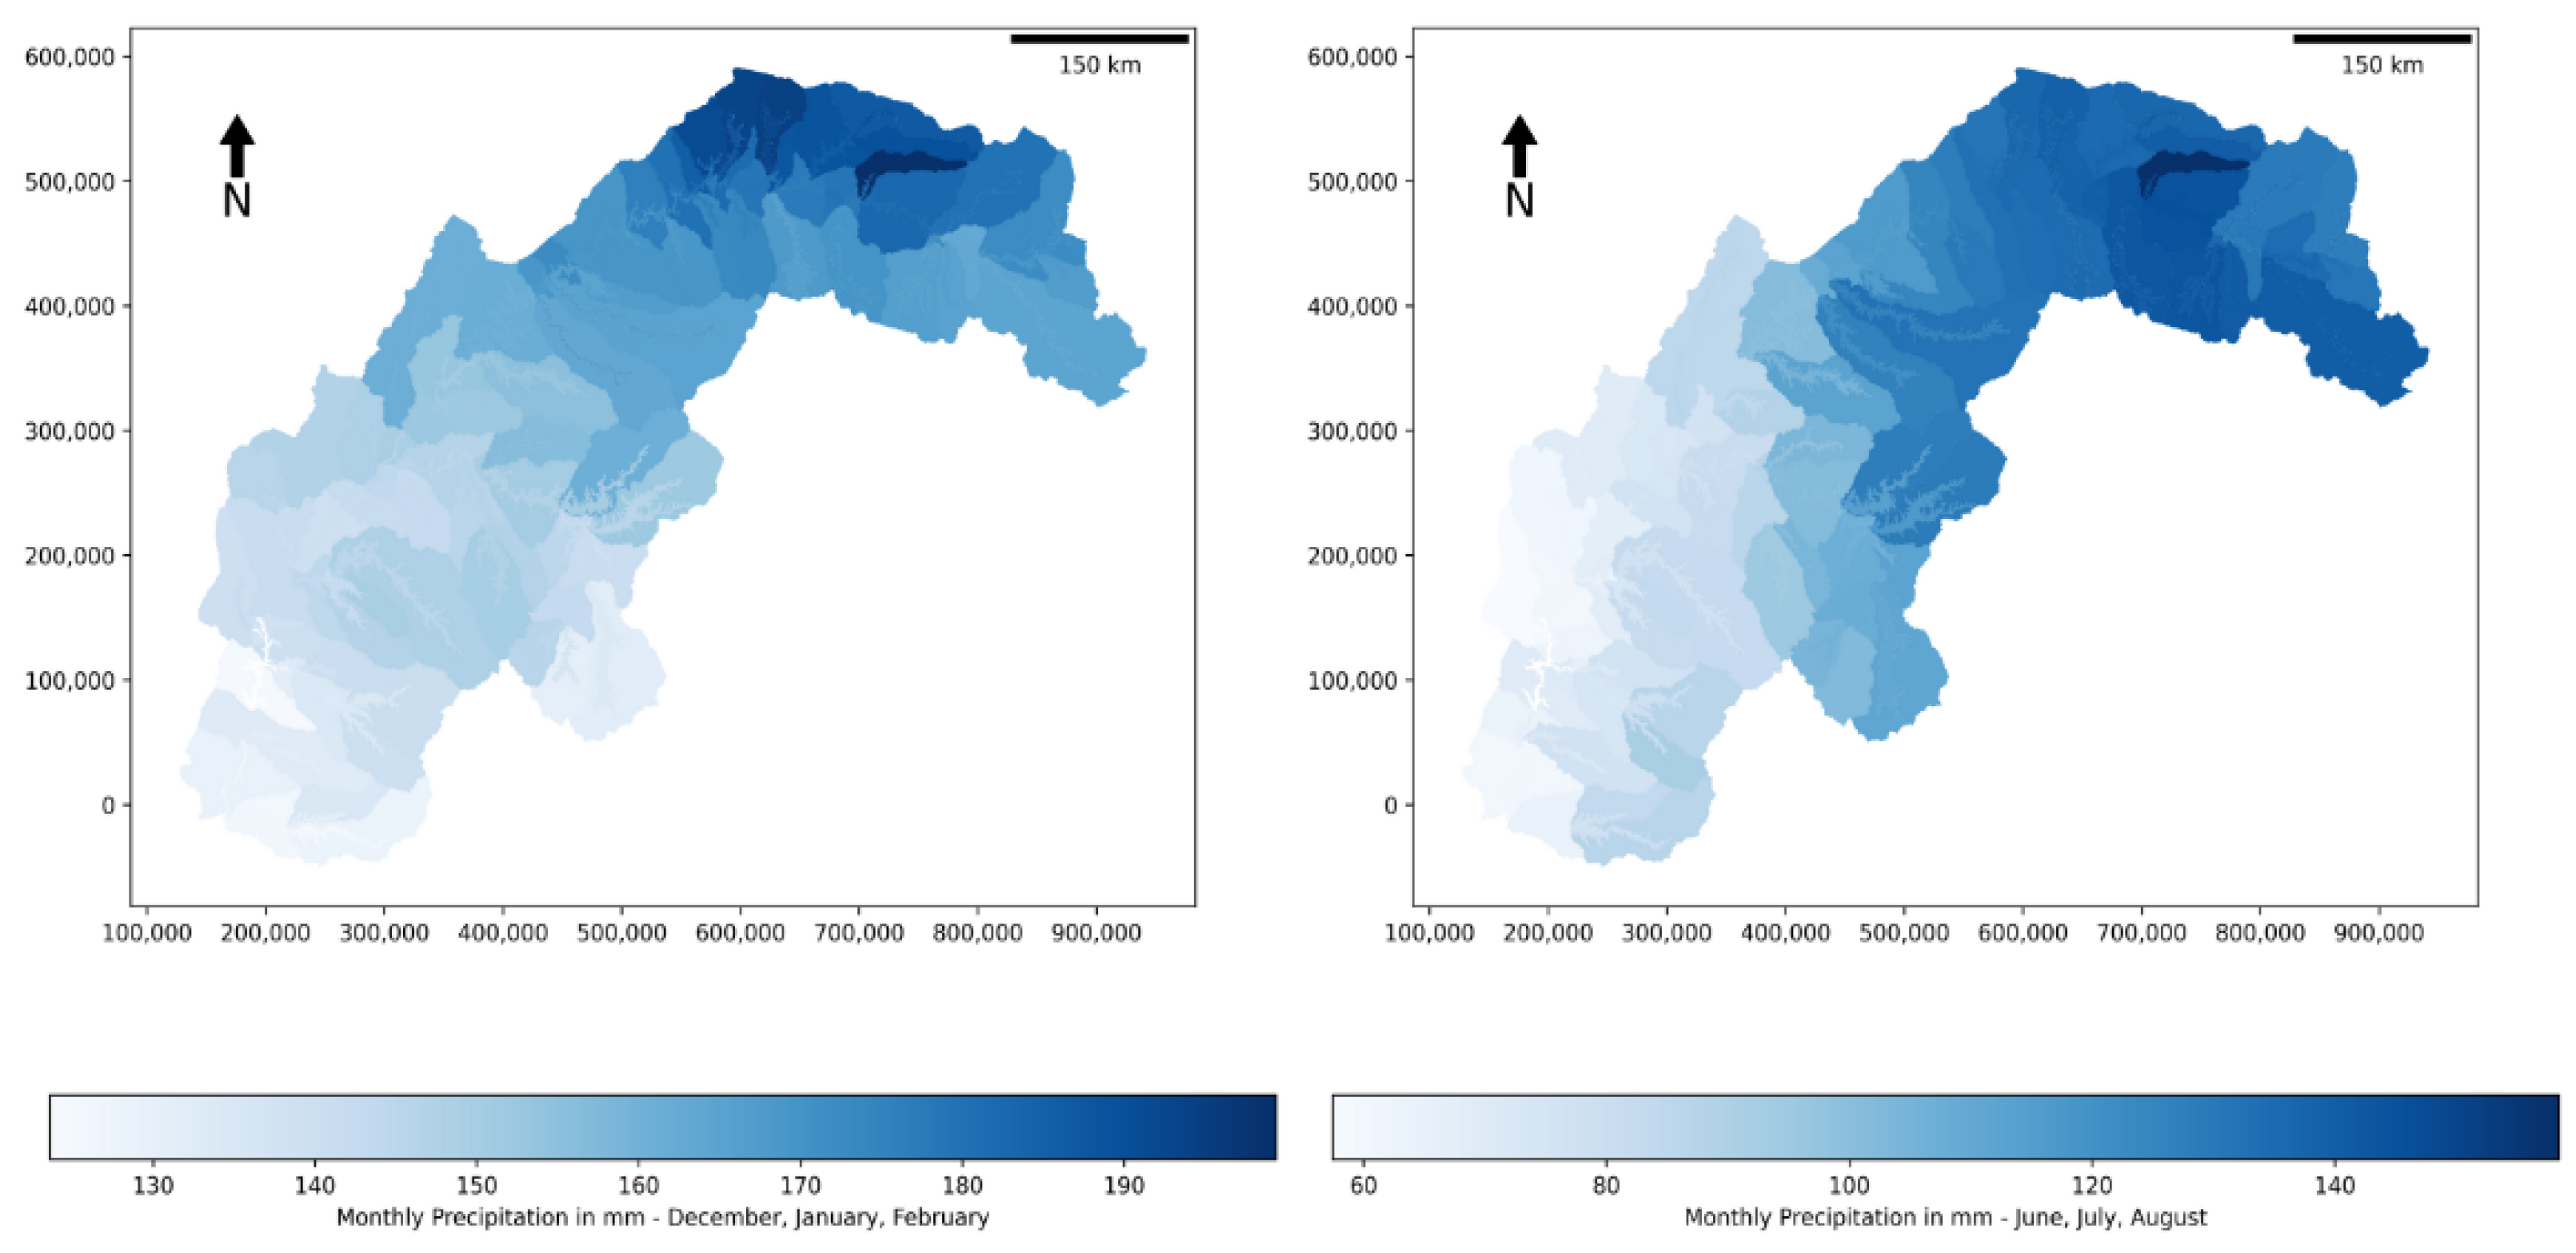
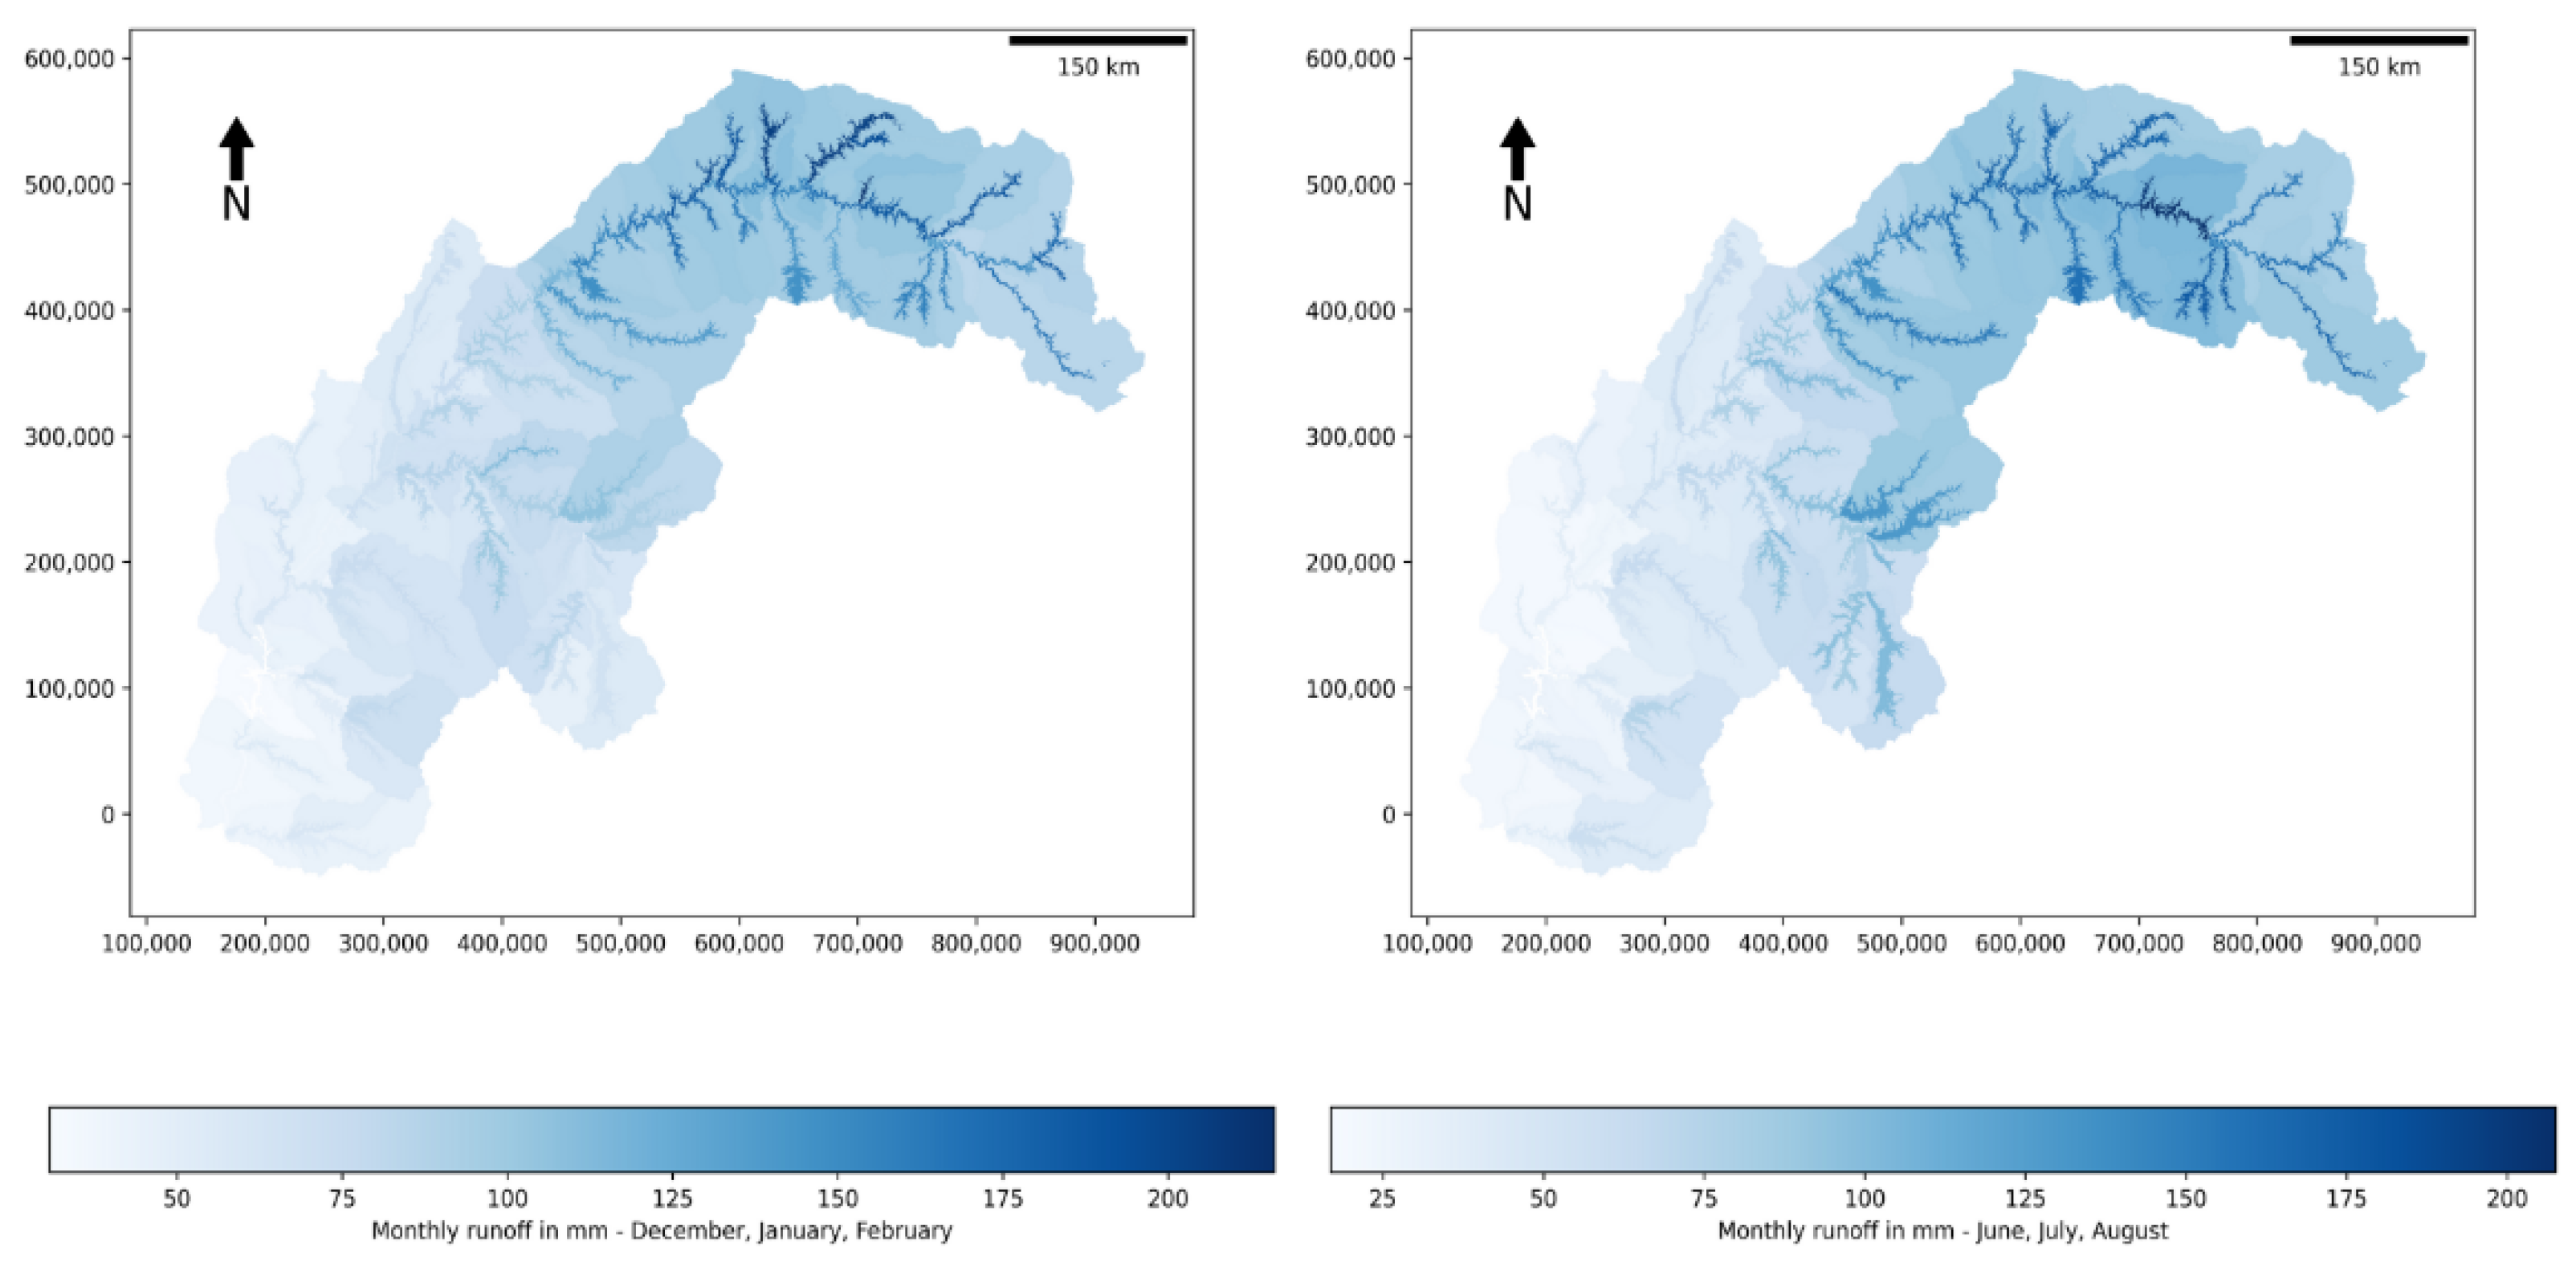
4.2. Spatial Distribution of Water Fluxes
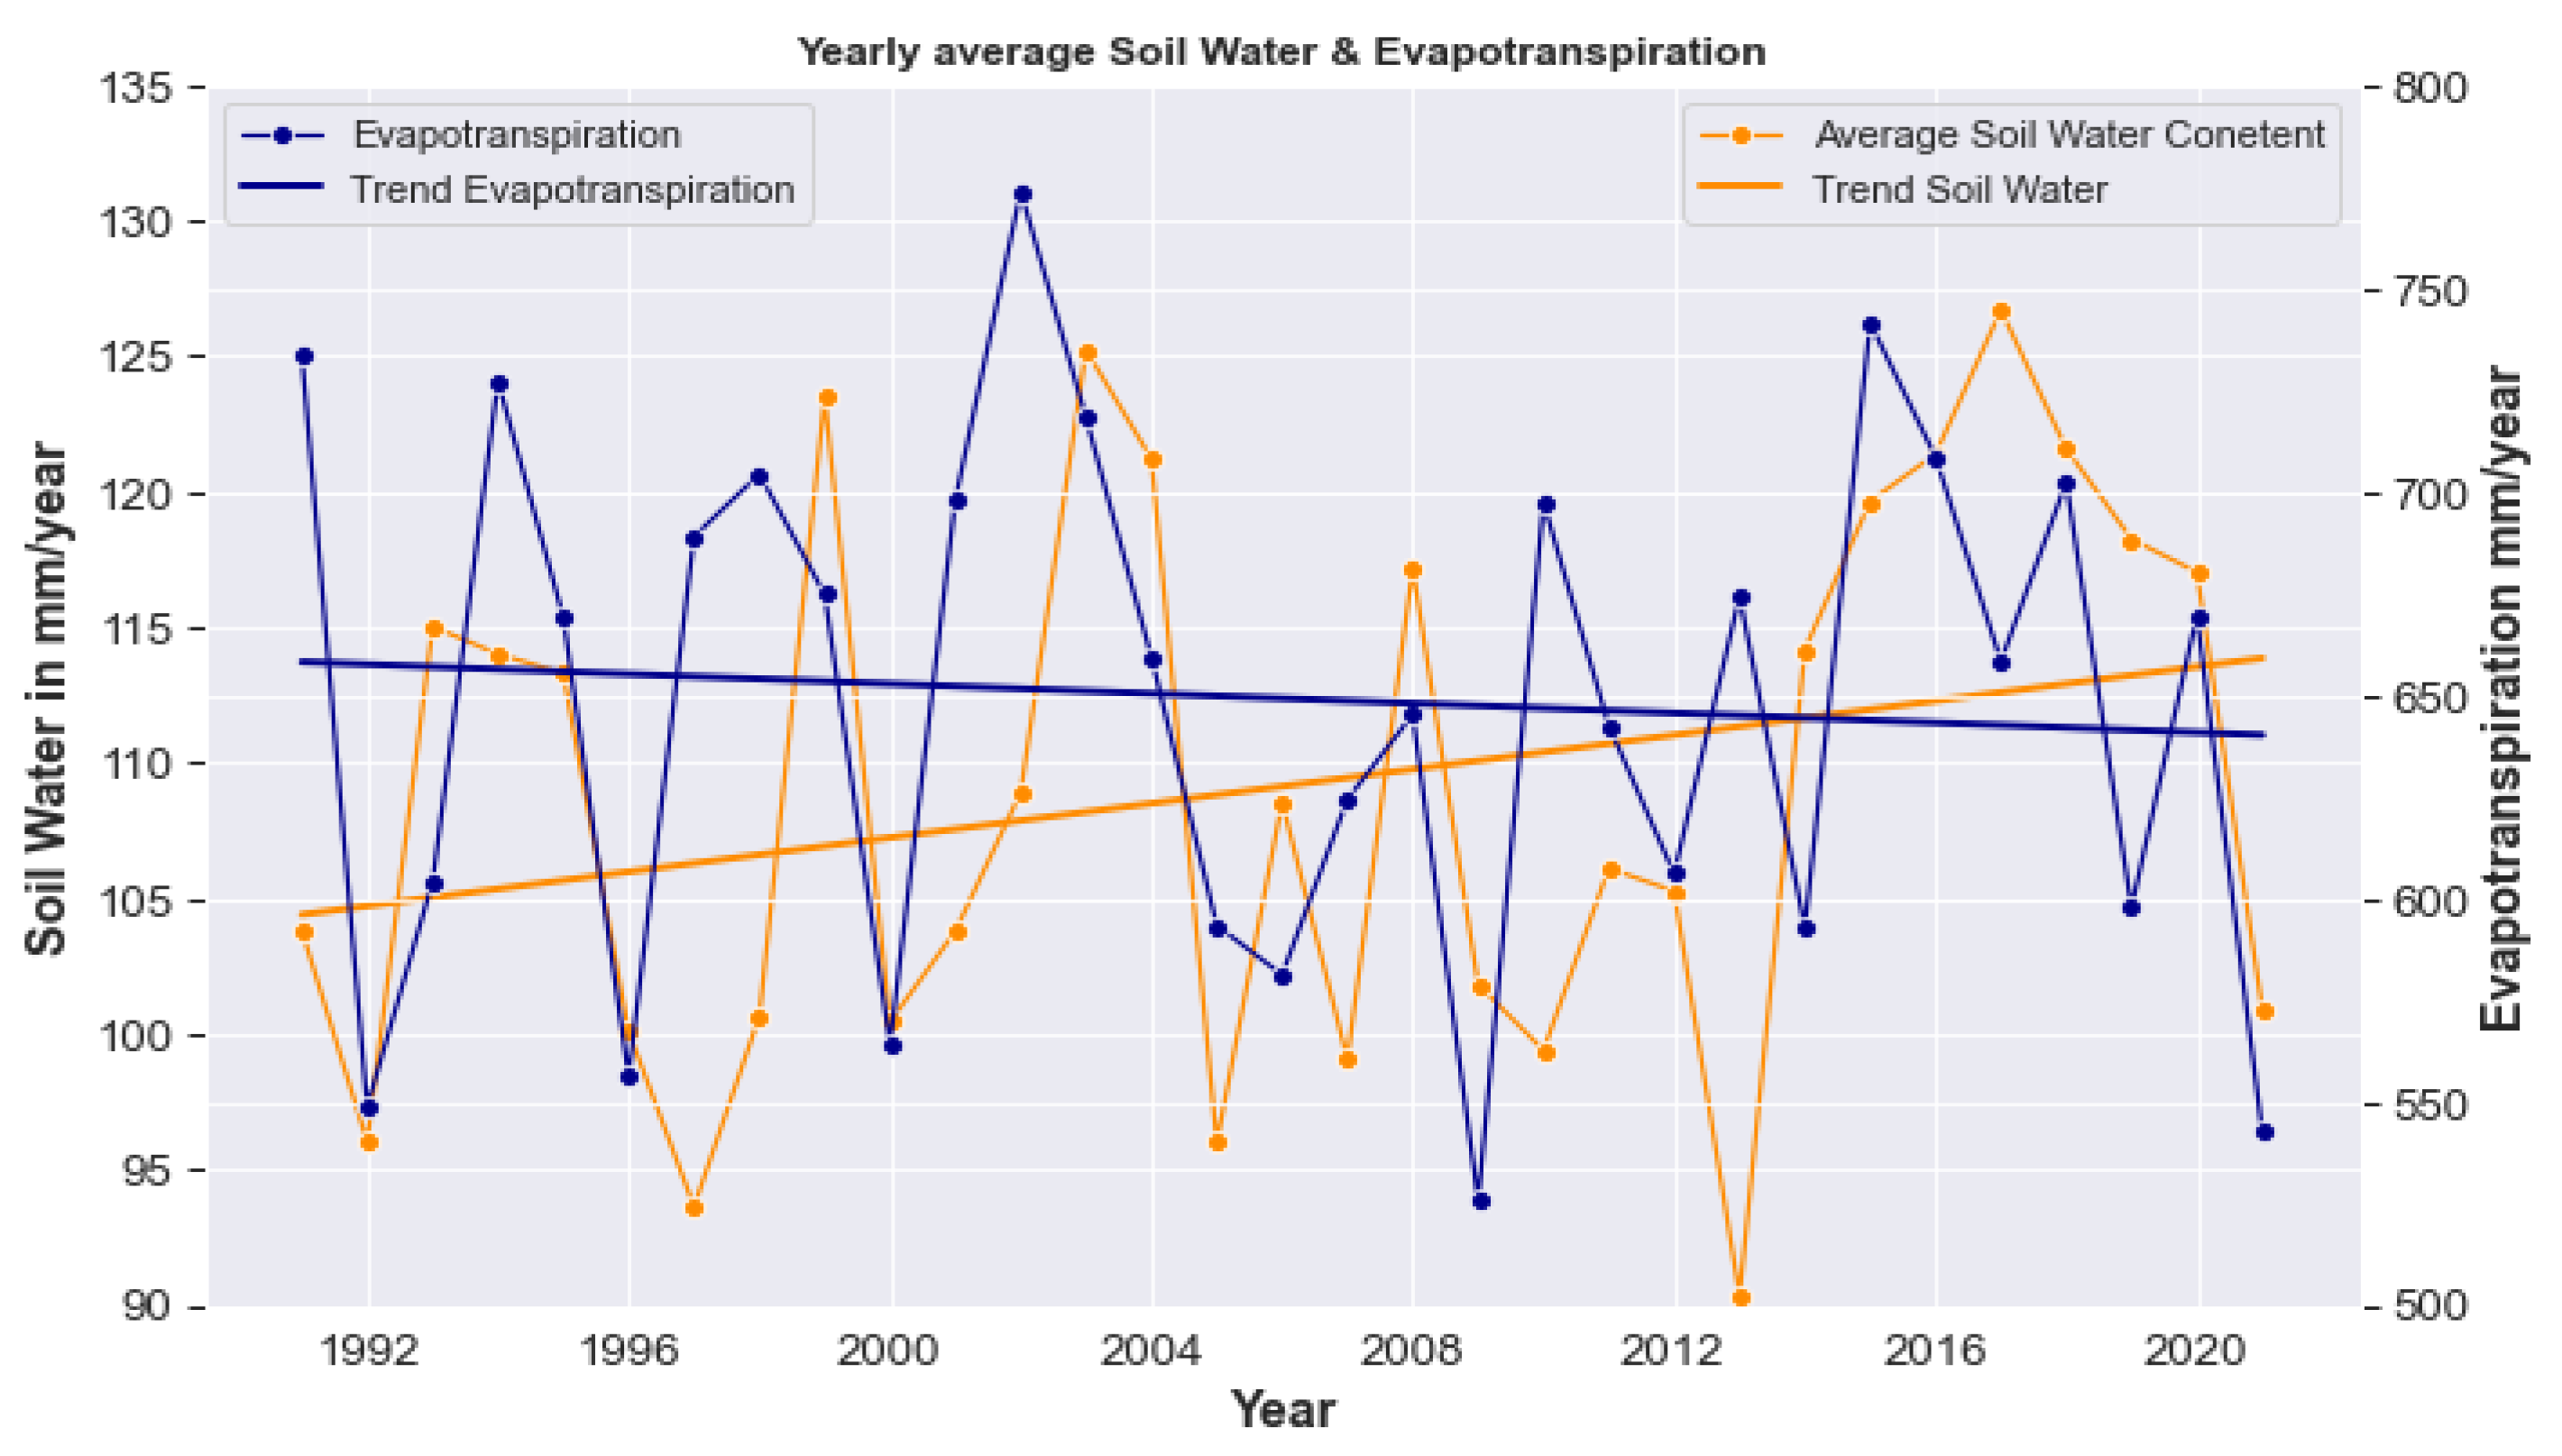
4.3. Annual Variation in the Hydro-Meteorological Components during the Simulation Period (1990–2020)
4.4. Limitations
5. Conclusions
Author Contributions
Funding
Data Availability Statement
Acknowledgments
Conflicts of Interest
References
- Wagner, P.D.; Bieger, K.; Arnold, J.G.; Fohrer, N. Representation of hydrological processes in a rural lowland catchment in Northern Germany using SWAT and SWAT+. Hydrol. Process. 2022, 36, e14589. [Google Scholar] [CrossRef]
- Nkwasa, A.; Chawanda, C.J.; Van Griensven, A. Regionalization of the SWAT+ model for projecting climate change impacts on sediment yield: An application in the Nile basin. J. Hydrol. Reg. Stud. 2022, 42, 101152. [Google Scholar] [CrossRef] [PubMed]
- Jiménez-Navarro, I.C.; Jimeno-Sáez, P.; López-Ballesteros, A.; Pérez-Sánchez, J.; Senent-Aparicio, J. Impact of Climate Change on the Hydrology of the Forested Watershed That Drains to Lake Erken in Sweden: An Analysis Using SWAT+ and CMIP6 Scenarios. Forests 2021, 12, 1803. [Google Scholar] [CrossRef]
- Beven, K. Towards integrated environmental models of everywhere: Uncertainty, data and modelling as a learning process. Hydrol. Earth Syst. Sci. 2007, 11, 460–467. [Google Scholar] [CrossRef]
- Bieger, K.; Arnold, J.G.; Rathjens, H.; White, M.J.; Bosch, D.D.; Allen, P.M.; Volk, M.; Srinivasan, R. Introduction to SWAT+, a completely restructured version of the soil and water assessment tool. JAWRA J. Am. Water Resour. Assoc. 2017, 53, 115–130. [Google Scholar] [CrossRef]
- Chawanda, C.J.; Arnold, J.; Thiery, W.; van Griensven, A. Mass balance calibration and reservoir representations for large-scale hydrological impact studies using SWAT+. Clim. Chang. 2020, 163, 1307–1327. [Google Scholar] [CrossRef]
- Bailey, R.T.; Bieger, K.; Arnold, J.G.; Bosch, D.D. A new physically-based spatially-distributed groundwater flow module for SWAT+. Hydrology 2020, 7, 75. [Google Scholar] [CrossRef]
- Bieger, K.; Arnold, J.G.; Rathjens, H.; White, M.J.; Bosch, D.D.; Allen, P.M. Representing the connectivity of upland areas to floodplains and streams in SWAT+. JAWRA J. Am. Water Resour. Assoc. 2019, 55, 578–590. [Google Scholar] [CrossRef]
- Kiprotich, P.; Wei, X.; Zhang, Z.; Ngigi, T.; Qiu, F.; Wang, L. Assessing the impact of land use and climate change on surface runoff response using gridded observations and swat+. Hydrology 2021, 8, 48. [Google Scholar] [CrossRef]
- Abate, B.Z.; Assefa, T.T.; Tigabu, T.B.; Abebe, W.B.; He, L. Hydrological Modeling of the Kobo-Golina River in the Data-Scarce Upper Danakil Basin, Ethiopia. Sustainability 2023, 15, 3337. [Google Scholar] [CrossRef]
- Pulighe, G.; Lupia, F.; Chen, H.; Yin, H. Modeling climate change impacts on water balance of a Mediterranean watershed using SWAT+. Hydrology 2021, 8, 157. [Google Scholar] [CrossRef]
- Eini, M.R.; Salmani, H.; Piniewski, M. Comparison of process-based and statistical approaches for simulation and projections of rainfed crop yields. Agric. Water Manag. 2023, 277, 108107. [Google Scholar] [CrossRef]
- Eini, M.R.; Massari, C.; Piniewski, M. Satellite-based soil moisture enhances the reliability of agro-hydrological modeling in large transboundary river basins. Sci. Total Environ. 2023, 873, 162396. [Google Scholar] [CrossRef] [PubMed]
- Tan, M.L.; Juneng, L.; Kuswanto, H.; Do, H.X.; Zhang, F. Impacts of Solar Radiation Management on Hydro-Climatic Extremes in Southeast Asia. Water 2023, 15, 1089. [Google Scholar] [CrossRef]
- Xiao, F.; Wang, X.; Fu, C. Impacts of land use/land cover and climate change on hydrological cycle in the Xiaoxingkai Lake Basin. J. Hydrol. Reg. Stud. 2023, 47, 101422. [Google Scholar] [CrossRef]
- Hordofa, A.T.; Leta, O.T.; Alamirew, T.; Chukalla, A.D. Climate Change Impacts on Blue and Green Water of Meki River Sub-Basin. Water Resour. Manag. 2023, 37, 2835–2851. [Google Scholar] [CrossRef]
- Chawanda, C.J.; George, C.; Thiery, W.; Van Griensven, A.; Tech, J.; Arnold, J.; Srinivasan, R. User-friendly workflows for catchment modelling: Towards reproducible SWAT+ model studies. Environ. Model. Softw. 2020, 134, 104812. [Google Scholar] [CrossRef]
- Arnold, J.G.; Bieger, K.; White, M.J.; Srinivasan, R.; Dunbar, J.A.; Allen, P.M. Use of decision tables to simulate management in SWAT+. Water 2018, 10, 713. [Google Scholar] [CrossRef] [Green Version]
- Bailey, R.T.; Abbas, S.; Arnold, J.; White, M.; Gao, J.; Čerkasova, N. Augmenting the National agroecosystem model with physically based spatially distributed groundwater modeling. Environ. Model. Softw. 2023, 160, 105589. [Google Scholar] [CrossRef]
- Yimer, E.A.; Bailey, R.T.; Piepers, L.L.; Nossent, J.; van Griensven, A. Improved representation of groundwater-dominated catchment using SWAT+ gwflow and modifications to the gwflow module. Hydrol. Earth Syst. Sci. Discuss. 2022, 1–18. [Google Scholar] [CrossRef]
- Yimer, E.A.; Riakhi, F.E.; Bailey, R.T.; Nossent, J.; van Griensven, A. The impact of extensive agricultural water drainage on the hydrology of the Kleine Nete watershed, Belgium. Sci. Total Environ. 2023, 885, 163903. [Google Scholar] [CrossRef]
- Rockström, J. On-farm green water estimates as a tool for increased food production in water scarce regions. Phys. Chem. Earth Part D Hydrol. Ocean. Atmos. 1999, 24, 375–383. [Google Scholar] [CrossRef]
- Saurral, R.I.; Barros, V.R.; Lettenmaier, D.P. Land use impact on the Uruguay River discharge. Geophys. Res. Lett. 2008, 35, 12. [Google Scholar] [CrossRef]
- Berbery, E.H.; Barros, V.R. The hydrologic cycle of the La Plata basin in South America. J. Hydrometeorol. 2002, 3, 630–645. [Google Scholar] [CrossRef]
- Tossini, L. Sistema hidrográfico y cuenca del Río de la Plata: Contribución al estudio de su régimen hidrológico. Anales Sociedad Científica Argentina 1959, 167, 41–64. [Google Scholar]
- Arnold, J.G.; Srinivasan, R.; Muttiah, R.S.; Williams, J.R. Large area hydrologic modeling and assessment part I: Model development 1. JAWRA J. Am. Water Resour. Assoc. 1998, 34, 73–89. [Google Scholar] [CrossRef]
- Funk, C.; Peterson, P.; Landsfeld, M.; Pedreros, D.; Verdin, J.; Shukla, S.; Husak, G.; Rowland, J.; Harrison, L.; Hoell, A.; et al. The climate hazards infrared precipitation with stations—A new environmental record for monitoring extremes. Sci. Data 2015, 2, 1–21. [Google Scholar] [CrossRef] [Green Version]
- Hersbach, H.; Bell, B.; Berrisford, P.; Hirahara, S.; Horányi, A.; Muñoz-Sabater, J.; Nicolas, J.; Peubey, C.; Radu, R.; Schepers, D.; et al. The ERA5 global reanalysis. Q. J. R. Meteorol. Soc. 2020, 146, 1999–2049. [Google Scholar] [CrossRef]
- Slack, R.; Welch, R. Soil conservation service runoff curve number estimates from landsat data 1. JAWRA J. Am. Water Resour. Assoc. 1980, 16, 887–893. [Google Scholar] [CrossRef]
- Houska, T.; Kraft, P.; Chamorro-Chavez, A.; Breuer, L. SPOTting model parameters using a ready-made python package. PLoS ONE 2015, 10, e0145180. [Google Scholar] [CrossRef] [Green Version]
- Vrugt, J.A. Markov chain Monte Carlo simulation using the DREAM software package: Theory, concepts, and MATLAB implementation. Environ. Model. Softw. 2016, 75, 273–316. [Google Scholar] [CrossRef] [Green Version]
- Wu, J.; Yen, H.; Arnold, J.G.; Yang, Y.E.; Cai, X.; White, M.J.; Santhi, C.; Miao, C.; Srinivasan, R. Development of reservoir operation functions in SWAT+ for national environmental assessments. J. Hydrol. 2020, 583, 124556. [Google Scholar] [CrossRef]
- Thompson, A.; Baffaut, C.; Lohani, S.; Duriancik, L.; Norfleet, M.; Ingram, K. Purpose, development, and synthesis of the Soil Vulnerability Index for inherent vulnerability classification of cropland soils. J. Soil Water Conserv. 2020, 75, 1–11. [Google Scholar] [CrossRef] [Green Version]
- Moriasi, D.N.; Arnold, J.G.; Van Liew, M.W.; Bingner, R.L.; Harmel, R.D.; Veith, T.L. Model evaluation guidelines for systematic quantification of accuracy in watershed simulations. Trans. ASABE 2007, 50, 885–900. [Google Scholar] [CrossRef]
- Hussain, M.; Mahmud, I. pyMannKendall: A python package for non parametric Mann Kendall family of trend tests. J. Open Source Softw. 2019, 4, 1556. [Google Scholar] [CrossRef]
- Tucci, C.E.M.; Clarke, R.T.; Collischonn, W.; da Silva Dias, P.L.; de Oliveira, G.S. Long-term flow forecasts based on climate and hydrologic modeling: Uruguay River basin. Water Resour. Res. 2003, 39, 7. [Google Scholar] [CrossRef] [Green Version]
- Guizzardi, S.; Gerbec, M.S. Modelación Hidrológica e Hidrodinámica del Río Uruguay. In Proceedings of the Conagua 2017, Córdoba, Argentina, 20–23 September 2017. [Google Scholar]
- Su, F.; Lettenmaier, D.P. Estimation of the surface water budget of the La Plata Basin. J. Hydrometeorol. 2009, 10, 981–998. [Google Scholar] [CrossRef]
- Gudmundsson, L.; Wagener, T.; Tallaksen, L.; Engeland, K. Evaluation of nine large-scale hydrological models with respect to the seasonal runoff climatology in Europe. Water Resour. Res. 2012, 48, 11. [Google Scholar] [CrossRef]
- Srivastava, P.; McNair, J.N.; Johnson, T.E. Comparison of process-based and artificial neural network approaches for streamflow modeling in an agricultural watershed. JAWRA J. Am. Water Resour. Assoc. 2006, 42, 545–563. [Google Scholar] [CrossRef]
- Wu, K.; Johnston, C.A. Hydrologic response to climatic variability in a Great Lakes Watershed: A case study with the SWAT model. J. Hydrol. 2007, 337, 187–199. [Google Scholar] [CrossRef]
- Pfannerstill, M.; Bieger, K.; Guse, B.; Bosch, D.D.; Fohrer, N.; Arnold, J.G. How to constrain multi-objective calibrations of the SWAT model using water balance components. JAWRA J. Am. Water Resour. Assoc. 2017, 53, 532–546. [Google Scholar] [CrossRef]
- Nkwasa, A.; Chawanda, C.J.; Jägermeyr, J.; Van Griensven, A. Improved representation of agricultural land use and crop management for large-scale hydrological impact simulation in Africa using SWAT+. Hydrol. Earth Syst. Sci. 2022, 26, 71–89. [Google Scholar] [CrossRef]
- Míguez, D. Breve reseña sobre el Río Uruguay. INNOTEC 2007, 2, 7–9. [Google Scholar]
- Metcalfe, C.D.; Collins, P.; Menone, M.L.; Tundisi, J.G. The Paraná River Basin: Managing Water Resources to Sustain Ecosystem Services; Routledge: London, UK, 2020. [Google Scholar]







| Gauge | Mean | Standard Deviation | Median | Asymmetry |
|---|---|---|---|---|
| Salto Grande | 6213.17 | 3830.18 | 5220.49 | 1.26 |
| Santo Tomé | 4949.86 | 3444.33 | 4153.01 | 1.33 |
| Río Grande | 1410.01 | 982.49 | 1104.18 | 1.39 |
| Name | Conds | Alts | Acts | ||||||||
|---|---|---|---|---|---|---|---|---|---|---|---|
| Salto | 5 | 7 | 5 | ||||||||
| Variable | Object | lim_var | lim_op | lim_const | alt1 | alt2 | alt3 | alt4 | alt5 | alt6 | alt7 |
| volume | res | e-pv | * | −14.92 | > | > | > | - | - | - | - |
| volume | res | e-pv | * | 0.005 | < | < | < | > | > | > | - |
| volume | res | e-pv | * | 0.93 | - | - | - | < | < | < | > |
| month | null | null | * | 5.86 | < | - | > | < | - | > | - |
| month | null | null | * | 10.06 | - | > | < | - | > | < | - |
| Action | Object | Name | Option | Constant | Constant 2 | fp | Outcome | ||||
| release | res | multiple_use_fl | dyrt | 195 | 0.17 | con1 | y y n n n n n | ||||
| release | res | multiple_use_nf | dyrt | 45 | 0.29 | con1 | n n y n n n n | ||||
| release | res | sfl_cont+mu_fl | dyrt | 15 | 3.00 | con2 | n n n y y n n | ||||
| release | res | sfl_cont+mu_nf | dyrt | 25 | 4.93 | con2 | n n n n n y n | ||||
| release | res | efc_cont | dyrt | 5 | 5.16 | con3 | n n n n n n y |
| Parameter | Description | Min | Max | Change | Final Value |
|---|---|---|---|---|---|
| flo_min | Threshold required for return flow to occur (meters) | 10 | 15 | absval | 10.03 |
| alpha | Baseflow recession constant (days) | 0.01 | 2.0 | absval | 1.97 |
| sp_yld | Ratio of the volume of water drained by gravity (fraction) | 0.10 | 0.20 | absval | 0.15 |
| esco | Soil evaporation coefficient | 0 | 1 | absval | 0.99 |
| epco | Plant uptake coefficient | 0 | 1 | absval | 0.90 |
| awc | Available water capacity of the soil layer (mm H2O/mm) | −0.09 | −0.30 | abschg | −0.24 |
| cn3_swf | Soil water factor for the curve number condition III | −0.30 | −0.10 | abschg | −0.25 |
| cn2 | Curve number condition II | 0.05 | 0.15 | abschg | 0.10 |
| canmx | Maximum canopy storage (mm H2O) | −0.10 | −0.35 | abschg | −0.29 |
| chw | Channel width (meters) | −0.10 | −0.30 | abschg | −0.15 |
| k | Saturated hydraulic conductivity (mm/h) | −0.1 | −0.7 | abschg | −0.49 |
| bf_max | Baseflow rate (mm) | 0.1 | 2.0 | absval | 1.98 |
| surlag | Surface runoff lag coefficient | 0.9 | 0.1 | abschg | 0.50 |
| Calibration | |||
|---|---|---|---|
| Objective Function | Salto Grande | Santo Tomé | Rio Grande |
| NSE | 0.62 | 0.65 | 0.77 |
| PBIAS | −22.01 | −17.02 | −7.61 |
| COR | 0.89 | 0.88 | 0.93 |
| KGE | 0.60 | 0.60 | 0.63 |
| Validation | |||
| NSE | 0.63 | 0.62 | 0.70 |
| PBIAS | −24.73 | −7.05 | −5.59 |
| COR | 0.92 | 0.80 | 0.86 |
| KGE | 0.60 | 0.68 | 0.65 |
| Variable | Description | Value |
|---|---|---|
| pcp | Precipitation | 1689.13 |
| ET | Evapotranspiration | 739.73 |
| Runoff generated from the landscape | 933.64 | |
| Runoff from upland to the floodplain | 83.81 | |
| latq | Lat. flow from landscape | 38.83 |
| Lat. flow from upland to the floodplain | 34.30 | |
| perco | Percolation | 91.86 |
| wateryld | Water yield | 972.47 |
| Obs * | Observed flow at Salto Grande (outlet) | 990.34 |
| Variable | Z (Trend) | p-Value | Sen’s Slope |
|---|---|---|---|
| Precipitation DJF | no trend | 0.37 | 3.90 |
| Precipitaion JJA | no trend | 0.65 | 1.11 |
| Avg. Temp DJF | increasing | 0.007 | 0.09 |
| Avg. Temp JJA | no trend | 0.88 | 0.03 |
| Runoff DJF | no trend | 0.26 | 2.72 |
| Runoff JJA | no trend | 0.94 | 0.47 |
| ET DJF | increasing | 0.03 | 1.97 |
| ET JJA | no trend | 0.16 | 0.37 |
| Soil Water DJF | no trend | 0.08 | 1.09 |
| Soil Water JJA | increasing | 0.04 | 1.13 |
Disclaimer/Publisher’s Note: The statements, opinions and data contained in all publications are solely those of the individual author(s) and contributor(s) and not of MDPI and/or the editor(s). MDPI and/or the editor(s) disclaim responsibility for any injury to people or property resulting from any ideas, methods, instructions or products referred to in the content. |
© 2023 by the authors. Licensee MDPI, Basel, Switzerland. This article is an open access article distributed under the terms and conditions of the Creative Commons Attribution (CC BY) license (https://creativecommons.org/licenses/by/4.0/).
Share and Cite
Barresi Armoa, O.L.; Sauvage, S.; Houska, T.; Bieger, K.; Schürz, C.; Sánchez Pérez, J.M. Representation of Hydrological Components under a Changing Climate—A Case Study of the Uruguay River Basin Using the New Version of the Soil and Water Assessment Tool Model (SWAT+). Water 2023, 15, 2604. https://doi.org/10.3390/w15142604
Barresi Armoa OL, Sauvage S, Houska T, Bieger K, Schürz C, Sánchez Pérez JM. Representation of Hydrological Components under a Changing Climate—A Case Study of the Uruguay River Basin Using the New Version of the Soil and Water Assessment Tool Model (SWAT+). Water. 2023; 15(14):2604. https://doi.org/10.3390/w15142604
Chicago/Turabian StyleBarresi Armoa, Osvaldo Luis, Sabine Sauvage, Tobias Houska, Katrin Bieger, Christoph Schürz, and José Miguel Sánchez Pérez. 2023. "Representation of Hydrological Components under a Changing Climate—A Case Study of the Uruguay River Basin Using the New Version of the Soil and Water Assessment Tool Model (SWAT+)" Water 15, no. 14: 2604. https://doi.org/10.3390/w15142604
APA StyleBarresi Armoa, O. L., Sauvage, S., Houska, T., Bieger, K., Schürz, C., & Sánchez Pérez, J. M. (2023). Representation of Hydrological Components under a Changing Climate—A Case Study of the Uruguay River Basin Using the New Version of the Soil and Water Assessment Tool Model (SWAT+). Water, 15(14), 2604. https://doi.org/10.3390/w15142604


