
Profitability Analysis of Selected Low Impact Development Methods for Decentralised Rainwater Management: A Case Study from Lublin Region, Poland


Abstract
1. Introduction
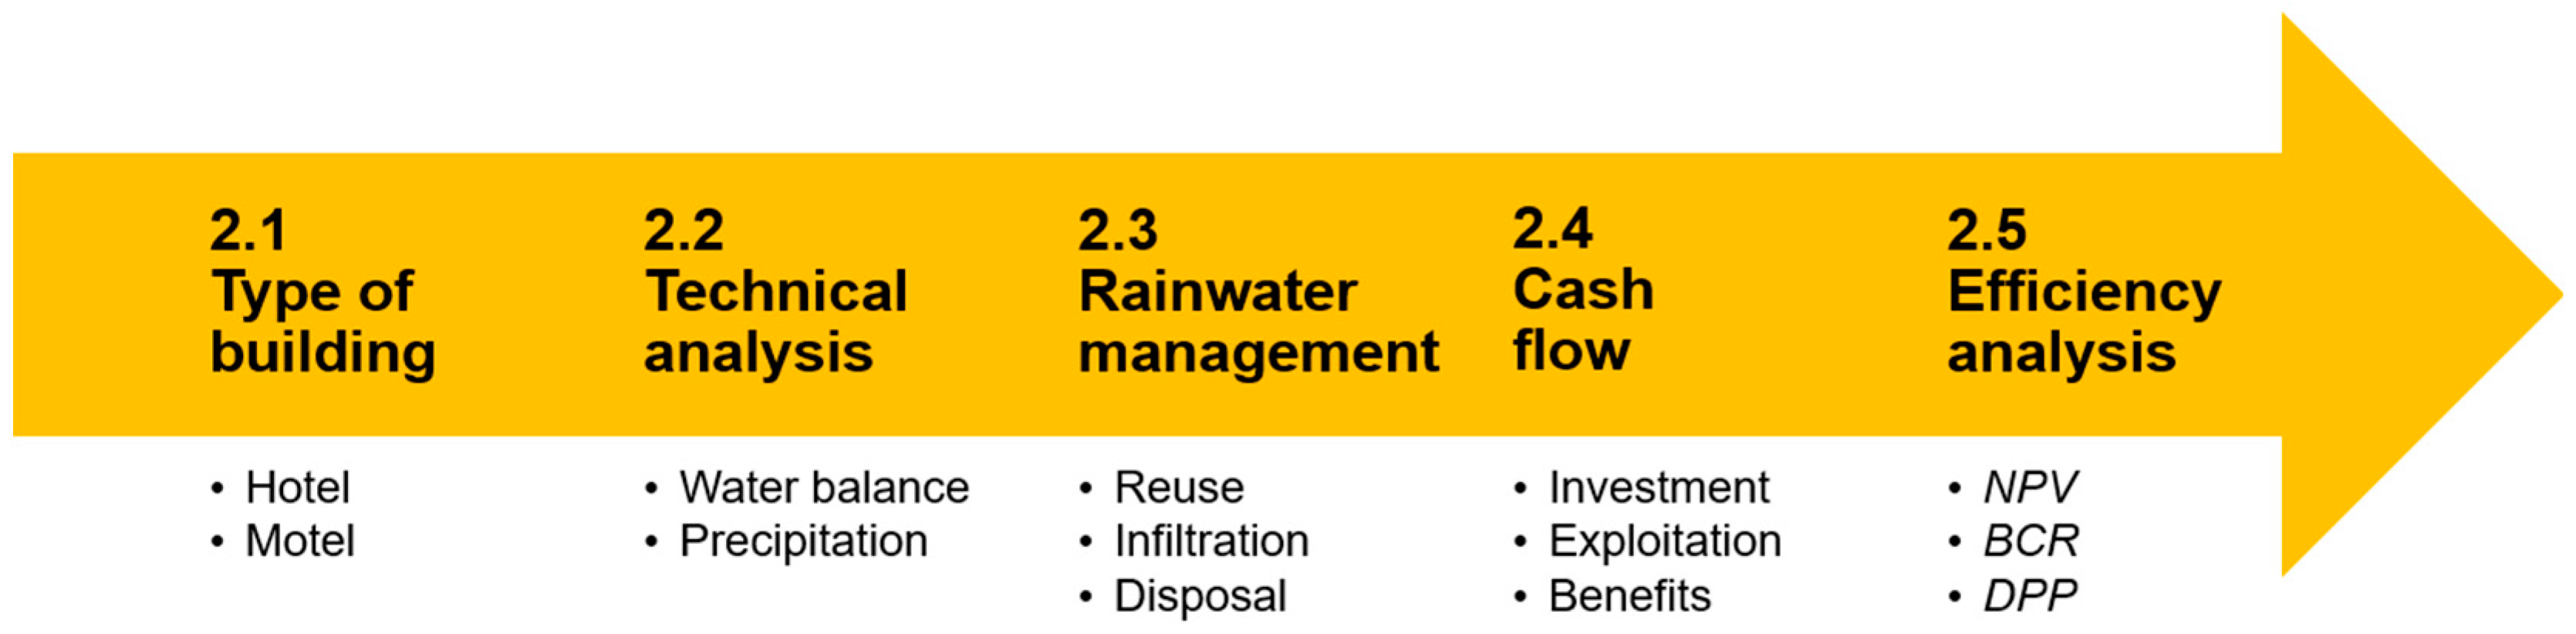
2. Materials and Methods
2.1. Buildings Description
2.2. Technical Analysis
2.3. Methods for Rainwater Management
- MRM I: a dual installation system with rainwater harvesting;
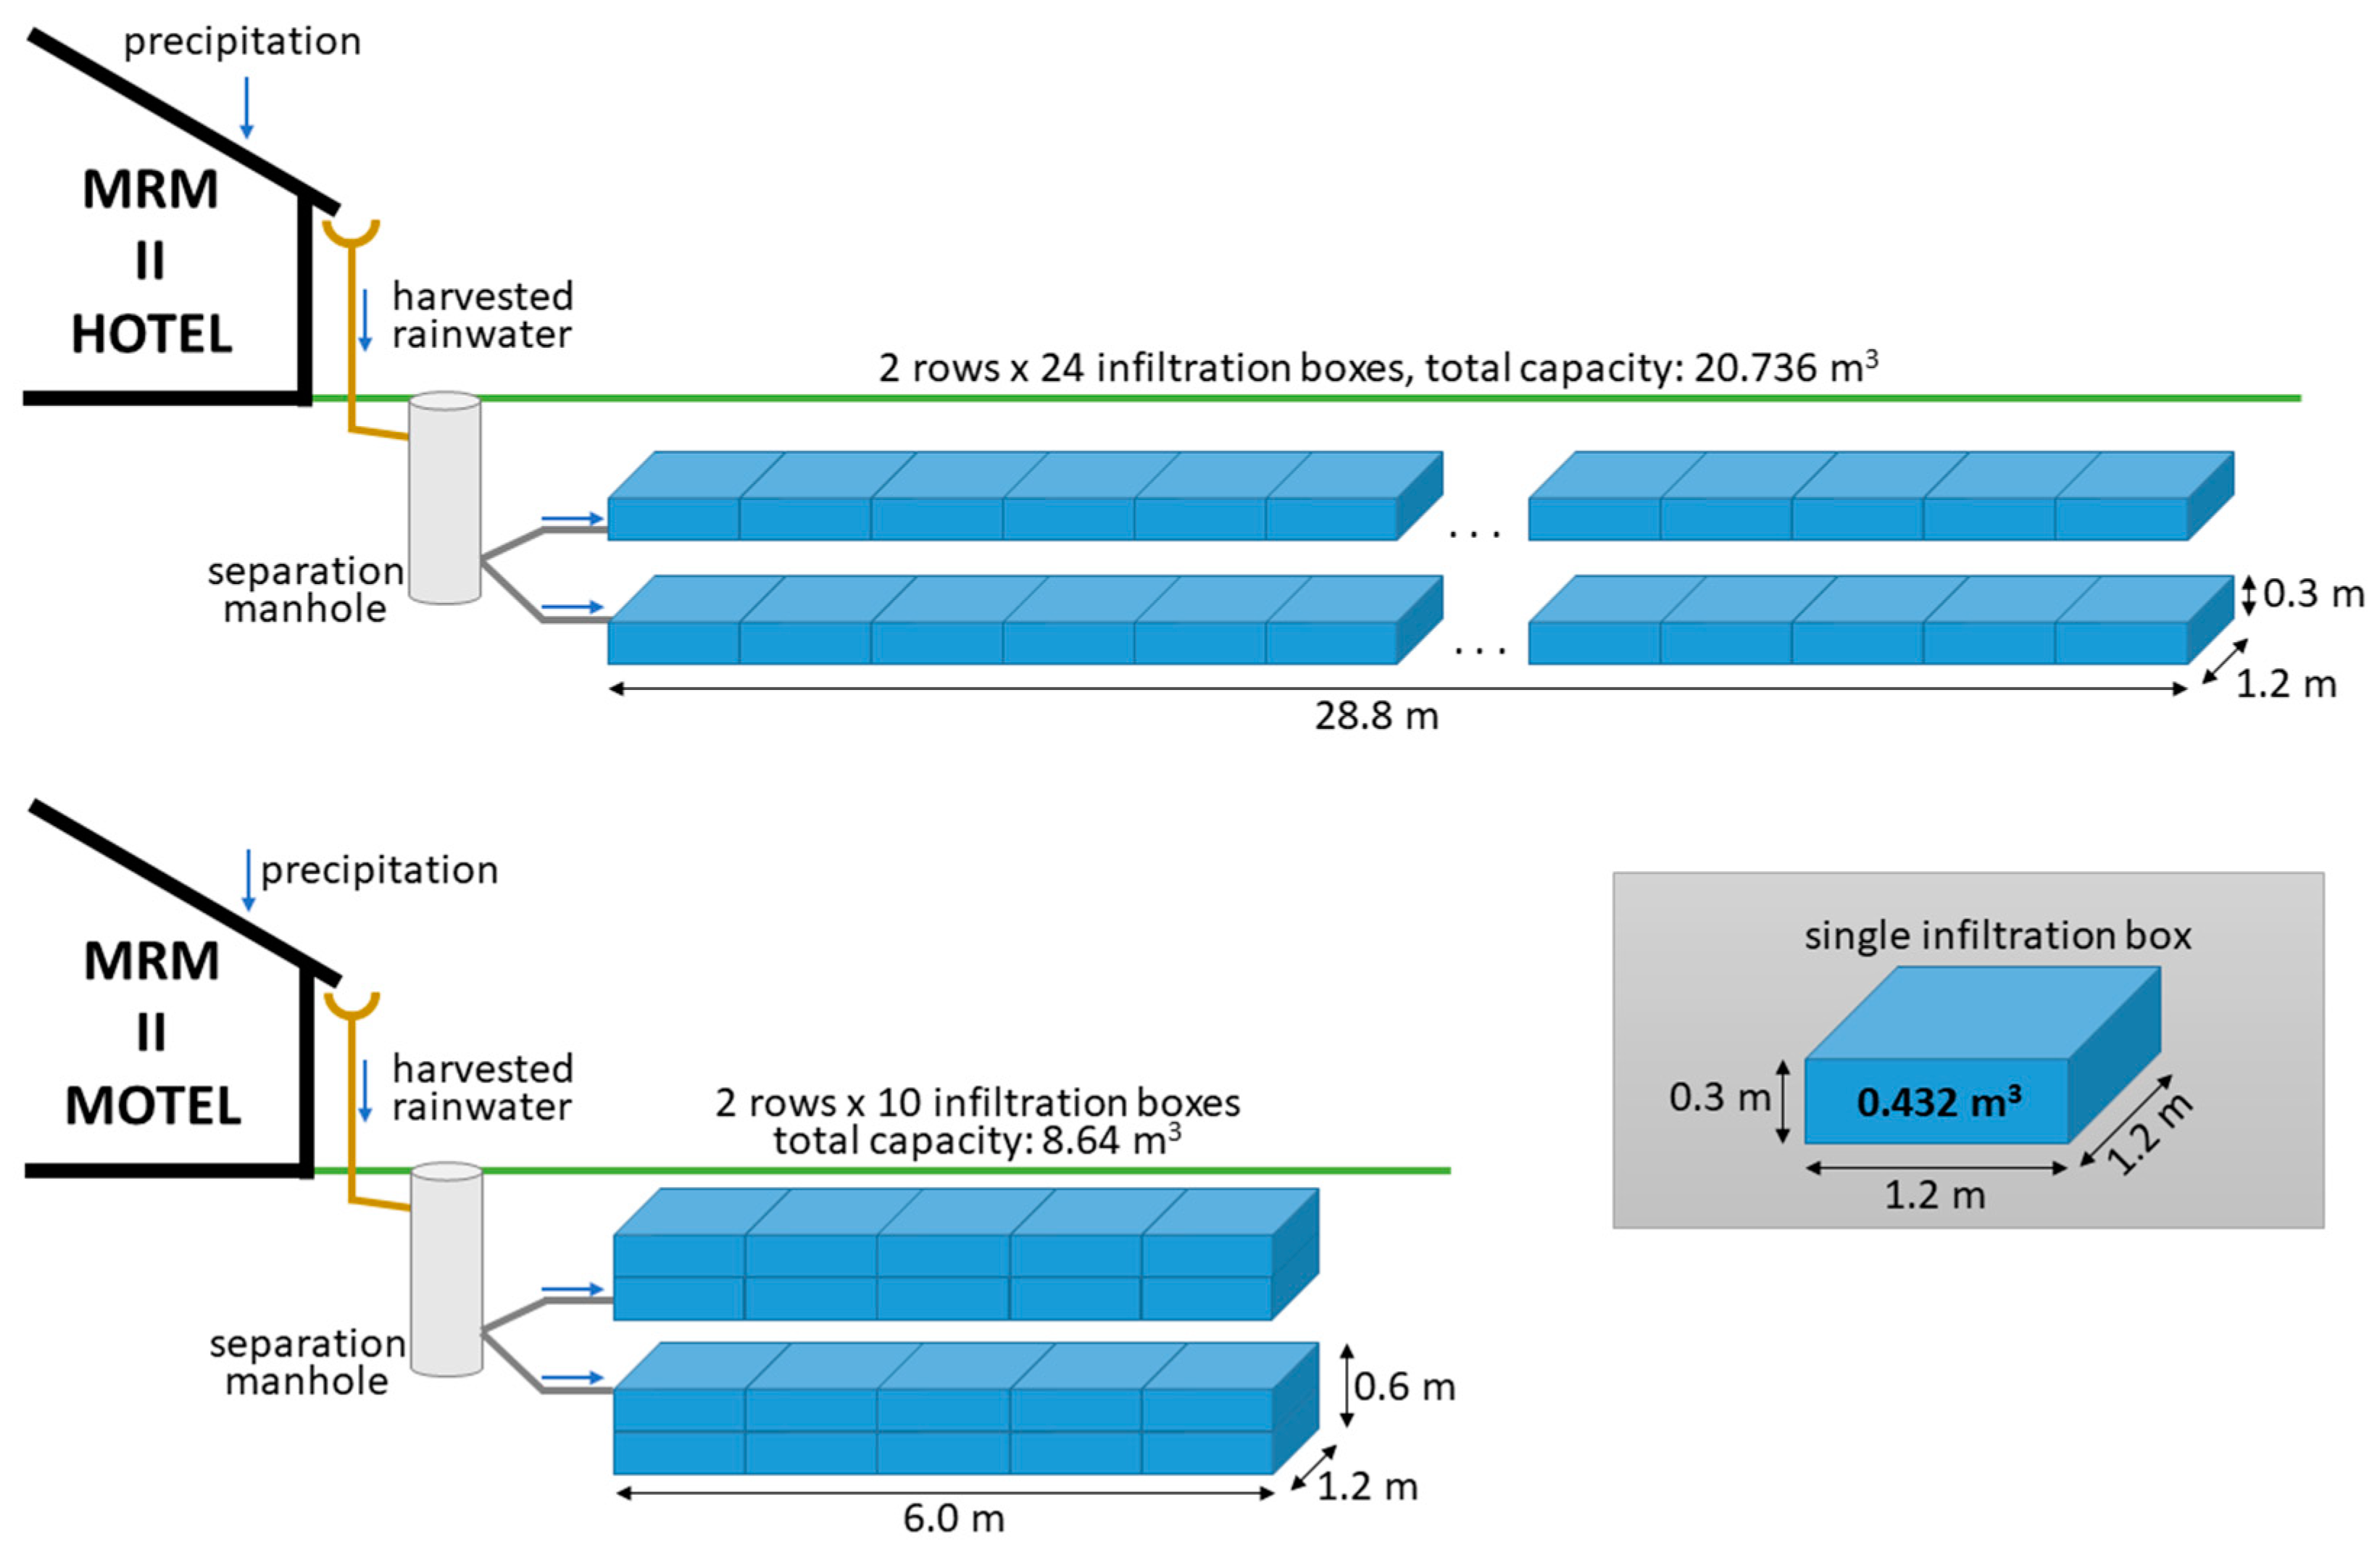
- MRM II: local management using infiltration boxes;
- MRM III: local management using infiltration tunnels;
- MRM IV: disposal to a stormwater system.
2.3.1. A Dual Installation System (MRM I)
2.3.2. Local Management Using Infiltration Boxes (MRM II)
2.3.3. Local Management Using Infiltration Tunnels (MRM III)
2.3.4. Stormwater System (MRM IV)
2.4. Cash Flows Analysis
2.4.1. Investment Costs
- MRM I—storage tank: EUR 4725 for the hotel and EUR 2484 for the motel;
- MRM II—400-L infiltration box (1 pc.): EUR 154;
- MRM III—620-L infiltration tunnel (1 pc.): EUR 202;
- MRM IV—inspection manhole DN 315 (1 pc.): EUR 179.
2.4.2. Exploitation Costs
2.4.3. Benefits
2.5. Efficiency Analysis
3. Results and Discussion
3.1. Technical Analysis
3.2. Cash Flows Analysis
3.2.1. Investment Costs
3.2.2. Exploitation Costs
3.2.3. Benefits
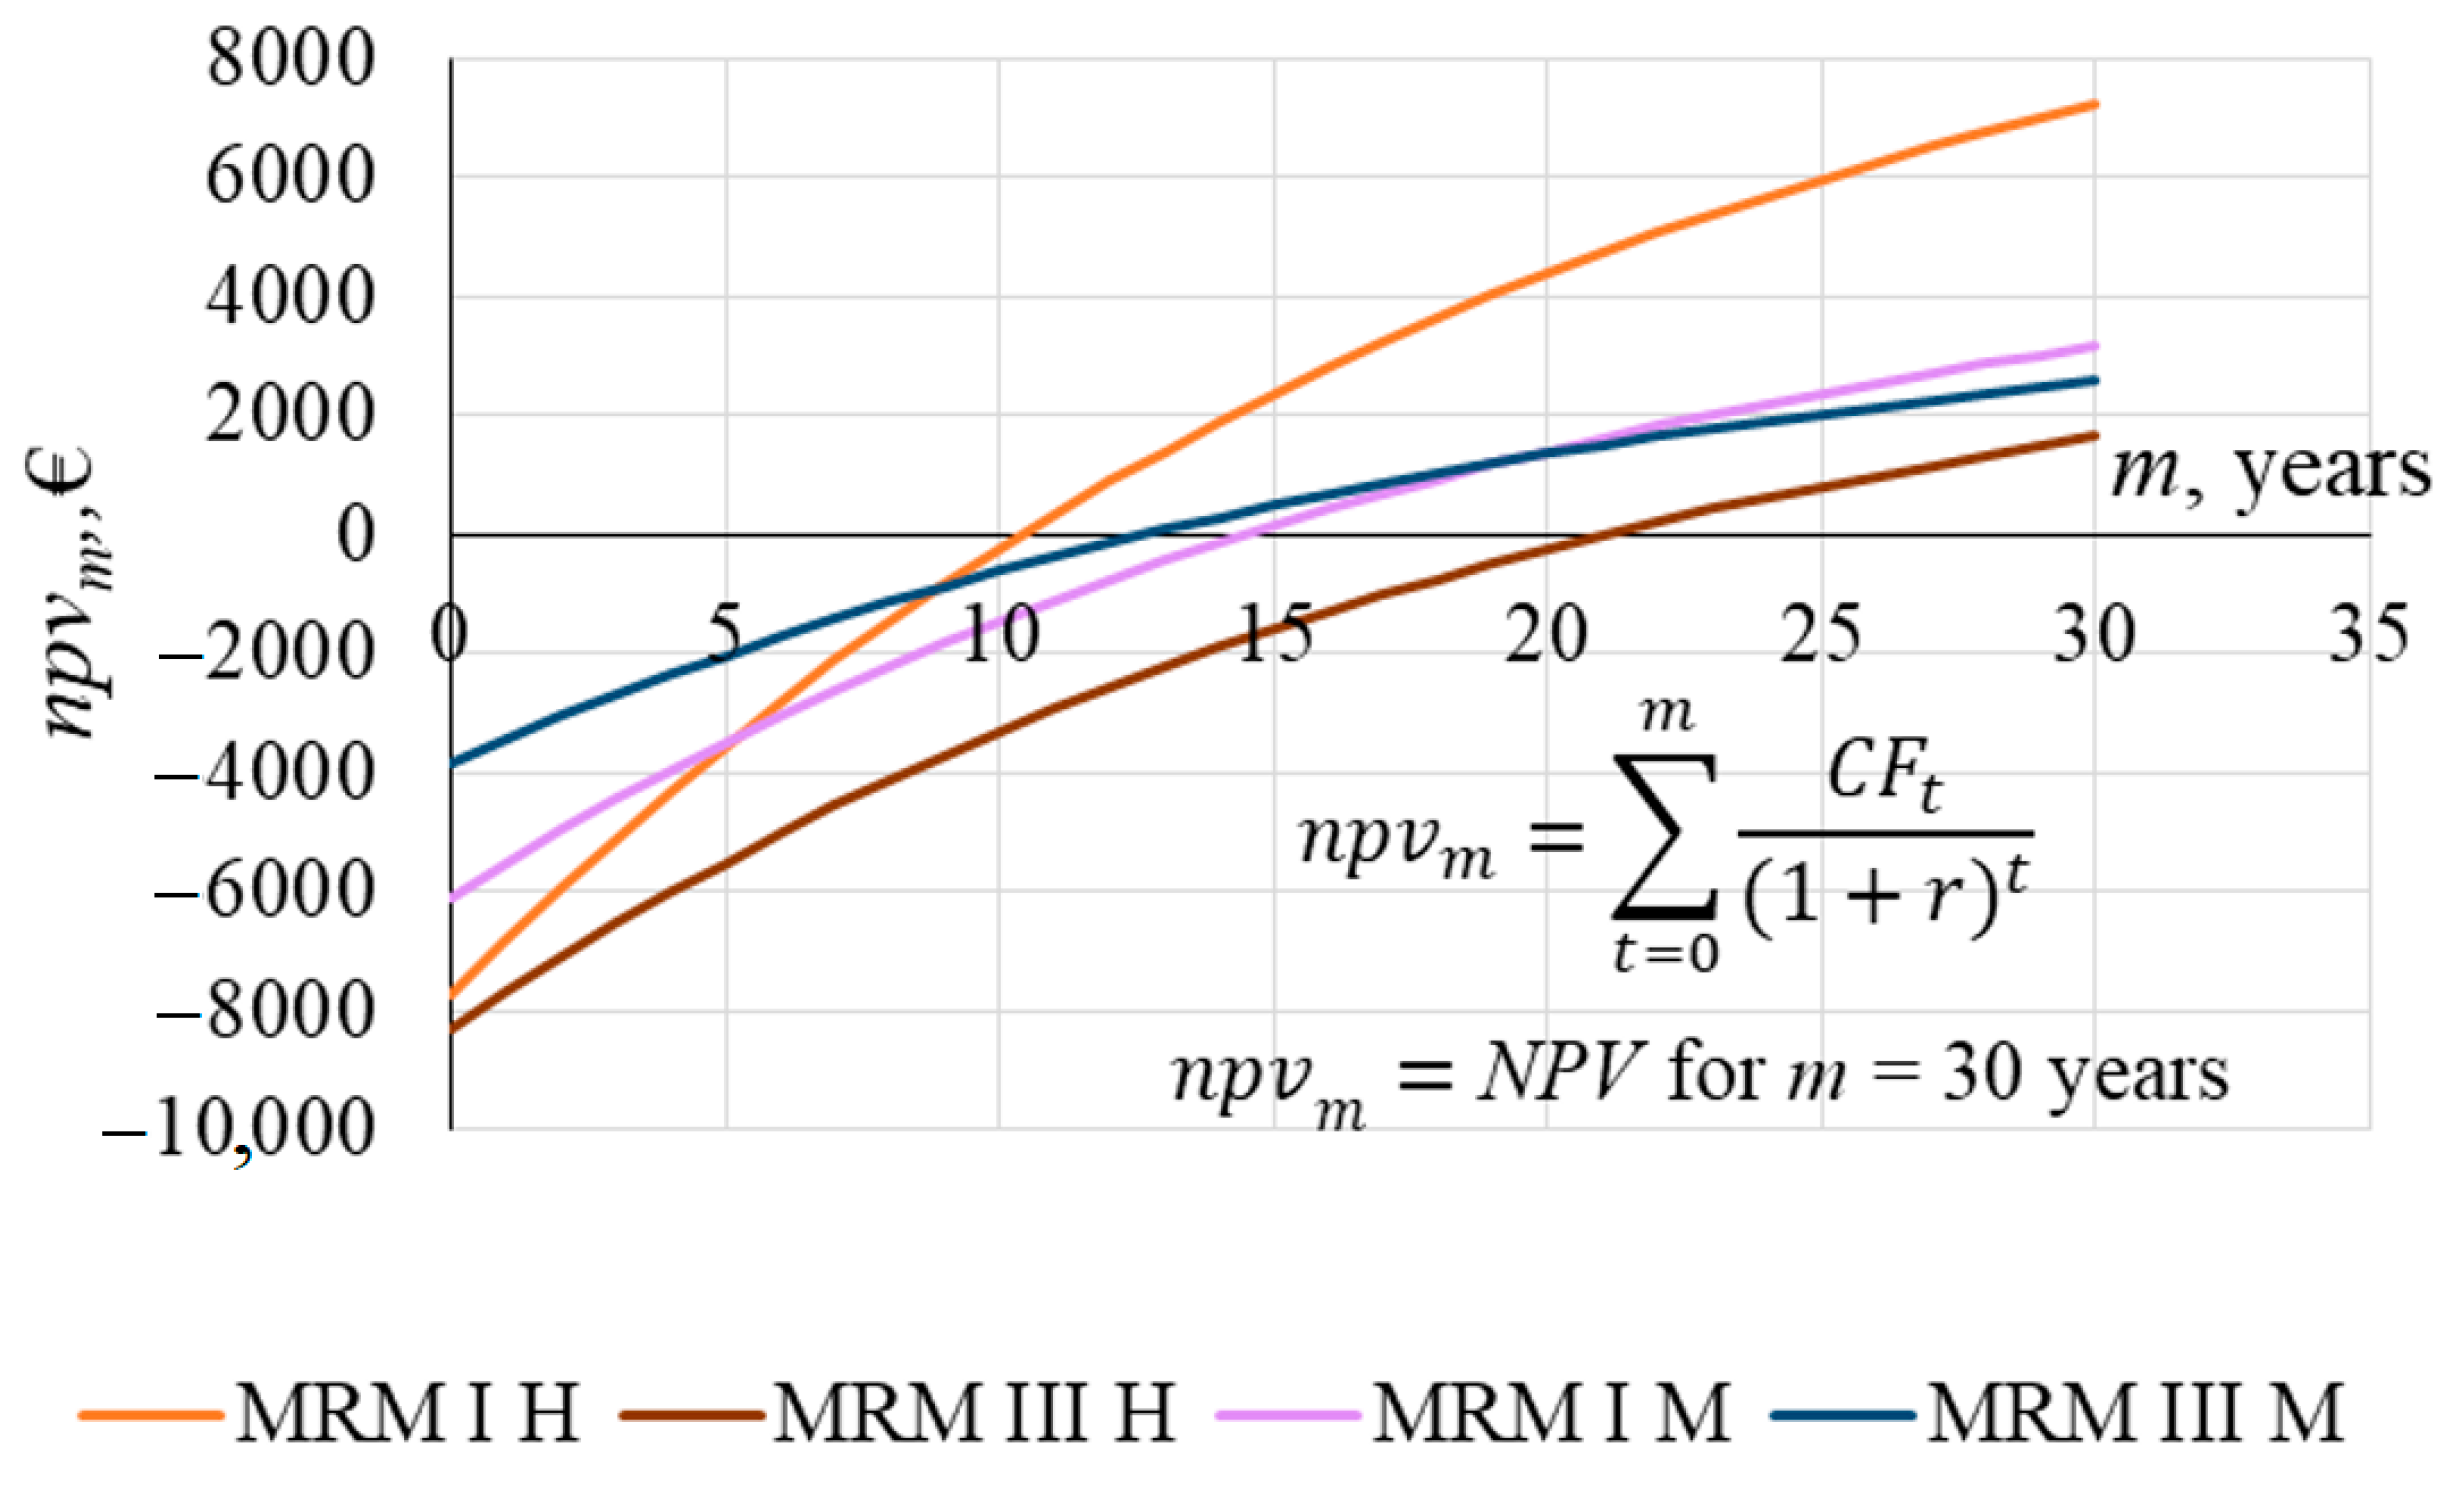
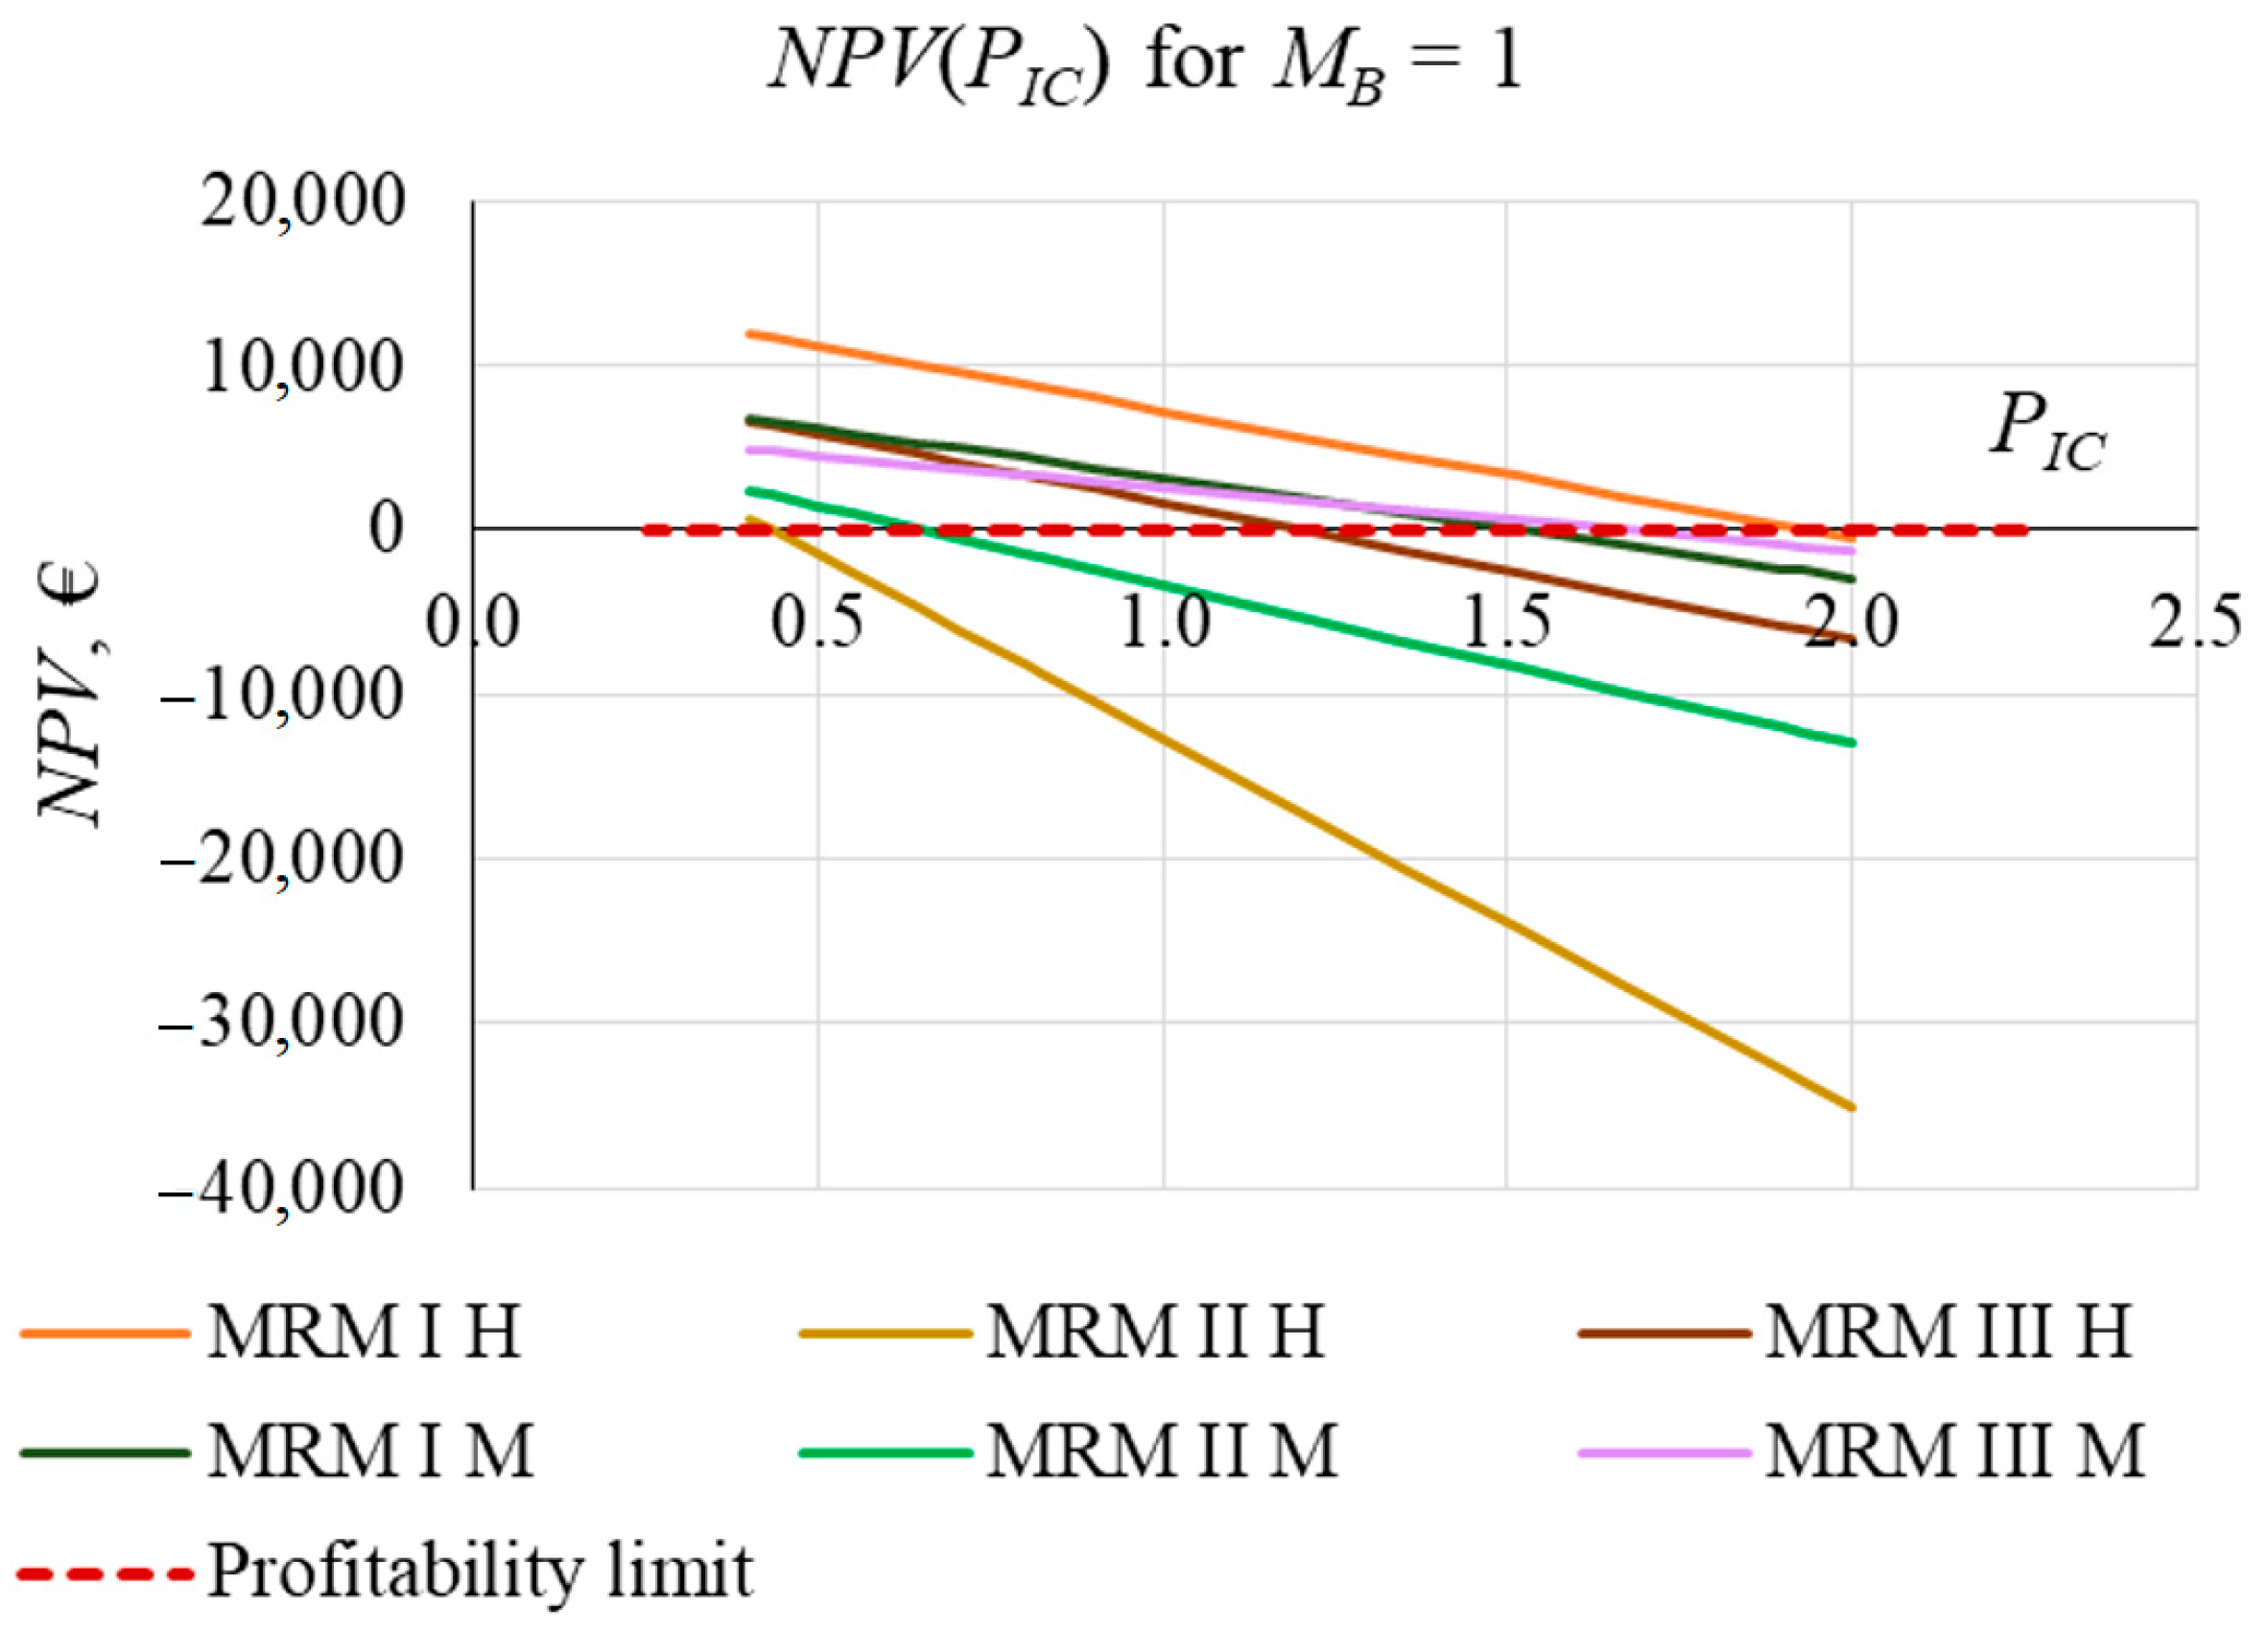
3.3. Efficiency Analysis
4. Conclusions
Author Contributions
Funding
Data Availability Statement
Conflicts of Interest
References
- The World Map of Drought Risk. Available online: www.statista.com/chart/25101/countries-by-drought-risk/ (accessed on 6 July 2023).
- Drought Effects Counteracting Plan. Available online: https://wody.isok.gov.pl/imap_kzgw/?gpmap=gpPPSS (accessed on 6 July 2023).
- Wols, B.A.; Van Daal, K.; Van Thienen, P. Effects of climate change on drinking water distribution network integrity: Predicting pipe failure resulting from differential soil settlement. Procedia Eng. 2014, 70, 1726–1734. [Google Scholar] [CrossRef]
- Wols, B.A.; Van Thienen, P. Modelling the effect of climate change induced soil settling on drinking water distribution pipes. Comput. Geotech. 2014, 55, 240–247. [Google Scholar] [CrossRef]
- Water Scarcity & Droughts in the European Union. Available online: https://ec.europa.eu/environment/water/quantity/scarcity_en.htm (accessed on 7 April 2023).
- Pour, S.H.; Abd Wahab, A.K.; Shahid, S.; Asaduzzaman, M.; Dewan, A. Low impact development techniques to mitigate the impacts of climate-change-induced urban floods: Current trends, issues and challenges. Sustain. Cities Soc. 2020, 62, 102373. [Google Scholar] [CrossRef]
- Alimonti, G.; Mariani, L.; Prodi, F.; Ricci, R.A. A critical assessment of extreme events trends in times of global warming. Eur. Phys. J. Plus 2022, 137, 112. [Google Scholar] [CrossRef]
- Papalexiou, S.M.; Montanari, A. Global and regional increase of precipitation extremes under global warming. Water Resour. Res. 2019, 55, 4901–4914. [Google Scholar] [CrossRef]
- Directive 2000/60/EC of the European Parliament and of the Council of 23 October 2000 establishing a framework for Community action in the field of water policy. Off. J. Eur. Communities 2000, 327, 1–73. Available online: https://www.eea.europa.eu/policy-documents/directive-2000-60-ec-of (accessed on 20 March 2023).
- Sustainable Development Goals. Available online: https://www.un.org/sustainabledevelopment/sustainable-development-goals/ (accessed on 20 March 2023).
- Regulation (EU) 2020/741 of The European Parliament and of The Council of 25 May 2020 on Minimum Requirements for Water Reuse. Available online: https://eur-lex.europa.eu/legal-content/EN/TXT/?uri=CELEX%3A32020R0741 (accessed on 7 April 2023).
- Chow, J.F.; Savić, D.; Fortune, D.; Kapelan, Z.; Mebrate, N. Using a systematic, multi-criteria decision support framework to evaluate sustainable drainage designs. Procedia Eng. 2014, 70, 343–352. [Google Scholar] [CrossRef]
- Pappalardo, V.; La Rosa, D. Policies for sustainable drainage systems in urban contexts within performance-based planning approaches. Sustain. Cities Soc. 2020, 52, 101830. [Google Scholar] [CrossRef]
- Ramos, H.M.; Pérez-Sánchez, M.; Franco, A.B.; López-Jiménez, P.A. Urban floods adaptation and sustainable drainage measures. Fluids 2017, 2, 61. [Google Scholar] [CrossRef]
- Grabowski, T.; Jóźwiakowski, K.; Bochniak, A.; Micek, A. Changes in the Amount of Rainwater in the Roztocze National Park (Poland) in 2001–2020 and the Possibility of Using Rainwater in the Context of Ongoing Climate Variability. Water 2022, 14, 1334. [Google Scholar] [CrossRef]
- Kaykhosravi, S.; Khan, U.T.; Jadidi, A. A comprehensive review of low impact development models for research, conceptual, preliminary and detailed design applications. Water 2018, 10, 1541. [Google Scholar] [CrossRef]
- Shafique, M.; Kim, R. Recent progress in low-impact development in South Korea: Water-management policies, challenges and opportunities. Water 2018, 10, 435. [Google Scholar] [CrossRef]
- Elliott, A.H.; Trowsdale, S.A. A review of models for low impact urban stormwater drainage. Environ. Model. Softw. 2007, 22, 394–405. [Google Scholar] [CrossRef]
- Chang, N.B.; Lu, J.W.; Chui, T.F.M.; Hartshorn, N. Global policy analysis of low impact development for stormwater management in urban regions. Land Use Policy 2018, 70, 368–383. [Google Scholar] [CrossRef]
- Rodríguez-Rojas, M.I.; Huertas-Fernández, F.; Moreno, B.; Martínez, G.; Grindlay, A.L. A study of the application of permeable pavements as a sustainable technique for the mitigation of soil sealing in cities: A case study in the south of Spain. J. Environ. Manag. 2018, 205, 151–162. [Google Scholar] [CrossRef] [PubMed]
- Raimondi, F.; Marchioni, M.L.; Dresti, C.; Kian, D.; Mambretti, S.; Becciu, G. Urban flood risk management: Impact of combined strategies. Int. J. Environ. Impacts 2021, 4, 219–230. [Google Scholar] [CrossRef]
- Shinde, A.S.; More, S.B.; Shekade, O.S.; Shelar, P.D.; Warvate, B.R. Review Paper on the Study of Permeable Pavement. Int. J. Sci. Res. Eng. Trends 2021, 7, 1177–1180. [Google Scholar]
- Voskamp, I.M.; Van de Ven, F.H. Planning support system for climate adaptation: Composing effective sets of blue-green measures to reduce urban vulnerability to extreme weather events. Build. Environ. 2015, 83, 159–167. [Google Scholar] [CrossRef]
- Zeleňáková, M.; Hudáková, G.; Stec, A. Overview of Rainwater Management Facilities. In Rainwater Infiltration in Urban Areas; Water Science and Technology Library, Springer International Publishing: Cham, Switzerland, 2020; Volume 89, pp. 53–69. [Google Scholar]
- Amos, C.C.; Rahman, A.; Mwangi Gathenya, J. Economic analysis and feasibility of rainwater harvesting systems in urban and peri-urban environments: A review of the global situation with a special focus on Australia and Kenya. Water 2016, 8, 149. [Google Scholar] [CrossRef]
- Zabidi, H.A.; Goh, H.W.; Chang, C.K.; Chan, N.W.; Zakaria, N.A. A review of roof and pond rainwater harvesting systems for water security: The design, performance and way forward. Water 2020, 12, 3163. [Google Scholar] [CrossRef]
- Suchorab, P.; Iwanek, M. Efektywność wybranej instalacji dualnej wykorzystującej wody deszczowe w warunkach rzeczywistych opadów. Instal 2021, 12, 41–45. [Google Scholar]
- Gwoździej-Mazur, J.; Jadwiszczak, P.; Kaźmierczak, B.; Kózka, K.; Struk-Sokołowska, J.; Wartalska, K.; Wdowikowski, M. The impact of climate change on rainwater harvesting in households in Poland. Appl. Water Sci. 2022, 12, 15. [Google Scholar] [CrossRef]
- Suchorab, P.; Iwanek, M.; Kowalska, B.; Kowalski, D. Analysis of retention possibilities of selected model green roofs. In Water Supply and Wastewater Disposal, 1st ed.; Sobczuk, H., Kowalska, B., Eds.; Lublin University of Technology: Lublin, Poland, 2017; pp. 272–280. [Google Scholar]
- Ertan, S.; Çelik, R.N. The Assessment of Urbanization Effect and Sustainable Drainage Solutions on Flood Hazard by GIS. Sustainability 2021, 13, 2293. [Google Scholar] [CrossRef]
- Archer, N.A.; Bell, R.A.; Butcher, A.S.; Bricker, S.H. Infiltration efficiency and subsurface water processes of a sustainable drainage system and consequences to flood management. J. Flood Risk Manag. 2020, 13, e12629. [Google Scholar] [CrossRef]
- Yang, Y.; Chui, T.F.M. Modeling and interpreting hydrological responses of sustainable urban drainage systems with explainable machine learning methods. Hydrol. Earth Syst. Sci. 2021, 25, 5839–5858. [Google Scholar] [CrossRef]
- Ossa-Moreno, J.; Smith, K.M.; Mijic, A. Economic analysis of wider benefits to facilitate SuDS uptake in London, UK. Sustain. Cities Soc. 2017, 28, 411–419. [Google Scholar] [CrossRef]
- Vincent, S.U.; Radhakrishnan, M.; Hayde, L.; Pathirana, A. Enhancing the economic value of large investments in sustainable drainage systems (SuDS) through inclusion of ecosystems services benefits. Water 2017, 9, 841. [Google Scholar] [CrossRef]
- Alves, A.; Gersonius, B.; Kapelan, Z.; Vojinovic, Z.; Sanchez, A. Assessing the Co-Benefits of green-blue-grey infrastructure for sustainable urban flood risk management. J. Environ. Manag. 2019, 239, 244–254. [Google Scholar] [CrossRef]
- Suchorab, P.; Iwanek, M.; Żelazna, A. Profitability analysis of dual installations in selected European countries. Appl. Water Sci. 2021, 11, 34. [Google Scholar] [CrossRef]
- Fraga, J.P.R.; Okumura, C.K.; Guimarães, L.F.; de Arruda, R.N.; Becker, B.R.; de Oliveira, A.K.B.; Veról, A.P.; Miguez, M.G. Cost-benefit analysis of sustainable drainage systems considering ecosystems services benefits: Case study of canal do mangue watershed in Rio de Janeiro city, Brazil. Clean Technol. Env. Policy 2022, 24, 695–712. [Google Scholar] [CrossRef]
- Matos, C.; Bentes, I.; Santos, C.; Imteaz, M.A. Economic Analysis of a Rainwater Harvesting System in a Commercial Building. Water Resour. Manag. 2015, 29, 3971–3986. [Google Scholar] [CrossRef]
- Domenech, L.; Sauri, D. Socio-technical transitions in water scarcity contexts: Public acceptance of greywater reuse technologies in the Metropolitan Area of Barcelona. Resour. Conserv. Recycl. 2010, 55, 53–62. [Google Scholar] [CrossRef]
- Silva, C.M.; Sousa, V.; Carvalho, N.V. Evaluation of rainwater harvesting in Portugal: Application to single-family residences. Resour. Conserv. Recycl. 2015, 94, 21–34. [Google Scholar] [CrossRef]
- Istchuk, R.N.; Ghisi, E. Financial Feasibility Analysis of Residential Rainwater Harvesting in Maringá, Brazil. Sustainability 2022, 14, 12859. [Google Scholar] [CrossRef]
- Stec, A.; Zeleňáková, M. An Analysis of the Effectiveness of Two Rainwater Harvesting Systems Located in Central Eastern Europe. Water 2019, 11, 458. [Google Scholar] [CrossRef]
- Farreny, R.; Gabarrell, X.; Rieradevall, J. Cost-efficiency of rainwater harvesting strategies in dense Mediterranean neighbourhoods. Resour. Conserv. Recycl. 2011, 55, 686–694. [Google Scholar] [CrossRef]
- City of Lublin. Available online: https://lublin.eu/mieszkancy/srodowisko/aktualnosci/nabor-do-programu-zlap-deszczowke,518,1945,1.html (accessed on 7 July 2023).
- Government Website. Available online: https://www.gov.pl/web/nfosigw/moja-woda--wsparcie-dzialan-realizowanych-przez-wfosigw (accessed on 7 July 2023).
- Characteristics of Geographical Regions of Poland. Available online: http://geoinformatics.uw.edu.pl/wp-content/uploads/sites/26/2014/03/TS_v38_Lubelszczyzna.pdf (accessed on 7 July 2023).
- PN-B-03020:1981; Building grounds—Direct Foundation of the Buildings. Static Calculations and Designing. Available online: https://sklep.pkn.pl/pn-b-03020-1981p.html (accessed on 20 March 2023).
- PN-B-02403:1982; Ogrzewnictwo—Temperatury Obliczeniowe Zewnętrzne (Heating—Design Outdoor Temperatures). Available online: https://sklep.pkn.pl/pn-b-02403-1982p.html (accessed on 20 March 2023).
- PN-EN-752:2008; Zewnętrzne Systemy Kanalizacyjne (EN 752:2008 Drain and Sewer Systems Outside Buildings). Available online: https://sklep.pkn.pl/pn-en-752-2008e.html (accessed on 20 March 2023).
- Królikowska, J.; Królikowski, A. Rainwater. Drainage, Development, Pre-Treatment and Use; Wydawnictwo Seidel-Przywecki, Sp. z o.o.: Józefosław, Poland, 2012. [Google Scholar]
- March, J.G.; Gual, M.; Orozco, F. Experiences on greywater re-use for toilet flushing in a hotel (Mallorca Island, Spain). Desalination 2004, 164, 241–247. [Google Scholar] [CrossRef]
- Goncalves, M.L.R.; Zischg, J.; Rau, S.; Sitzmann, M.; Rauch, W.; Kleidorfer, M. Modeling the Effects of Introducing Low Impact Development in a Tropical City: A Case Study from Joinville, Brazil. Sustainability 2018, 10, 728. [Google Scholar] [CrossRef]
- Polish Standards for Valuation of Construction Works, SKB, Warsaw 2017. Available online: https://kosztorysowanie.pl/cherry-services/standardy-kosztorysowania/ (accessed on 20 March 2023).
- Regulation of the Minister of Development and Technology of 20 December 2021 on Determining the Methods and Bases for Preparing an Investor’s Cost Estimate, Calculating the Planned Costs of Design Works and the Planned Costs of Construction Works Specified in the Functional and Utility Program. J. Laws 2021, 2458. Available online: http://www.przepisy.gofin.pl/przepisy,2,26,26,6892,,,rozporzadzenie-ministra-rozwoju-i-technologii-z-dnia.html (accessed on 20 March 2023).
- Available online: https://bzg.pl (accessed on 20 May 2023).
- Tangible Outlays Catalog 2-01—Earthworks, Wacetob, Warsaw 2012. Available online: https://fachowa.pl/pl/p/KNR-2-01-Budowle-i-roboty-ziemne-Wacetob/18922 (accessed on 20 March 2023).
- Tangible Outlays Catalog 2-15—Domestic Water, Wastewater, Gas and Central Heating Systems, IRM, Warsaw 2011. Available online: https://fachowa.pl/pl/p/KNR-2-15-Instalacje-wewnetrzne-wodociagowe%2C-kanalizacyjne%2C-gazowe-i-centralnego-ogrzewania/31052 (accessed on 20 March 2023).
- Tangible Outlays Catalog 2-18—Water Supply and Wastewater Disposal Networks, IGM, Warsaw 2006. Available online: https://www.normyceny.pl/product/2935/knr-w-2-18-zewnetrzne-sieci-wodociagowe-i-kanalizacyjne (accessed on 20 March 2023).
- Godyń, I.; Grela, A.; Stajno, D.; Tokarska, P. Sustainable Rainwater Management Concept in a Housing Estate with a Financial Feasibility Assessment and Motivational Rainwater Fee System Efficiency Analysis. Water 2020, 12, 151. [Google Scholar] [CrossRef]
- Królikowska, J.; Cichoń, T. Stormwater fees. Are they really necessary? Desalination Water Treat. 2021, 242, 260–265. [Google Scholar] [CrossRef]
- Munda, G. An Assessment of Discount Methods for Evaluating Efficiency of Investments in Education; JRC Technical Reports; Joint Research Centre, European Commission: Luxembourg, 2015; EUR 27589 EN. [Google Scholar]
- Linn, M. Cost-benefit analysis: Examples. Bottom Line 2011, 24, 68–72. [Google Scholar] [CrossRef]
- Żelazna, A.; Gołębiowska, J.; Zdyb, A.; Pawłowski, A. A hybrid vs. on-grid photovoltaic system: Multicriteria analysis of environmental, economic, and technical aspects in life cycle perspective. Energies 2020, 13, 3978. [Google Scholar] [CrossRef]
- Shively, G. An Overview of Benefit-Cost Analysis. Available online: https://www.researchgate.net/publication/255661807 (accessed on 20 March 2023).
- European Commission. Guide to Cost-Benefit Analysis of Investment Projects. Economic Appraisal Tool for Cohesion Policy 2014–2020. Available online: https://ec.europa.eu/regional_policy/en/information/publications/guides/2014/guide-to-cost-benefit-analysis-of-investment-projects-for-cohesion-policy-2014-2020 (accessed on 20 March 2023).
- Bonazzi, G.; Iotti, M. Evaluation of Investment in Renovation to Increase the Quality of Buildings: A Specific Discounted Cash Flow (DCF) Approach of Appraisal. Sustainability 2016, 8, 268. [Google Scholar] [CrossRef]
- Christersson, M.; Vimpari, J.; Junnila, S. Assessment of financial potential of real estate energy efficiency investments–A discounted cash flow approach. Sustain. Cities Soc. 2015, 18, 66–73. [Google Scholar] [CrossRef]
- Sakson, G. Cost analysis of rainwater harvesting system in Poland. E3S Web Conf. INFRAEKO 2018, 45, 00078. [Google Scholar] [CrossRef]
- Stec, A.; Słyś, D. Rainwater potential use in dormitory building: Drinking water savings and economic costs. Ecol Chem Eng. A 2017, 24, 43–64. [Google Scholar]
- Musz-Pomorska, A.; Widomski, M.K.; Gołębiowska, J. Financial Sustainability of Selected Rain Water Harvesting Systems for Single-Family House under Conditions of Eastern Poland. Sustainability 2020, 12, 4853. [Google Scholar] [CrossRef]


| Building | Symbol of the Variant for MRM | |||
|---|---|---|---|---|
| MRM I | MRM II | MRM III | MRM IV | |
| Hotel | MRM I H | MRM II H | MRM III H | MRM IV H |
| Motel | MRM I M | MRM II M | MRM III M | MRM IV M |
| Building | Service Fee | ||
|---|---|---|---|
| Electricity Supply | Tap Water Supply | Rainwater Disposal | |
| Hotel | EUR 0.15/kWh | EUR 0.66/m3 | EUR 1.20/m3 |
| Motel | EUR 0. 15/kWh | EUR 0.89/m3 | EUR 1.87/m3 |
| Building | C (-) | P (m/year) | A (m2) | Qrh (m3/year) | n (guest) | qf (m3/(d∙guest)) | Dgw (m3/year) |
|---|---|---|---|---|---|---|---|
| H | 1.0 | 0.6 | 893.8 | 536.28 | 65 | 0.036 | 854.10 |
| M | 1.0 | 0.6 | 370.3 | 222.18 | 28 | 0.036 | 367.92 |
| Valued Object | Investment Costs IC, EUR, for the Variant | |||
|---|---|---|---|---|
| MRM I H | MRM II H | MRM III H | MRM IV H | |
| Shared part of the investment | 13,373.23 (63%) | 13,373.23 (37%) | 13,373.23 (62%) | 13,373.23 (67%) |
| Specific part of the investment | 7751.06 (37%) | 22,362.91 (63%) | 8300.99 (38%) | 6652.61 (33%) |
| Entire investment | 21,124.29 (100%) | 35,736.14 (100%) | 21,674.22 (100%) | 20,025.84 (100%) |
| Valued Object | Investment Costs IC, EUR, for the Variant | |||
|---|---|---|---|---|
| MRM I M | MRM II M | MRM III M | MRM IV M | |
| Shared part of the investment | 6569.36 (52%) | 6569.36 (41%) | 6569.36 (63%) | 6569.36 (89%) |
| Specific part of the investment | 6088.93 (48%) | 9608.57 (59%) | 3830.59 (37%) | 851.66 (11%) |
| Entire investment | 12,658.29 (100%) | 16,177.93 (100%) | 10,399.95 (100%) | 7421.02 (100%) |
| Operated Object | Exploitation Costs EC, EUR/year, for the Variant | |||
|---|---|---|---|---|
| MRM I H | MRM II H | MRM III H | MRM IV H | |
| Shared part of the investment | 3.99 (13%) | 3.99 (18%) | 3.99 (100%) | 3.99 (1%) |
| Specific part of the investment | 26.77 (87%) | 18.75 (82%) | 0.00 (0%) | 646.12 (99%) |
| Entire investment | 30.76 (100%) | 22.74 (100%) | 3.99 (100%) | 650.11 (100%) |
| Operated Object | Exploitation Costs EC, EUR/year, for the Variant | |||
|---|---|---|---|---|
| MRM I M | MRM II M | MRM III M | MRM IV M | |
| Shared part of the investment | 2.67 (16%) | 2.67 (18%) | 2.67 (100%) | 2.67 (1%) |
| Specific part of the investment | 14.08 (84%) | 12.30 (82%) | 0.00 (0%) | 415.72 (99%) |
| Entire investment | 16.75 (100%) | 14.97 (100%) | 2.67 (100%) | 418.39 (100%) |
| Building | Benefits B, EUR/year, for the Method | |||
|---|---|---|---|---|
| MRM I | MRM II | MRM III | MRM IV | |
| Hotel | 1000.00 | 646.12 | 646.12 | 0.00 |
| Motel | 614.36 | 415.72 | 415.72 | 0.00 |
| Variant | Value of Indicator | ||
|---|---|---|---|
| NPV, EUR | BCR, - | DPP, Years | |
| MRM I H | 7209.92 | 1.88 | 11 |
| MRM II H | −12,718.65 | 0.44 | More than 90 |
| MRM III H | 1631.46 | 1.20 | 22 |
| MRM I M | 3138.77 | 1.50 | 15 |
| MRM II M | −3407.05 | 0.65 | More than 90 |
| MRM III M | 2560.02 | 1.67 | 13 |
| Multiplier | The Values of the Multipliers Corresponding to the Break-Even Point | |||||
|---|---|---|---|---|---|---|
| MRM I H | MRM II H | MRM III H | MRM I M | MRM II M | MRM III M | |
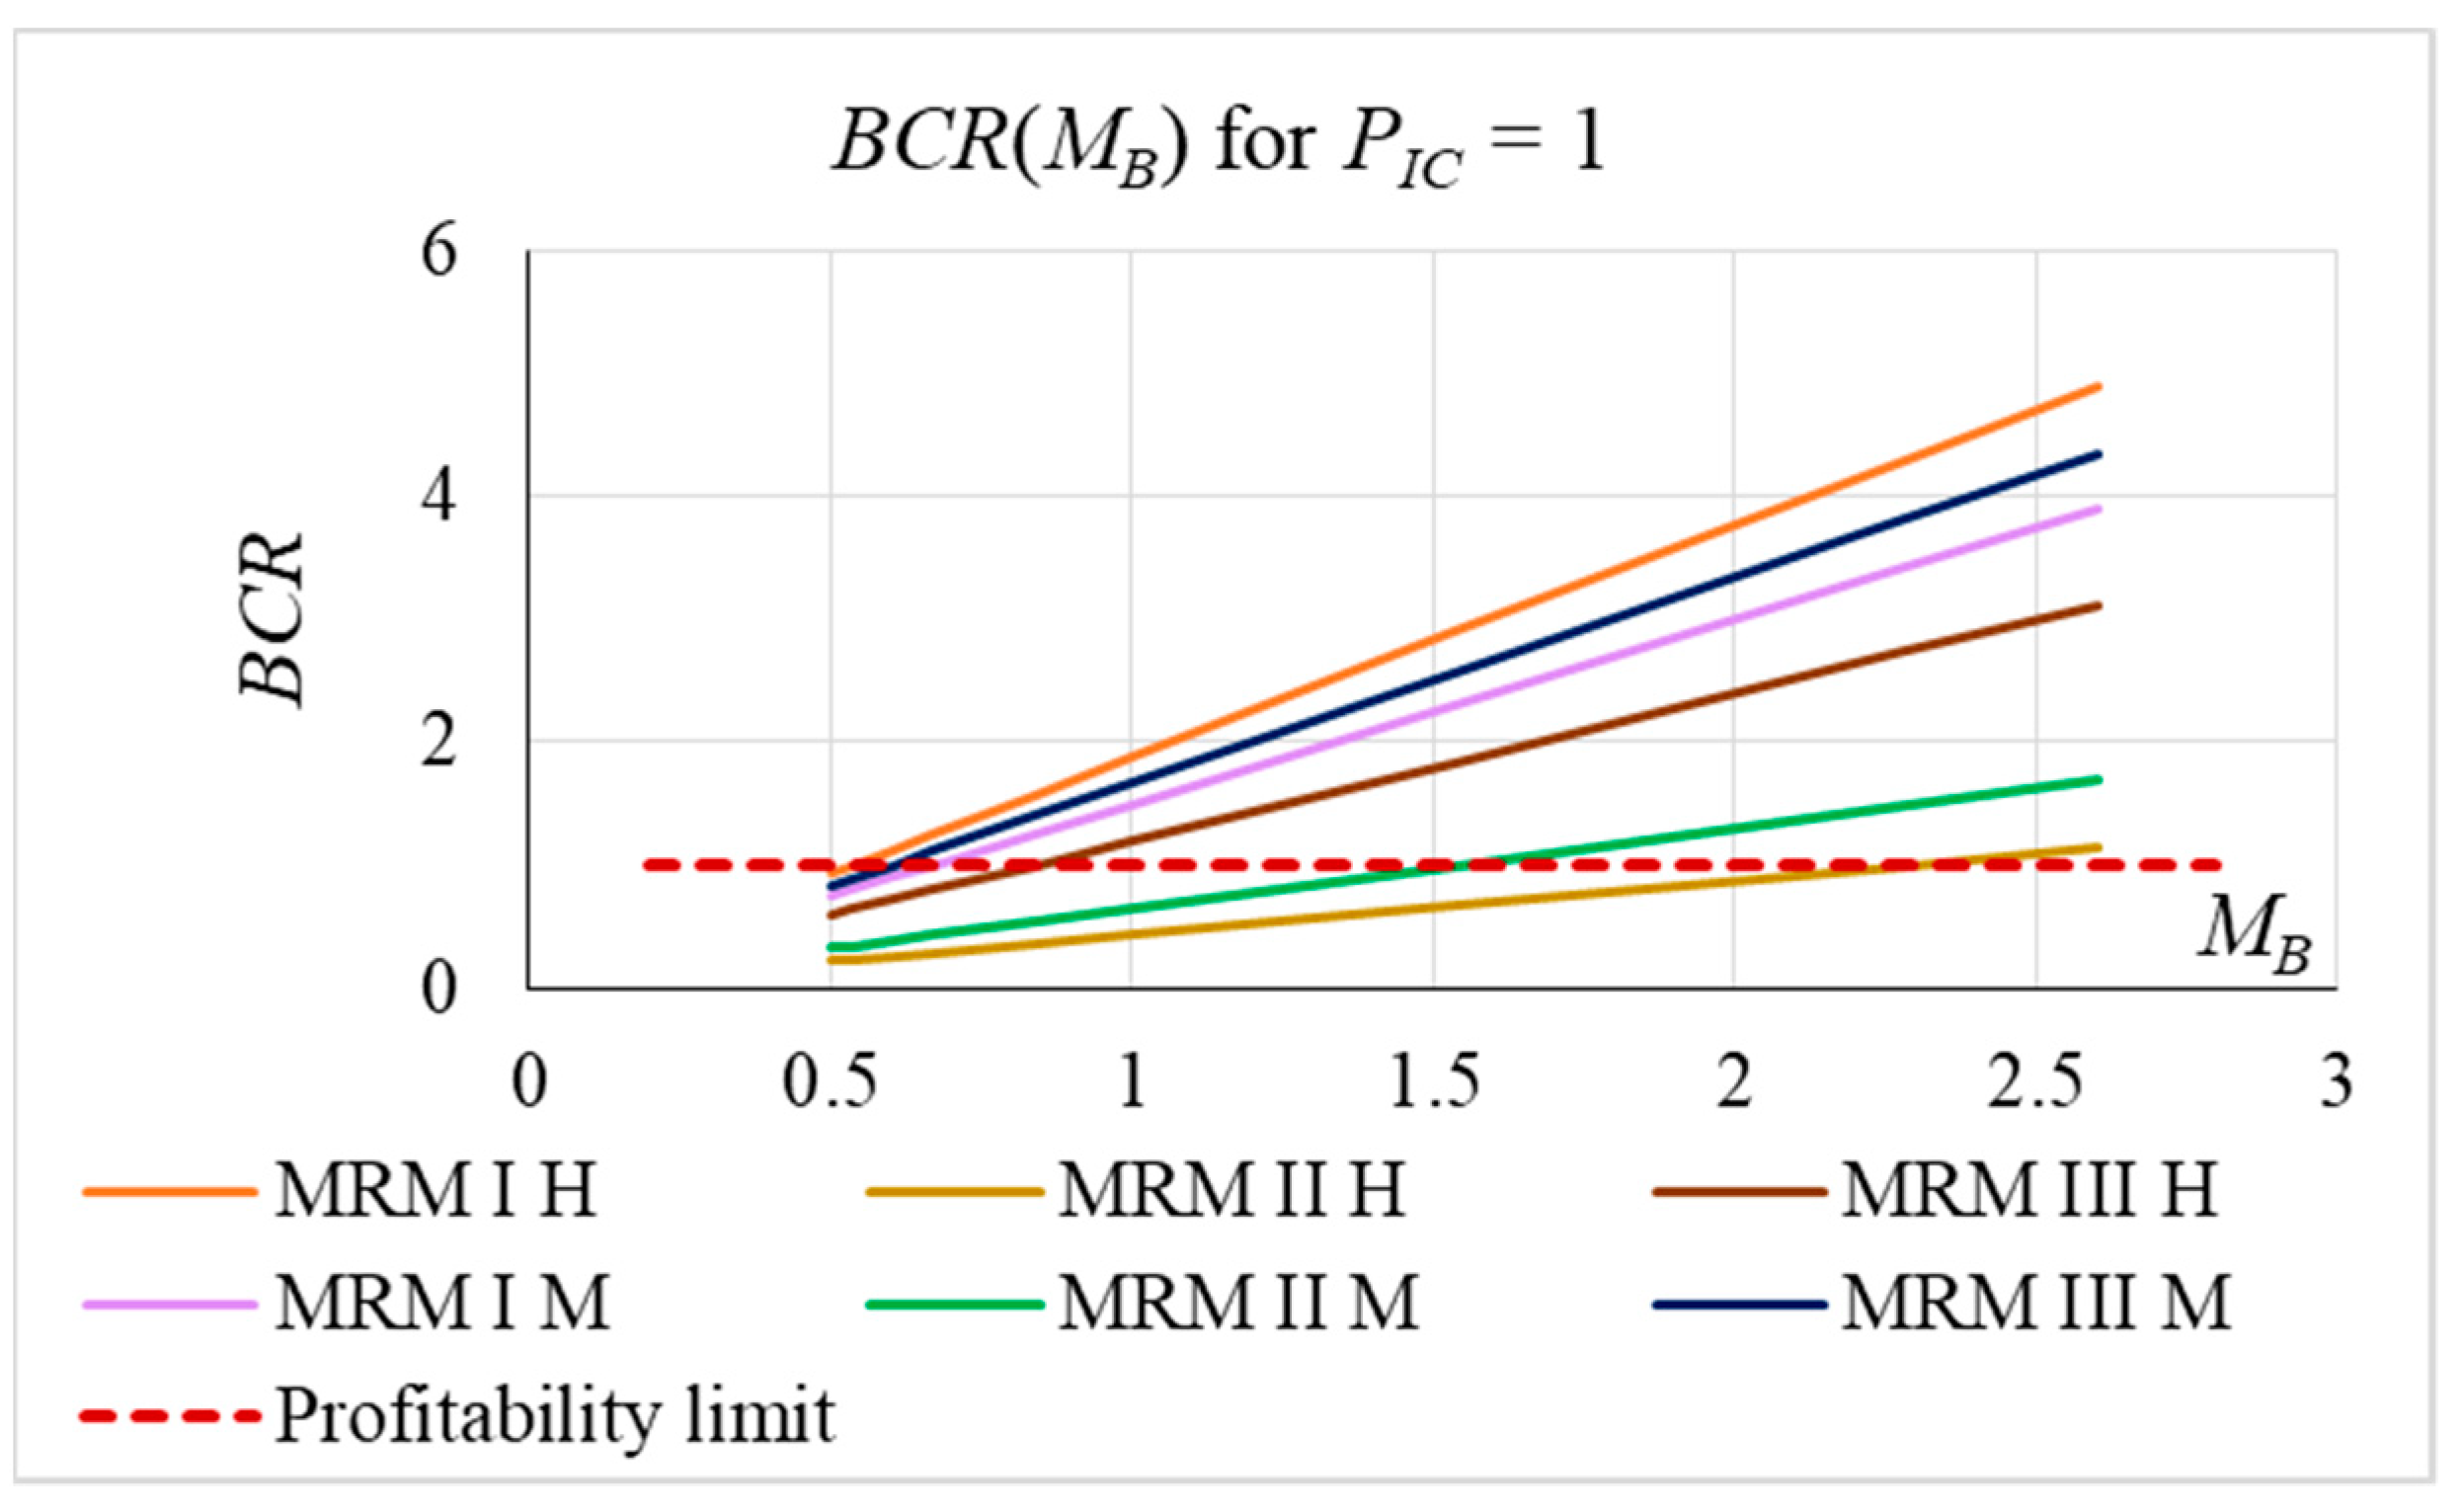
| PIC-limit | 1.93 | 0.43 | 1.20 | 1.52 | 0.65 | 1.67 |
| MB-limit | 0.53 | 2.28 | 0.84 | 0.67 | 1.53 | 0.60 |
Disclaimer/Publisher’s Note: The statements, opinions and data contained in all publications are solely those of the individual author(s) and contributor(s) and not of MDPI and/or the editor(s). MDPI and/or the editor(s) disclaim responsibility for any injury to people or property resulting from any ideas, methods, instructions or products referred to in the content. |
© 2023 by the authors. Licensee MDPI, Basel, Switzerland. This article is an open access article distributed under the terms and conditions of the Creative Commons Attribution (CC BY) license (https://creativecommons.org/licenses/by/4.0/).
Share and Cite
Iwanek, M.; Suchorab, P. Profitability Analysis of Selected Low Impact Development Methods for Decentralised Rainwater Management: A Case Study from Lublin Region, Poland. Water 2023, 15, 2601. https://doi.org/10.3390/w15142601
Iwanek M, Suchorab P. Profitability Analysis of Selected Low Impact Development Methods for Decentralised Rainwater Management: A Case Study from Lublin Region, Poland. Water. 2023; 15(14):2601. https://doi.org/10.3390/w15142601
Chicago/Turabian StyleIwanek, Małgorzata, and Paweł Suchorab. 2023. "Profitability Analysis of Selected Low Impact Development Methods for Decentralised Rainwater Management: A Case Study from Lublin Region, Poland" Water 15, no. 14: 2601. https://doi.org/10.3390/w15142601
APA StyleIwanek, M., & Suchorab, P. (2023). Profitability Analysis of Selected Low Impact Development Methods for Decentralised Rainwater Management: A Case Study from Lublin Region, Poland. Water, 15(14), 2601. https://doi.org/10.3390/w15142601