Land–Water Transition Zone Monitoring in Support of Drinking Water Production
Abstract
:1. Introduction
2. Materials and Methods
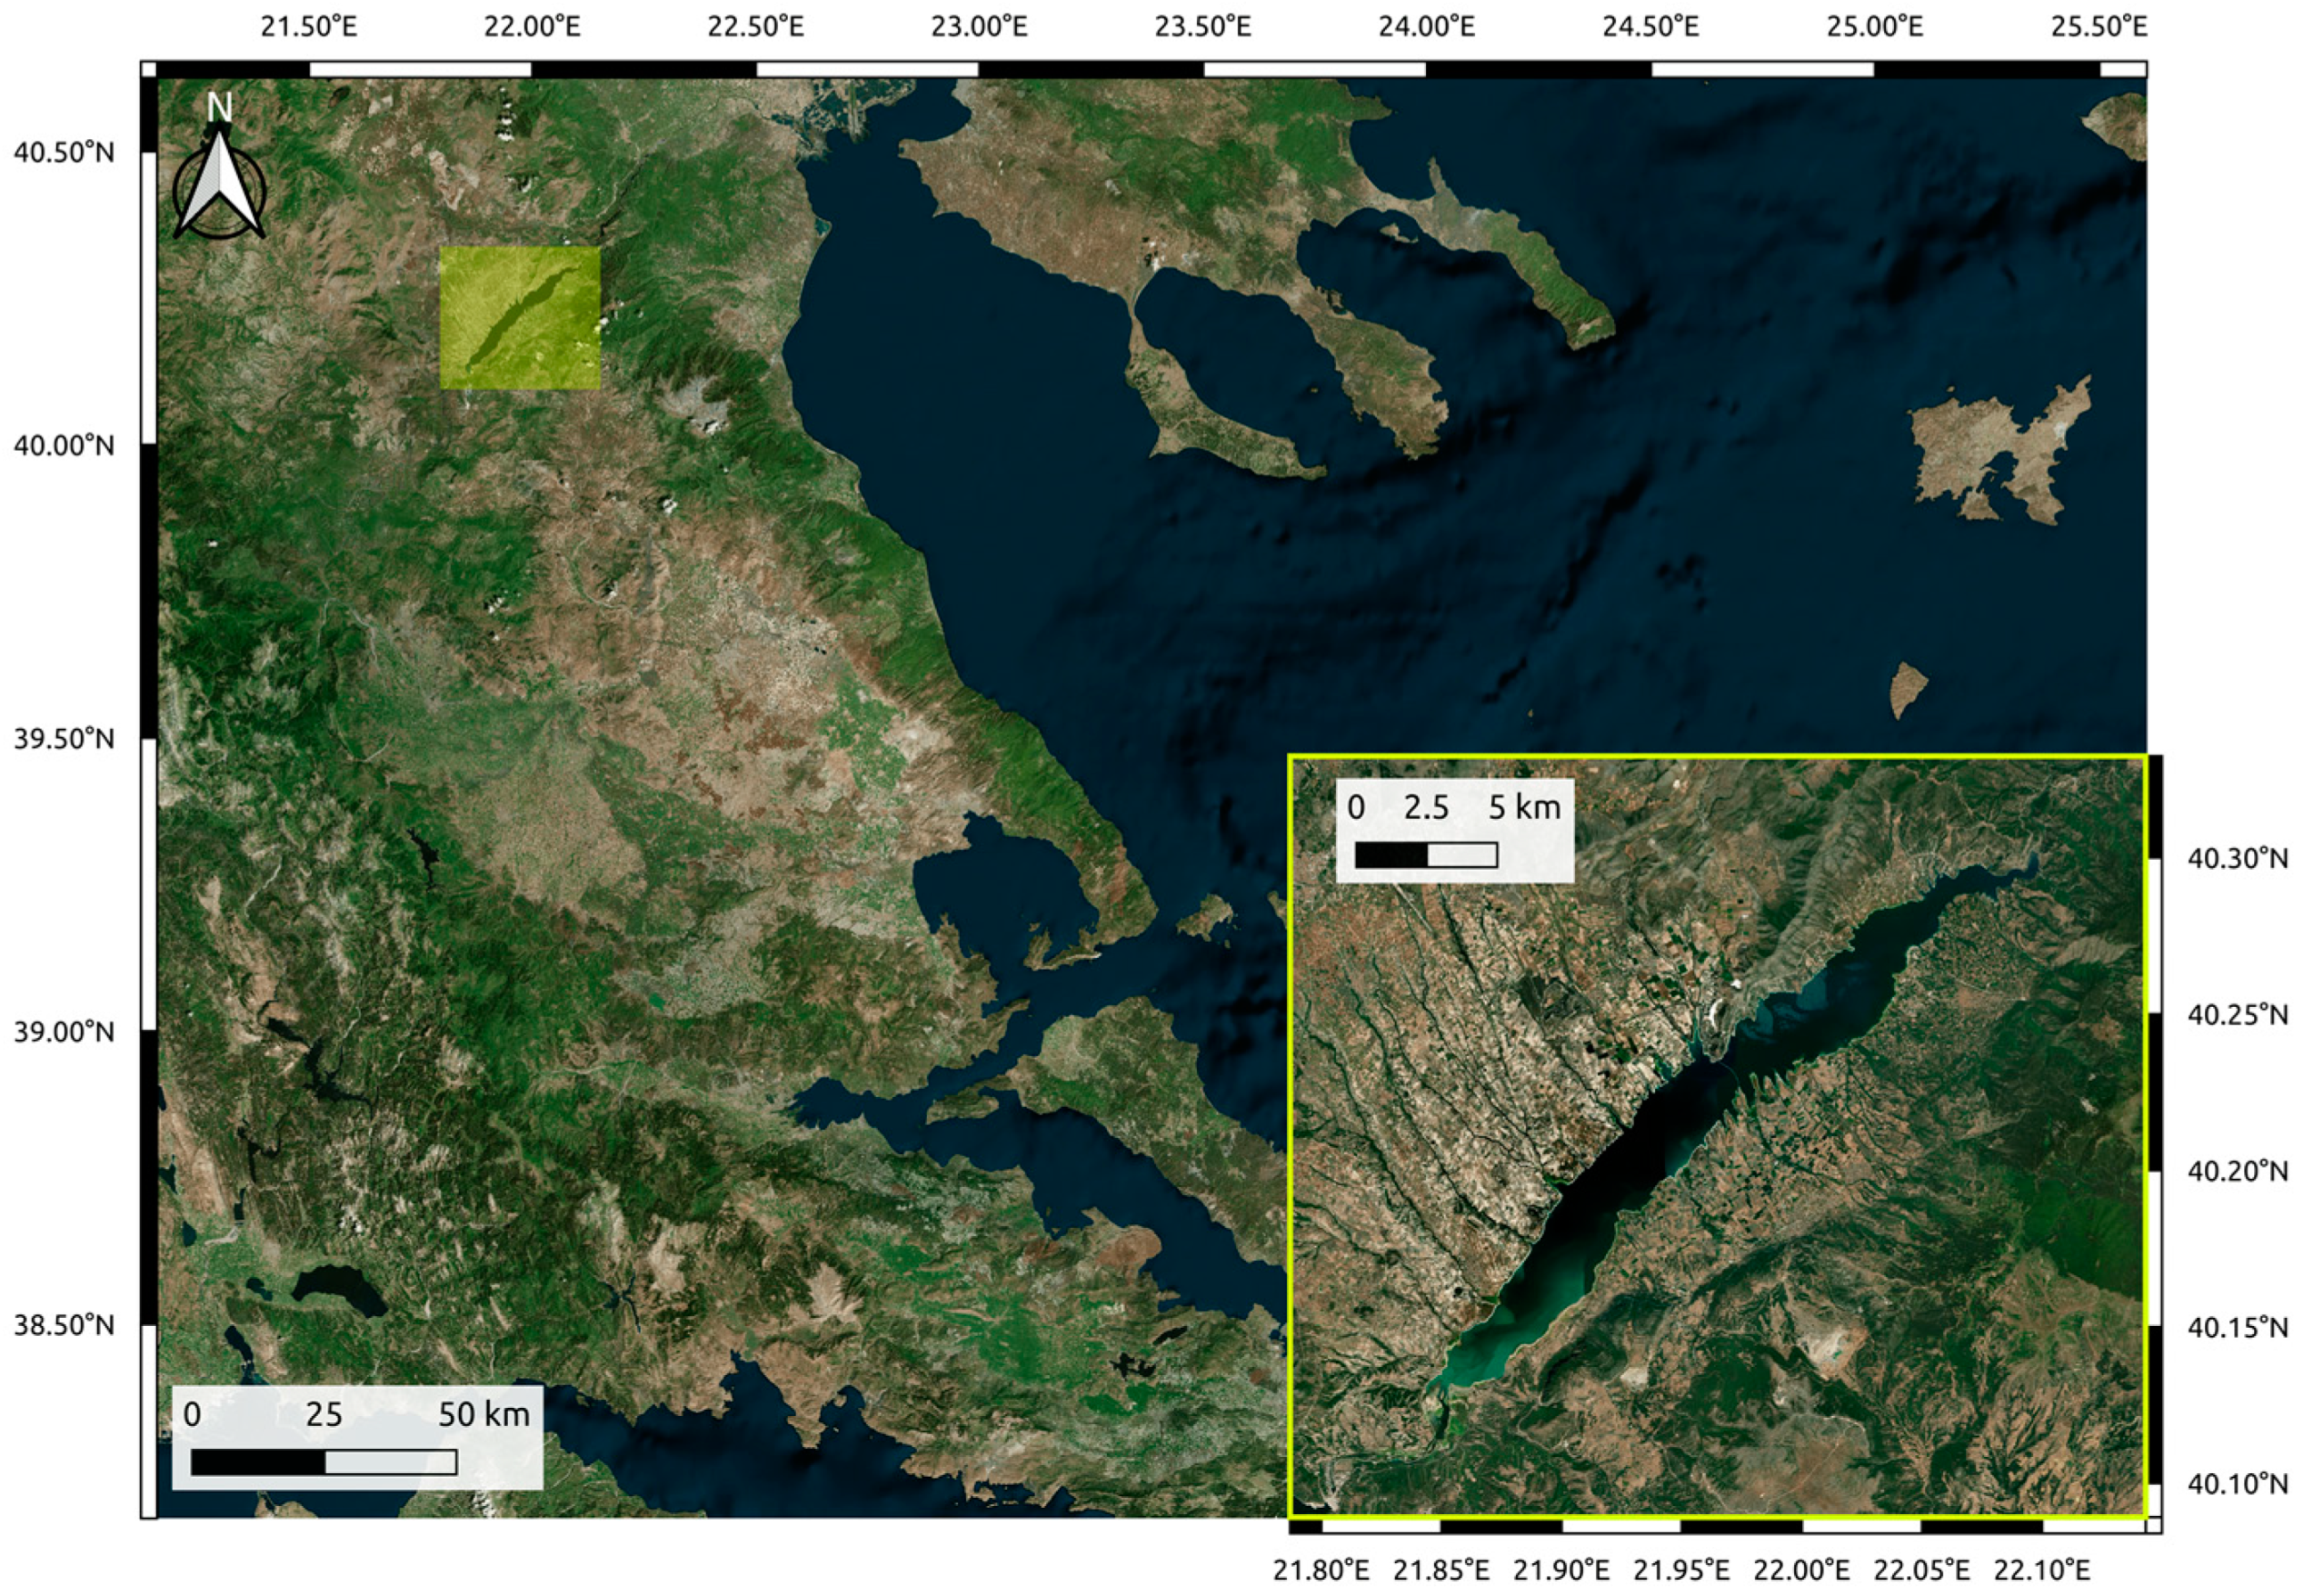
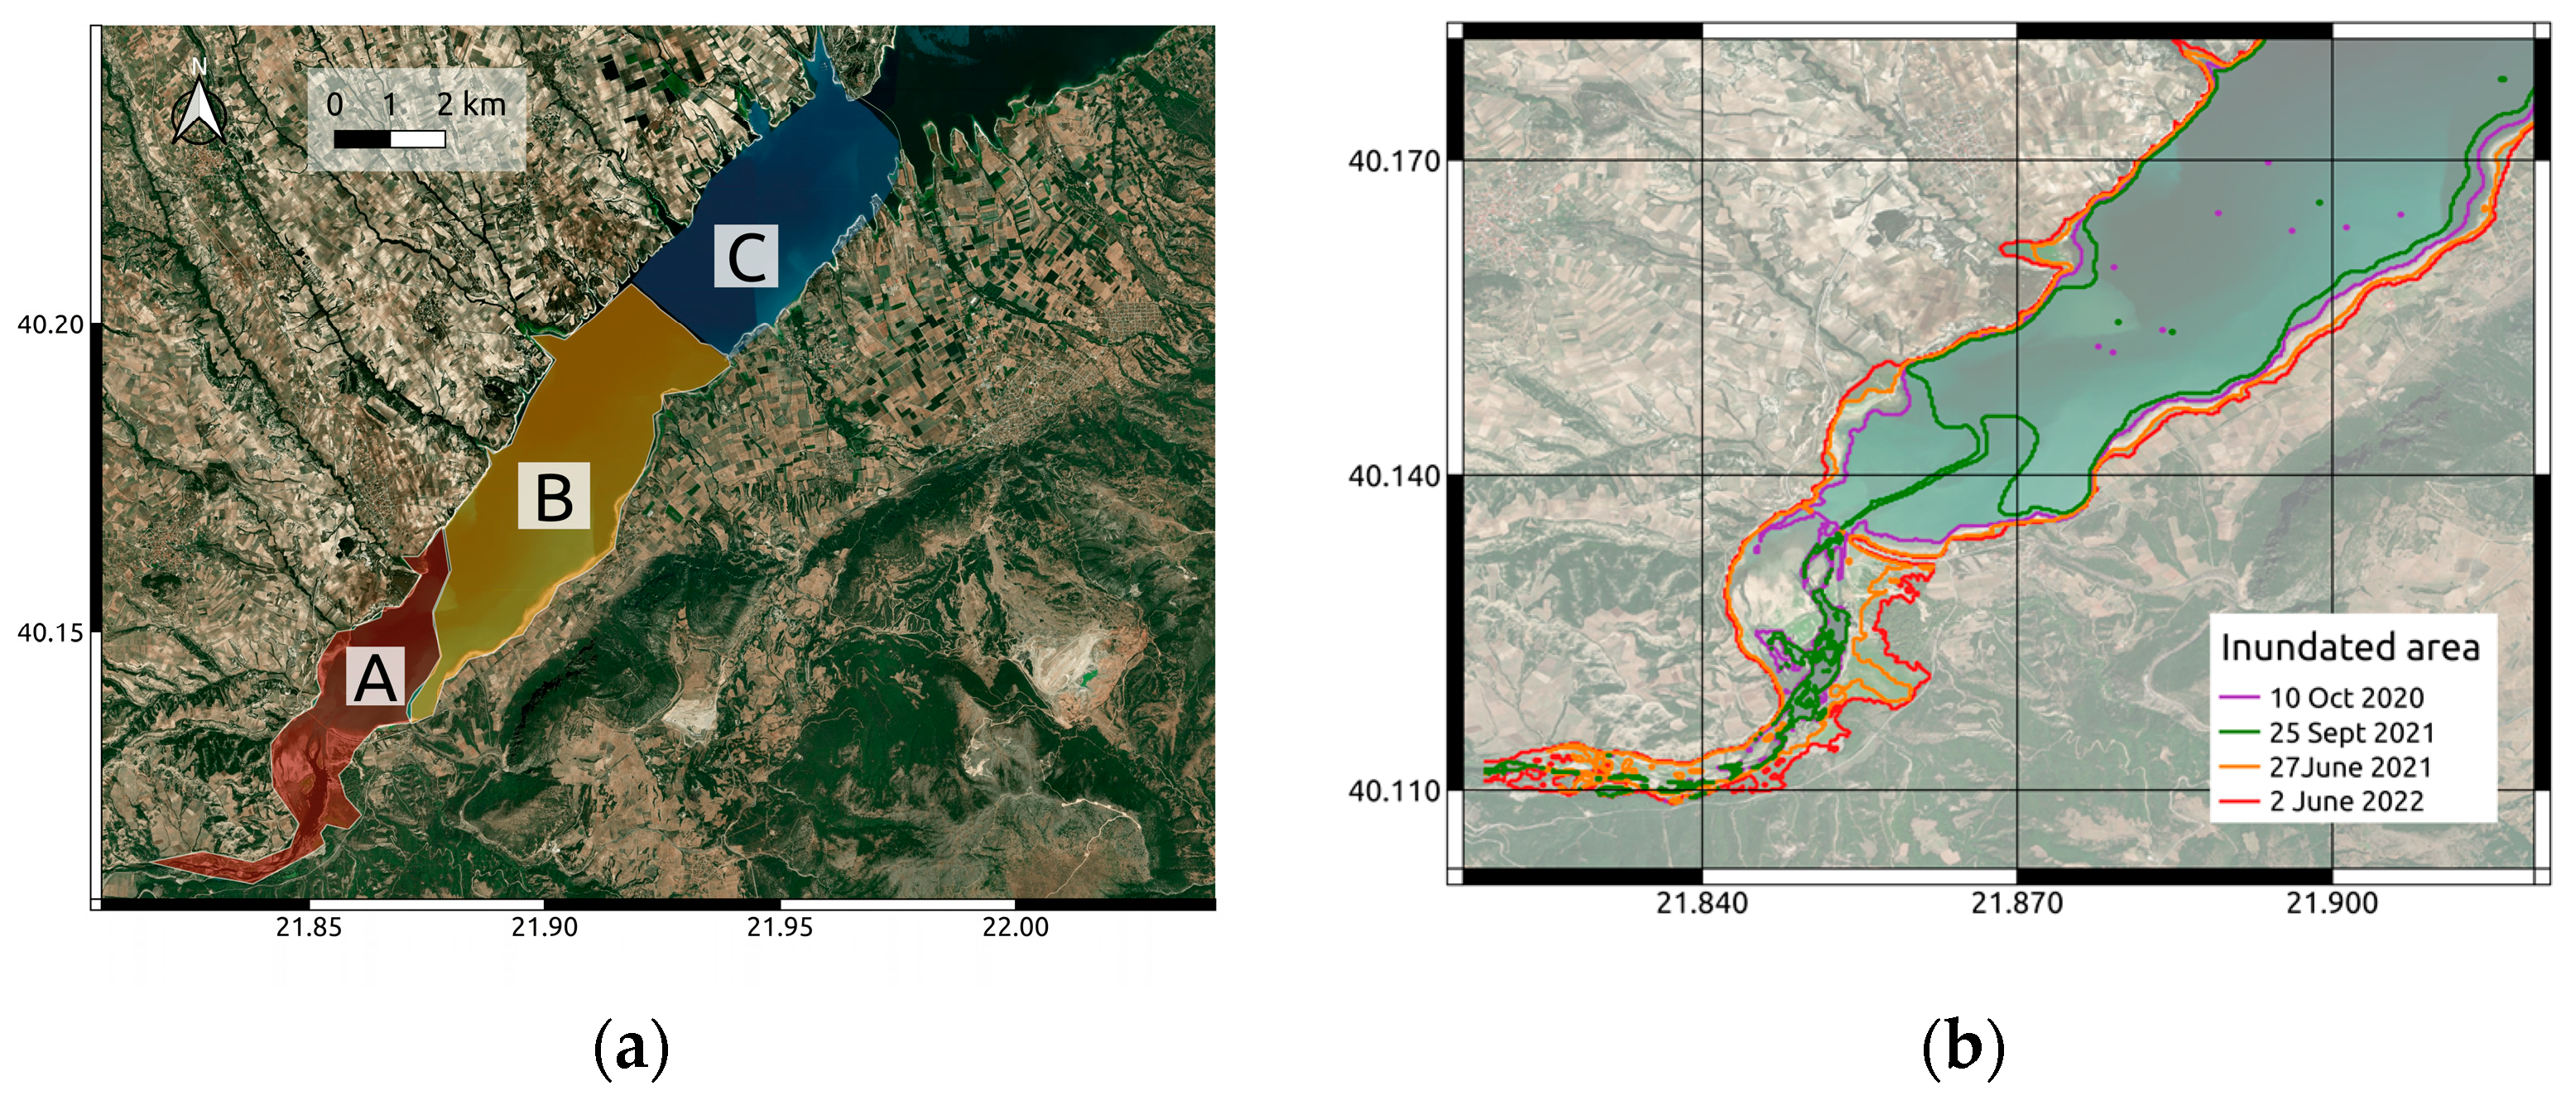
2.1. Study Area
2.2. Dataset
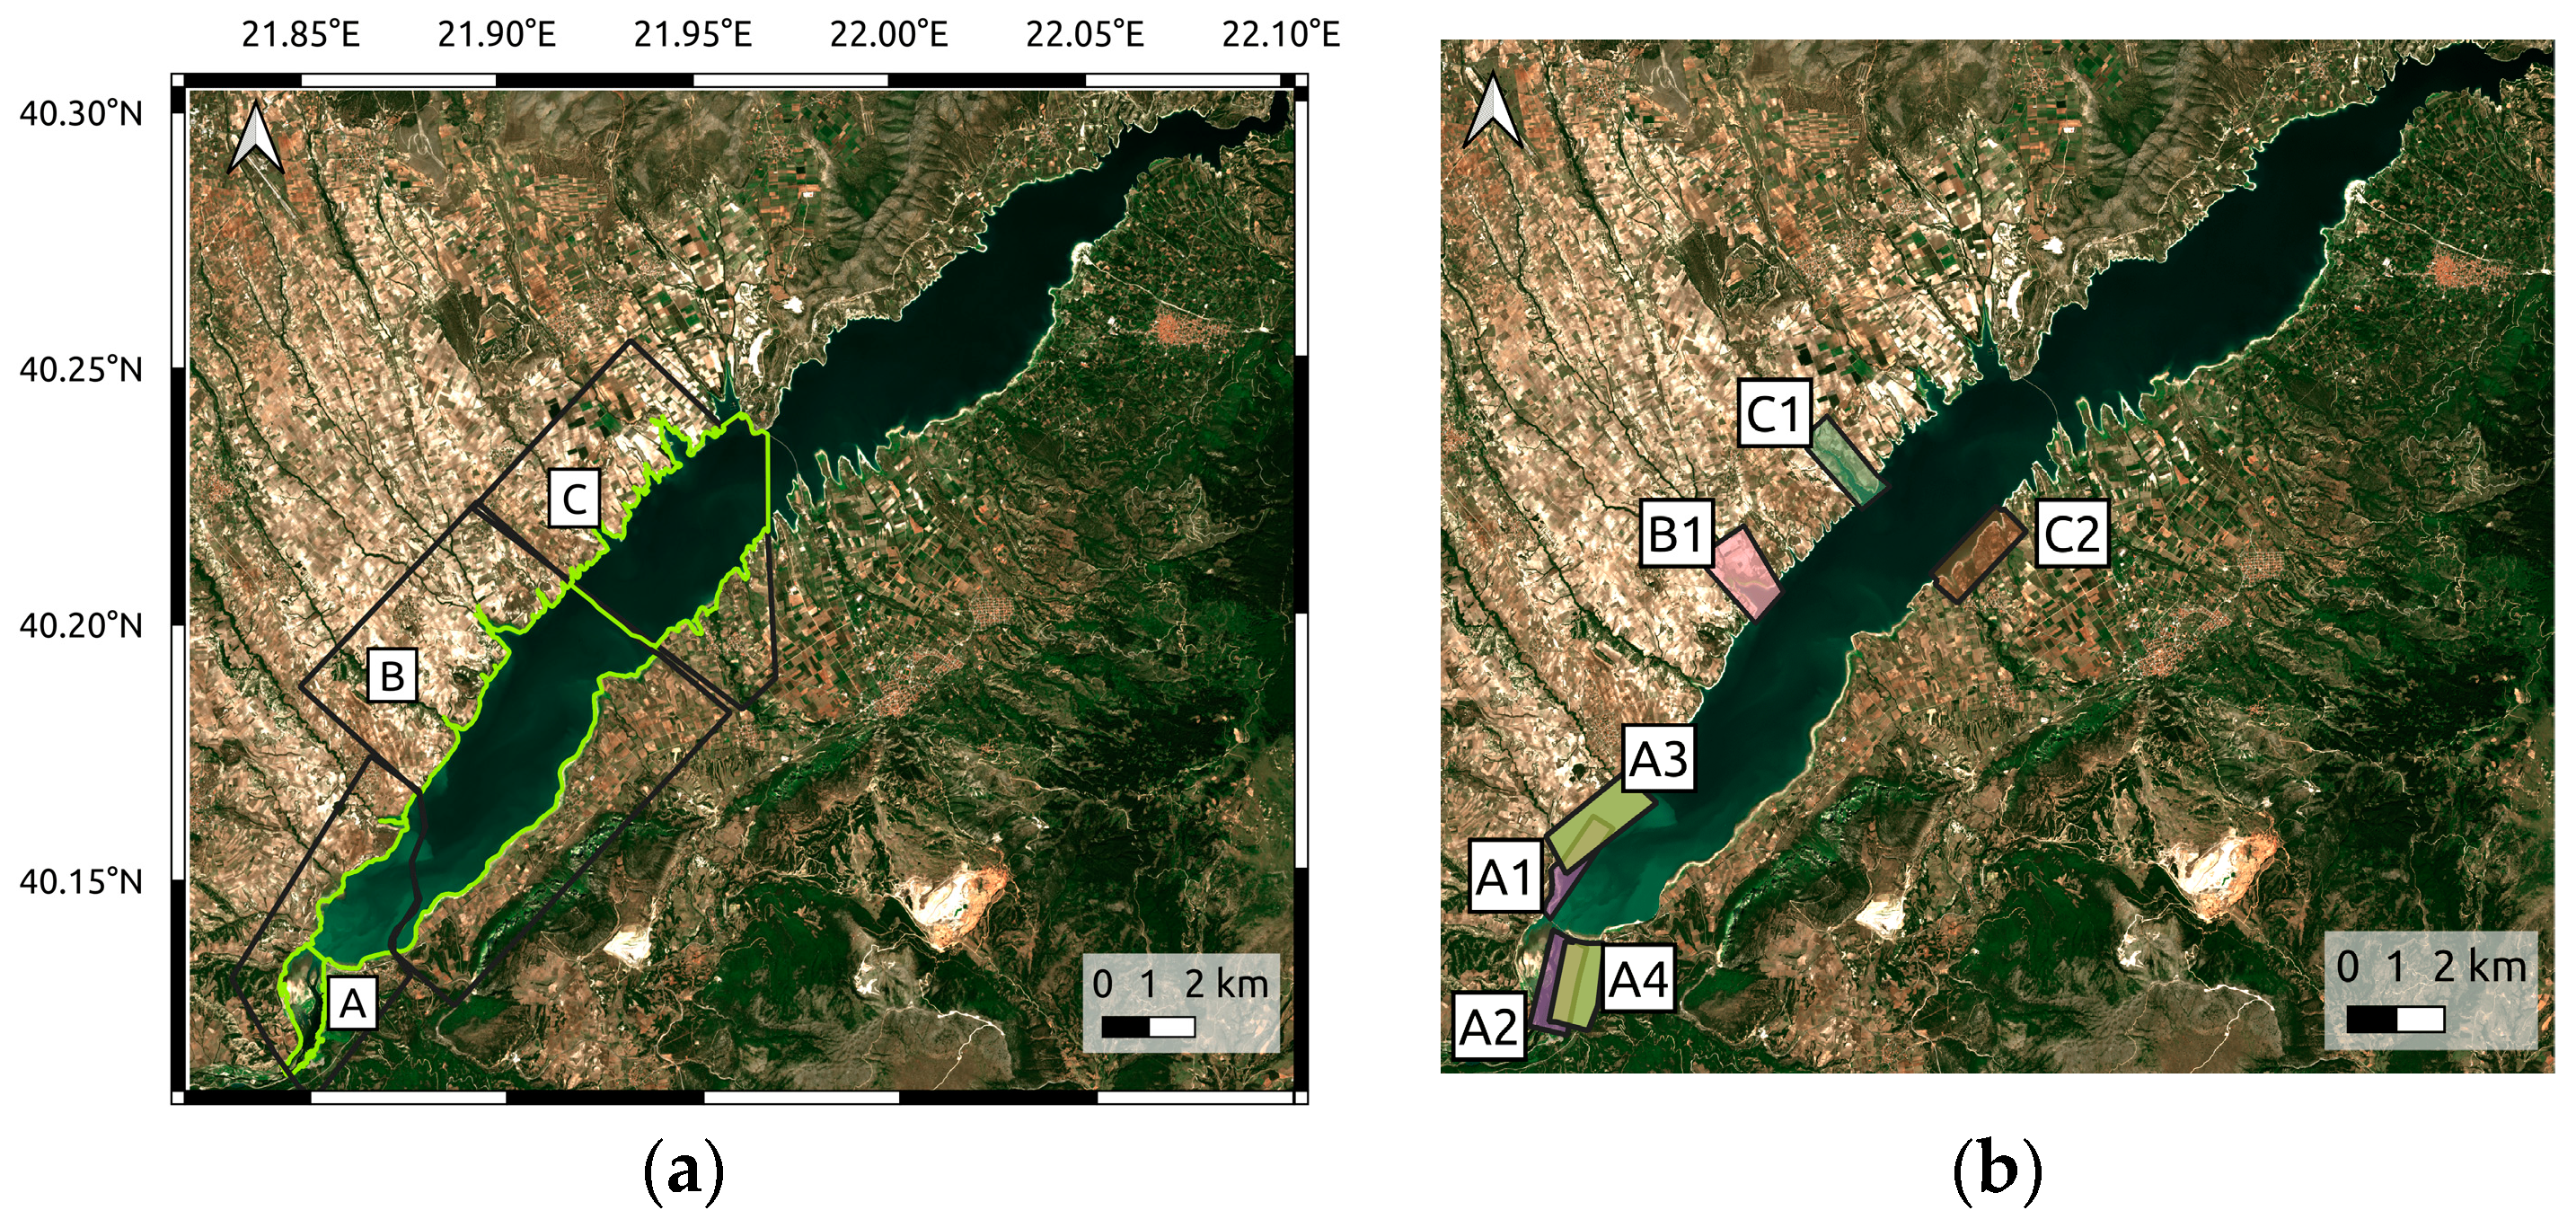
2.3. Reference Data
2.4. Methods
2.4.1. Inundation Mapping
2.4.2. Hydroperiod Estimation
2.4.3. Inundation Mapping with NDWI
2.4.4. Inundation Mapping in Support of Water-Level Data Extraction
3. Results
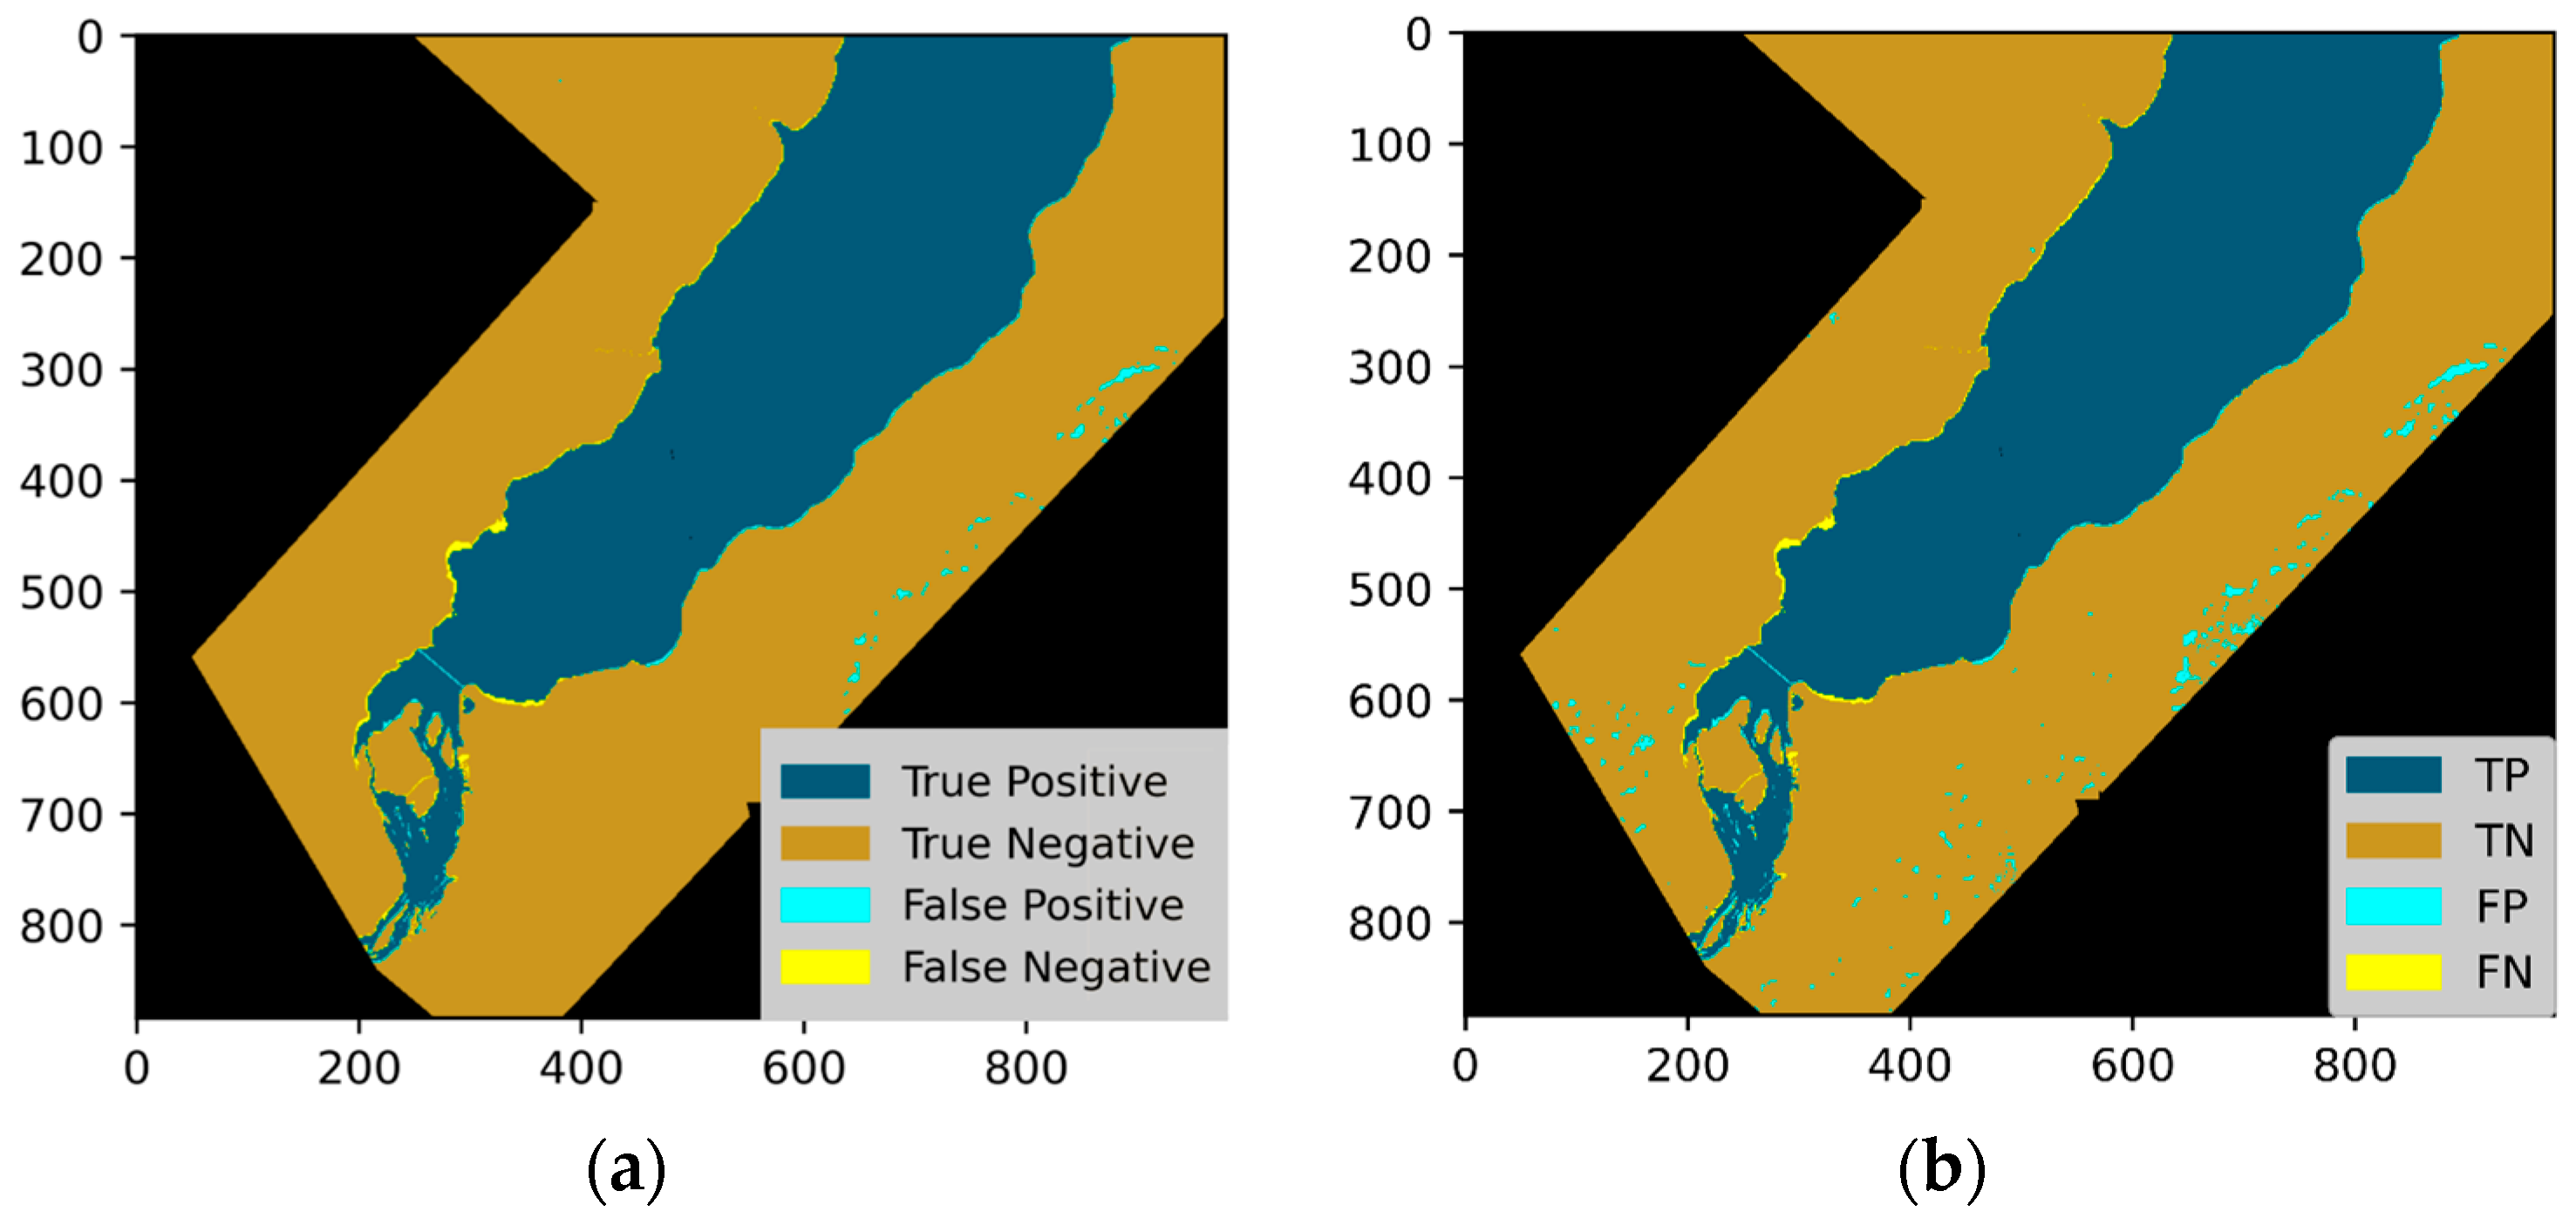
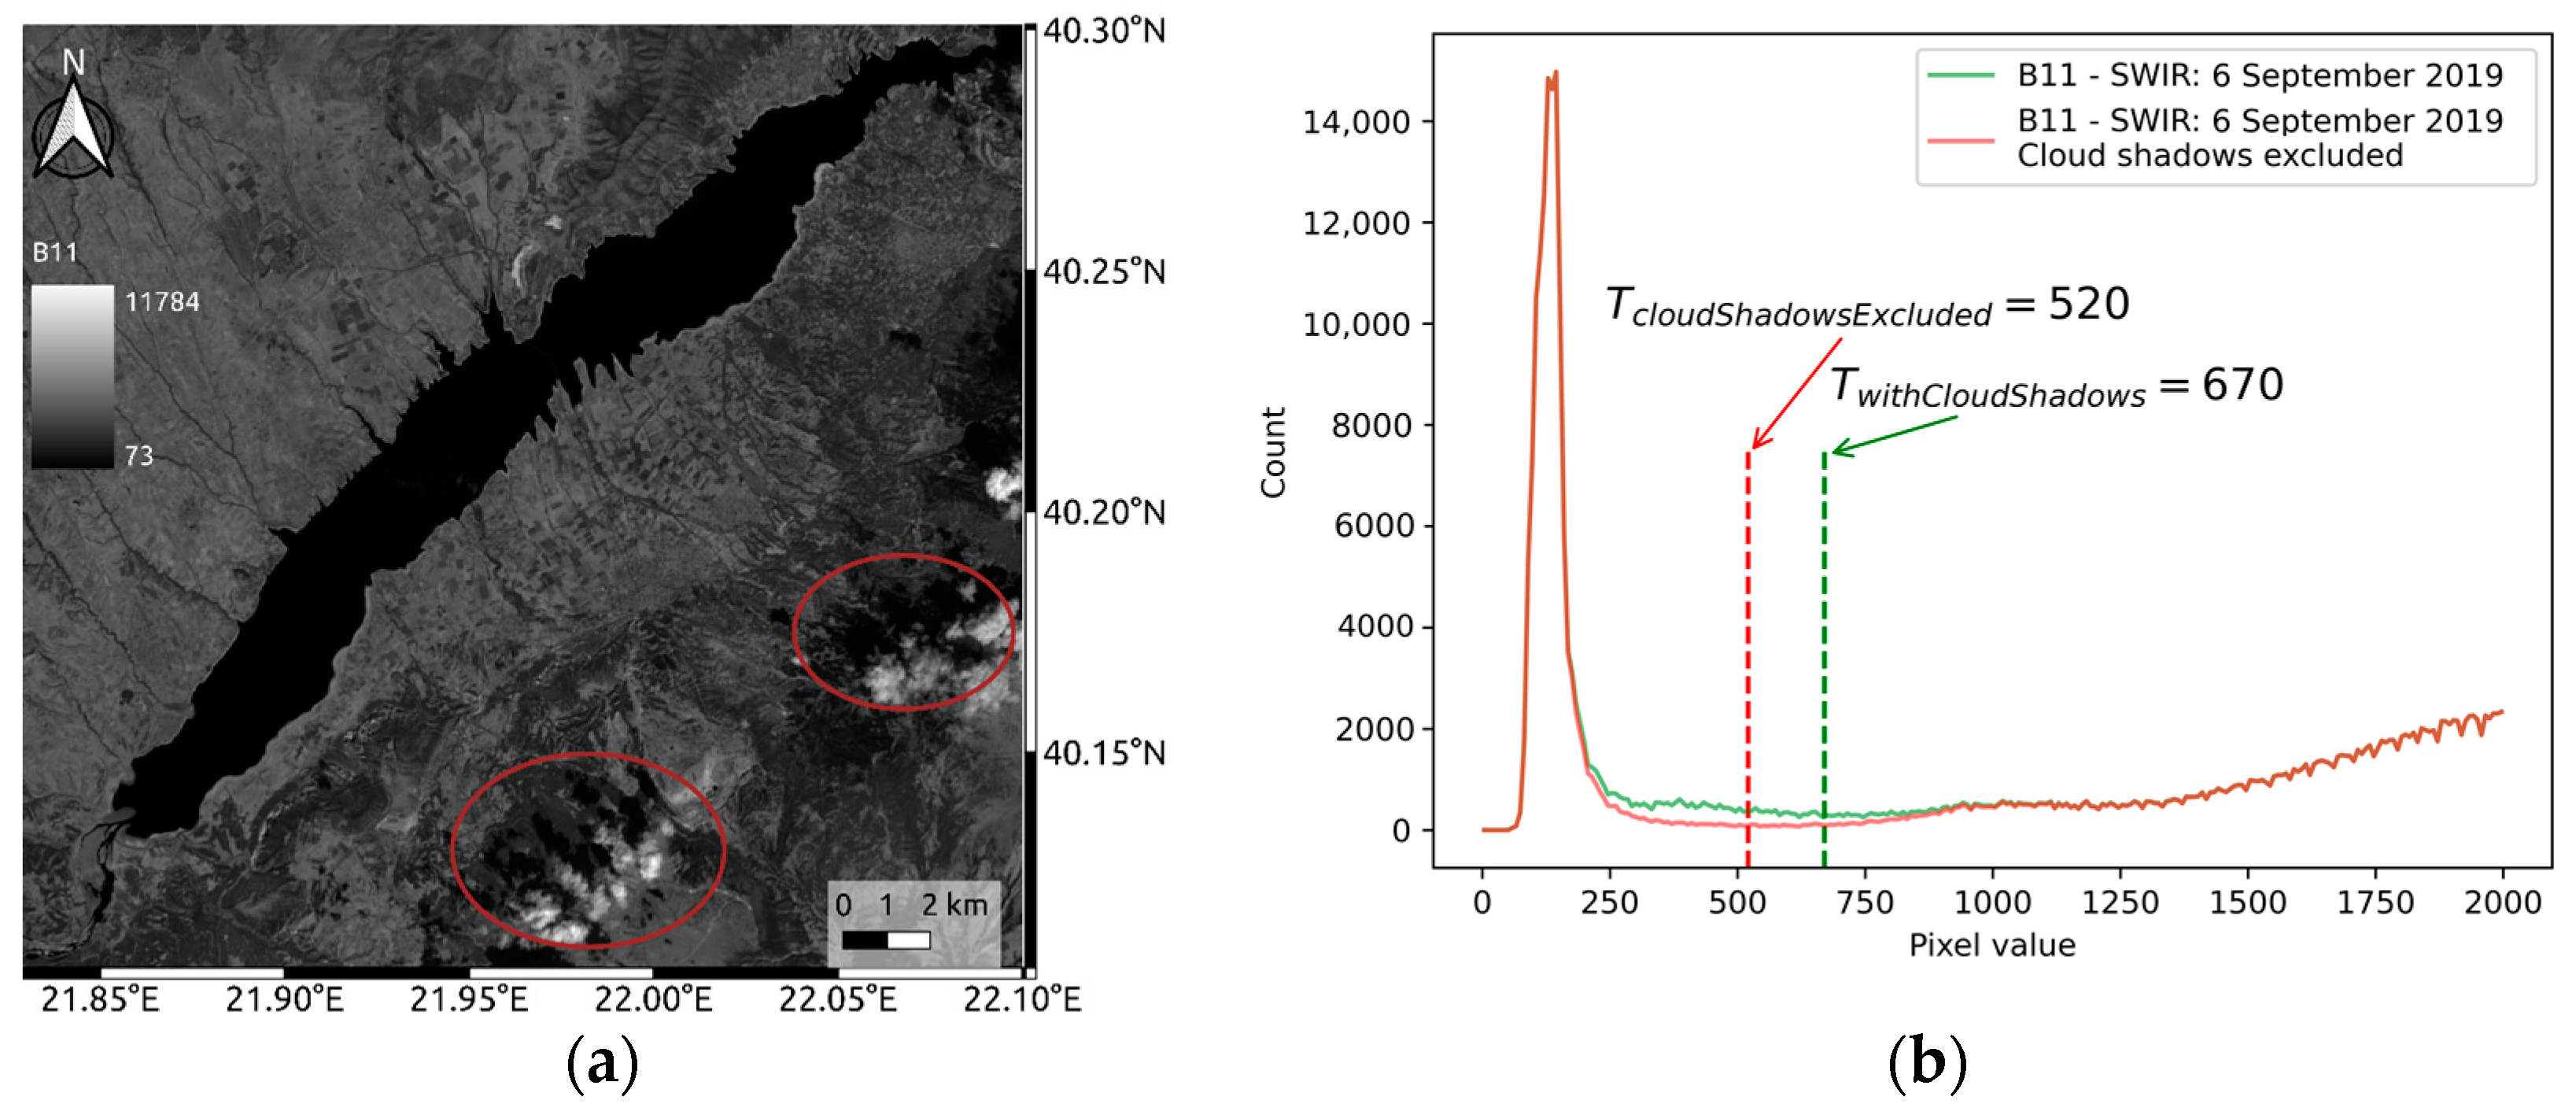
3.1. Inundation Maps Derivation from Multispectral Data
3.2. Inundation Maps Derivation from S1 and S2 Fused Data
- Four inundation maps created from S2 imagery.
- An on-screen digitized layer from GE Pro, namely the one on 16 October 2019.
3.3. Hydroperiod Estimation
3.4. Results Comparison with the NDWI
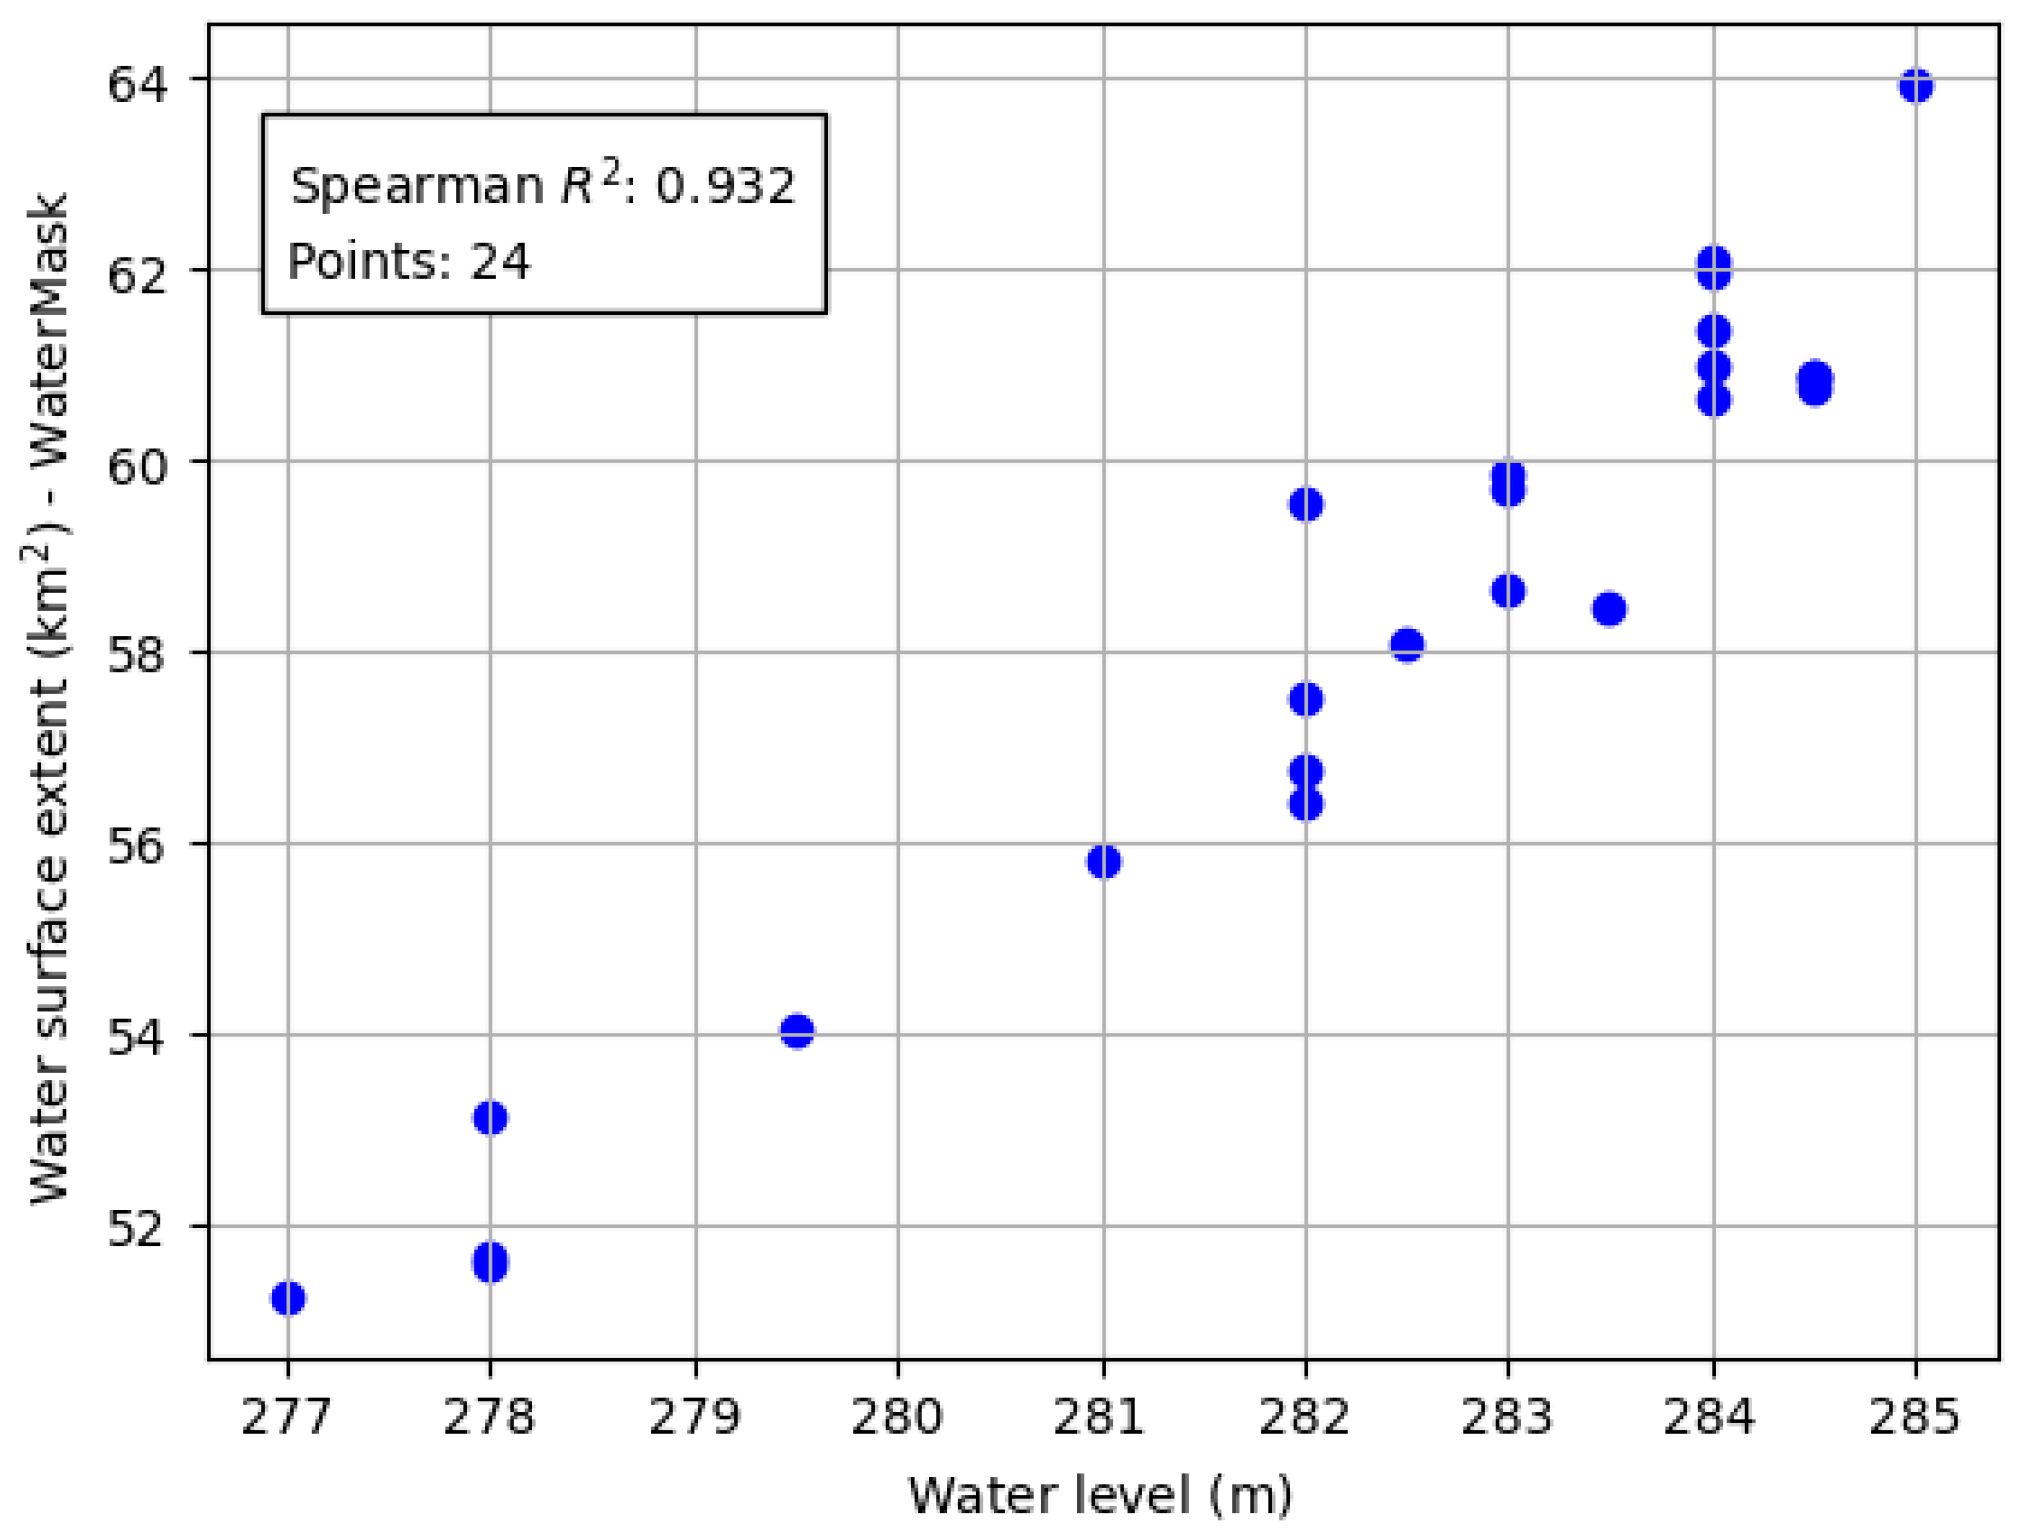
3.5. Comparison of the Water Surface Extent and Water Level Data
4. Discussion
5. Conclusions
Supplementary Materials
Author Contributions
Funding
Data Availability Statement
Conflicts of Interest
References
- Teng, J.; Jakeman, A.J.; Vaze, J.; Croke, B.F.; Dutta, D.; Kim, S. Flood inundation modelling: A review of methods, recent advances and uncertainty analysis. Environ. Model. Softw. 2017, 90, 201–216. [Google Scholar]
- McFeeters, S.K. The use of the Normalized Difference Water Index (NDWI) in the delineation of open water features. Int. J. Remote Sens. 1996, 17, 1425–1432. [Google Scholar] [CrossRef]
- Xu, H. Modification of normalised difference water index (NDWI) to enhance open water features in remotely sensed imagery. Int. J. Remote Sens. 2006, 27, 3025–3033. [Google Scholar] [CrossRef]
- Feyisa, G.L.; Meilby, H.; Fensholt, R.; Proud, S.R. Automated Water Extraction Index: A new technique for surface water mapping using Landsat imagery. Remote Sens. Environ. 2014, 140, 23–35. [Google Scholar] [CrossRef]
- Acharya, T.D.; Subedi, A.; Lee, D.H. Evaluation of Water Indices for Surface Water Extraction in a Landsat 8 Scene of Nepal. Sensors 2018, 18, 2580. [Google Scholar] [CrossRef] [Green Version]
- Goward, S.N.; Markham, B.; Dye, D.G.; Dulaney, W.; Yang, J. Normalized difference vegetation index measurements from the advanced very high resolution radiometer. Remote Sens. Environ. 1991, 35, 257–277. [Google Scholar] [CrossRef]
- Quang, D.N.; Linh, N.K.; Tam, H.S.; Viet, N.T. Remote sensing applications for reservoir water level monitoring, sustainable water surface management, and environmental risks in Quang Nam province, Vietnam. J. Water Clim. Chang. 2021, 12, 3045–3063. [Google Scholar] [CrossRef]
- Xu, N. Detecting coastline change with all available landsat data over 1986–2015: A case study for the state of Texas, USA. Atmosphere 2018, 9, 107. [Google Scholar] [CrossRef] [Green Version]
- Schwatke, C.; Scherer, D.; Dettmering, D. Automated Extraction of Consistent Time-Variable Water Surfaces of Lakes and Reservoirs Based on Landsat and Sentinel-2. Remote Sens. 2019, 11, 1010. [Google Scholar] [CrossRef] [Green Version]
- Bourgeau-Chavez, L.L.; Smith, K.B.; Brunzell, S.M.; Kasischke, E.S.; Romanowicz, E.A.; Richardson, C.J. Remote monitoring of regional inundation patterns and hydroperiod in the greater everglades using synthetic aperture radar. Wetlands 2005, 25, 176–191. [Google Scholar]
- Muro, J.; Canty, M.; Conradsen, K.; Hüttich, C.; Nielsen, A.A.; Skriver, H.; Remy, F.; Strauch, A.; Thonfeld, F.; Menz, G. Short-Term Change Detection in Wetlands Using Sentinel-1 Time Series. Remote Sens. 2016, 8, 795. [Google Scholar] [CrossRef] [Green Version]
- Zeng, L.; Schmitt, M.; Li, L.; Zhu, X. Analysing changes of the Poyang Lake water area using Sentinel-1 synthetic aperture radar imagery. Int. J. Remote Sens. 2017, 38, 7041–7069. [Google Scholar] [CrossRef]
- Binh, P.D.; Son, T.S. Monitoring spatial-temporal dynamics of small lakes based on SAR Sentinel-1 observations: A case study over Nui Coc Lake (Vietnam). Vietnam. J. Earth Sci. 2021, 43, 1–17. [Google Scholar] [CrossRef]
- Pekel, J.F.; Cottam, A.; Gorelick, N.; Belward, A. High-resolution mapping of global surface water and its long-term changes. Nature 2016, 540, 418–422. [Google Scholar] [CrossRef]
- Pham-Duc, B.; Frappart, F.; Tran-Anh, Q.; Si, S.T.; Phan, H.; Quoc, S.N.; Le, A.P.; Viet, B.D. Monitoring Lake Volume Variation from Space Using Satellite Observations-A Case Study in Thac Mo Reservoir (Vietnam). Remote Sens. 2022, 14, 4023. [Google Scholar] [CrossRef]
- Zhu, W.; Zhao, S.; Qiu, Z.; He, N.; Li, Y.; Zou, Z.; Yang, F. Monitoring and Analysis of Water Level-Water Storage Capacity Changes in Ngoring Lake Based on Multisource Remote Sensing Data. Water 2022, 14, 2272. [Google Scholar] [CrossRef]
- Khan, S.I.; Hong, Y.; Wang, J.; Yilmaz, K.K.; Gourley, J.J.; Adler, R.F.; Brakenridge, G.R.; Policelli, F.; Habib, S.; Irwin, D. Satellite remote sensing and hydrologic modeling for flood inundation mapping in Lake Victoria basin: Implications for hydrologic prediction in ungauged basins. IEEE Trans. Geosci. Remote Sens. 2010, 49, 85–95. [Google Scholar] [CrossRef] [Green Version]
- Kordelas, G.A.; Manakos, I.; Aragonés, D.; Díaz-Delgado, R.; Bustamante, J. Fast and automatic data-driven thresholding for inundation mapping with Sentinel-2 data. Remote Sens. 2018, 10, 910. [Google Scholar] [CrossRef] [Green Version]
- Kordelas, G.A.; Manakos, I.; Lefebvre, G.; Poulin, B. Automatic Inundation Mapping Using Sentinel-2 Data Applicable to Both Camargue and Doñana Biosphere Reserves. Remote Sens. 2019, 11, 2251. [Google Scholar] [CrossRef] [Green Version]
- Manakos, I.; Kordelas, G.A.; Marini, K. Fusion of Sentinel-1 data with Sentinel-2 products to overcome non-favourable atmospheric conditions for the delineation of inundation maps. Eur. J. Remote Sens. 2020, 53, 53–66. [Google Scholar] [CrossRef] [Green Version]
- Gikas, G.D.; Tsihrintzis, V.A.; Akratos, C.S.; Haralambidis, G. Water quality trends in Polyphytos reservoir, Aliakmon River, Greece. Environ. Monit. Assess. 2009, 149, 163–181. [Google Scholar] [CrossRef]
- Tian, K.; Yang, W.; Zhao, Y.W.; Yin, X.A.; Cui, B.S.; Yang, Z.F. Development of a Hydrological Boundary Method for the River–Lake Transition Zone Based on Flow Velocity Gradients, and Case Study of Baiyangdian Lake Transition Zones, China. Water 2020, 12, 674. [Google Scholar] [CrossRef] [Green Version]
- Copernicus SciHub. Available online: https://scihub.copernicus.eu/ (accessed on 2 June 2023).
- Congalton, R.G. A review of assessing the accuracy of classifications of remotely sensed data. Remote Sens. Environ. 1991, 37, 35–46. [Google Scholar] [CrossRef]
- Kanj, M.; Manakos, I.; Tsolakidis, I.; Katselas, N.; Kalaitzidis, C. Empirical estimation of surface water quality parameters in Lake Kerkini using Landsat ETM+/OLI. In Proceedings of the Eighth International Conference on Enviromental Management, Engineering, Planning and Economics (CEMEPE) and SECOTOX Conference, Skiathos Island, Greece, 5–9 June 2021; pp. 110–121. [Google Scholar]
- Lesiv, M.; See, L.; Laso-Bayas, J.C.; Sturn, T.; Schepaschenko, D.; Karner, M.; Moorthy, I.; McCallum, I.; Fritz, S. A global snapshot of the spatial and temporal distribution of very high resolution satellite imagery in Google Earth and Bing Maps as of 11th of January, 2017. Pangea 2018, 10, 1594. [Google Scholar] [CrossRef]
- Planet Labs. Available online: https://www.planet.com/products/monitoring/ (accessed on 7 July 2023).
- Hu, Q.; Wu, W.; Xia, T.; Yu, Q.; Yang, P.; Li, Z.; Song, Q. Exploring the Use of Google Earth Imagery and Object-Based Methods in Land Use/Cover Mapping. Remote Sens. 2013, 5, 6026–6042. [Google Scholar] [CrossRef] [Green Version]
- Maxar. Available online: https://www.maxar.com/ (accessed on 18 May 2023).
- Kullback, S. Information Theory and Statistics; Dover Publications: New York, NY, USA, 1968. [Google Scholar]
- Otsu, N.A. Threshold selection method from gray-level histograms. IEEE Trans. Syst. Man Cybern. 1979, 9, 62–66. [Google Scholar] [CrossRef] [Green Version]
- Manakos, I.; Kordelas, G.; Marini, K.; Bakratsas, M.; Chantziaras, G.; Simionesei, L.; Bramos, T.; Bonet García, F.J.; Herrero Lantarón, J.; Polo Gómez, M.J.; et al. Online Monitoring Data Services for Ecosystem Indicators. Project Deliverable D6.3. Centre for Research & Technology–Hellas (CERTH), 2018. Available online: https://ec.europa.eu/research/participants/documents/downloadPublic?documentIds=080166e5cd724649&appId=PPGMS (accessed on 14 May 2023).
- Sentinel Hub Authentication Page. Available online: https://apps.sentinel-hub.com/ (accessed on 12 July 2023).
- Zhou, Y.; Dong, J.; Xiao, X.; Xiao, T.; Yang, Z.; Zhao, G.; Zou, Z.; Qin, Y. Open Surface Water Mapping Algorithms: A Comparison of Water-Related Spectral Indices and Sensors. Water 2017, 9, 256. [Google Scholar] [CrossRef]
- Wang, Z.; Liu, J.; Li, J.; Zhang, D.D. Multi-Spectral Water Index (MuWI): A Native 10-m Multi-Spectral Water Index for Accurate Water Mapping on Sentinel-2. Remote Sens. 2018, 10, 1643. [Google Scholar] [CrossRef] [Green Version]
- Du, Y.; Zhang, Y.; Ling, F.; Wang, Q.; Li, W.; Li, X. Water Bodies’ Mapping from Sentinel-2 Imagery with Modified Normalized Difference Water Index at 10-m Spatial Resolution Produced by Sharpening the SWIR Band. Remote Sens. 2016, 8, 354. [Google Scholar] [CrossRef] [Green Version]
- Harmel, T.; Chami, M.; Tormos, T.; Reynaud, N.; Danis, P.A. Sunglint correction of the Multi-Spectral Instrument (MSI)SENTINEL-2 imagery over inland and sea waters from SWIR bands. Remote Sens. Environ. 2018, 204, 308–321. [Google Scholar] [CrossRef]
- ESA SNAP (Sentinel Application Platform), Version 9.0.3; European Space Agency: Frascati, Italy, 2021. Available online: https://step.esa.int/main/toolboxes/snap/(accessed on 12 July 2023).



| Cycle | September | October | November | December | January | February | March | April | May | June | July | August |
|---|---|---|---|---|---|---|---|---|---|---|---|---|
| 2017–2018 | 1, 6, 16 | 6, 21 | - | 5, 20, 25 | 19, 29 | - | 10, 30 | 4, 9, 19, 24 | 9, 14 | 8, 18 | 3, 23, 28 | 17, 22 |
| 2018–2019 | 1, 6, 11, 21 | 1, 16, 26, 31 | - | 20 | - | 8, 18, 28 | 5, 10, 25, 30 | 4, 29 | 29 | 8, 13, 18, 28 | 3, 8, 13, 18, 28 | 2, 7, 12, 17 |
| 2019–2020 | 1, 6, 11, 16, 26 | 1, 6, 11, 16, 21, 26 | 5, 10, 15 | 15 | 4, 9, 24 | 3, 8, 13, 18 | 19 | 8, 13, 18 | 8, 13, 18, 23 | 2, 7 | 2, 7, 12, 17, 22, 27 | 11, 16, 21, 26, 31 |
| 2020–2021 | 5, 10, 15, 25 | 10 | 9, 14, 24 | - | 18, 28 | 2, 12, 17, 27 | 4, 14, 10 | 3, 28 | 3, 8, 13, 18, 23, 28 | 2, 12, 22, 27 | 2, 12, 17, 22, 27 | 1, 16 |
| Year | February | March | April | May | June | July | August | September | October | November | December |
|---|---|---|---|---|---|---|---|---|---|---|---|
| 2019 | 11 23 | 04 16 28 | 16 22 | 03 15 27 | 09 21 | ||||||
| 2020 | 24 30 | 12 24 | 16 29 | 10 22 28 | 10 22 28 | 04 16 28 | 09 | ||||
| 2021 | 12 | 08 14 26 | 14 19 | 08 13 31 | 06 12 25 | 07 12 18 24 | 05 17 29 | 05 17 |
| Region | Date | Image Source/Copyrights |
|---|---|---|
| A | 31 August 2020 | Maxar Technologies 2022 (Westminster, CO, USA) |
| 9 April 2020 | Maxar Technologies 2022 | |
| 17 October 2019 | Landsat/Copernicus | |
| 30 March 2018 | CNES/Airbus, 2022 | |
| B | 31 August 2020 | Maxar Technologies 2022 |
| 9 April 2020 | Maxar Technologies 2022 | |
| 17 October 2019 | Landsat/Copernicus | |
| 30 March 2018 | Maxar Technologies 2022 | |
| C | 31 August 2020 9 April 2020 | Maxar Technologies 2022 |
| Maxar Technologies 2022. | ||
| CNES/Airbus, 2022 |
| Region | Date |
|---|---|
| AOI A1 | 31 August 2020 |
| AOI A2 | 31 August 2020 |
| AOI A3 | 9 April 2020 |
| AOI A4 | 9 April 2020 |
| AOI B1 | 31 August 2020 |
| AOI C1 | 31 August 2020 |
| AOI C2 | 9 April 2020 |
| Alt (Input Band) | Thresholding Method | OA (%) | PA (%) | UA (%) | Kappa |
|---|---|---|---|---|---|
| Alt1 | MCET | 98.83 | 97.67 | 98.98 | 0.974 |
| Alt1 | Avg | 98.60 | 98.33 | 97.66 | 0.969 |
| Alt1 | OTSU | 97.98 | 98.81 | 95.56 | 0.956 |
| Alt2 | MCET | 98.63 | 98.73 | 97.07 | 0.967 |
| Alt2 | Avg | 97.76 | 99.17 | 91.84 | 0.927 |
| Alt2 | OTSU | 95.81 | 99.44 | 82.22 | 0.838 |
| Alt3 | MCET | 98.51 | 98.76 | 97.38 | 0.970 |
| Alt3 | Avg | 96.62 | 99.21 | 94.66 | 0.951 |
| Alt3 | OTSU | 92.27 | 98.95 | 90.09 | 0.910 |
| Region | Date of GE Images | Date of S2 | OA (%) | PA (%) | UA (%) | Kappa |
|---|---|---|---|---|---|---|
| A | 30 March 2018 | 30 March 2018 | 98.0 | 97.4 | 96.8 | 0.956 |
| A | 9 April 2020 | 8 April 2020 | 98.6 | 96.4 | 98.4 | 0.965 |
| A | 31 August 2020 | 31 August 2020 | 97.8 | 92.5 | 98.7 | 0.94 |
| A | 17 October 2019 | 16 October 2019 | 98.2 | 89.4 | 97.9 | 0.92 |
| B | 30 March 2018 | 30 March 2018 | 99.3 | 99.6 | 98.7 | 0.985 |
| B | 31 August 2020 | 31 August 2020 | 99.5 | 98.7 | 99.8 | 0.989 |
| C | 9 April 2020 | 8 April 2020 | 99.0 | 97.9 | 99.8 | 0.98 |
| C | 31 August 2020 | 31 August 2020 | 98.8 | 96.8 | 99.9 | 0.975 |
| Ref. Layers from Maxar | Ref. Layers from GE | ||||||
|---|---|---|---|---|---|---|---|
| Alt | Thresh. Method | PA (%) | UA (%) | Kappa | PA (%) | UA (%) | Kappa |
| Alt1 | MCET | 86.75 | 96.81 | 0.876 | 88.49 | 98.18 | 0.8993 |
| Alt1 | Avg | 89.78 | 95.42 | 0.89 | 91.78 | 96.97 | 0.9161 |
| Alt1 | OTSU | 92.13 | 93.89 | 0.895 | 94.09 | 95.44 | 0.9222 |
| Alt2 | MCET | 91.39 | 94.48 | 0.895 | 93.52 | 96.13 | 0.9230 |
| Alt2 | Avg | 93.51 | 92.31 | 0.894 | 95.66 | 93.89 | 0.9216 |
| Alt2 | OTSU | 94.97 | 86.32 | 0.854 | 97.01 | 87.67 | 0.8792 |
| Alt3 | MCET | 91.54 | 94.57 | 0.897 | 93.68 | 96.22 | 0.9249 |
| Alt3 | Avg | 93.67 | 92.30 | 0.895 | 95.88 | 93.93 | 0.9234 |
| Alt3 | OTSU | 90.85 | 94.79 | 0.893 | 92.96 | 96.43 | 0.921 |
Disclaimer/Publisher’s Note: The statements, opinions and data contained in all publications are solely those of the individual author(s) and contributor(s) and not of MDPI and/or the editor(s). MDPI and/or the editor(s) disclaim responsibility for any injury to people or property resulting from any ideas, methods, instructions or products referred to in the content. |
© 2023 by the authors. Licensee MDPI, Basel, Switzerland. This article is an open access article distributed under the terms and conditions of the Creative Commons Attribution (CC BY) license (https://creativecommons.org/licenses/by/4.0/).
Share and Cite
Kita, A.; Manakos, I.; Papadopoulou, S.; Lioumbas, I.; Alagialoglou, L.; Katsiapi, M.; Christodoulou, A. Land–Water Transition Zone Monitoring in Support of Drinking Water Production. Water 2023, 15, 2596. https://doi.org/10.3390/w15142596
Kita A, Manakos I, Papadopoulou S, Lioumbas I, Alagialoglou L, Katsiapi M, Christodoulou A. Land–Water Transition Zone Monitoring in Support of Drinking Water Production. Water. 2023; 15(14):2596. https://doi.org/10.3390/w15142596
Chicago/Turabian StyleKita, Afroditi, Ioannis Manakos, Sofia Papadopoulou, Ioannis Lioumbas, Leonidas Alagialoglou, Matina Katsiapi, and Aikaterini Christodoulou. 2023. "Land–Water Transition Zone Monitoring in Support of Drinking Water Production" Water 15, no. 14: 2596. https://doi.org/10.3390/w15142596
APA StyleKita, A., Manakos, I., Papadopoulou, S., Lioumbas, I., Alagialoglou, L., Katsiapi, M., & Christodoulou, A. (2023). Land–Water Transition Zone Monitoring in Support of Drinking Water Production. Water, 15(14), 2596. https://doi.org/10.3390/w15142596


