Article

Effect of Soil Texture on Water and Salt Transport in Freeze—Thaw Soil in the Shallow Groundwater Area

1
College of Water Resources and Engineering, Taiyuan University of Technology, Taiyuan 030024, China
2
Taigu Water Balance Experimental Field, Hydrology and Water Resources Survey Station of Shanxi Province, Jinzhong 030800, China
*
Author to whom correspondence should be addressed.
Water 2023, 15(14), 2587; https://doi.org/10.3390/w15142587
Submission received: 9 June 2023 / Revised: 8 July 2023 / Accepted: 14 July 2023 / Published: 16 July 2023
(This article belongs to the Topic Hydrology and Water Resources in Agriculture and Ecology)

Abstract

:
Research on the variation in soil water, heat, and salt in unsaturated zones during the freeze–thaw process has great significance in efficiently utilizing water resources and preventing soil salinization. The freeze–thaw field experiment was carried out with the lysimeter as the test equipment to analyze characteristics of the soil freeze–thaw process, profile water content, main ion content, and salt content of three textured soils with the groundwater table depth of 0.5 m. The results showed that the soil temperature gradient and freezing depth were greater as the average soil particle size increased. The increment of water content at the depth of 0 to 30 cm in sandy loam and loamy sand decreased by 40.20~93.10% and 28.14~65.52% compared with that in sandy soil, and the average increment of salt content at the depth of 0 to 30 cm decreased as the average soil particle size increased during the freeze–thaw period. The average content of Ca2+, Na+, Cl, and SO42− in loamy sand and sandy soil decreased by 4.37~45.50% and 22.60~70.42% compared with that in sandy loam at the end of the freeze–thaw period, and the correlation between soil salt content and water content decreased with the increase in the average soil particle size. The research results can provide a theoretical basis for soil salinization prevention and crop production in shallow groundwater areas.

1. Introduction

Most of the northern regions of China are seasonally frozen soil areas, where the transformation of phreatic water in the shallow groundwater zone is unusually strong [1]. The salt in the groundwater is transported to the unsaturated zone as the phreatic water migrates upward under the action of the soil water potential gradient during the freezing process [2]. It is easy to form soil salinization due to drought and intense evaporation in winter and spring [3,4]. The redistribution of water and salt in shallow groundwater areas caused by freezing and thawing processes is one of the main causes of soil salinization [5,6]. Salinized land is widely distributed in the world, and there are many types of it due to different soil textures and hydrological characteristics between regions [7]. Soil salinization not only affects the balance of the ecological environment but also restricts the virtuous cycle of the natural environment [8] and limits crop growth and production [9]. Therefore, the in-depth study of the migration law of water and salt in the unsaturated zone of soils with different textures in shallow groundwater areas under freeze–thaw action can provide a theoretical basis for the prevention of soil salinization in different regions, which has great significance for the efficient utilization of water resource and agricultural production in seasonally frozen soil areas.
The migration of soil salt under freeze–thaw action is the result of the combined action of water convection, concentration gradient, and temperature gradient [5]; soil salt moves convectively along with soil water under the action of the matrix potential gradient and temperature gradient, and it diffuses under the action of the concentration potential gradient. Scholars have explored the transport law of soil salt in the unsaturated zone during the freeze–thaw period through experimental research [10,11] and numerical simulation [12,13,14]. It was found that surface mulching [15,16], autumn irrigation [13], and barrier measures [17] could inhibit the accumulation of soil salt on the surface, while soil bulk density [18], initial soil salinization degree [19], the freeze–thaw cycle [20], particle gradation [21], and initial soil water content [22] also affected the variation in salt content in the soil profile during the freeze–thaw period.
Soil texture affects soil hydraulic properties [23] and thermal conductivity [24], which relate to the distribution of soil water, heat, and salt. In non-freeze–thaw periods, a lot of research has been carried out on the effect of soil texture on soil salt transport under different experimental conditions [25,26,27,28], under the condition of salt water irrigation, the soil texture affected the process of salt stress [29], and soil salt content was significantly affected by clay content [30]. The thickness of the interlayer [31], the constitution of the soil layer [26], and the soil texture under the intermittent irrigation condition [32] also affected the migration and distribution of water and salt in the soil. In addition, soil texture affected the degree of retardation of salt on water migration, and the inhibition effect of salt on evaporation was stronger in homogeneous soil than that in heterogeneous soil [33]. However, the transformation of phreatic water and the corresponding salt transport become extremely complex in the freeze–thaw period; quantitative analyses of the influence of soil texture on soil salt content and the correlation between soil water and salt at different depths have yet to be performed, but some research has been conducted on the transformation of phreatic water [34,35]. The inadequate understanding of the law of salt transport in different textured soils during the freeze–thaw period prompted this study.
The freeze–thaw cycle of soil is a complex process, accompanied by physical, chemical, and mechanical effects such as heat conduction, water phase change, solute transport, etc. The distribution of soil pollutants [36,37,38,39,40,41] and the climate types in different regions and different periods in the same region are complex and variable, and therefore, outdoor experiments and numerical simulations are conducted more frequently to monitor and simulate the transport process of water and solute in freeze–thaw soils under conditions of natural environmental change. Multiple sets of outdoor experiments were carried out during a freeze–thaw period in this paper. Only by comprehensively understanding the migration path and evolution law of soil salt in unsaturated zones of different textured soils can we grasp the dynamics of soil salt migration in different regions and make reasonable use of and improvements in salinized land.
An experimental study on the variation in soil water, heat, and salt in the unsaturated zone of shallow groundwater areas under freeze–thaw action was carried out; the study discussed the spatial and temporal variation in soil temperature and soil water content, analyzed the effect of soil texture on the migration of soil anions, cations, and salt during the freeze–thaw period, and explored the correlation between soil salt content and water content at different depths via Pearson correlation analysis, all of which revealed the characteristics of variation in water content and salt content in different textured soils and provided a basis for the rational planning and utilization of salinized land.

2. Materials and Methods

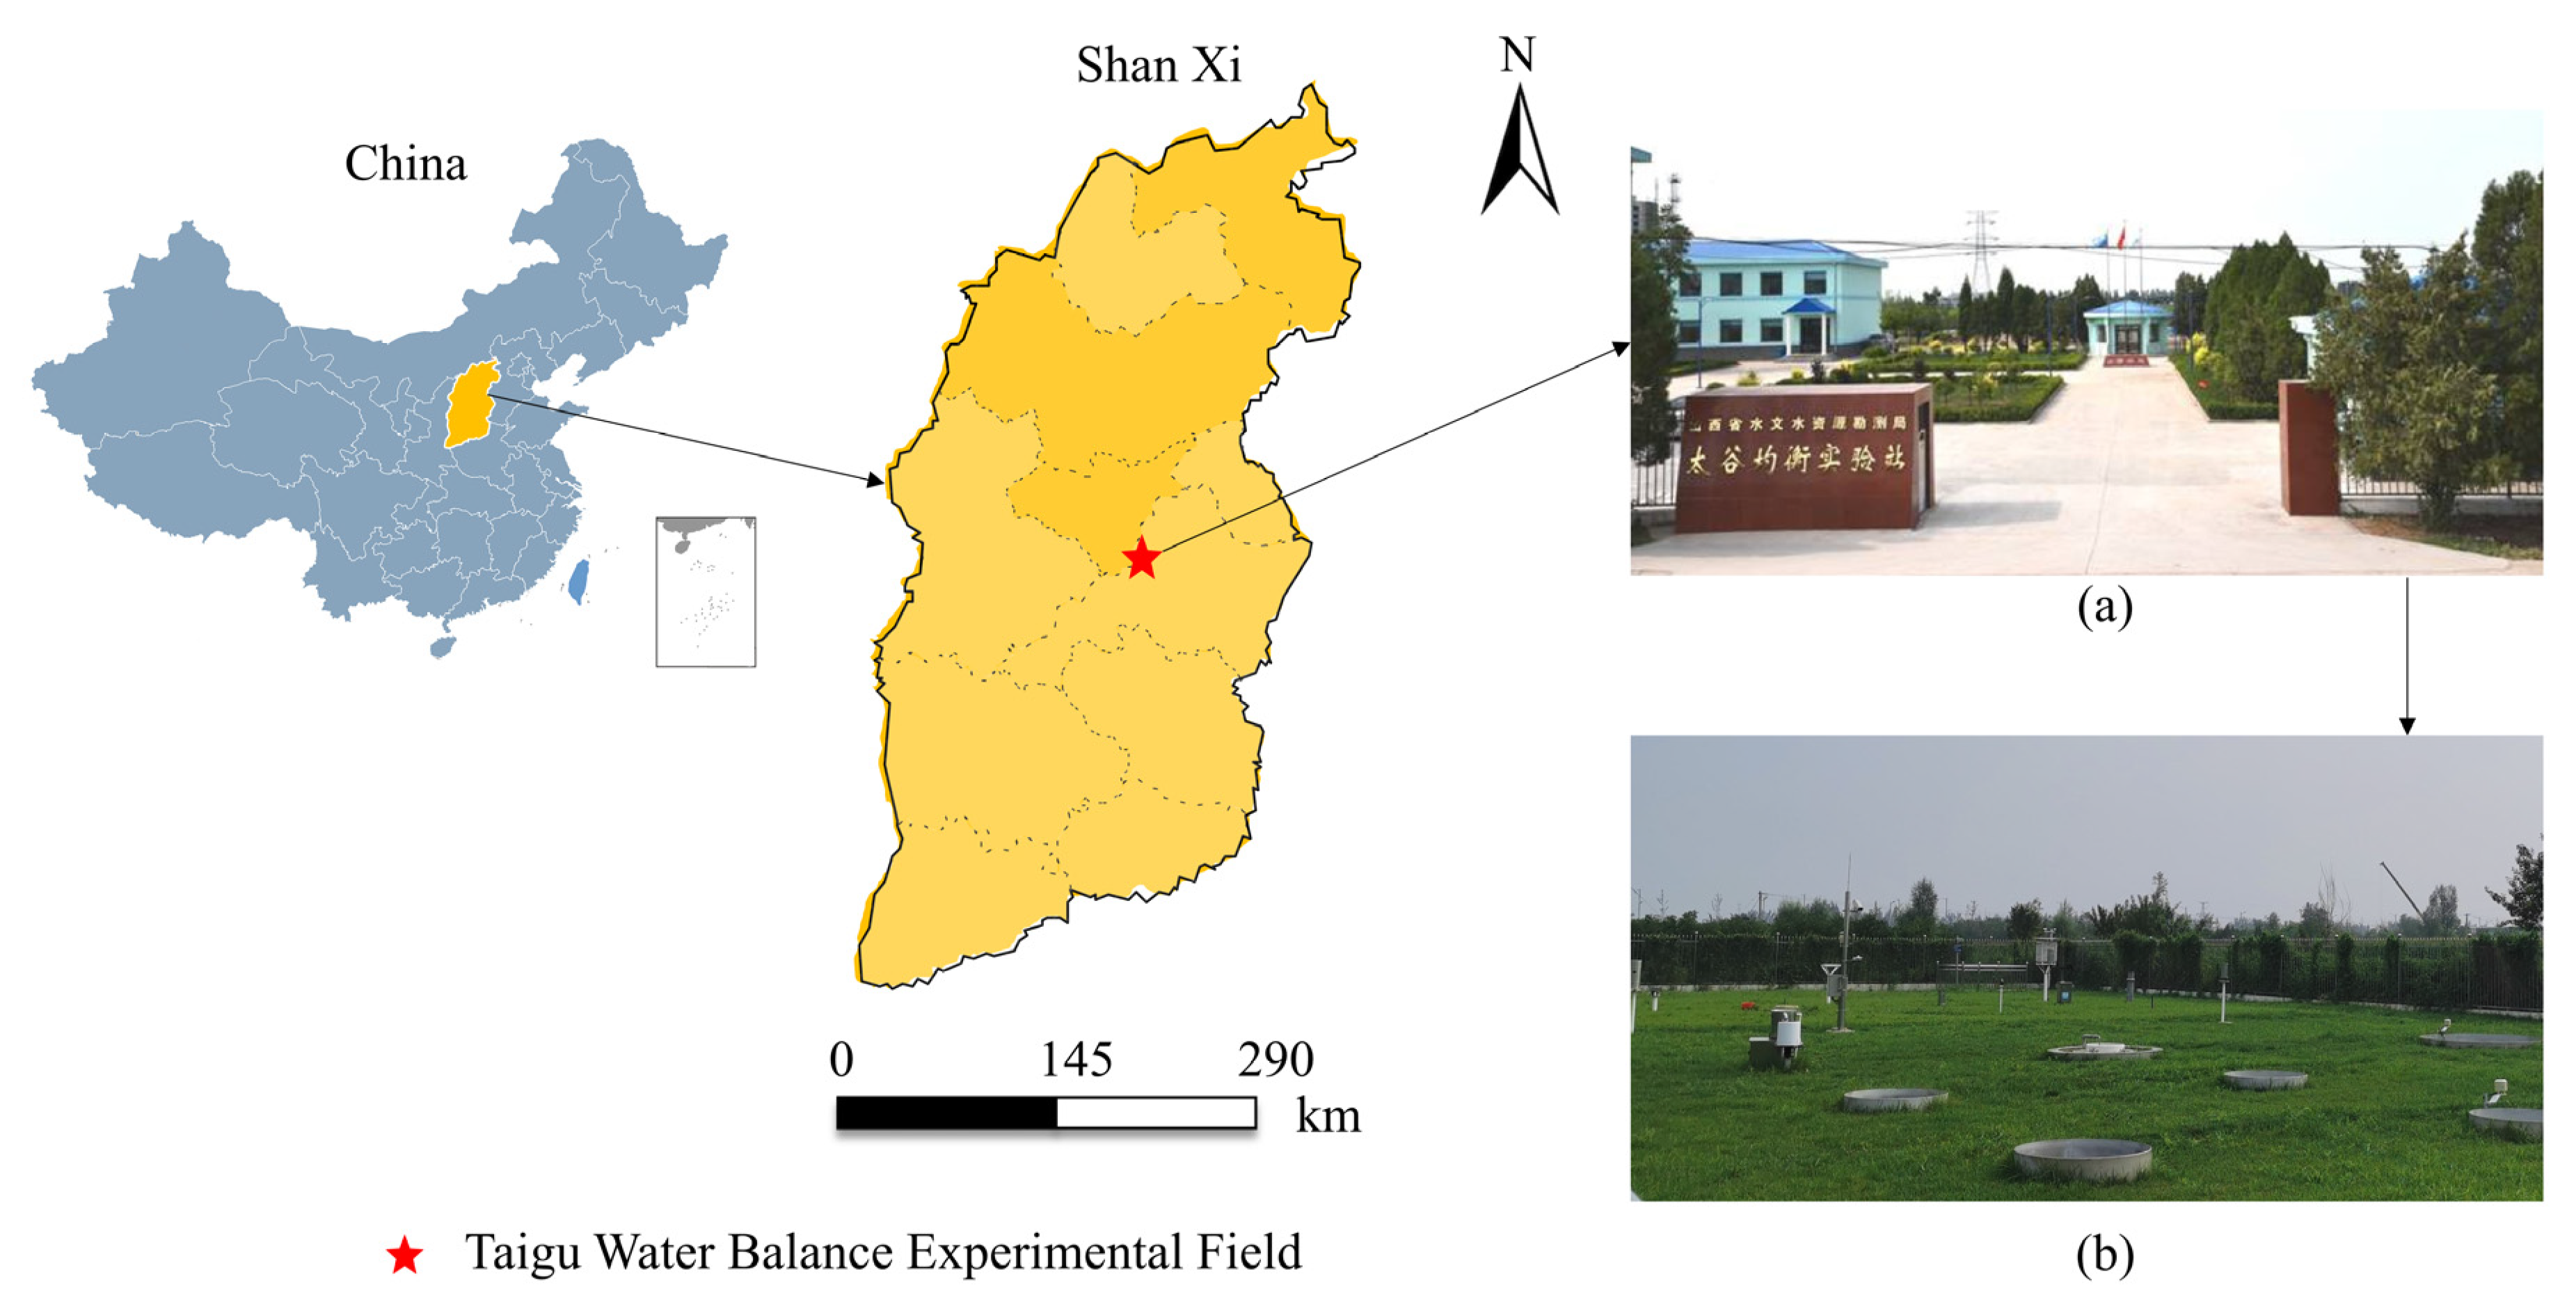
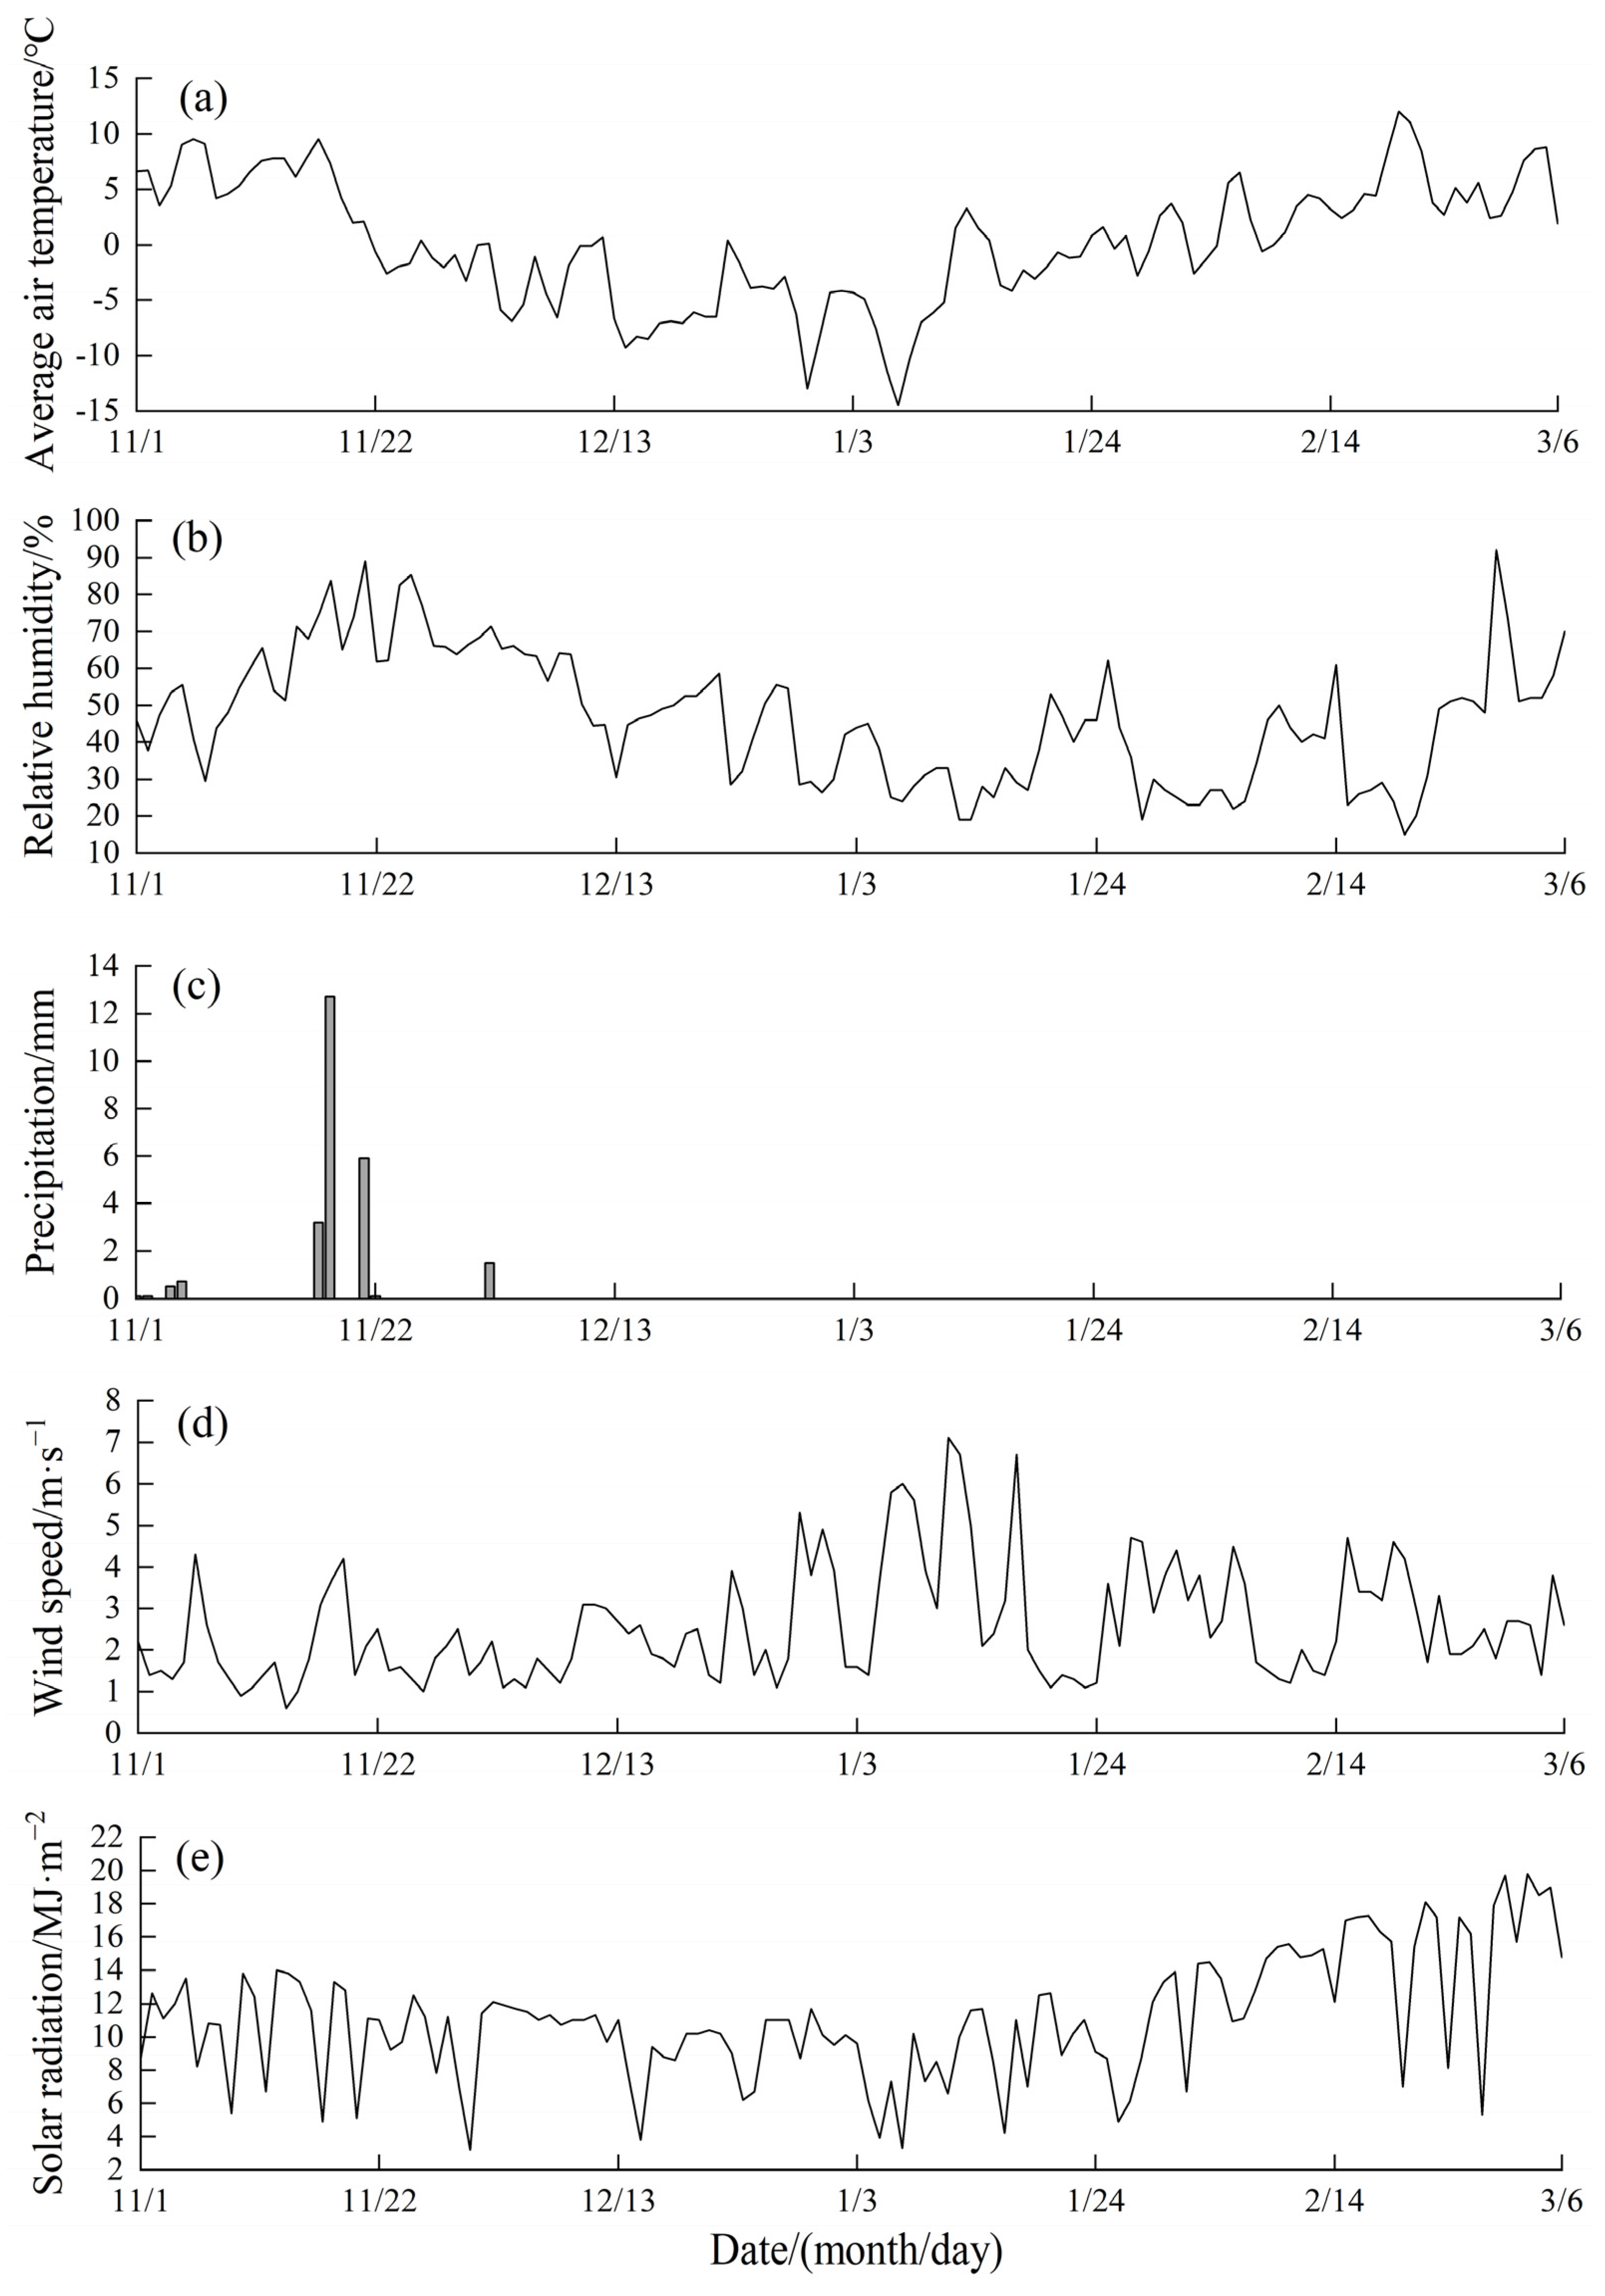
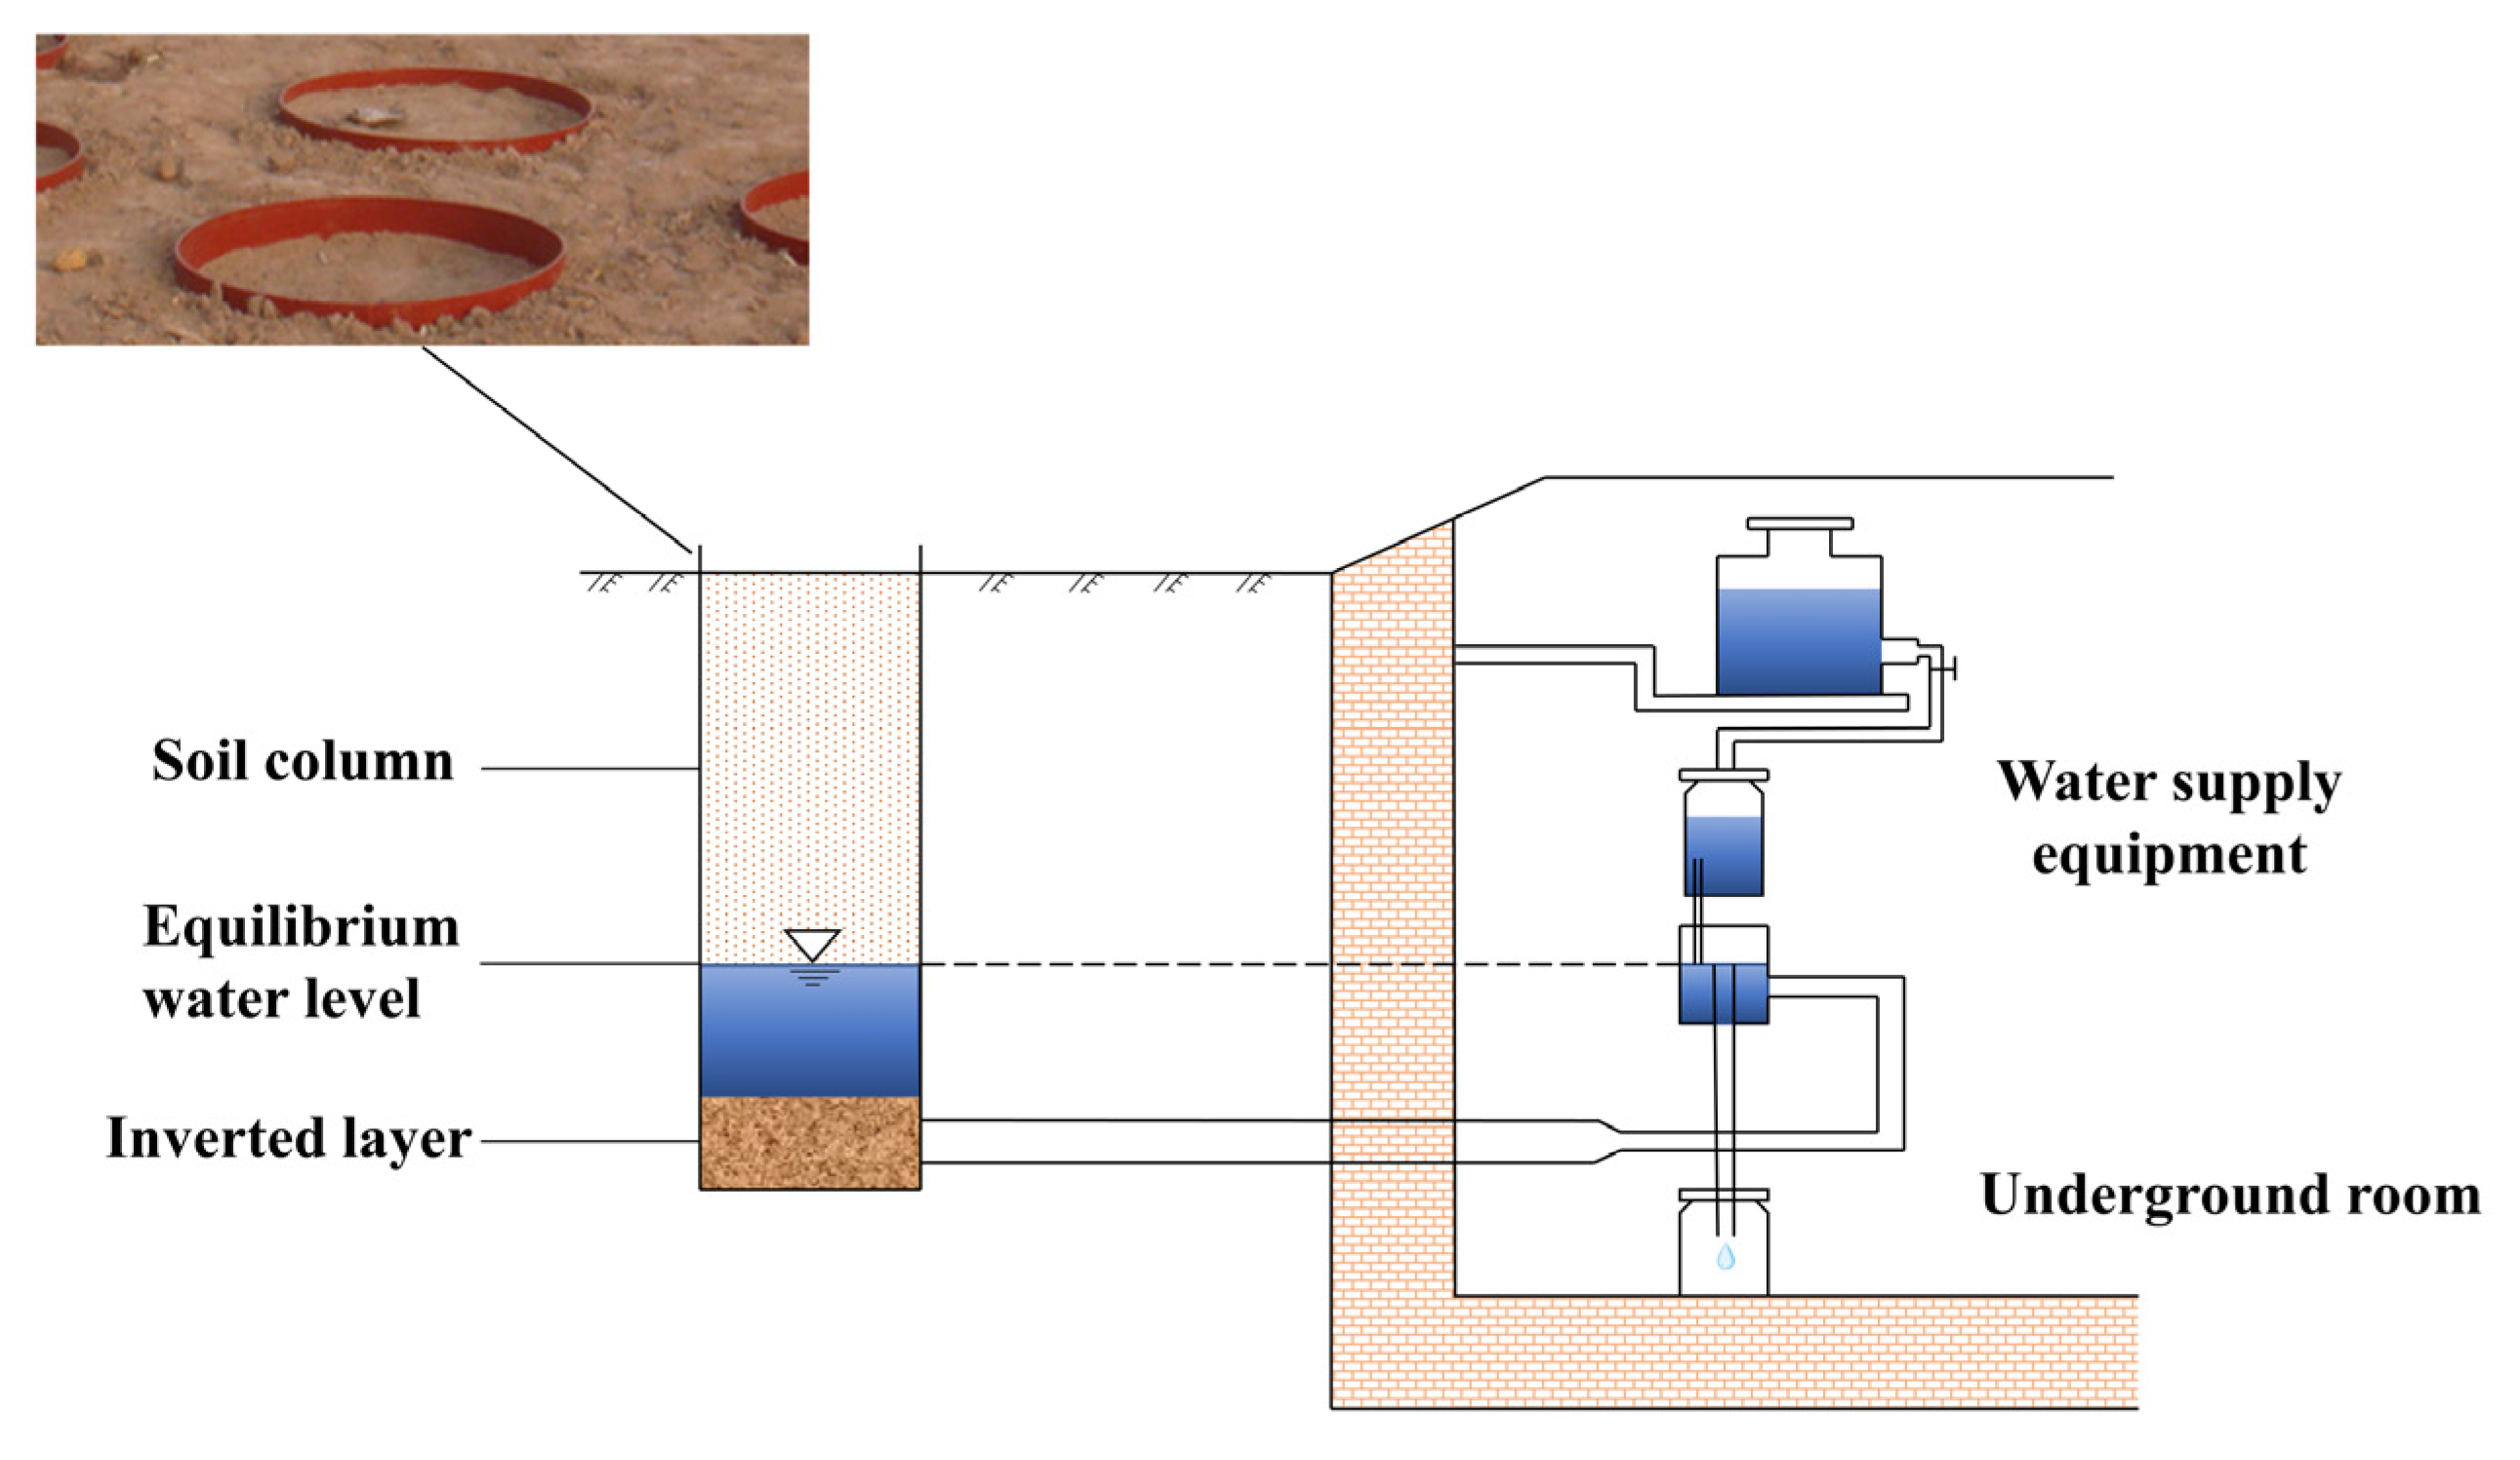
2.1. Experimental Conditions

The field experiment was carried out from November 2020 to March 2021 at the Taigu Water Balance Experimental Field of the Hydrology and Water Resources Survey Station in the Jinzhong Basin, Shanxi Province (Figure 1), geographically located at 112°30′32.58″ E and 37°26′11.74″ N, with an altitude of 777.0 m and a ground slope of 0.3%. The area is characterized by a continental semi-arid climate, with an annual average temperature of 9.95 °C, annual precipitation of 415 mm, mainly concentrated in June to September, and an annual average water surface evaporation of 1627.9 mm. The annual average freezing depth is 34~70 cm, the historical maximum freezing depth is 92 cm, the annual average relative humidity is 74%, the annual average wind speed is 0.9 m/s, and the annual average frost-free period is 200 days. The variation in daily average air temperature, relative humidity, precipitation, wind speed, and solar radiation during the experimental period is shown in Figure 2.

2.2. Experimental Methods

The experimental equipment consisted of lysimeters (Figure 3), which were cylindrical in cross-section with a cross-sectional area of 0.5 m2, and the interval between different lysimeters was 0.5 m. The lysimeter was filled with three representative homogeneous soils in Taiyuan Basin, which were classified as sandy loam, loamy sand, and sandy soil according to the USDA classification system. The physical parameters of three textured soils are shown in Table 1, and the soil surface was exposed to the atmosphere. Mariotte bottles were used to control the groundwater table depth to maintain 0.5 m in the lysimeter system and were recharged with local groundwater.
(1) The monitoring of soil temperature profile
The soil temperature was monitored by thermistors embedded before winter at depths of 0 cm, 5 cm, 10 cm, 20 cm, 30 cm, 40 cm, and 50 cm, respectively, and the soil temperature was monitored at intervals of 5~7 days at around 9 a.m. from 1 November 2020 to 6 March 2021. The relationship between the thermistor value and soil temperature is shown in Equation (1).
T = B ln R x R 25 + B 298 . 15   -   273 . 15 ,
where T is the soil temperature, °C; Rx is the measured thermistor value, Ω; R25 is the thermistor value at a temperature of 25 °C, Ω; and B is a constant, generally taken to be 3950.
(2) The monitoring of soil water content and salt content
The monitoring depth of soil water content, anion and cation content, and salt content was the same as that of the soil temperature profile. Soil samples were obtained at different depths using a soil drill and then sealed in aluminum boxes; each soil sample was placed in an oven and then dried at a constant temperature of 105 °C for 8 h to obtain the soil water content. The soil solution was configured using deionized water according to a soil-to-water ratio of 1:5 after drying, and the clarified soil extract obtained after shaking and filtering was used to measure the soil ion content, among which the content of K+, Ca2+, Na+, and Mg2+ was determined using an atomic spectrophotometer (TAS-990AFG) (Beijing Purkinje GENERAL Instrument Co., Ltd., Beijing, China) under the following conditions: wavelength ranged from 190 to 900 nm; grating scribing was 1200 or 1800; and the accuracy and repeatability of wavelength was ±0.25 nm and 0.15 nm, respectively. The content of Cl, NO3−, and SO42− was determined via ion chromatograph (883 Basic IC plus) (Metrohm China, Hong Kong, China), which consists of iCulumn, iPump, and iDetectror: the pump speed of iPump ranged from 0.001 to 20 mL/min, the measurement range and accuracy of the iDetectror was 0~15,000 μs/cm and 0.0047 ns/cm, respectively. The content of HCO3− and CO32− was determined by titration. The soil salt content was the sum of each ion content. The absorbance of potassium, sodium, calcium, and magnesium ions was measured at wavelengths of 766.4 nm, 589.0 nm, 422.7 nm, and 285.2 mm, respectively, to obtain the standard curve. Then, a 10.00 mL sample was taken into the colorimetric tube, and 0.50 mL of cesium nitrate solution (China National Pharmaceutical Group Shanxi Co., Ltd., Taiyuan, China) (K+, Na+) or 0.2 mL of lanthanum nitrate solution (China National Pharmaceutical Group Shanxi Co., Ltd., Taiyuan, China) (Ca2+, Mg2+) was added to measure the absorbance of each ion, and the ion concentration was obtained by comparing the standard curve. The determination range of K+, Na+, Ca2+, and Mg2+ was 0.01~4.0, 0.01~4.0, 0.1~6.0, and 0.01~0.6 mg/L, respectively, and that of Cl, NO3−, and SO42− was 0.1~12, 0.02~10, and 0.2~12 mg/L, respectively.

2.3. Grey Relation Analysis

The correlation analysis in grey system theory is a new method of factor analysis, which mainly analyzes the degree of correlation between various factors in the system by comparing the geometric relationship of system data sequences [42,43].
(1) Original data transformation. Because each sequence has different dimensions and orders of magnitude, in order to obtain correct analysis results, the original data should be dimensionless to facilitate the analysis and calculation, and the standardized transformation is used in this paper; that is, the average value and standard deviation of each sequence are first calculated, and the average value of each original data is subtracted from the original data and then divided by the standard deviation. The new data sequences x0(k) and xi(k) obtained are standardized sequences.
(2) Correlation coefficient calculation. The calculation formula is as follows (Equation (2)):
δ i ( k ) = r ( x 0 ( k ) , x i ( k ) ) = min i m min k n | x 0 ( k ) x i ( k ) | + ρ max i m max k n | x 0 ( k ) x i ( k ) | | x 0 ( k ) x i ( k ) | + ρ max i m max k n | x 0 ( k ) x i ( k ) | ,
where δi(k) is the relative difference between the comparison curve xi and the reference curve x0 at the kth moment, that is, the correlation coefficient of the data series of xi and x0 at the kth moment. The value of ρ, which is the resolution coefficient, is generally between 0 and 1, where ρ = 0.5 in the article.
(3) Correlation degree calculation. With the calculation formula for the correlation coefficient, according to the grey correlation space, the calculation formula for correlation degree is shown in Equation (3).
r i = 1 n k = 1 n δ i ( k ) ,
where 𝑟i is the correlation degree between two sequences, and N is the number of each subsequence.

2.4. Pearson Correlation Analysis

The Pearson correlation coefficient is used to reflect the degree of linear correlation between two random variables and describe the trend of two sets of linear data changing together. The value range is between −1 and 1. Given two random variables, the Pearson correlation coefficient is equal to the covariance of the two variables divided by the standard deviation of the two variables (Equation (4)). SPSS 19.0 is used to calculate the Pearson correlation coefficient in this article.
ρ X , Y = c o v ( X , Y ) σ X σ Y = E [ ( X μ X ) ( Y μ Y ) σ X σ Y ,
where Cov(X,Y) is the covariance between X and Y; and σX and σY are the standard deviation.

3. Results

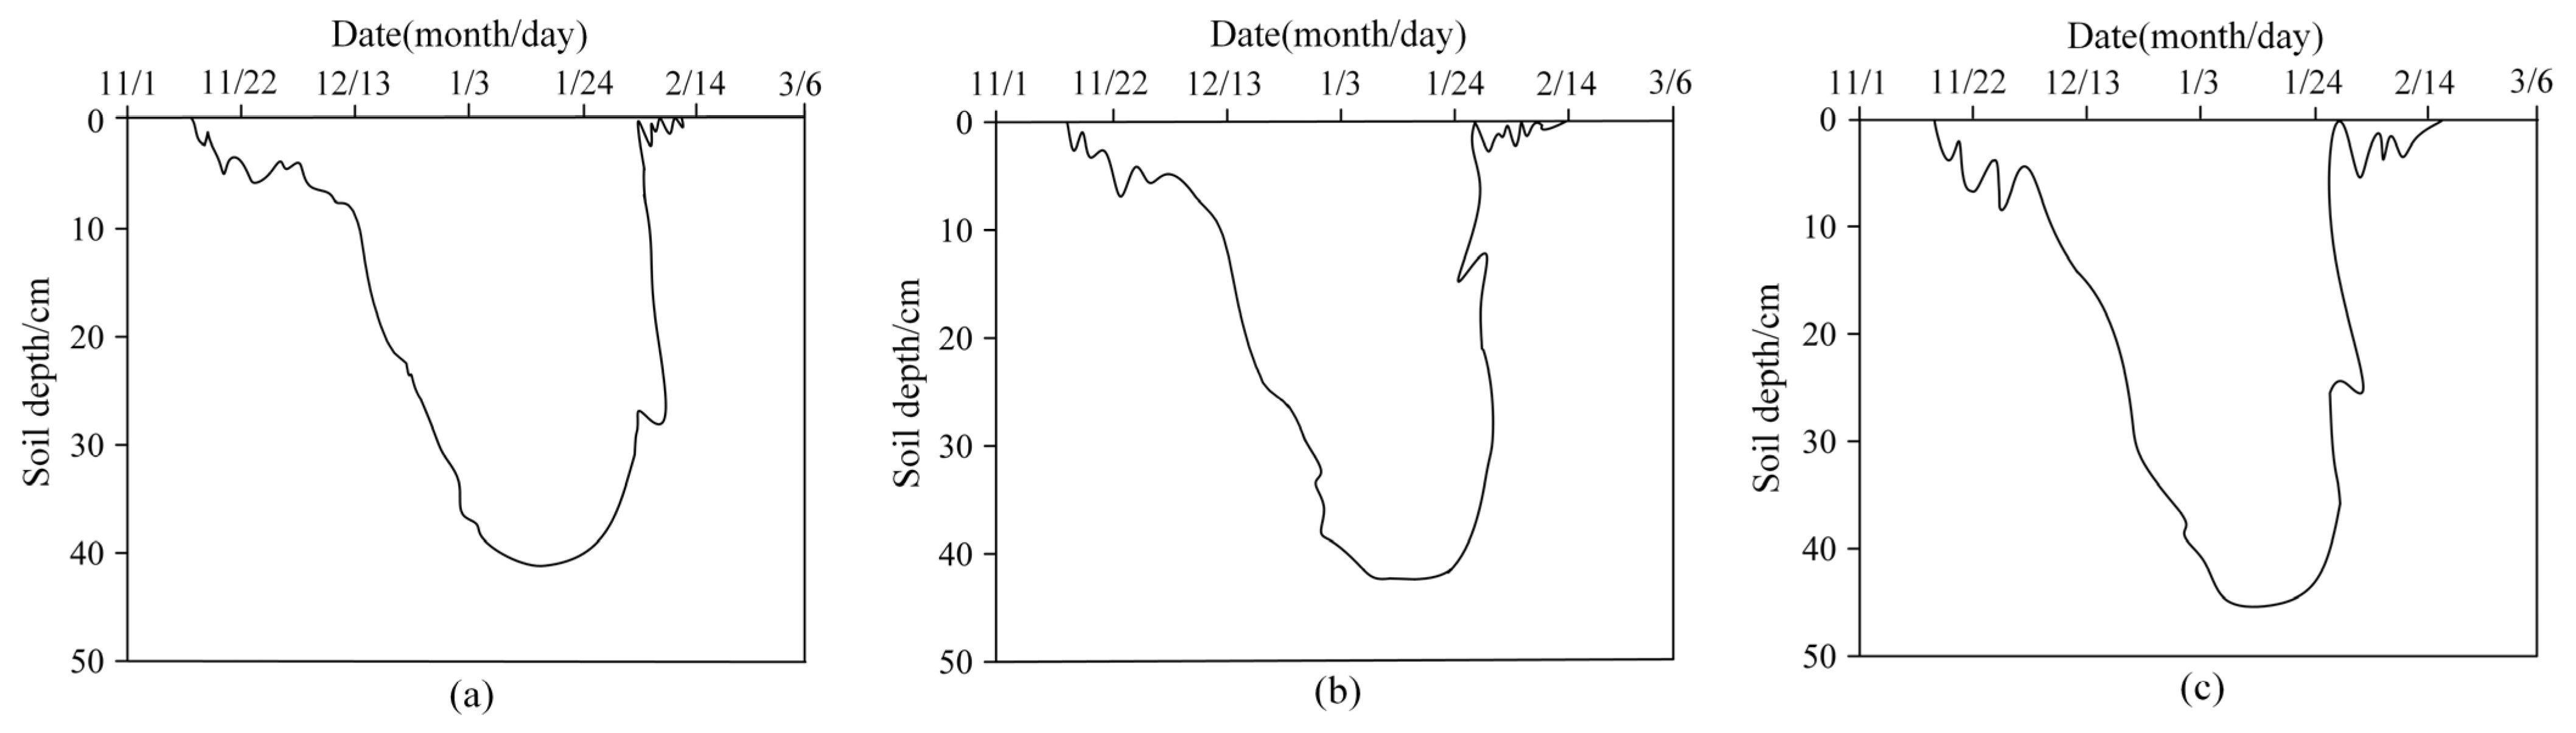
3.1. Freeze–Thaw Processes of Different Textured Soils

Soil freezing and thawing processes significantly affect the migration and distribution of water and salt in the soil. According to the freeze–thaw characteristic of soil (Figure 4), the freeze–thaw process was divided into three stages [44,45]: unstable freezing stage, stable freezing stage, and thawing stage, as shown in Table 2. The representative 1 day of three freeze–thaw stages, which was 18 November 2020 (D1), 9 January 2021 (D2), and 13 February 2021 (D3), respectively, was selected to analyze various characteristics of water content and salt content in the soil profile during the freeze–thaw period.
As the average soil particle size became larger, the porosity was smaller, and the thermal conductivity increased [21], which made the soil temperature drop quickly and led to a greater freezing depth. With the decrease in air temperature and the accumulation of negative surface temperature, sandy loam, loamy sand, and sandy soil began to freeze and entered the unstable freezing stage on November 18. The average freezing rate was 0.36~0.56 cm·d–1 with a short-term freeze–thaw cycle in the surface soil, and the maximum freezing depth of three kinds of soils reached 6.5 cm, 7.5 cm, and 9 cm in the unstable freezing stage. When entering the stable freezing stage in December, the average rate of frozen layer development downward was 0.98 cm·d−1, 1.01 cm·d−1, and 1.11 cm·d−1, respectively, and the maximum freezing depths of three textured soils in the freezing period reached 41.3 cm, 42.5 cm, and 46 cm on 12 January, 9 January, and 10 January, respectively. The soil entered the thawing stage with the increase in air temperature, part of the thawing water recharged the phreatic water downward under the action of gravity potential, while another part migrated to the surface under the action of evaporation. Sandy loam, loamy sand, and sandy soil thawed completely on 13 February, 14 February, and 15 February, with the average thawing rate of 1.18~1.29 cm·d−1.
During the freezing and thawing process, the maximum temperature gradients in the profile of three kinds of soils were observed when the freezing depth reached the maximum, which was 0.167 °C/cm, 0.172 °C/cm, and 0.178 °C/cm, respectively, indicating that the temperature gradient was greater, and the driving force of water and salt transport became stronger as the average soil particle size increased.

3.2. Characteristics of Water Transport in Different Textured Soils

The maximum rising height of capillary water in sandy loam, loamy sand, and sandy soil was 187 cm, 77 cm, and 60 cm, respectively, and the capillary water could reach the frozen layer. The water content of sandy loam increased at the depth of 10 to 50 cm, but decreased slightly at the depth of 0 to 10 cm under the effect of soil evaporation [46] in the process of D1 to D2 (Figure 5). On D2, the capillary water gathered at the freezing front under the blocking effect of the frozen layer [47], resulting in the greatest increment of the water content at a depth of 40 cm in the sandy loam. During the process of D2 to D3, the soil water mainly moved to the depth of 0 to 20 cm as the frozen layer thawed in both directions. The soil water content at the depth of 20 to 50 cm on D3 was 1.01~5.74% lower than that on D2, with the largest decrease in soil water content at the depth of 30 cm.
The water content of loamy sand increased by 0.37~33.33% at the depth of 5 to 50 cm in the process of D1 to D2 and increased by 0.0067~0.093% in the soil profile from D2 to D3. On D2 and D3, the soil water content increased with the increase in depth, and the loamy sand was almost saturated at the depth of 40 cm, while the soil water content was only 0.006% at the depth of 0 cm on D2, and the surface was seriously dry.
The water content of sandy soil increased at the depth of 0 to 50 cm during the process of D1 to D2 and D2 to D3 due to the continuous hydraulic link and the transformation of phreatic water throughout the whole freeze–thaw process [34], with the greatest increase at the depth of 5 cm. The water content in the sandy soil increased with the increase in depth during the freeze–thaw process and was greatest at the end of the thawing period, with the average soil water content in the sandy soil increasing by 18.46% and 0.19% compared with that in sandy loam and loamy sand, respectively.

3.3. Characteristics of Ion Content Variation in Different Textured Soils

The phreatic water continuously migrated upwards under the action of the soil water potential gradient, and the soil in the unsaturated zone continued to freeze from D1 to D2 in the shallow groundwater area. The lower edge of the frozen layer in sandy loam, loamy sand, and sandy soil was within the maximum rising height of the capillary water, so variation characteristics of soil ions content were closely related to the migration of groundwater and soil ions were redistributed in the profile.

3.3.1. Correlation Analysis between Soil Salt Content and Ions

The monitoring result of ion content in soil extract showed that the contents of soluble K+, Mg2+, NO3, and CO32− in the soil were very low, making the measurement error larger; therefore, only variations in Na+, Ca2+, Cl, SO42−, and HCO3 were analyzed in the article. The correlation between salt content and ions in three textured soils was analyzed by Grey Relation Analysis.
Na+ and HCO3 had high relativity with soil salt content in sandy loam (Table 3), with correlation coefficients of 0.9 and 0.909, respectively, indicating that Na+ and HCO3 were the most abundant ions in groundwater. However, the correlation coefficient between Ca2+, SO42− and Cl and salt content was 0.73~0.817, showing that the content of Ca2+, SO42−, and Cl in groundwater was second only to Na+ and HCO3. Na+ had a good correlation with Cl, SO42−, and HCO3. Ca2+ had a good correlation with SO42− and HCO3 because Ca2+ was easy to precipitate with SO42− and HCO3. It can be seen that the main salt composition in sandy loam was Na2SO4, NaCl, NaHCO3, CaSO4, and Ca(HCO3)2.
Soil salt content was highly correlated to Na+, HCO3, and SO42− in loamy sand (Table 4) with correlation coefficients of 0.99, 0.995, and 0.873, respectively. The correlation between Na+ and HCO3 was the highest followed by the correlation between Ca2+ and Cl and HCO3. It can be seen that the main salt composition in loamy sand was NaHCO3, Na2SO4, CaCl2, and Ca(HCO3)2.
The salt content in sandy soil was highly correlated to Na+, HCO3, and SO42− (Table 5) with correlation coefficients of 0.990, 0.989, and 0.874, respectively. The correlation between Na+ and HCO3 was the highest with a correlation coefficient of 0.988, followed by the correlation between Ca2+ and SO42−. It was shown that the main salt component in the sandy soil was NaHCO3, Na2SO4, and CaSO4.
According to the correlation analysis between salt content and ions in three different textured soils, it was shown that the correlation coefficient between soil salt content and Na+ and HCO3 in sandy loam, loamy sand, and sandy soil was higher than 0.9, and the correlation between Na+ and HCO3 was better, so NaHCO3 was the main component of salt in three kinds of soils. Na+, Cl, and HCO3 migrate easily with water, while Ca2+ and SO42− do not. As the average soil particle size increased, the pore diameter in the soil increased, the suction of soil particles to soil salt decreased, the migration ability of Ca2+ and SO42− increased, and the main salt composition in the soil changed, with calcium salts changing from CaSO4 and Ca(HCO3)2 to CaSO4, and sodium salts changing from Na2SO4, NaCl, and NaHCO3 to NaHCO3 and Na2SO4. Since Na+ and HCO3 were the main ions in the soil, the most abundant sodium salt in sandy soil was still NaHCO3, although the content of SO42− increased.

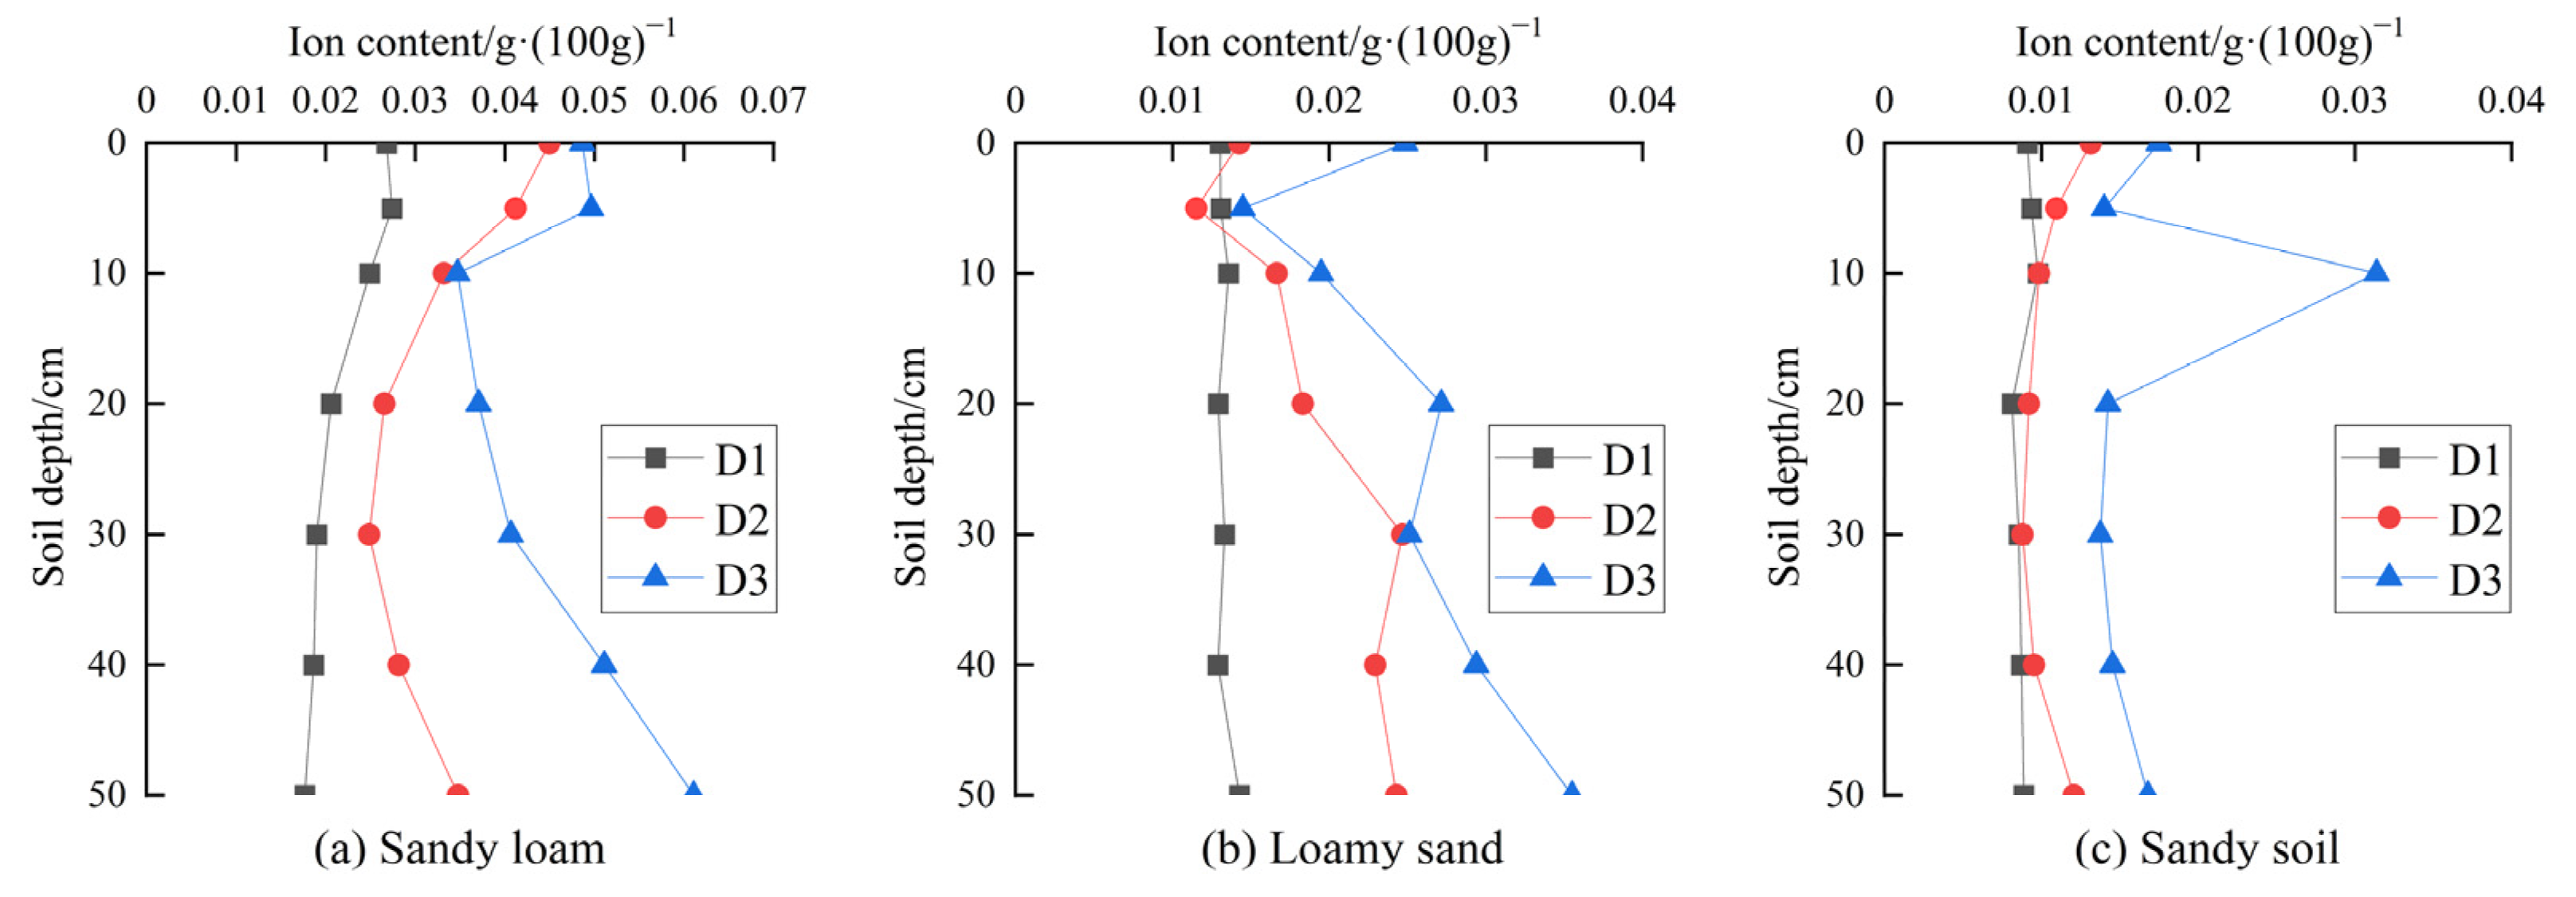
3.3.2. Characteristics of Ca2+ Content Variation

In the process of D1 to D2, the variation in Ca2+ gradually decreased with the increase in soil particle size (Figure 6), which in loamy sand and sandy soil was 12.36~67.38% and 53.88~97.47% lower than that in sandy loam at the depth of 0 to 50 cm. On D2, the distribution characteristic of Ca2+ in the sandy loam was similar to that in the sandy soil, and the content of Ca2+ decreased continuously at the depth of 0 to 30 cm and increased at the depth of 30 to 50 cm. The content of Ca2+ in loamy sand increased with the increase in depth from 5 to 30 cm and tended to be stable at the depth of 30 to 50 cm.
From D2 to D3, the content of Ca2+ in three textured soils increased in the vertical profile. The content of Ca2+ in sandy loam increased by a smaller amount of 4.53~20.58% at the depth of 0 to 10 cm, and the increase of Ca2+ content increased with depth within the range of 10 to 50 cm, with the increase at the depth of 10 cm being 6% of that at the depth of 50 cm. The content of Ca2+ in loamy sand increased by 1.84~74.04%, and the amplitude on the surface was the largest. The content of Ca2+ in sandy soil increased by 27.83~218.92% with the greatest increment at the depth of 10 cm. At the end of the thawing stage (D3), the content of Ca2+ in sandy loam was 0.0347~0.0611 g·(100 g)−1, with a decrease of 41.90~58.21% and 48.61~60.23% in the loamy sand and sandy soil, respectively. The content of Ca2+ in different textured soils was less than that of other ions, the reason was that soluble SO42− was easy to combine with Ca2+ to form sulfate precipitate CaSO4.

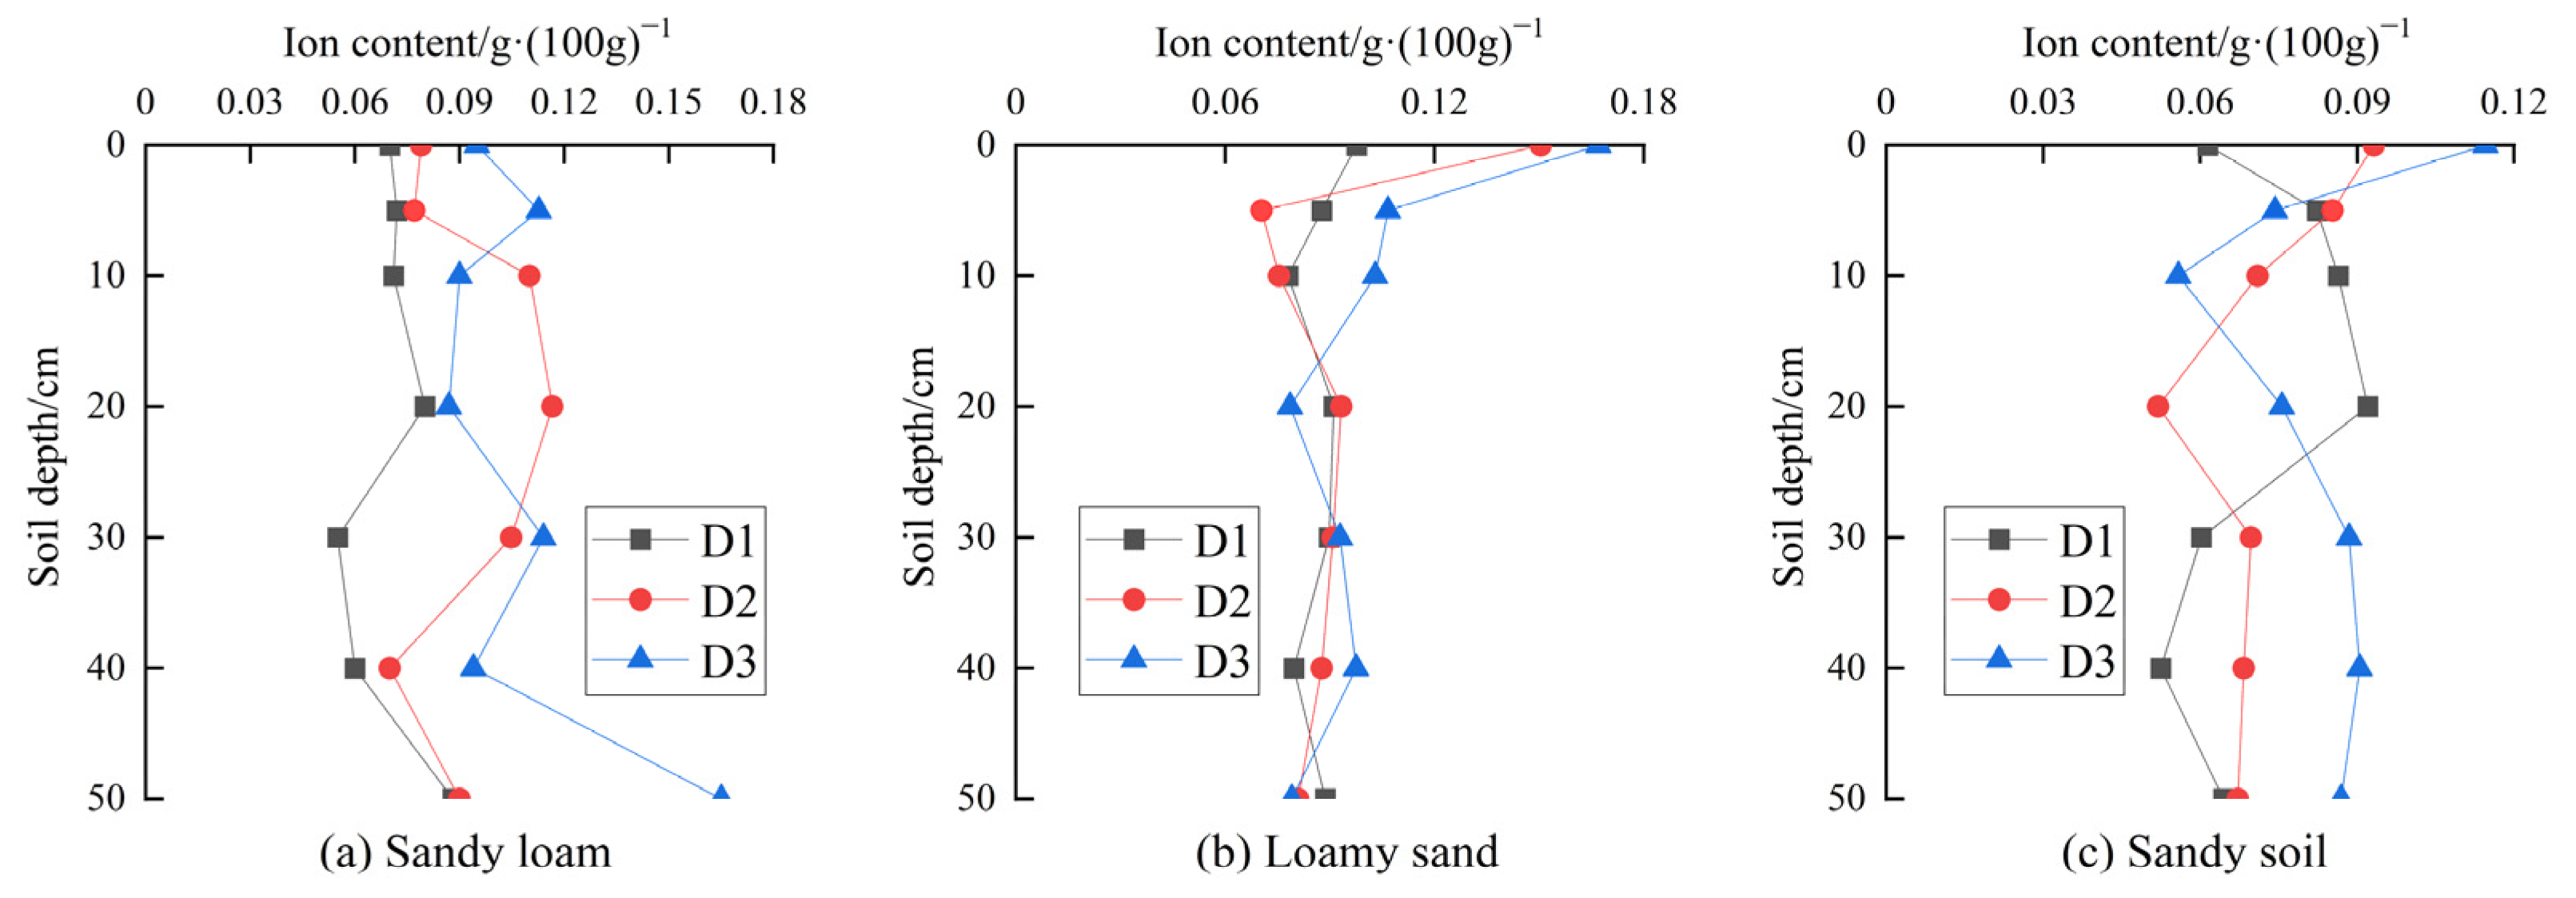
3.3.3. Characteristics of Na+ Content Variation
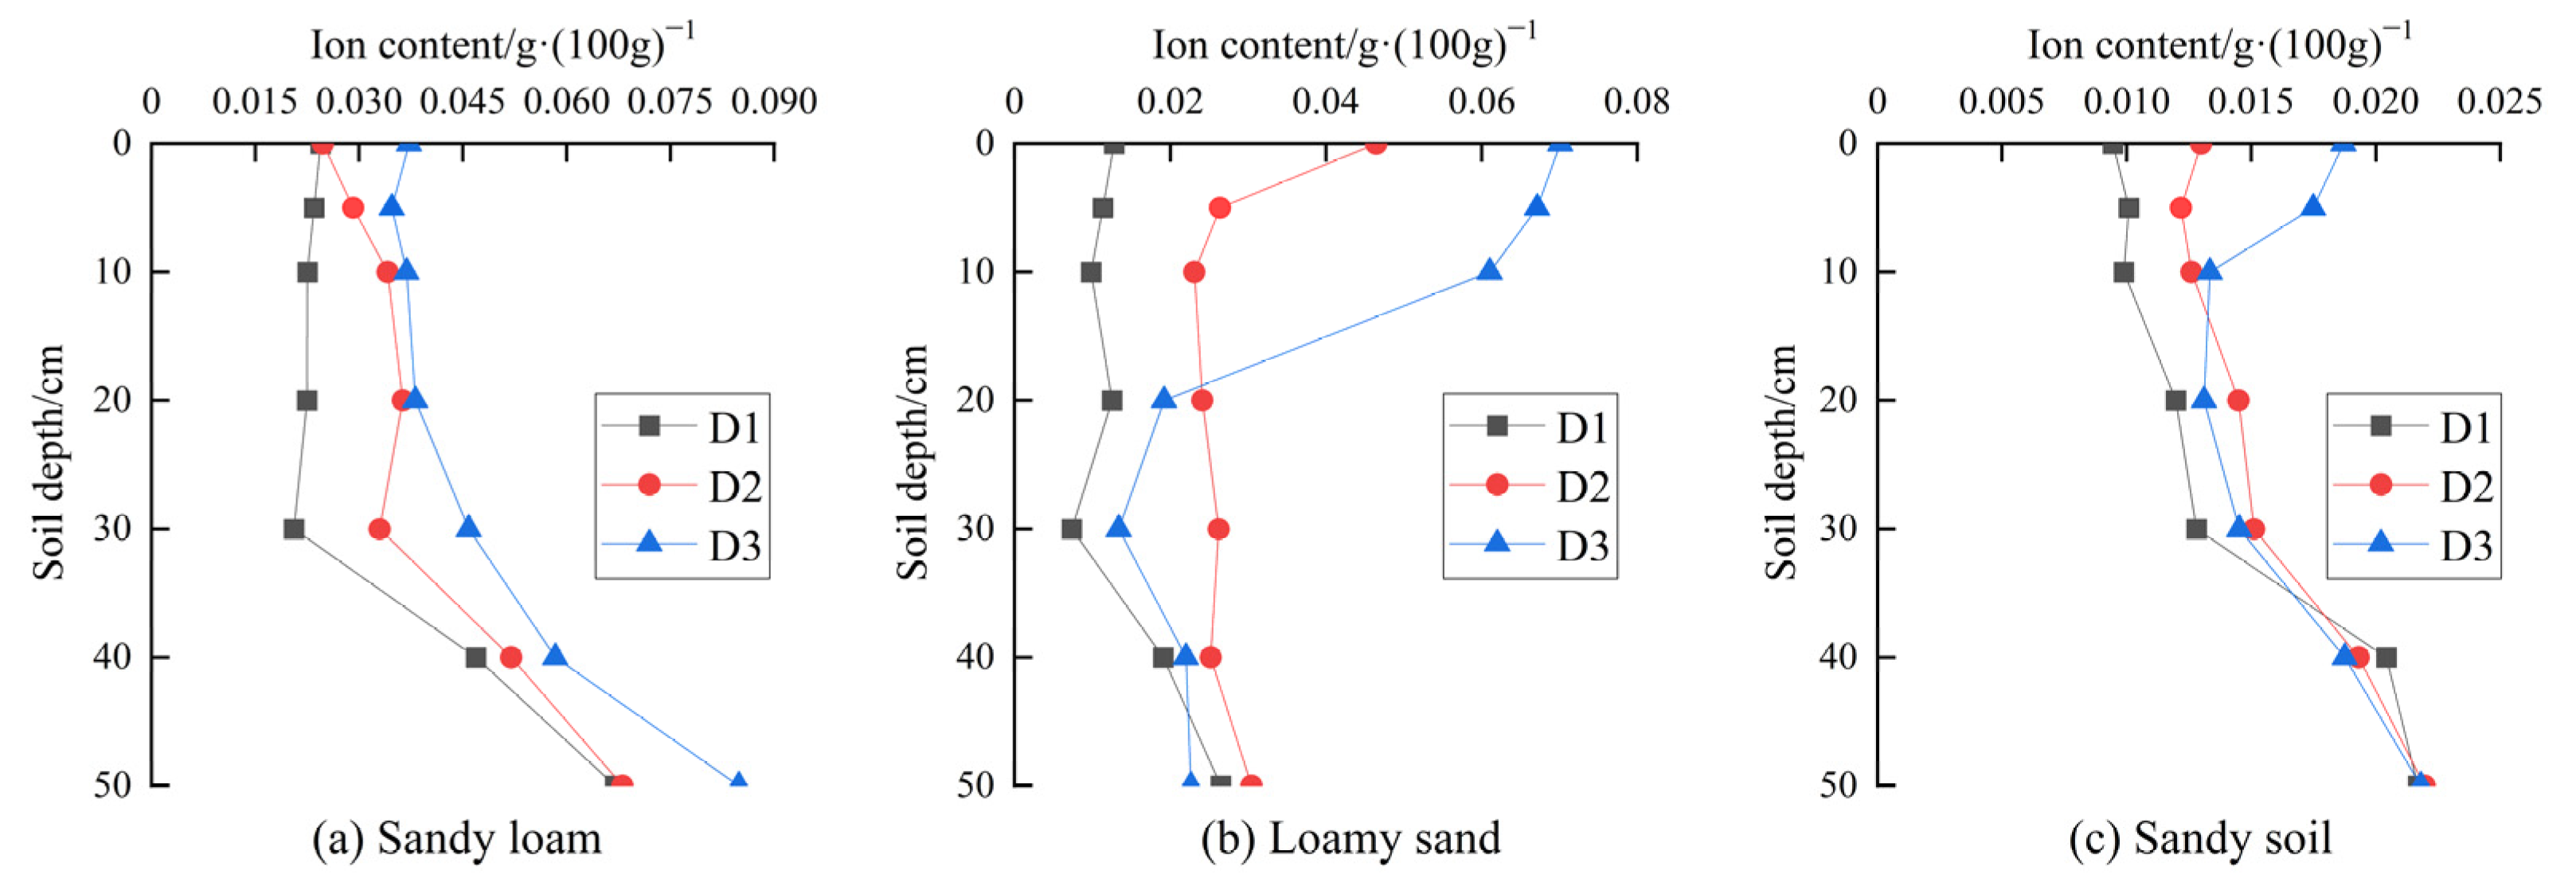
From D1 to D2, Na+ mainly accumulated at the depth of 10 to 30 cm in sandy loam (Figure 7), while at the depth of 0 to 5 cm in loamy sand, and it migrated from the depth of 5 to 30 cm to both sides in sandy soil, the average content of Na+ at depths of 0 to 5 cm and 30 to 50 cm increased by 24.13% and 15.82%, respectively. On D2, the content of Na+ was the highest at the depth of 20 cm in sandy loam, and the Na+ in the loamy sand and sandy soil accumulated on the surface.
From D2 to D3, Na+ migrated with water from the thawing front to the non-frozen layer on both sides with the thawing of the frozen layer. Na+ in sandy loam, loamy sand, and sandy soil migrated from depths of 8 to 30 cm, 15 to 30 cm, and 5 to 15 cm to both sides, respectively. On D3, the content of Na+ was the highest at a depth of 50 cm in sandy loam, and Na+ accumulated on the surface of loamy sand and sandy soil. The average content of Na+ at the depth of 0 to 50 cm in sandy soil was the lowest at 0.084 g·(100 g)−1, which was 22.60% and 19.07% lower than that in sandy loam and loamy sand, respectively. Excessive Na+ content can lead to the dispersion of soil particles and aggregates, resulting in a decrease in soil pore diameter and permeability.

3.3.4. Characteristics of Cl Content Variation

In the process of D1 to D2, the increment of Cl content at the depth of 10 to 30 cm was the most in sandy loam (Figure 8), which was 51.56~61.44%; however, Cl was mainly accumulated at the depth of 30 to 50 cm on D2. The Cl content in loamy sand increased throughout the vertical profile, with the largest increment and the highest Cl content on D2 at the depth of 0 cm. Cl in sandy soil migrated to the depth of 0 to 35 cm from D1 to D2; however, the average content of Cl at the depth of 30 to 50 cm increased by 39.51% compared with that at the depth of 0 to 30 cm on D2.
In the process of D2 to D3, Cl in sandy loam mainly migrated to depths of 0 to 10 cm and 20 to 50 cm. Cl in loamy sand mainly accumulated at the depth of 0 to 20 cm, which made the average content of Cl in this depth increase by 39.51%. Cl in sandy soil mainly migrated at the depth of 0 to 10 cm, and Cl content at the depth of 10 to 50 cm decreased by 0.65~9.53%. On D3, the content of Cl in sandy loam increased with the increase in depth from 5 to 50 cm. Cl was mainly distributed at the depth of 0 to 20 cm in loamy sand, and was gathered at depths of 0 to 10 cm and 30 to 50 cm in sandy soil. The average content of Cl in sandy loam was the highest, with a decrease of 17.96% and 64.96% in loamy sand and sandy soil, respectively.

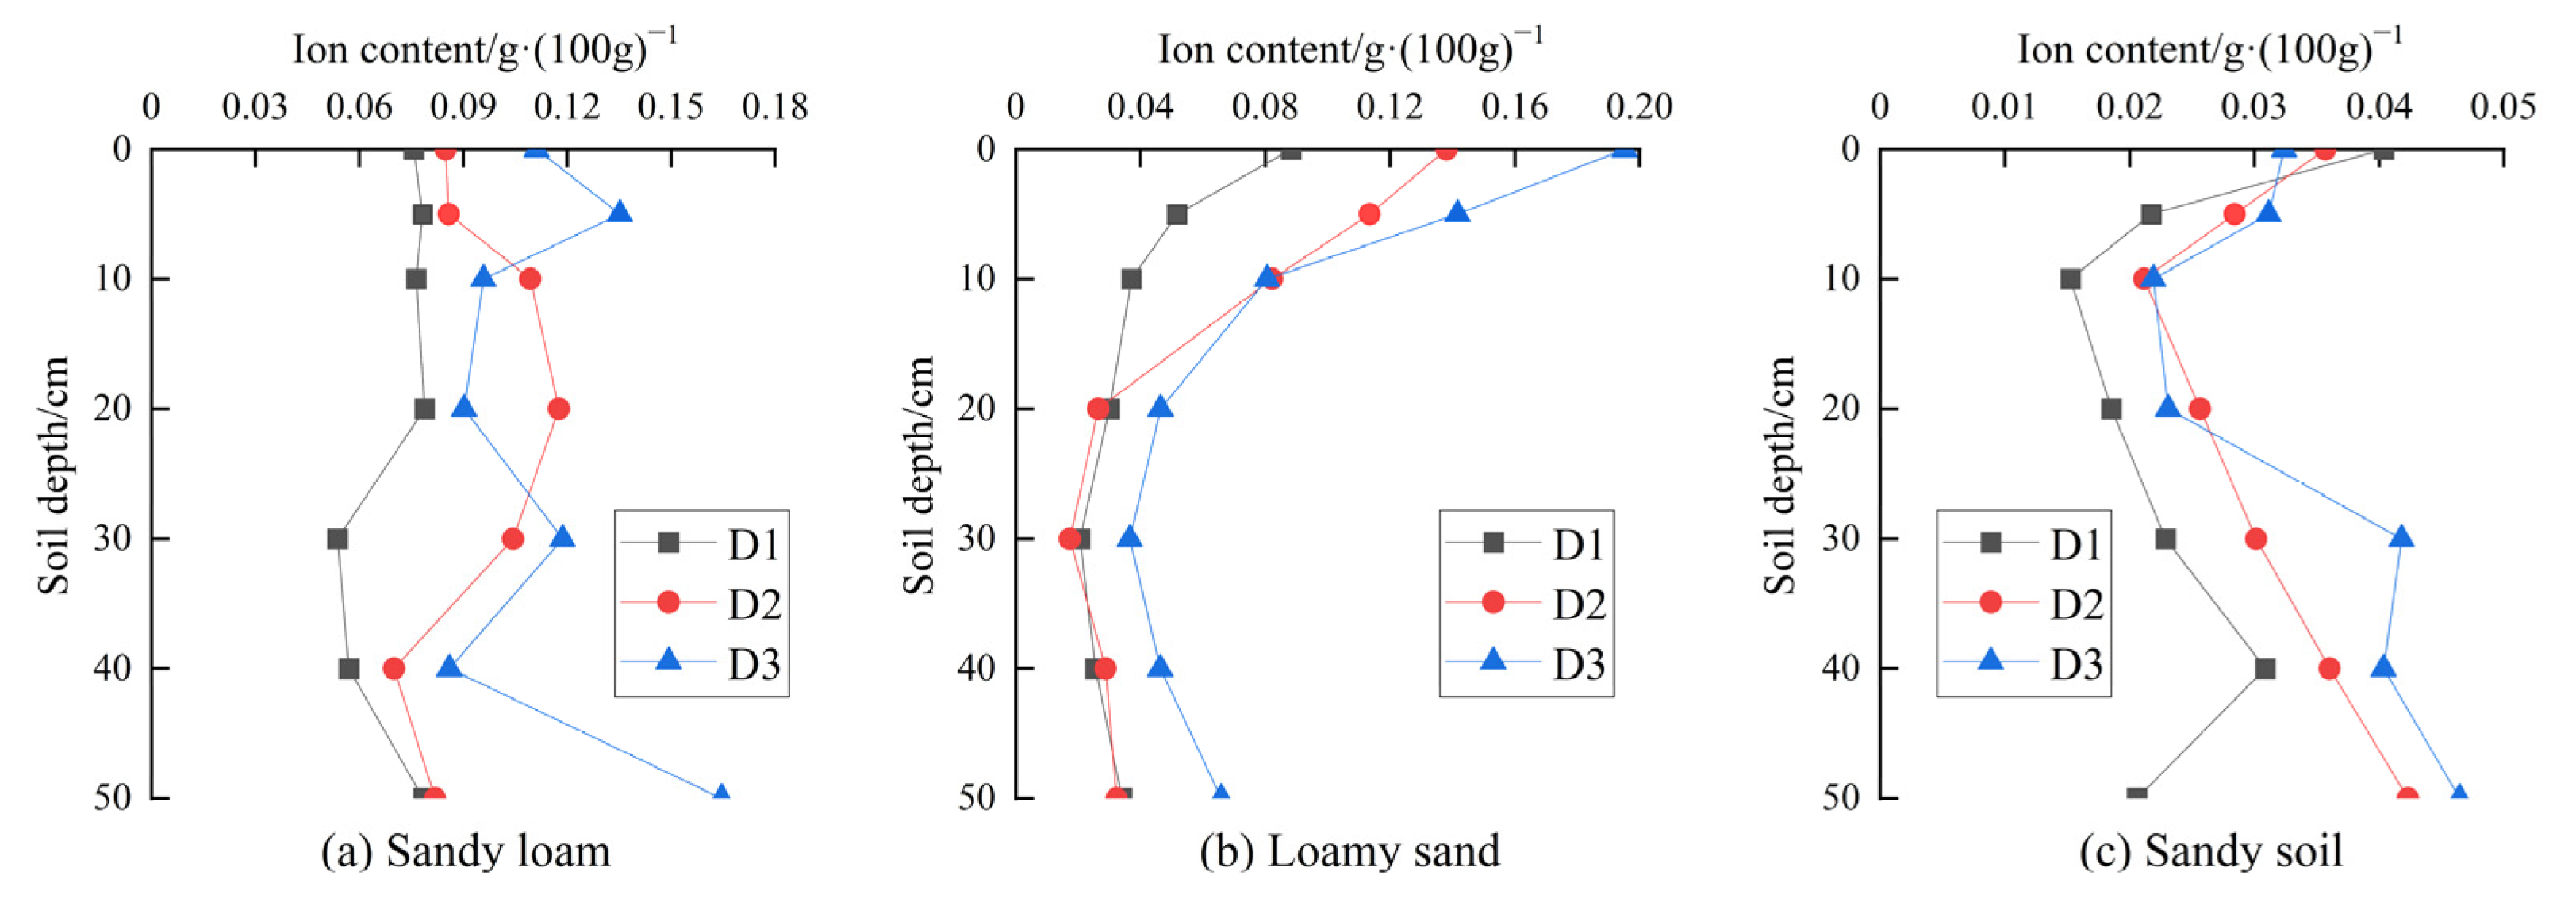
3.3.5. Characteristics of SO42− Content Variation

In the D1 to D2 stage, SO42− in sandy loam mainly accumulated in the frozen layer at the depth of 5 to 40 cm, the average content of SO42− in this depth was 12.37% and 12.42% higher than that at depths of 0 to 5 cm and 40 to 50 cm at the end of the freezing stage (Figure 9). The SO42− in loamy sand mainly aggregated at the depth of 0 to 20 cm, and the content of SO42− was basically unchanged at the depth of 20 to 50 cm. The content of SO42− in sandy soil increased by 16.74~105.60% at the depth of 5 to 50 cm, with the highest SO42− content of 0.046 g·(100 g)−1 at a depth of 50 cm on D2.
In the process of D2 to D3, SO42− in sandy loam mainly accumulated at depths of 0 to 10 cm and 30 to 50 cm with the thawing of the frozen layer. The content of SO42− increased in the profile of loamy sand. SO42− in sandy soil mainly migrated to the depth of 22 to 50 cm, and the maximum increment of SO42− was 38.75% at a depth of 30 cm. On D3, the content of SO42− was the highest at a depth of 50 cm in sandy loam and sandy soil, and SO42− was mainly concentrated at the depth of 0 to 10 cm in loamy sand. The content of SO42− in the profile of sandy soil was lower than that of sandy loam. The average content of SO42− in sandy loam was the highest, which was 0.115 g·(100 g)−1, while that in loamy sand and sandy soil decreased by 23.55% and 70.42%.

3.3.6. Characteristics of HCO3 Content Variation

During the process of D1 to D2, the solubility of Ca(HCO3)2 increased with the decrease in soil temperature, and the content of HCO3 at the freezing front was higher, resulting in the movement of HCO3 from the area of high concentration to the area of low concentration, and the HCO3 content in the frozen layer decreased. HCO3 in sandy loam mainly migrated from the depth of 5~40 cm to both sides from D1 to D2 (Figure 10), the average content of HCO3 at the depth of 10 to 30 cm was the lowest, which was 36.72% and 18.34% lower than that at depths of 0 to 10 cm and 30 to 50 cm on D2. HCO3 in loamy sand mainly migrated from the depth of 0~20 cm to the bottom, and the content of HCO3 at the depth of 20 to 50 cm increased by 2.51~20.43%. HCO3 in sandy soil mainly migrated from the depth of 5~30 cm to both sides, and its average content decreased by 27.70%.
In the process of D2 to D3, the solubility of Ca(HCO3)2 decreased with the increase in soil temperature, and some HCO3 precipitated in the form of crystals. The content of HCO3 increased in the soil profile of sandy loam, with the greatest increase of 146.21% at a depth of 10 cm, the content of HCO3 in loamy sand remained basically unchanged, and HCO3 in sandy soil accumulated at the depth of 5 to 50 cm, with an increase in the content of 17.20~95.45%. At the end of the thawing stage, the content of HCO3 in sandy loam decreased with the increase in depth from 10 to 50 cm. The HCO3 in loamy sand was gathered at the depth of 20 to 50 cm, accounting for 69.63% of the ion content in the whole soil profile. The content of HCO3 was the least on the surface of sandy soil and remained basically unchanged with increasing depth from 5 to 50 cm. The average content of HCO3 in loamy sand was the smallest, which was 29.50% and 4.65% lower than that in sandy loam and sandy soil, respectively.

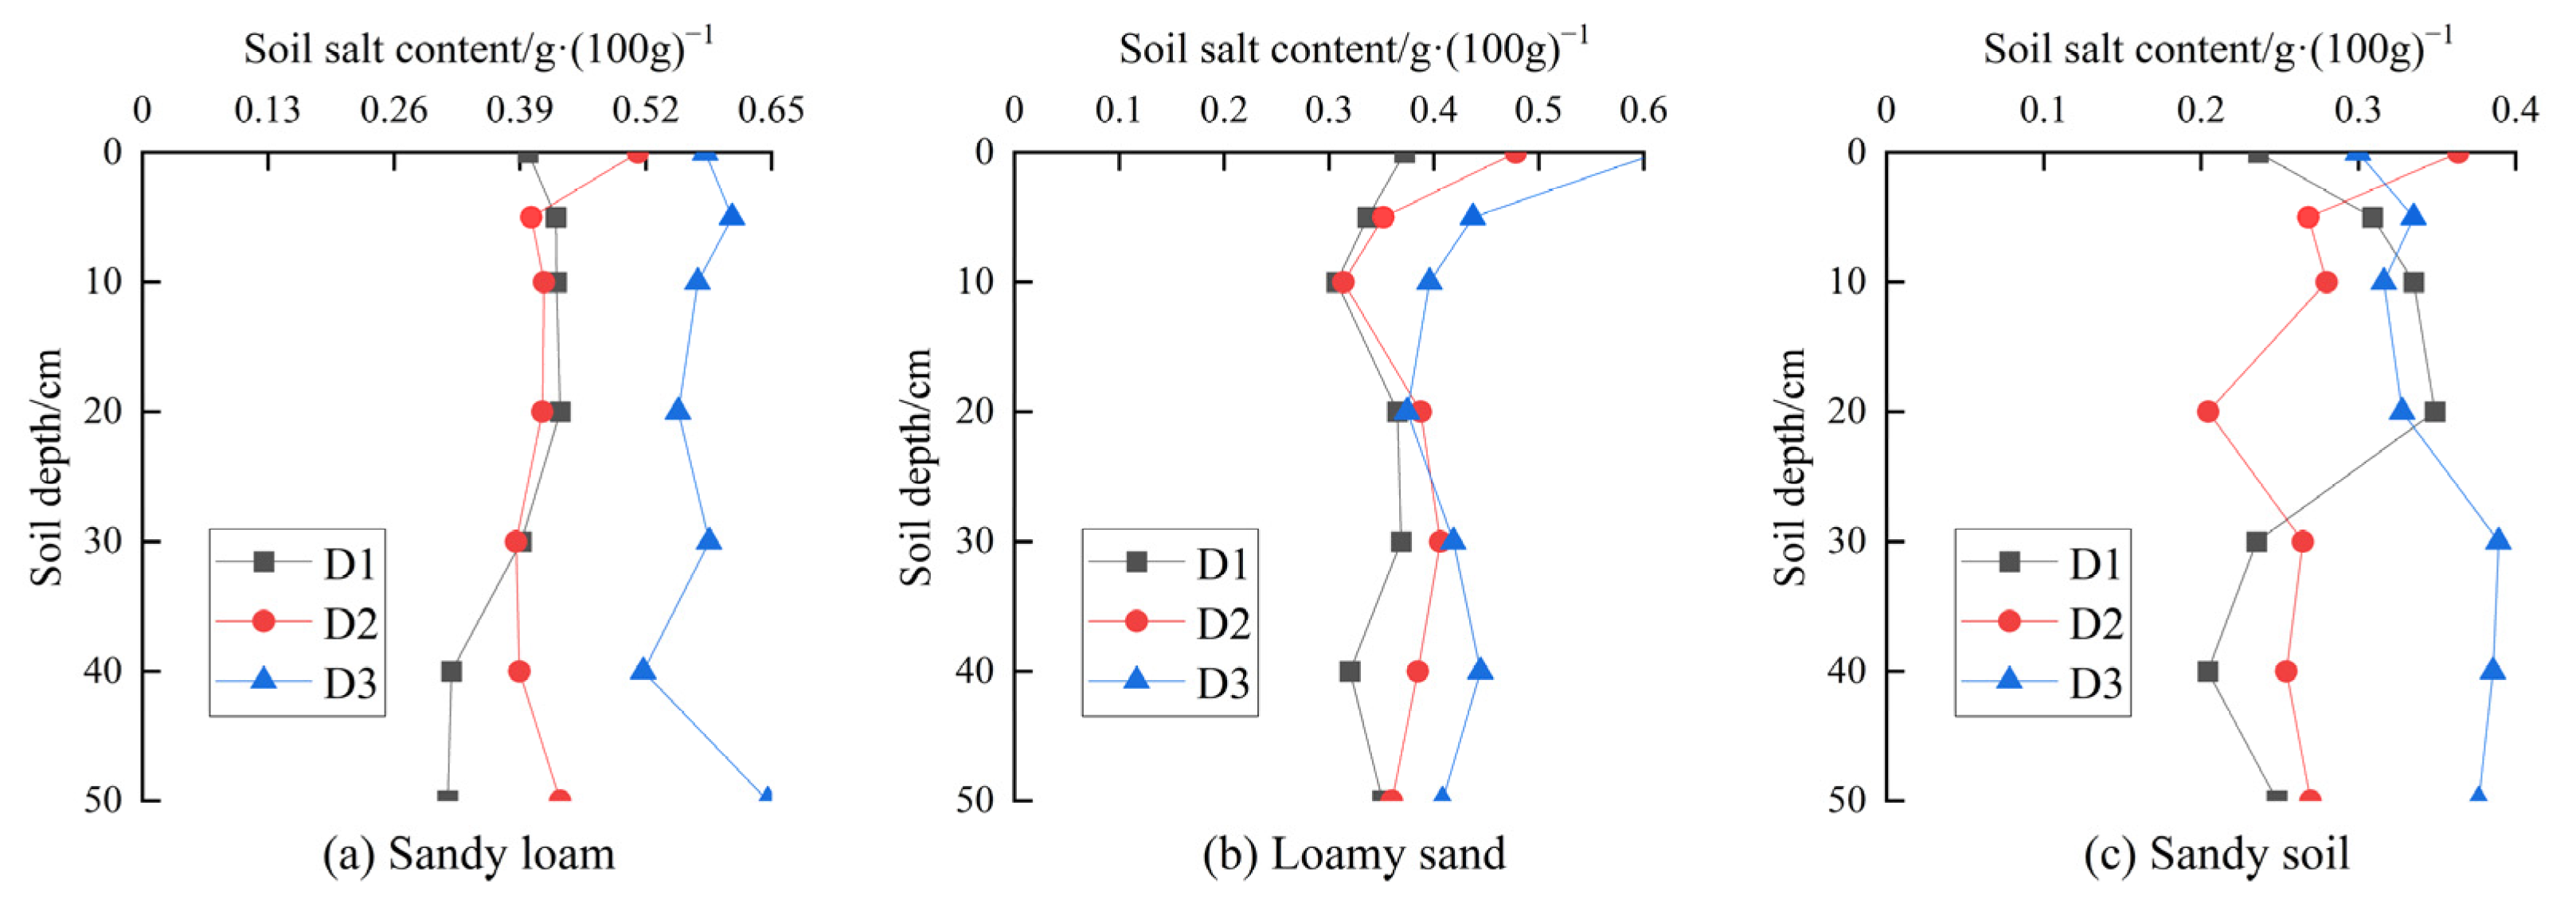
3.4. Characteristics of Soil Salt Content Variation

From D1 to D2, the depth of the frozen layer increased, and the salt in three textured soils gathered to the surface and the soil at deeper depths, which mainly migrated from the middle frozen layer at the depth of 5~30 cm to both sides in the sandy loam (Figure 11); accumulated at depths of 0 to 5 cm and 20 to 50 cm in the loamy sand, with an increase in the soil salt content of only 2.08~6.11% at the depth of 5 to 20 cm; and migrated from the depth of 3~30 cm to both sides in sandy soil. On D2, the salt content on the surface was largest in the sandy loam, loamy sand, and sandy soil, which was 0.36~0.51 g·(100 g)−1. The salt content in the profile of sandy soil was 0.20~0.36 g·(100 g)−1, which increased by 41.67~95% and 33.33~55% in sandy loam and loamy sand, respectively.
From D2 to D3, the salt content in the sandy loam at the depth of 0 to 50 cm increased by 13.69~51.71% with the thawing of the frozen layer and strong soil evaporation; the salt in the loamy sand accumulated at depths of 0 to 20 cm and 30 to 50 cm; differently from sandy loam and loamy sand, the salt content on the surface of sandy soil decreased, and the soil salt mainly gathered at the depth of 5 to 50 cm. On D3, the salt content in the soil profile of sandy loam was 0.52~0.65 g·(100 g)−1, with the greatest soil salt content at a depth of 50cm. The average salt content at the depth of 10 to 20 cm was the smallest in the loamy sand, which was 20.16% and 6.37% lower than that at depths of 0 to 10 cm and 20 to 50 cm. The average salt content of the sandy soil at the depth of 30 to 50 cm increased by 15.01% compared with it at the depth of 0 to 30 cm.
At the end of the thawing period, the salt content of three textured soils at the depth of 5 to 50 cm gradually decreased as the average soil particle size increased, but the surface salt content in the loamy sand was the largest, the average soil salt content of sandy loam, loamy sand, and sandy soil was 0.58, 0.44, and 0.35 g·(100 g)−1, respectively, and the degree of soil salinization gradually decreased. Among them, both sandy loam and loamy sand were severely salinized soil, while sandy soil was moderately salinized soil.

4. Discussion

Crop production plays a vital role in ensuring food security, providing livelihoods and supporting economic development, and many researchers have discussed different aspects of crop productions [48,49,50,51]. However, soil salinity poses a significant threat to crop production. Salinity negatively impacts plant growth and productivity [52,53]. High salt levels hinder water uptake by plant roots, leading to water stress and reduced crop yields. Excess salts can cause toxicity, damaging plant tissues and disrupting important physiological processes such as nutrient uptake and photosynthesis. Additionally, salinity alters soil structure, reducing its fertility and nutrient availability, further impairing crop growth. Managing and mitigating soil salinity is essential to safeguard crop production, maintain food supplies, and sustain agricultural livelihoods.

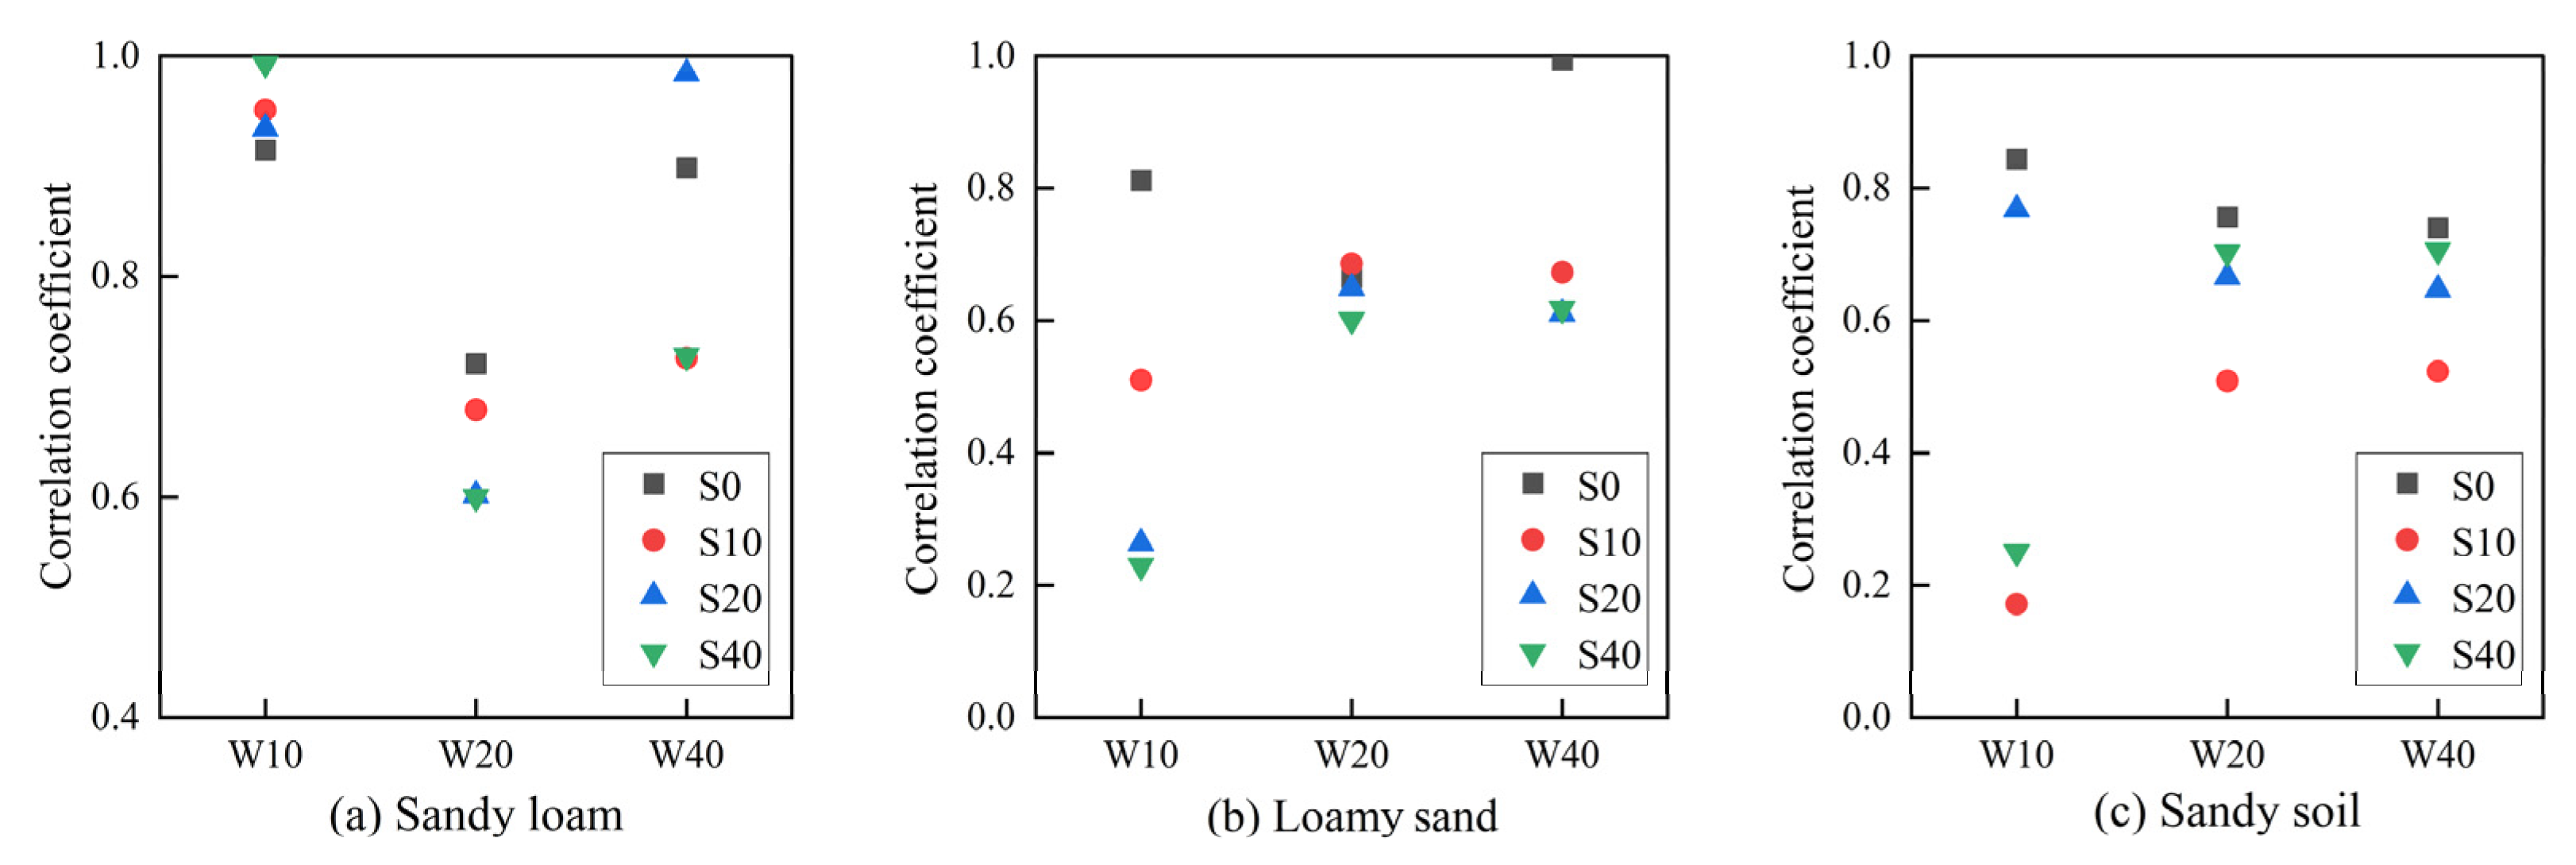
4.1. Correlation Analysis between Soil Water and Salt

In the seasonally frozen soil area, the migration of phreatic water and soil water driven by gravity potential, matrix potential, and temperature potential [2,54], makes a concomitant migration of salts dissolved in water, resulting in the redistribution of soil salt and the change in solute potential in the soil profile. There was a positive correlation between soil water content and electrical conductivity [55], and the transport of water and salt in the soil was not synchronized due to convection and diffusion [56]. The correlation between soil water and salt varies in different textured soils. Pearson correlation analysis was performed on the linear relationship between water and salt in the soil at different depths based on the monitoring data of soil water content and soil salt content (Figure 12).
The correlation coefficient between soil water content at depths of 10 cm, 20 cm, and 40 cm and soil salt content at depths of 0 cm, 10 cm, 20 cm, and 40 cm was greater than 0.6 in sandy loam, which indicated that the soil salt content increased with the increase in soil water content, and soil salt mainly migrated with soil water convectively, which was consistent with previous research results [57,58]. However, soil salt content and water content did not increase synchronously, and there was a depth difference between their corresponding depth when the correlation was higher; for example, correlations between soil salt content at a depth of 0 cm and soil water content at a depth of 10 cm, and between soil salt content at a depth of 20 cm and soil water content at a depth of 40 cm, were higher. The distribution of soil salt depends on the salt migration caused by convection and diffusion [59].
The correlation coefficient between soil salt content at depths of 10 cm, 20 cm, and 40 cm and soil water content at a depth of 10 cm in loamy sand was less than 0.6, and the correlation was significantly lower than that in sandy loam, due to the greater water migration in loamy sand than that in sandy loam, and the soil water content at a depth of 10 cm was greatly affected by soil evaporation. The correlation coefficient between soil salt content at depths of 0 cm, 10 cm, 20 cm, and 40 cm and soil water content at depths of 20 cm and 40 cm was greater than 0.6.
The correlation coefficient between soil water content at depths of 10 cm, 20 cm, and 40 cm and soil salt content at a depth of 10 cm in sandy soil was less than 0.6, and the correlation was further weakened compared with that in loamy sand. In summary, the correlation between soil salt content and water content gradually weakened with the increase in average soil particle size. The soil with larger particles has stronger water and salt transport capacity [60]. In the thawing stage, soil water and salt migrated to the surface. Under the action of soil evaporation, the soil water content decreased, and the salt accumulated on the surface, so the correlation between soil water content and soil salt content was weaker.

4.2. Effect of Freeze–Thaw Process on Water and Salt Transport in Different Textured Soils

The distribution of soil water has an important influence on salinization prevention. The influence of management system [61], initial water content [62], and loess interlayer [63] on water migration, and the correlation between soil texture and soil water content in non-freeze–thaw periods [64] were researched. In the freeze–thaw period, the interlayer with fine particle inhibited the water migration in the soil [65]. For homogeneous soil, average particle size, and inhomogeneity coefficient of the sandy soil affected the soil moisture [34].
At the end of the thawing period, the water content in three textured soils increased compared with that at the begin of the freeze–thaw period at the depth of 0 to 40 cm, among which the increment of water content at the depth of 0 to 30 cm in sandy loam and loamy sand decreased by 40.20~93.10% and 28.14~65.52% compared with that in sandy soil (Table 6). Soil texture is closely associated with soil hydraulic properties [66] and temperature gradient [67]. Since phreatic water and soil water in the deeper depth are transported to shallow soil through the capillary, the variation in water content in the soil profile is affected by both the rising height and transport capacity of capillary water. Soil with a smaller average particle size has a stronger water holding capacity [68], but its hydraulic conductivity is smaller, making the soil water conductivity and permeability weaker, and the transport capacity of capillary water smaller. Among three textured soils, sandy loam has the largest rising height of capillary water; however, the maximum rising heights of capillary water in three kinds of soils are greater than 50 cm, the water transported upwards in sandy loam, loamy sand, and sandy soil can reach the frozen layer, and continuous hydraulic links can be formed. Therefore, the migration of soil water and phreatic water during the freeze–thaw period is mainly affected by the transport capacity of capillary water and temperature gradient. With the increase in groundwater table depth, the rising height of capillary water becomes the main factor affecting the phreatic evaporation and soil water content [34], and the temperature gradient is the principal factor affecting water and salt transfer in red silty clay [5]. The porosity of sandy soil is smaller, and the thermal conductivity is larger [69], which makes the temperature gradient larger, further leading to a greater freezing depth and soil water potential gradient, as well as a stronger driving force for water migration, but the maximum temperature gradient of three kinds of soils is 0.167~0.178 °C/cm, and the difference in temperature gradient is small. The transport capacity of capillary water is the main factor influencing the water transport. The particle size of sandy loam is smaller and the hydraulic conductivity is weaker, the amount of water transport is smaller under the same conditions, but the increment of water content in sandy loam at a depth of 40 cm was the largest, because the water holding capacity of sandy loam is stronger, and the specific yield is smaller [70]. When the thawing water in the frozen layer migrates downward under the action of gravity, it is easier to remain in the soil, and the gravity water is more easily lost from soil with a larger particle size [71]. The water content of the three textured soils at a depth of 50 cm was basically unchanged, and all fluctuated around the saturated water content.
During the freezing process, the phreatic water migrated upward under the action of the soil water potential gradient, so that the salt in the phreatic water and soil at a deeper depth was brought to the frozen layer [72]. The salt content in the sandy loam was larger, which reduced the freezing point of the soil and prolonged the freezing time of the soil [73]. The soil salt content increased in the freezing stage [74]; however, the one-way freezing experiment in the column with red silty clay found that salt content in the frozen soil changed little, while the soil water content increased more [5]. At the end of the thawing stage, the salt content of sandy loam and loamy sand in the soil profile increased compared with that at the beginning of the freeze–thaw period, while the salt content of sandy soil decreased at the depth of 10 to 20 cm. Under the same water content, the water migration ability of the sandy soil is stronger for the smaller matrix suction [75] and the larger specific yield [34]. In the thawing stage, the thawing water of the sandy soil migrated downward quickly and resulted in a decrease in soil salt content at the depth of 10–20 cm. The thickness and texture of the interlayer could affect the change in soil salt content [76,77], the finer soil formed a thinner salt shell and had a stronger evaporation capacity [25], and the bulk density of paddy and natural land changed in the freeze–thaw period [18]. Soil deformation led to the change in soil hydrothermal properties [78]; however, the frost heave was not obvious in this experiment. The influence of soil texture on soil salt migration is mainly controlled by the soil water migration. As the average soil particle size increases, the number of macropores increases, the amount of soil water migration becomes greater [79], and the migration ability of soil salt becomes stronger. At the same time, the capacity of adsorbing soil ions varies with the size of soil particles [80], the increase in fine particles weakens the permeability of soil, making the downward migration of water and salt decrease, and therefore, the capacity of adsorbing soil ions is smaller with a larger soil particle size. The variation in salt content in the sandy loam at the depth of 5 to 50 cm was the greatest, and the variation in loamy sand was larger than that in sandy soil at the depth of 5 to 10 cm. However, the variation in sandy soil was much larger than that in loamy sand at the depth of 20 to 50 cm due to the larger pores and better conductivity in sandy soil [81], which is conducive to the formation of preferential flow; the salt dissolved in soil water is gradually brought to the soil at deeper depth with the downward migration of thawing water. In contrast, the complex porous geometric structure formed by fine pores and the adsorption on charged aggregates will hinder ion migration in loamy sand. The average increment of salt content for sandy loam, loamy sand, and sandy soil in the tillage layer with the depth of 0 to 30 cm was 0.166, 0.098, and 0.041 g·(100 g)−1, respectively, and the freeze–thaw process had the least effect on salinization in sandy soil. The effect of freezing and thawing processes on salt transport can be weakened by changing the hydraulic characteristics of frozen soil, such as surface coverage or plowing before freezing [82].

5. Conclusions

The effect of soil texture on the distribution characteristics of water, heat, and salt in the soil profile during the freeze–thaw period was quantitatively analyzed through a freeze–thaw field experiment. The main conclusions were as follows:
The soil temperature decreased quicker, and the freezing depth was greater as the average soil particle size increased. The increment of soil water content increased with the increasing average soil particle size at the depth of 0 to 30 cm during the freeze–thaw period, and the average water content in sandy soil at the depth of 0 to 50 cm was 18.46% and 0.19% higher than that in sandy loam and loamy sand at the end of the thawing stage, respectively.
NaHCO3 was the main salt composition in the soil. The average content of Ca2+, Na+, Cl, and SO42− in loamy sand and sandy soil decreased by 4.37~45.50% and 22.60~70.42% compared with that in sandy loam, respectively, and the average soil salt content decreased with the increase in soil particle size at the end of the thawing stage. The average increment of salt content at the depth of 0 to 30 cm in sandy loam and loamy sand increased by 304.88% and 139.02% compared with that in sandy soil during the freeze–thaw period; that is, the freeze–thaw process had the least effect on soil salinization in sandy soil. The correlation between soil salt content and water content decreased with the increase in soil particle size.
The effects of different treatments on water and salt transport in different textured soils during freeze–thaw periods need to be further studied, which can provide a basis for the management and efficient utilization of salinized land.

Author Contributions

Writing—original draft preparation, E.W.; resources, J.C.; data curation, L.L.; writing—review and editing, E.W., J.C., L.L., L.C., J.X. and J.R.; supervision, Q.D. All authors have read and agreed to the published version of the manuscript.

Funding

This research was funded by the National Natural Science Foundation of China (Grant No. 41572239); the National Natural Youth Science Foundation of China (Grant No. 41502243); the Natural Science Foundation of Shanxi Province, China (Grant No. 202203021221048); and the Natural Science Youth Foundation of Shanxi Province, China (Grant No. 202203021212195).

Data Availability Statement

The data that support the findings of this study are available upon reasonable request from the corresponding author.

Acknowledgments

The authors are grateful for the assistance with the research from Taigu Water Balance Experimental Field, Hydrology and Water Resources Survey Station of Shanxi Province.

Conflicts of Interest

The authors declare no conflict of interest.

References

  1. Chen, S.; Ouyang, W.; Hao, F.; Zhao, X. Combined impacts of freeze-thaw processes on paddy land and dry land in Northeast China. Sci. Total Environ. 2013, 456–457, 24–33. [Google Scholar] [CrossRef] [PubMed]
  2. Ireson, A.M.; van der Kamp, G.; Ferguson, G.; Nachshon, U.; Wheater, H.S. Hydrogeological processes in seasonally frozen northern latitudes: Understanding, gaps and challenges. Hydrogeol. J. 2012, 21, 53–66. [Google Scholar] [CrossRef]
  3. Bechtold, M.; Haber-Pohlmeier, S.; Vanderborght, J.; Pohlmeier, A.; Ferré, T.P.A.; Vereecken, H. Near-surface solute redistribution during evaporation. Geophys. Res. Lett. 2011, 38, L17404. [Google Scholar] [CrossRef] [Green Version]
  4. Li, Z.; Wang, Z. Experimental study on the relation between the fractal characteristics and solute transport parameters of sandy soil. J. Soils Sediments 2020, 20, 3181–3191. [Google Scholar] [CrossRef]
  5. Bing, H.; He, P.; Zhang, Y. Cyclic freeze–thaw as a mechanism for water and salt migration in soil. Environ. Earth Sci. 2015, 74, 675–681. [Google Scholar] [CrossRef] [Green Version]
  6. Han, Y.; Wang, Q.; Xia, W.; Liu, J.; Wang, J.; Chen, Y.; Shen, J. Experimental study on the hydraulic conductivity of unsaturated dispersive soil with different salinities subjected to freeze-thaw. J. Hydrol. 2020, 583, 124297. [Google Scholar] [CrossRef]
  7. Yang, J.; Zhao, J.; Zhu, G.; Wen, Y.; Wang, Y.; Liu, J.; Yang, Z. Effects of Ecological Water Conveyance on Soil Salinization in the Shiyang River Basin’s Terminal Lake—Qingtu Lake—Area. Sustainability 2022, 14, 311. [Google Scholar] [CrossRef]
  8. Ma, Y.; Tashpolat, N. Current Status and Development Trend of Soil Salinity Monitoring Research in China. Sustainability 2023, 15, 5874. [Google Scholar] [CrossRef]
  9. Mirbakhsh, M.; Sedeh, S.S. Effect of short and long period of salinity stress on physiological responses and biochemical markers of Aloe vera L. Purdue Univ. Alzahra Univ. 2022, 7, 178–187. [Google Scholar] [CrossRef]
  10. Wu, M.; Huang, J.; Tan, X.; Wu, J. Water, Salt and Heat Influences on Carbon and Nitrogen Dynamics in Seasonally Frozen Soils in Hetao Irrigation District, Inner Mongolia, China. Pedosphere 2019, 29, 632–641. [Google Scholar] [CrossRef]
  11. Wu, D.; Zhou, X.; Jiang, X. Water and Salt Migration with Phase Change in Saline Soil during Freezing and Thawing Processes. Ground Water 2018, 56, 742–752. [Google Scholar] [CrossRef] [PubMed]
  12. Wan, H.; Bian, J.; Zhang, H.; Li, Y. Assessment of future climate change impacts on water-heat-salt migration in unsaturated frozen soil using CoupModel. Front. Environ. Sci. Eng. 2020, 15, 10. [Google Scholar] [CrossRef]
  13. Lu, X.; Li, R.; Shi, H.; Liang, J.; Miao, Q.; Fan, L. Successive simulations of soil water-heat-salt transport in one whole year of agriculture after different mulching treatments and autumn irrigation. Geoderma 2019, 344, 99–107. [Google Scholar] [CrossRef]
  14. Xun, Y.; Xiao, X.; Sun, C.; Meng, H.; Gao, Y.; Huang, G.; Xu, X. Modeling heat-water-salt transport, crop growth and water use in arid seasonally frozen regions with an improved coupled SPAC model. J. Hydrol. 2022, 615, 128703. [Google Scholar] [CrossRef]
  15. Hou, R.; Qi, Z.; Li, T.; Fu, Q.; Meng, F.; Liu, D.; Li, Q.; Zhao, H.; Yu, P. Mechanism of snowmelt infiltration coupled with salt transport in soil amended with carbon-based materials in seasonally frozen areas. Geoderma 2022, 420, 115882. [Google Scholar] [CrossRef]
  16. Tan, X.; Wu, J.; Wu, M.; Huang, J.; Tan, B.; Li, L. Effects of ice cover on soil water, heat, and solute movement: An experimental study. Geoderma 2021, 403, 115209. [Google Scholar] [CrossRef]
  17. You, Z.; Wen, W.; Lai, Y.; Zhang, M.; Zhang, J. Model tests of the barrier measures on moisture and salt migration in soils subjected to freeze-thaw cycles. Cold Reg. Sci. Technol. 2022, 201, 103607. [Google Scholar] [CrossRef]
  18. Liu, S.; Huang, Q.; Zhang, W.; Ren, D.; Xu, X.; Xiong, Y.; Huang, G. An improved estimation of soil water and salt dynamics by considering soil bulk density changes under freeze/thaw conditions in arid areas with shallow groundwater tables. Sci. Total Environ. 2023, 859, 160342. [Google Scholar] [CrossRef]
  19. Li, L.; Liu, H.; Gong, P.; Lin, E.; Bai, Z.; Li, P.; Wang, C.; Li, J. Multi-objective optimization of winter irrigation for cotton fields in salinized freeze-thaw areas. Eur. J. Agron. 2023, 143, 126715. [Google Scholar] [CrossRef]
  20. Wan, X.; Gong, F.; Qu, M.; Qiu, E.; Zhong, C. Experimental Study of the Salt Transfer in a Cold Sodium Sulfate Soil. KSCE J. Civ. Eng. 2019, 23, 1573–1585. [Google Scholar] [CrossRef]
  21. Huang, X.; Zhang, Z.; Hao, R.; Guo, Z. The Effects of Particle Gradation on Salinized Soil in Arid and Cold Regions. Water 2022, 14, 236. [Google Scholar] [CrossRef]
  22. Hou, R.-j.; Li, T.-x.; Fu, Q.; Liu, D.; Li, M.; Zhou, Z.-q.; Yan, J.-w.; Zhang, S. Research on the distribution of soil water, heat, salt and their response mechanisms under freezing conditions. Soil Tillage Res. 2020, 196, 104486. [Google Scholar] [CrossRef]
  23. Mohawesh, O.; Janssen, M.; Maaitah, O.; Lennartz, B. Assessment the effect of homogenized soil on soil hydraulic properties and soil water transport. Eurasian Soil Sci. 2017, 50, 1077–1085. [Google Scholar] [CrossRef]
  24. Zhang, N.; Yu, X.; Pradhan, A.; Puppala, A.J. Effects of Particle Size and Fines Content on Thermal Conductivity of Quartz Sands. Transp. Res. Rec. 2015, 2510, 36–43. [Google Scholar] [CrossRef]
  25. Li, X.; Guo, M.; Wang, H. Impact of soil texture and salt type on salt precipitation and evaporation under different hydraulic conditions. Hydrol. Process. 2022, 36, e14763. [Google Scholar] [CrossRef]
  26. Li, X.; Chang, S.X.; Salifu, K.F. Soil texture and layering effects on water and salt dynamics in the presence of a water table: A review. Environ. Rev. 2014, 22, 41–50. [Google Scholar] [CrossRef]
  27. Wang, J.-j.; Huang, Y.-f.; Long, H.-y. Water and salt movement in different soil textures under various negative irrigating pressures. J. Integr. Agric. 2016, 15, 1874–1882. [Google Scholar] [CrossRef] [Green Version]
  28. Wang, J.; Huang, Y.; Long, H.; Hou, S.; Xing, A.; Sun, Z. Simulations of water movement and solute transport through different soil texture configurations under negative-pressure irrigation. Hydrol. Process. 2017, 31, 2599–2612. [Google Scholar] [CrossRef]
  29. Panta, S.; Flowers, T.; Doyle, R.; Lane, P.; Haros, G.; Shabala, S. Growth responses of Atriplex lentiformis and Medicago arborea in three soil types treated with saline water irrigation. Environ. Exp. Bot. 2016, 128, 39–50. [Google Scholar] [CrossRef]
  30. Liu, D.; She, D.; Mu, X. Water flow and salt transport in bare saline-sodic soils subjected to evaporation and intermittent irrigation with saline/distilled water. Land Degrad. Dev. 2019, 30, 1204–1218. [Google Scholar] [CrossRef]
  31. Liu, Q.; Liu, Y.; Jin, M.; He, J.; Ferré, P.A.T. Impacts of an Internal Finer-Textured Layer on Soil Evaporation and Salt Distribution. Transp. Porous Media 2021, 140, 603–620. [Google Scholar] [CrossRef]
  32. Xu, C.; Zeng, W.-Z.; Wu, J.-W.; Huang, J.-S. Effects of Different Irrigation Strategies on Soil Water, Salt, and Nitrate Nitrogen Transport. Ecol. Chem. Eng. S 2015, 22, 589–609. [Google Scholar] [CrossRef] [Green Version]
  33. Nachshon, U.; Weisbrod, N.; Dragila, M.I.; Grader, A. Combined evaporation and salt precipitation in homogeneous and heterogeneous porous media. Water Resour. Res. 2011, 47, W03513. [Google Scholar] [CrossRef]
  34. Chen, J.; Wang, E.; Xue, J.; Cui, L.; Zheng, X.; Du, Q. Effects of soil particle size and gradation on the transformation between shallow phreatic water and soil water under laboratory freezing-thawing action. J. Hydrol. 2023, 619, 129323. [Google Scholar] [CrossRef]
  35. Miao, C.; Chen, J.; Zheng, X.; Zhang, Y.; Xu, Y.; Du, Q. Soil Water and Phreatic Evaporation in Shallow Groundwater during a Freeze–Thaw Period. Water 2017, 9, 396. [Google Scholar] [CrossRef] [Green Version]
  36. Ambade, B.; Sethi, S.S.; Giri, B.; Biswas, J.K.; Bauddh, K. Characterization, Behavior, and Risk Assessment of Polycyclic Aromatic Hydrocarbons (PAHs) in the Estuary Sediments. Bull Environ. Contam. Toxicol. 2022, 108, 243–252. [Google Scholar] [CrossRef] [PubMed]
  37. Ambade, B.; Sethi, S.S.; Chintalacheruvu, M.R. Distribution, risk assessment, and source apportionment of polycyclic aromatic hydrocarbons (PAHs) using positive matrix factorization (PMF) in urban soils of East India. Environ. Geochem. Health 2023, 45, 491–505. [Google Scholar] [CrossRef]
  38. Kumar, A.; Ambade, B.; Sankar, T.K.; Sethi, S.S.; Kurwadkar, S. Source identification and health risk assessment of atmospheric PM2.5-bound polycyclic aromatic hydrocarbons in Jamshedpur, India. Sustain. Cities Soc. 2020, 52, 101801. [Google Scholar] [CrossRef]
  39. Ambade, B.; Sethi, S.S.; Kurwadkar, S.; Mishra, P.; Tripathee, L. Accumulation of polycyclic aromatic hydrocarbons (PAHs) in surface sediment residues of Mahanadi River Estuary: Abundance, source, and risk assessment. Mar. Pollut. Bull 2022, 183, 114073. [Google Scholar] [CrossRef]
  40. Sankar, T.K.; Kumar, A.; Mahto, D.K.; Das, K.C.; Narayan, P.; Fukate, M.; Awachat, P.; Padghan, D.; Mohammad, F.; Al-Lohedan, H.A.; et al. The Health Risk and Source Assessment of Polycyclic Aromatic Hydrocarbons (PAHs) in the Soil of Industrial Cities in India. Toxics 2023, 11, 515. [Google Scholar] [CrossRef]
  41. Ambade, B.; Rao, C.M. Assessment of groundwater quality with a special emphasis on fluoride contamination in Rajnandgaon district of Chhattisgarh state in central India. Int. J. Environ. Sci. 2012, 3, 851–858. [Google Scholar] [CrossRef]
  42. Li, S.; Lu, L.; Gao, Y.; Zhang, Y.; Shen, D. An Analysis on the Characteristics and Influence Factors of Soil Salinity in the Wasteland of the Kashgar River Basin. Sustainability 2022, 14, 3500. [Google Scholar] [CrossRef]
  43. Zhang, Z.; Abuduwaili, J.; Jiang, F. Relationship of Heavy Metals and Soil N, P, K and Total Salts in Tianshan Mountains, Central Asia. Asian J. Chem. 2013, 25, 8971–8975. [Google Scholar] [CrossRef]
  44. Chen, J.; Xie, X.; Zheng, X.; Xue, J.; Miao, C.; Du, Q.; Xu, Y. Effects of sand-mulch thickness on soil evaporation during the freeze–thaw period. Hydrol. Process. 2020, 34, 2830–2842. [Google Scholar] [CrossRef]
  45. Chen, J.; Gao, X.; Zheng, X.; Miao, C.; Liu, P.; Du, Q.; Xu, Y. Transformation between Phreatic Water and Soil Water during Freeze–Thaw Periods. Water 2018, 10, 376. [Google Scholar] [CrossRef] [Green Version]
  46. Li, Y.; Huo, S.; Guo, J.; Sun, J.; Pan, J.; Wang, D.; Tan, Q.; Pei, B. Using hydrogen and oxygen stable isotopes to estimate soil water evaporation loss under continuous evaporation conditions. Hydrol. Process. 2023, 37, e14885. [Google Scholar] [CrossRef]
  47. Wu, M.; Huang, J.; Wu, J.; Tan, X.; Jansson, P.-E. Experimental study on evaporation from seasonally frozen soils under various water, solute and groundwater conditions in Inner Mongolia, China. J. Hydrol. 2016, 535, 46–53. [Google Scholar] [CrossRef]
  48. Jamshidi, S.; Zand-Parsa, S.; Kamgar-Haghighi, A.A.; Shahsavar, A.R.; Niyogi, D. Evapotranspiration, crop coefficients, and physiological responses of citrus trees in semi-arid climatic conditions. Agric. Water Manag. 2020, 227, 105838. [Google Scholar] [CrossRef]
  49. Boini, A.; Manfrini, L.; Bortolotti, G.; Corelli-Grappadelli, L.; Morandi, B. Monitoring fruit daily growth indicates the onset of mild drought stress in apple. Sci. Hortic. 2019, 256, 108520. [Google Scholar] [CrossRef]
  50. Fathian, M.; Bazrafshan, O.; Jamshidi, S.; Jafari, L. Impacts of climate change on water footprint components of rainfed and irrigated wheat in a semi-arid environment. Environ. Monit. Assess. 2023, 195, 324. [Google Scholar] [CrossRef]
  51. Wan, W.; Liu, Z.; Li, K.; Wang, G.; Wu, H.; Wang, Q. Drought monitoring of the maize planting areas in Northeast and North China Plain. Agric. Water Manag. 2021, 245, 106636. [Google Scholar] [CrossRef]
  52. Xiao, L.; Yuan, G.D.; Feng, L.R.; Shah, G.M.; Wei, J. Biochar to Reduce Fertilizer Use and Soil Salinity for Crop Production in the Yellow River Delta. J. Soil Sci. Plant Nutr. 2022, 22, 1478–1489. [Google Scholar] [CrossRef]
  53. Stojšin, M.M.; Petrović, S.; Banjac, B.; Zečević, V.; Nikolić, S.R.; Majstorović, H.; Đorđević, R.; Knežević, D. Assessment of Genotype Stress Tolerance as an Effective Way to Sustain Wheat Production under Salinity Stress Conditions. Sustainability 2022, 14, 6973. [Google Scholar] [CrossRef]
  54. Lu, Y.; Liu, S.; Zhang, Y.; Wang, L.; Li, Z. Hydraulic conductivity of gravelly soils with various coarse particle contents subjected to freeze–thaw cycles. J. Hydrol. 2021, 598, 126302. [Google Scholar] [CrossRef]
  55. Ma, D.; He, Z.; Wang, L.; Zhao, W.; Chen, L.; Lin, P.; Zhao, P.; Wang, W.; Gao, Y.; Li, J. Soil water and salt migration in oasis farmland during crop growing season. J. Soils Sediments 2022, 23, 355–367. [Google Scholar] [CrossRef]
  56. Liu, J.; Yang, P.; Yang, Z. Water and salt migration mechanisms of saturated chloride clay during freeze-thaw in an open system. Cold Reg. Sci. Technol. 2021, 186, 103277. [Google Scholar] [CrossRef]
  57. Qin, Y.; Bai, Y.; Chen, G.; Liang, Y.; Li, X.; Wen, B.; Lu, X.; Li, X. The effects of soil freeze-thaw processes on water and salt migrations in the western Songnen Plain, China. Sci. Rep. 2021, 11, 3888. [Google Scholar] [CrossRef] [PubMed]
  58. Cao, Q.; Yang, B.; Li, J.; Wang, R.; Liu, T.; Xiao, H. Characteristics of soil water and salt associated with Tamarix ramosissima communities during normal and dry periods in a semi-arid saline environment. Catena 2020, 193, 104661. [Google Scholar] [CrossRef]
  59. Wang, M.; Zhu, Y.; Zhao, T.; Cui, L.; Mao, W.; Ye, M.; Wu, J.; Yang, J. Chemical characteristics of salt migration in frozen soils during the freezing-thawing period. J. Hydrol. 2022, 606, 127403. [Google Scholar] [CrossRef]
  60. Zhang, R.; Sun, Z.; Li, G.; Wang, H.; Cheng, J.; Hao, M. Influences of water chemical property on infiltration into mixed soil consisting of feldspathic sandstone and aeolian sandy soil. Sci. Rep. 2020, 10, 19497. [Google Scholar] [CrossRef]
  61. Zhang, S.X.; Zhang, Z.Y.; Jiang, S.W.; Yu, J. Effect of Different Management Systems on Soil Water Content in the Black Soil of Northeast China. Adv. Mater. Res. 2012, 610–613, 2912–2915. [Google Scholar] [CrossRef]
  62. Guo, K.; Liu, X. Effect of initial soil water content and bulk density on the infiltration and desalination of melting saline ice water in coastal saline soil. Eur. J. Soil Sci. 2019, 70, 1249–1266. [Google Scholar] [CrossRef]
  63. Wu, C.; Bi, Y.; Christie, P. Influence of Loess Interlayer Thickness on Water Transport in Sand. Pol. J. Environ. Stud. 2022, 31, 3317–3325. [Google Scholar] [CrossRef]
  64. Li, T.; Hao, X.; Kang, S. Spatiotemporal Variability of Soil Moisture as Affected by Soil Properties during Irrigation Cycles. Soil Sci. Soc. Am. J. 2014, 78, 598–608. [Google Scholar] [CrossRef] [Green Version]
  65. Chen, J.; Ren, J.; Wang, E.; Cui, L.; Xue, J.; Zheng, X.; Du, Q. Effect of the interlayer on soil temperature and the transformation between phreatic water and soil water under laboratory freeze-thaw action. Front. Earth Sci. 2023, 11, 677. [Google Scholar] [CrossRef]
  66. Wösten, J.H.M.; Pachepsky, Y.A.; Rawls, W.J. Pedotransfer functions: Bridging the gap between available basic soil data and missing soil hydraulic characteristics. J. Hydrol. 2001, 251, 123–150. [Google Scholar] [CrossRef]
  67. Zhang, N.; Yu, X.; Pradhan, A.; Puppala, A.J. A new generalized soil thermal conductivity model for sand–kaolin clay mixtures using thermo-time domain reflectometry probe test. Acta Geotech. 2016, 12, 739–752. [Google Scholar] [CrossRef]
  68. Libohova, Z.; Seybold, C.; Wysocki, D.; Wills, S.; Schoeneberger, P.; Williams, C.; Lindbo, D.; Stott, D.; Owens, P.R. Reevaluating the effects of soil organic matter and other properties on available water-holding capacity using the National Cooperative Soil Survey Characterization Database. J. Soil Water Conserv. 2018, 73, 411–421. [Google Scholar] [CrossRef] [Green Version]
  69. Zhao, Y.; Si, B.; Zhang, Z.; Li, M.; He, H.; Hill, R.L. A new thermal conductivity model for sandy and peat soils. Agric. For. Meteorol. 2019, 274, 95–105. [Google Scholar] [CrossRef]
  70. Tan, S.B.K.; Shuy, E.B.; Chua, L.H.C.; Mzila, N. Estimation of areal specific yield in sands using the central limit theorem. Hydrol. Process. 2006, 20, 3975–3987. [Google Scholar] [CrossRef]
  71. Shen, J.-H.; Hu, M.-J.; Wang, X.; Zhang, C.-Y.; Xu, D.-S. SWCC of Calcareous Silty Sand Under Different Fines Contents and dry Densities. Front. Environ. Sci. 2021, 9, 682907. [Google Scholar] [CrossRef]
  72. Zhang, X.; Shu, C.; Wu, Y.; Ye, P.; Du, D. Advances of coupled water-heat-salt theory and test techniques for soils in cold and arid regions: A review. Geoderma 2023, 432, 116378. [Google Scholar] [CrossRef]
  73. Hao, G.; Zhang, Z.; Guan, C.; Liu, G.; Hao, Y.; Fu, T. Influence of Soil Salinization on Active Layer Thickness of Frozen Soil. Atmosphere 2023, 14, 296. [Google Scholar] [CrossRef]
  74. Zhang, X.; Wang, Q.; Wang, G.; Wang, W.; Chen, H.; Zhang, Z. A Study on the Coupled Model of Hydrothermal-Salt for Saturated Freezing Salinized Soil. Math. Probl. Eng. 2017, 2017, 4918461. [Google Scholar] [CrossRef] [Green Version]
  75. Yang, C.; Wu, J.; Li, P.; Wang, Y.; Yang, N. Evaluation of Soil-Water Characteristic Curves for Different Textural Soils Using Fractal Analysis. Water 2023, 15, 772. [Google Scholar] [CrossRef]
  76. Chen, S.; Mao, X.; Shukla, M.K. Evaluating the effects of layered soils on water flow, solute transport, and crop growth with a coupled agro-eco-hydrological model. J. Soils Sediments 2020, 20, 3442–3458. [Google Scholar] [CrossRef]
  77. Liu, B.; Wang, S.; Kong, X.; Liu, X. Soil matric potential and salt transport in response to different irrigated lands and soil heterogeneity in the North China Plain. J. Soils Sediments 2019, 19, 3982–3993. [Google Scholar] [CrossRef]
  78. Liu, S.; Huang, Q.; Zhang, W.; Ren, D.; Huang, G. Improving soil hydrological simulation under freeze–thaw conditions by considering soil deformation and its impact on soil hydrothermal properties. J. Hydrol. 2023, 619, 129336. [Google Scholar] [CrossRef]
  79. Jia, J.; Zhang, P.; Yang, X.; Zhang, X.; Lupwayi, N. Feldspathic sandstone addition and its impact on hydraulic properties of sandy soil. Can. J. Soil Sci. 2018, 98, 399–406. [Google Scholar] [CrossRef]
  80. El-Hefnawy, M.E.; Selim, E.M.; Assaad, F.F.; Ismail, A.I. The effect of chloride and sulfate ions on the adsorption of Cd2+ on clay and sandy loam Egyptian soils. Sci. World J. 2014, 2014, 806252. [Google Scholar] [CrossRef] [Green Version]
  81. Pei, Y.; Huang, L.; Li, D.; Shao, M.A. Characteristics and controls of solute transport under different conditions of soil texture and vegetation type in the water-wind erosion crisscross region of China’s Loess Plateau. Chemosphere 2021, 273, 129651. [Google Scholar] [CrossRef] [PubMed]
  82. Luo, J.M.; Yang, F.; Wang, Y.J.; Ya, Y.J.; Deng, W.; Zhang, X.P.; Liu, Z. Mechanism of Soil Sodification at the Local Scale in Songnen Plain, Northeast China, as Affected by Shallow Groundwater Table. Arid. Land Res. Manag. 2011, 25, 234–256. [Google Scholar] [CrossRef]
Figure 1. Location of Taigu Water Balance Experimental Field. (a) Field station and (b) automatic weather station.
Water 15 02587 g001
Figure 2. Meteorological conditions during the experimental period. Variations in (a) average air temperature, (b) relative humidity, (c) precipitation, (d) wind speed, and (e) solar radiation from November 2020 to March 2021.
Water 15 02587 g002
Figure 3. Schematic diagram of the lysimeter.
Water 15 02587 g003
Figure 4. Soil freezing and thawing processes in (a) sandy loam, (b) loamy sand, and (c) sandy soil.
Water 15 02587 g004
Figure 5. Vertical distribution characteristics of water in different textured soils during the freeze–thaw period.
Water 15 02587 g005
Figure 6. Vertical distribution characteristics of Ca2+ in different textured soils during the freeze–thaw period.
Water 15 02587 g006
Figure 7. Vertical distribution characteristics of Na+ in different textured soils during the freeze–thaw period.
Water 15 02587 g007
Figure 8. Vertical distribution characteristics of Cl in different textured soils during the freeze–thaw period.
Water 15 02587 g008
Figure 9. Vertical distribution characteristics of SO42− in different textured soils during the freeze–thaw period.
Water 15 02587 g009
Figure 10. Vertical distribution characteristics of HCO3 in different textured soils during the freeze–thaw period.
Water 15 02587 g010
Figure 11. Vertical distribution characteristics of soil salt in different textured soils during the freeze–thaw period.
Water 15 02587 g011
Figure 12. Correlation coefficients between salt content and water content at different depths of (a) sandy loam, (b) loamy sand, and (c) sandy soil. W10, W20, and W40 are the soil water content at the depth of 10 cm, 20 cm, and 40 cm, respectively, and S0, S10, S20, and S40 are the soil salt content at the depth of 0 cm, 10 cm, 20 cm, and 40 cm, respectively.
Water 15 02587 g012
Table 1. Main physical parameters of soils with different textures.
Soil TextureMass Percentage of Different Textured Soils (%)Maximum Capillary Height (cm)Specific Yield (m3/m3)Bulk Density (g·cm−3)
ClaySiltSand
Sandy Loam16.427.556.11850.081.45
Loamy Sand7.37.585.2770.181.55
Sandy Soil4.15.990600.211.59
Table 2. Division of soil freeze–thaw period.
Soil Freezing and Thawing StageSoil Texture
Sandy LoamLoamy SandSandy Soil
Unstable Freezing StageFrom 18 November to 5 December 2020From 18 November to 3 December 2020From 18 November to 3 December 2020
Stable Freezing StageFrom 6 December 2020 to 12 January 2021From 4 December 2020 to 9 January 2021From 4 December 2020 to 10 January 2021
Thawing StageFrom 13 January to 13 February 2021From 10 January to 14 February 2021From 11 January to 15 February 2021
Table 3. Correlation coefficients between salt content and ions in sandy loam.
Ionic SpeciesSoil Salt Content Na+Ca2+ClSO42−HCO3
Soil Salt Content 1
Na+0.91
Ca2+0.8170.6941
Cl0.730.7490.7491
SO42−0.8060.7980.8330.8471
HCO30.9090.7720.820.4420.5161
Table 4. Correlation coefficients between salt content and ions in loamy sand.
Ionic SpeciesSoil Salt Content Na+Ca2+ClSO42−HCO3
Soil Salt Content 1
Na+0.991
Ca2+0.6940.5911
Cl0.5310.4770.7291
SO42−0.8730.8720.6160.491
HCO30.9950.9860.7120.4840.8231
Table 5. Correlation coefficients between salt content and ions in sandy soil.
Ionic SpeciesSoil Salt Content Na+Ca2+ClSO42−HCO3
Soil Salt Content 1
Na+0.991
Ca2+0.6080.4931
Cl0.7190.6920.6441
SO42−0.8740.8840.7520.6591
HCO30.9890.9880.5360.6510.5931
Table 6. Variations in soil water content and salt content during the freeze–thaw period.
Depth (cm)Soil Water Content (%)Soil Salt Content (g·(100 g)−1)
Sandy LoamLoamy SandSandy SoilSandy LoamLoamy SandSandy Soil
00.0040.0200.0940.1840.2420.063
50.1190.1430.1990.1820.1000.026
100.0580.0830.1730.1460.088−0.019
200.0060.0860.1200.1220.009−0.021
300.0180.0350.0580.1950.0500.154
400.0480.0090.0120.1980.1240.181
50−0.0160.0100.0040.3300.0570.128
Disclaimer/Publisher’s Note: The statements, opinions and data contained in all publications are solely those of the individual author(s) and contributor(s) and not of MDPI and/or the editor(s). MDPI and/or the editor(s) disclaim responsibility for any injury to people or property resulting from any ideas, methods, instructions or products referred to in the content.

