Article

Photogrammetric Technique-Based Quantitative Measuring of Gravity Erosion on Steep Slopes in Laboratory: Accuracy and Application

1
College of Hydraulic & Ecological Engineering, Nanchang Institute of Technology, Nanchang 330099, China
2
Jiangxi Key Laboratory of Degraded Ecosystem Restoration and Watershed Ecohydrology, Nanchang Institute of Technology, Nanchang 330099, China
3
Jiangxi Provincial Technology Innovation Center for Ecological Water Engineering in Poyang Lake Basin, Nanchang 330099, China
4
Jiangxi Academy of Water Science and Engineering, Nanchang 330099, China
5
Key Laboratory of Arable Land Conservation (Middle and lower Reaches of Yangtze River) of the Ministry of Agriculture, Soil and Water Conservation Research Centre, Huazhong Agricultural University, Wuhan 430070, China
*
Authors to whom correspondence should be addressed.
Water 2023, 15(14), 2584; https://doi.org/10.3390/w15142584
Submission received: 6 June 2023 / Revised: 27 June 2023 / Accepted: 7 July 2023 / Published: 15 July 2023
(This article belongs to the Special Issue Effects of Hydrology on Soil Erosion and Soil Conservation)

Abstract

:
Quantitative measuring of gravity erosion contributes to a better understanding of soil-mass failure occurrence and prediction. However, the measurement of gravity erosion requires the continuous monitoring of the objective terrain, due to its occurrence, usually within seconds, and combination with hydraulic erosion. The photogrammetric technique can quickly obtain terrain data and provide a new method for measuring gravity erosion. Based on a continuous high-overlapping image-acquisition equipment, a Structure-from-Motion-Multi-View-Stereo (SfM-MVS)-integrated workflow, and volume calculation, a new working methodology was established for measuring gravity erosion on steep granitic slopes in the laboratory. The results showed a good match between the digital point clouds derived from SfM-MVS-integrated workflow and terrestrial laser scanning (TLS), achieving millimeter-scale accuracy. The mean distance between the point clouds derived from TLS and SfM-MVS was 1.13 mm, with a standard deviation of 0.93 mm. The relative errors among the volumes calculated by SfM-MVS and TLS or the conventional oven-drying method were all within 10%, with a maximum error of 9.3% and a minimum error of 0.2%. A total of 213 gravitational erosion events were measured in the laboratory by using the SfM-MVS method, further confirming its feasibility.

1. Introduction

Gravity erosion is triggered by gravitational force and defined as the erosion and transportation processes of soil mass under its own weight. Gravity erosion, a dominant erosion type on steep hilly slopes, is widely located in gully heads, gully side walls or river valleys [1,2,3]. Gravity erosion usually occurs within seconds in combination with hydraulic erosion, thus posing a great challenge to its site-specific real-time measurement.
Compared with hydraulic erosion, the body of research of gravity erosion is weak because of the phenomenon’s mechanistic complexity and limited measurement methods [4,5]. The quantitative measurement of gravity erosion is very important for a better understanding of soil-mass failure occurrence and prediction. At present, soil-erosion models (such as USLE, CSLE, and WEEP) only consider soil loss under hydraulic force, while the sediment yield produced by gravity erosion is usually indirectly analyzed through the relationship between runoff and sediment or determined through the difference between the amount of total erosion and hydraulic erosion [6,7,8]. Despite the establishment of soil-erosion models involving the influence of gravity erosion by some researchers, these models are empirical equations of soil loss [9]. The study of gravity-erosion models requires a large number of directly observational data sets; most previous studies of gravity erosion involve qualitative description rather than quantitative analysis, which also limits the establishment of gravity-erosion models. Moreover, slope failure is not only a natural hazard but also contributes to landscape evolution and erosion. It is crucial to understand the relationship between mass movements on gully slopes and sediment transport for land and water management.
The traditional direct monitoring methods of gravity erosion, such as the strain probe method, landslide activity maps or drilling-rod method, also have the shortcomings of limited measurement accuracy and an inability to achieve real-time monitoring [10,11,12]. In recent years, with the rapid development of 3S (GPS, RS, GIS) technology, significant progress has been achieved in soil-erosion monitoring technology and analysis methods. Terrestrial laser scanning, sonar bathymetry, radar altimetry, aerial photography, and an approach combing aerial photographs with satellite imagery have been used to monitor soil erosion and geomorphic evolution [13,14,15,16]. However, most of these methods are expensive and mainly applicable to relatively long-term soil-erosion monitoring and geomorphic evolution, and unsuitable for the real-time dynamic monitoring of gravity erosion.
In the decade or so since its emergence, the photogrammetric technique has become a powerful tool for topographic surveying [17,18,19,20]. With the development and improvement in Scale-Invariant Feature Transform (SIFT), Bundler, Patch-Based Multi-View Stereo (PMVS), and other algorithms in the computer-vision community, stereoscopic photogrammetry based on the principle of remote sensing image interpretation, such as Structure-from-Motion (SfM) and Multi-View-Stereo (MVS), has made new progress in obtaining high-resolution terrain data [21,22,23,24,25]. Since the first application of SfM-MVS photogrammetry in geoscientific studies, its implementation has increased significantly, leading to an established method to generate 3D point clouds depicting the earth’s surface with high resolution [26,27]. The photogrammetric technique can simultaneously and automatically calculate camera pose and scene geometry based on matching features in a series of overlapping, offset images [23]. Additionally, this technique has also been integrated into image 3D-modeling software, such as VisualSFM [28], 123D Catch [29], Agisoft PhotoScan [30], CMP SfM [31], etc., which allows one to build a 3D dense point cloud of target objects from images obtained by ordinary consumer un-calibrated and non-metric cameras or even mobile phones [32,33,34]. The precision of the model established by this technique could be comparable to that of a terrestrial laser scanner (TLS) [15,35,36,37], leading to its wide use in geomorphology. Currently, the photogrammetric technique has been used to survey river-bed topography [38,39], coastal retreat [40], and fluvial [41], glacial [42], and gully erosion [20,43,44], as well as map landslides [45]. However, to our knowledge, no report is available about its application in quantitatively measuring gravity-erosion volume, especially soil collapsing on steeper slopes. In most cases, studying the evolution of objects requires a high temporal frequency of data collection with a high spatial resolution. This technique can quickly obtain terrain data and provide new knowledge for the high temporal frequency of data collection, such as gravity-erosion research [36].
Against the above background, this paper aimed (i) to test the quality of point clouds generated by the photogrammetric method based on the SfM-MVS technique; (ii) to evaluate the accuracy of the photogrammetric method in the quantitative measurement of the gravity-erosion volume by comparing TLS with the traditional oven-drying method; and (iii) to apply the SfM-MVS photogrammetric method for estimating the ratio of gravity erosion to the total erosion on the steep granitic slopes.

2. Materials and Methods

2.1. Steep Slope Construction

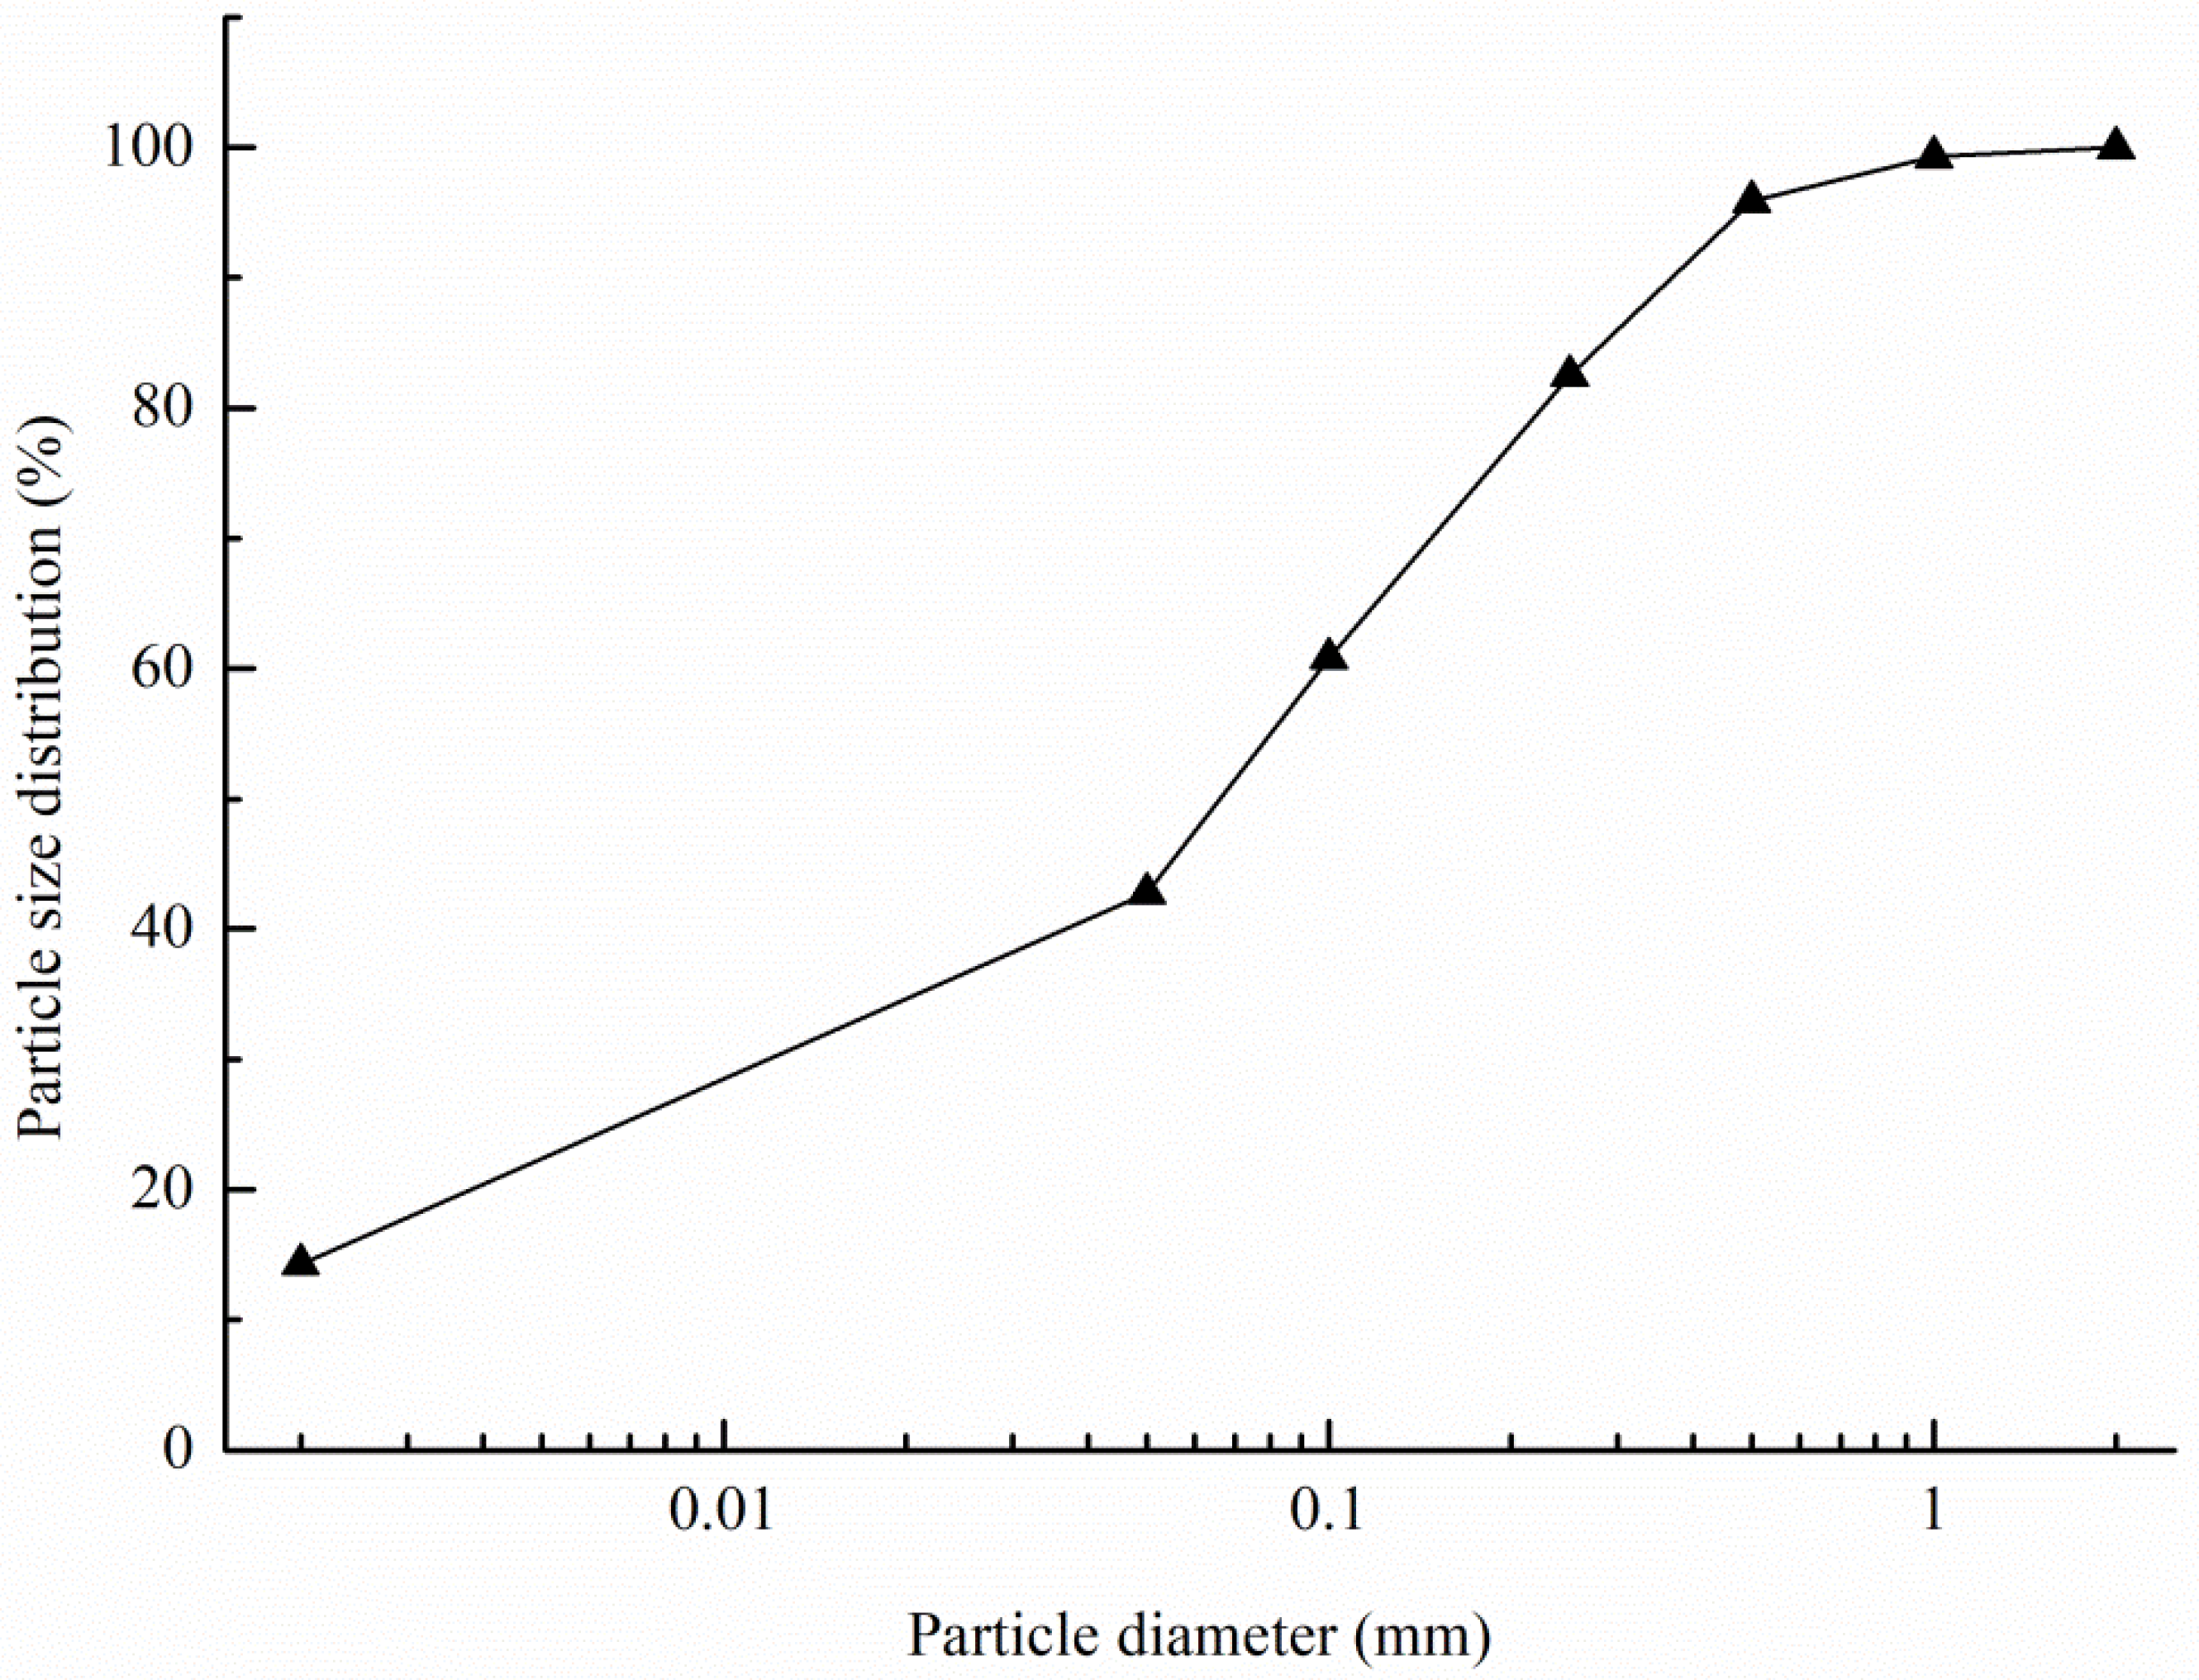
In order to verify the applicability of the SfM-MVS method proposed in this paper in monitoring the gravity-erosion process, we constructed a steep granite-soil slope as shown in Figure 1. The soil slope was 1m high, 1m wide, and 1.5 m long, with a vertical collapsing wall and a gentle slope of 5°. The soil slope was modeled using granite residual soil collected from a collapsing gully in Tongcheng county, Hubei. This area was dominated by gravity erosion because of thick and loose granite weathered crust [46]. Consistent with the field, the bulk density and the initial water content were controlled at 1.38 g cm3 and 10%, respectively. The particle size distribution of the collected granite residual soil was determined using the pipette method and is shown in Figure 2. The basic properties are presented in Table 1.

2.2. Camera System and Calibration

The primary requirement for SfM-MVS is highly redundant and overlapping well-exposed images [20]. The imaging sensors of SfM-MVS can be low-grade compact digital cameras, mobile phones, and even video stills [34], with cost and programmable control as the main considerations for camera selection. The maximum number of cameras was determined as eight for one PC based on the program control and the determine interface restrictions, so eight non-metric cameras (ONTOP X2S) with a USB 2.0 interface were selected to acquire the images of the steep slope (Figure 1). The camera has a complementary metal-oxide semiconductor (CMOS) sensor of 8.0 effective megapixels with a size of 12 mm2 (3 mm × 4 mm) and a resolution of 8 MPa (2448 × 3264). The 35 mm equivalent focal length is 32 mm. In order to control multiple fixed-positions cameras to take continuous images at the same time, we used C# language to implement a camera control program based on Afroge.net in the environment of net framework (4.6.1). Before each experiment, the camera positions were manually adjusted to ensure the cameras’ network could obtain highly redundant and overlapping images for the establishment of 3D point cloud density, with the orientation of cameras orthogonal to the steep slope.
The lens distortion of a non-metric camera can affect the internal camera parameters [47,48,49], so we needed to calibrate the camera to eliminate the effects of lens distortion. Calibration was performed by using the camera to be calibrated to take pictures of the measured objects with known specifications, followed by comparing the estimated value with the real value to calculate the internal camera parameters. Here, the internal camera parameters (focal length, principal point and distortion estimates) of each camera were acquired through the built-in calibration tool (Agisoft Lens v0.4.1) of photogrammetric softcopy Agisoft PhotoScan. The calculated internal camera parameters could improve the quality of cloud points as initial approximations.

2.3. Referencing Setup

Different from the traditional photogrammetry technique, the SfM-MVS method can solve the geometry of the scene and camera parameters automatically, and the control points (CPs) are not necessary for the construction of 3D point clouds. CPs are only used to scale and georeference the cloud points [50]. The bundle adjustment can be carried out theoretically by only three CPs. However, many researchers concluded that CPs are necessary to compensate for the non-linear model misalignment, and the use of CPs can considerably improve the accuracy of models [48,49]. Here, the relative coordinates of 30 CPs were measured by total station (Trimble M3) to obtain optimal accuracy in the laboratory. The total station had an estimated 3D observation accuracy of 3 mm. The CPs were selected to be evenly distributed around the steep slope model, perpendicular to the camera shooting direction. In order to evaluate the accuracy of 3D point clouds, the 30 CPs were divided into 20 reference points and 10 check points. The check points were not used for spatial registration, so the model accuracy can be evaluated by the distance between check points and their corresponding points in the dense point clouds. The 20 reference points were used to scale and georeference the point clouds.

2.4. Photograph Processing and Model Reconstruction

A lot of software can achieve 3D-model reconstruction of an objective scene from photographs. One of the key techniques is SfM, which was considered as the most promising method to generate 3D models from multiple 2D images through photogrammetric methods and computer visualization techniques. Simultaneously, the development of MVS algorithms improves point clouds by maximizing the description information of the objective scene through the information in the images [36]. In this study, Agisoft PhotoScan (http://www.agisoft.ru/products/photoscan, accessed on 24 August 2020) was used to produce the 3D point clouds from the photographs based on an SfM-MVS integrated workflow. The photogrammetric softcopy includes all the steps in 3D model reconstruction, and the whole procedure is semi-automatic, only requiring camera calibration parameters as initial inputs and the manual identification of CPs. Additionally, a manual interference is required for optimizing the 3D-reconstruction process, such as deleting erroneous peaks and troughs induced by mismatching.
The photographs are first scanned for the identification of matching points using a point-matching algorithm. For automatic matching-point extraction in individual images used for image alignment, PhotoScan implements the SIFT algorithm, as the identified features are invariant to camera rotation and image scaling, and to some extent invariant to illumination changes and 3D camera viewpoint. Then, the network of matching points in multiple images is used to estimate both the camera locations and the camera-lens parameters by bundle adjustment (BA). Before optimizing camera parameters, non-target and stray points were eliminated for sparse point clouds. After this initial scene construction, the CPs were manually marked on multiple images, which could be used to improve the image alignment and the estimation of camera calibration parameters through an iterative process in the workflow of PhotoScan. We could check the photograph-alignment process based on the predicted locations of CPs in the model. Finally, through several iterations of optimization, the reprojection error and CP error were stable. After the alignment process, the final dense point clouds were produced from primary sparse point clouds through MVS dense-image-matching algorithms. Dense-image matching is an important procedure for improving point clouds derived from SfM matching techniques, and could increase point density by two or three orders of magnitude. Here, the 3D models were reconstructed with a moderate-depth filter at high quality. The detailed description of SfM-MVS integrated workflow can be found in the literature [20,25].

2.5. Calculation of Volumes of Gravitational Erosion Events

The detailed objective terrain data could be obtained in real time through the SfM-MVS integrated workflow mentioned above. In order to calculate the volumes of gravitational-erosion events, we needed to identify the timings, types, and areas of each gravitational erosion event from the video of the experimental process (Figure 1). Then, we could select the area of interest by comparing the changes in geometric shape of objective surface before and after each gravitational erosion event. Finally, the volume change in the interested area was defined as the volume of each gravitational-erosion event [51,52]. In this paper, we used Cloud Compare (http://cloudcompare.org, accessed on 5 September 2020), an open-source 3D point-cloud and mesh processing software, to calculate the volume change for the point clouds of the interested area before and after each gravitational-erosion event [19].

2.6. Experimental Setup and Assessment

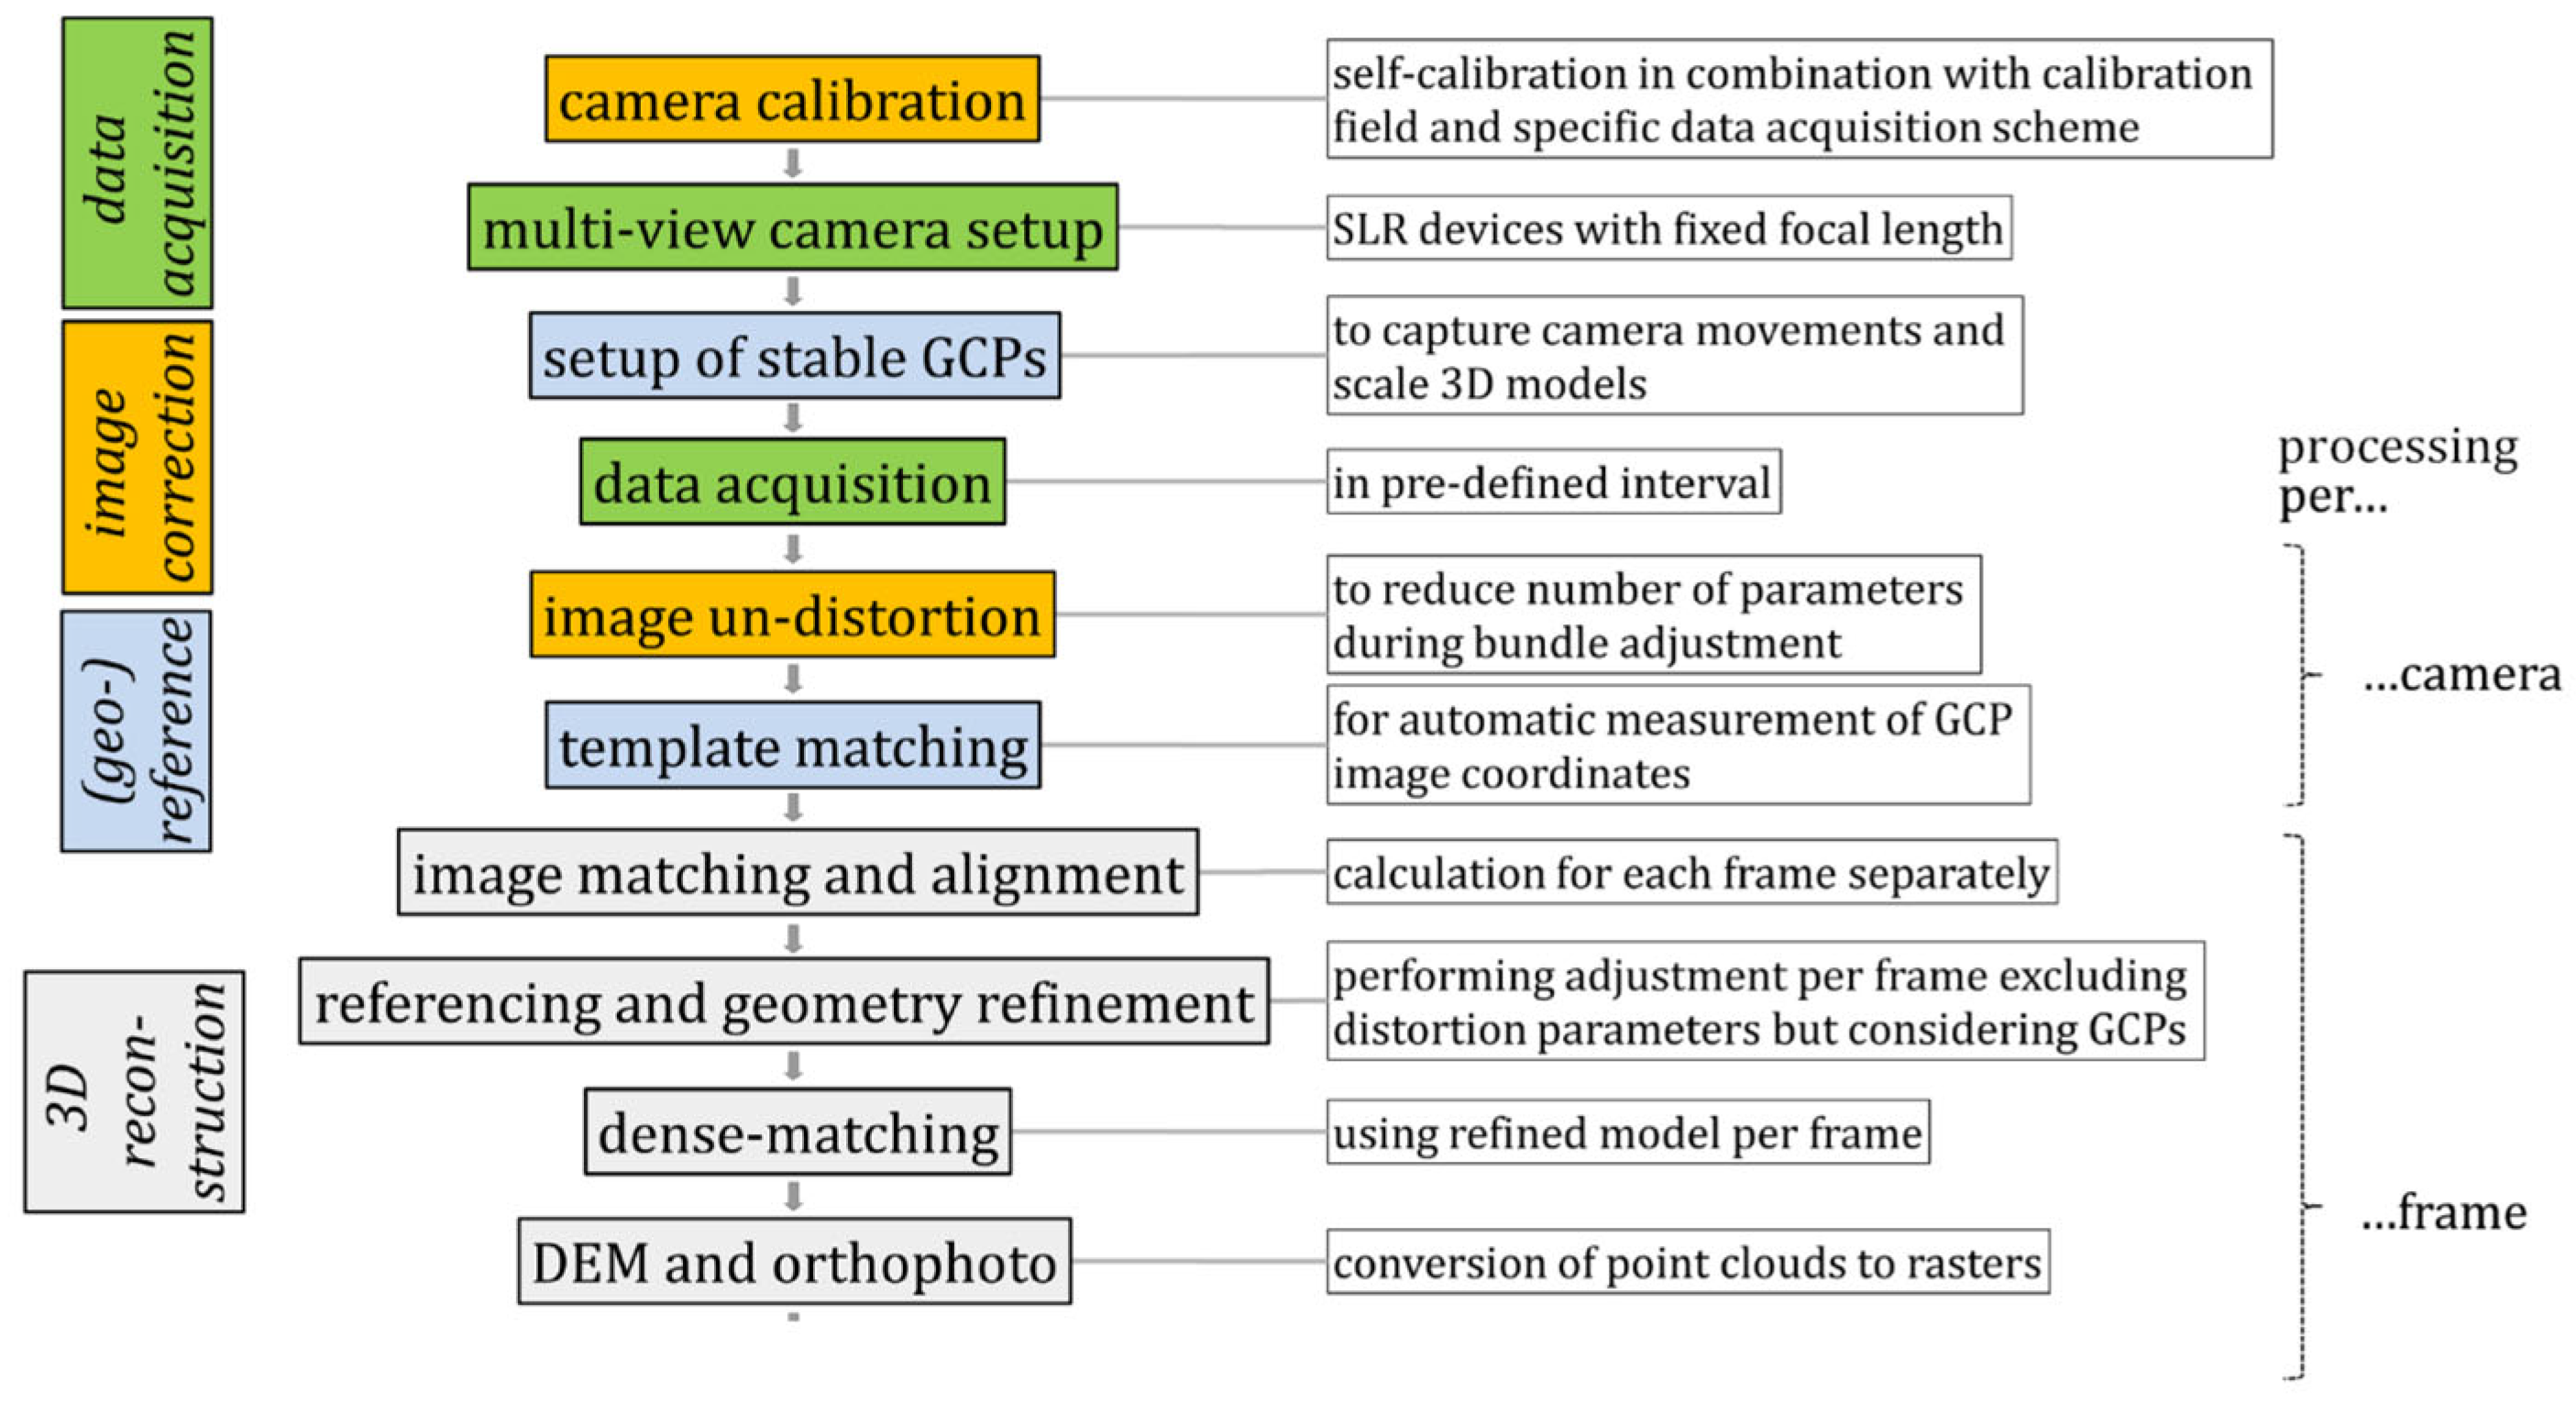
The accuracy of the models derived from SfM-MVS could be assessed using the residuals of the CPs. The root-mean-square errors (RMSEs) of the CPs could be calculated by comparing the measured coordinates through the total station with the interpolated coordinates of the models generated through the photogrammetric process [20]. Additionally, we could also evaluate the accuracy of the models by directly comparing the distance between the clouds of points derived from TLS and SfM-MVS [50]. In order to calculate the distance between two clouds of points, Cloud Compare was selected for cloud-to-cloud comparisons as it can avoid the complex and risky meshing or gridding processes and is more robust to local noise between two methods [53]. For TLS, we used a Z+F IMAGER 5100C, which has a reported precision of 0.1 mm and an accuracy of 0.3–0.5 mm at a 10 m scan distance depending on the surface reflectance of its objective. Additionally, in order to evaluate the reproducibility of the SfM-MVS method, we performed two exercises to obtain two sets of images of the same steep slope terrain by adjusting the cameras’ network [54,55,56]. For the two exercises, the camera positions were adjusted to gain two highly redundant and overlapping image series. Then, the two sets of images were used to generate the 3D density point cloud through the SfM-MVS integrated workflow mentioned above. In this paper, the reproducibility of the multi-image 3D reconstruction method for the steep slope in the laboratory was evaluated by the cloud-to-cloud comparison between two point clouds. The schematic illustration of the data-acquisition and -processing chain developed for 3D reconstruction with Sfm-MVS is shown in Figure 3.
The accuracy of the photogrammetric method in calculating the volumes of gravitational erosion events can be evaluated by the accuracy of point clouds derived from SfM-MVS. Generally, the higher the accuracy of point clouds derived from SfM-MVS, the higher the accuracy of the photogrammetric method [19]. However, it is difficult to judge whether the accuracy of point clouds derived from SfM-MVS could meet the requirements for calculating the volumes of gravitational-erosion events. In order to evaluate the accuracy of the photogrammetric method in calculating the volumes of gravitational-erosion events in this paper, manual excavation experiments were performed on the steep slope to simulate gravity-erosion events for the following reasons. One of the most important reasons is that we could not find any other method to measure the volumes of gravitational-erosion events under rainfall conditions, so we conducted several excavation experiments to simulate gravity-erosion events. Another reason is that we could simulate a variety of slope surface types after the occurrence of gravitational-erosion events, such as circular arcs, linear lines, etc., while controlling the scales of gravitational-erosion events simultaneously. In this way, the terrain data could be obtained using TLS and SfM-MVS before and after manual-excavation experiments. Furthermore, the soil volumes of excavation experiments were calculated by the weight of soil after drying and by its bulk density (the conventional oven-drying method). Here, we conducted 20 manual-excavation experiments, and the accuracy of the method proposed in this paper could be verified by comparing the volumes of both the TLS and the conventional oven-drying method.
Finally, this method was applied to monitor the gravitational-erosion processes for the steep granite-soil slope under simulated rainfall conditions in the laboratory (Figure 1). In order to monitor many more gravitational-erosion events, two intense and continuous rainfall conditions were applied, with rainfall intensity designed as 1 and 2 mm min−1, and the rainfall duration set as 5 h. The gravitational-erosion processes were monitored through the SfM-MVS method mentioned above.

3. Results and Discussion

3.1. The Point-Cloud Accuracy Evaluation

After photogrammetric processing, the 3D model of the objective terrain was reconstructed, and the accuracy was assessed in absolute orientation for every CP. Here, the measured coordinates of CPs were compared with the interpolated coordinates, and the RMSEs were calculated. The residuals of reference points were 1.19 mm, 4.08 mm, and 1.91 mm for the X, Y, and Z directions, respectively. The residuals of check points were 1.35 mm, 4.09 mm, and 1.56 mm for the X, Y, and Z directions, respectively (Figure 4). This indicate that millimeter-scale accuracy can be achieved using SfM-MVS-integrated workflow for the steep soil slopes in the laboratory. Simultaneously, the accuracy of the SfM-MVS-integrated workflow method was estimated using TLS and photographs to survey the same steep-slope landscape. The mean distance between the point clouds derived from TLS and SfM-MVS was 1.13 mm, with a standard deviation of 0.93 mm. The cloud-to-cloud distance in the range of −5.0 to 5.0 mm accounted for 98.3%, with 88.0% between −1.0 and 1.0 mm (Figure 5). For the reproducibility experiments, the mean distance between the two point clouds generated through two sets of images of the same steep slope terrain was 0.65 mm, with a standard deviation of 0.51 mm. The cloud-to-cloud distance in the range of −5.0 to 5.0 mm accounted for 99.4%, with 94.2% between −1.0 and 1.0 mm (Figure 5). The repeatability test results showed that the SfM-MVS-integrated workflow method could obtain relatively certain objective terrain data. Furthermore, there was a good match between the 3D model derived from SfM-MVS and that from TLS.
Generally, the SfM-MVS method can achieve decimeter scale and even sub-millimeter scale accuracy depending on image characteristics and landform complexity for topographical investigation [15,35,36,37]. The highest error of a 3D photo-reconstruction method usually occurs in a hidden or low-visibility area, such as steep slopes, vegetation, gullies, and so on [19,42]. In the present study, the orientation of the cameras was orthogonal to the steep slope, which was different from the investigation of aerial images in the field, so the steep slope did not seem to be an important impediment for 3D photo-reconstruction in the laboratory. Additionally, the area of interest was relatively small, and the average point density could reach 2,000,000 points·m−2. The point density was about two orders of magnitude higher than that of the topographical model derived from the SfM-MVS method for the larger areas of terrain in the field [19,42]. Simultaneously, the area of interest was free from vegetation, and the collapsed terrain was not complex. These were all important reasons for the model accuracy in this study to reach the millimeter scale, much higher than the accuracy of models for larger areas of terrain investigations in the field. Furthermore, the cloud-to-cloud distance of models derived from SfM-MVS and TLS was much higher in many field investigations than in our study [19,42,50]. This might also be attributed to the reasons mentioned above. The results of this analysis indicate that the multi-image 3D-reconstruction method is suitable for morphological surface detection in the laboratory due to simple terrain conditions and controllable environmental elements.

3.2. Volume Calculation Accuracy Evaluation

The excavation volumes ranged from ~200 cm3 to 20,000 cm3 due to the limitation of model size (Figure 6). The results showed that the relative errors among the volumes calculated by SfM-MVS and TLS or the conventional oven-drying method were all within 10%, with a maximum error of 9.3% and a minimum error of 0.2% for the 20 manual-excavation experiments (Figure 6). This demonstrates that the SfM-MVS method is suitable for the volume measurement of both small-scale gravitational-erosion events (e.g., mudslides) and relatively large-scale collapsing in the laboratory. The linear regression analysis showed that the volumes of gravitational-erosion events calculated by SfM-MVS, TLS and the conventional oven-drying method were closely related (R2 > 0.99, p < 0.05) (Figure 6). The measurement accuracy met the general requirements of gravitational-erosion process monitoring.
The 3D photo-reconstruction method is widely applied in soil-erosion monitoring [20,43,44]. Several researchers have concluded that this technique could obtain quite high accuracy relative to the conventional methods in calculating soil-erosion losses. Song et al. (2016) found that the soil-erosion measurement accuracy of close-range photogrammetry could reach 75% using an artificial water washing test, and 83.11% in a natural rainfall experiment. Ming et al. (2019) reported that the average soil-erosion measurement accuracy of close-range photogrammetry could reach 90.67% for free-thaw slopes. However, other researchers argued that close-range photogrammetry was more suitable for surface-elevation change detections in soil-erosion processes than calculating soil-erosion losses directly. They mentioned that the calculation of soil losses from the changes in soil surface may lead to inaccurate results due to alterations in the soil bulk density [5,57]. Even so, the use of close-range photogrammetry techniques in measuring volumes could obtain satisfactory results [58]. In this paper, the relative errors among the volumes calculated by the SfM-MVS method and TLS were all within 10%, indicating that the accuracy of close-range photogrammetry in calculating volumes is quite high, which has been verified by many researchers. Additionally, the relative errors among the volumes calculated by the SfM-MVS method and the conventional oven-drying method were also all within 10%. Therefore, the changes in soil bulk density can be assumed to mainly occur on the soil surface due to the erosion–transportation–deposition processes during rainfall. The soil bulk-density changes might significantly affect the calculation of the soil loss during hydraulic erosion on gentle slopes, but may have little influence on the calculation of the soil loss for gravitational erosion on steep slopes. Furthermore, the volumes of gravity-erosion events were calculated for the interested area before and after each gravitational-erosion event. The calculation error for the volumes in uninterested areas was eliminated, which was also important for improving the calculation accuracy of volumes of gravity-erosion events.

3.3. Application in the Detection of Different Gravitational-Erosion Events

Based on the soil mass failure type, gravitational-erosion events could be divided into avalanche, slide, and earthflow [51,59]. Earthflows have obvious an flow performance and a high water content compared with slides and avalanches. During erosion, the failure block of an avalanche completely separates from the slope surface, whereas that of a landslide slips down as a whole along a weak belt. A total of 213 gravitational-erosion events were monitored in the two simulated rainfall tests in the laboratory, including 8 avalanche events, 14 slide events, and 63 earthflow events under 1 mm min−1 rainfall intensity, and 38 avalanche events, 11 slide events, and 79 earthflow events under 2 mm min−1 rainfall intensity (Figure 7). The gravitational-erosion volumes ranged from 155 cm3 to 23,557 cm3, with the volume of the avalanche and slide much greater than that of the earthflow. The total volume of the avalanche, slide, and earthflow was 37,485 cm3, 27,119 cm3, and 27,604 cm3 for 1 mm min−1 rainfall intensity, and 130,648 cm3, 28,147 cm3, and 21,876 cm3 for 2 mm min−1 rainfall intensity, respectively. Thus, we could calculate the contribution of gravitational erosion to the total erosion. The proportion of gravitational erosion to total erosion was 69.57% for 1 mm min−1 rainfall intensity, while it was 77.04% for 2 mm min−1 rainfall intensity. Additionally, the whole gravitational-erosion process could be evaluated through this method. Earthflow existed throughout the whole erosion process with a small value and a large frequency. The avalanche was concentrated in the early stage of rainfall, while the slide mainly occurred in the late stage. The frequency of the avalanche and slide was considerably increased with rainfall intensity (Figure 7). This method could refine and quantify the research on gravitational-erosion processes.

3.4. Advantages and Limitations

Currently, many devices can be used to monitor changes in surface topography, such as high-precision GPS, high-resolution remote sensing, and airborne/ground laser radar [13,14,15]. However, none of these devices can be used in the study of gravitational-erosion processes for real-time dynamic monitoring. Mass movements on gully slopes are the main contributors to gully-bank expansion and are a major source of sediment delivered to rivers. However, they are often overlooked because they are either too small or too time-consuming to measure in the field. The SfM-MVS method proposed in this paper can obtain terrain data in real time to quantify each gravitational erosion event. Specially, this method relies on a photogrammetric technique, which has made new progress in obtaining high-resolution terrain data, achieving the millimeter-scale accuracy of the 3D slope model in this paper (Figure 4). Additionally, the volumes of gravity-erosion events were calculated for the interested area before and after each gravitational-erosion event. All of these contributed to improving the accuracy of the SfM-MVS method. Furthermore, this method can be equipped with ordinary consumer un-calibrated and non-metric cameras or even mobile phones [60]. For highly redundant and overlapping images and orthogonal slopes, high-price DSLR cameras are not necessary [33]. Simultaneously, the images obtained by cameras are orderly stored in a computer automatically, and the entire equipment does not require artificial operation in the tests. Therefore, this method has the advantages of a good real-time performance, high accuracy, a low cost, and being labor-saving.
However, this method also suffers some limitations. Firstly, it is only suitable for the detection of gravitational-erosion processes for a relatively small area in the laboratory, and unsuitable for a large area and complex topography in the field, especially for areas with dense vegetation. Secondly, just like any other photogrammetric or laser surface-topography detection techniques, the SfM-MVS method also cannot completely reconstruct the objective terrain in blind or low-visibility areas [19,42]. Gravitational-erosion events occur frequently on those collapsing slopes where very few deep gullies are observed, and such a phenomenon did not occur in our tests, but this limitation did exist in our method.

4. Conclusions

This study introduced the SfM-MVS photogrammetric method to quantify the volume of each gravity-erosion event by controlling multiple cameras to take continuous images at the same time. This method can generate 3D surface models of steep slopes from multiple 2D images based on an SfM-MVS-integrated workflow in real time. A millimeter-scale accuracy of 3D models can be achieved using SfM-MVS in the laboratory. The point clouds derived from SfM-MVS matched well with those derived from TLS. Additionally, the SfM-MVS photogrammetric method is suitable for the volume measurement of both small-scale gravitational erosion (e.g., mudslides) and collapsing events in the laboratory, and all the relative errors were within 10%. Finally, this method was used to monitor the gravity-erosion processes under continuous heavy rainfall, and the results demonstrate that this method can refine and quantify these gravitational-erosion processes. Overall, this method has the advantages of real-time data analysis, a low cost, high precision, and being labor-saving, but its application to a large area and a complex topography in the field needs further research.

Author Contributions

Conceptualization, C.C.; methodology, J.X. and Y.W.; writing—original draft preparation, J.X.; writing—review and editing, Y.W., L.Z., X.H., X.L. and P.G.; funding acquisition, L.Z., Y.W. and C.C. All authors have read and agreed to the published version of the manuscript.

Funding

This research was funded by the National Natural Science Foundation of China (No. 41967012; No. 41807065; No. 41630858), the Water Conservancy Science and Technology Program of Jiangxi Province of China (No. 202223TGKT03; No. 202224ZDKT17; No. 202324TGKT08; No. 202324TGKT11), the Science and Technology program of Jiangxi Province of China (No. GJJ2201513) and the China Postdoctoral Science Foundation (No. 2018 M640714).

Data Availability Statement

The data that support the findings of this study are available from the corresponding authors upon reasonable request.

Acknowledgments

The authors thank Hongliang Yu, Jie Wang, Je He and Hao Lu for their help.

Conflicts of Interest

The authors declare no conflict of interest.

References

  1. Dong, Y.; Wu, Y.; Yin, J.; Wang, Y.; Gou, S. Investigation of Soil Shear-Strength Parameters and Prediction of the Collapse of Gully Walls in the Black Soil Region of Northeastern China. Phys. Geogr. 2011, 32, 161–178. [Google Scholar] [CrossRef]
  2. Chen, A.; Zhang, D.; Peng, H.; Fan, J.; Xiong, D.; Liu, G. Experimental study on the development of collapse of overhanging layers of gully in Yuanmou Valley, China. Catena 2013, 109, 177–185. [Google Scholar] [CrossRef]
  3. Rengers, F.K.; Tucker, G.E. The evolution of gully headcut morphology: A case study using terrestrial laser scanning and hydrological monitoring. Earth Surf. Process. Landf. 2015, 40, 1304–1317. [Google Scholar] [CrossRef]
  4. Xu, X.-Z.; Zhang, H.-W.; Wang, W.-L.; Zhao, C.; Yan, Q. Quantitative monitoring of gravity erosion using a novel 3D surface measuring technique: Validation and case study. Nat. Hazards 2014, 75, 1927–1939. [Google Scholar] [CrossRef]
  5. Guo, M.; Shi, H.; Zhao, J.; Liu, P.; Welbourne, D.; Lin, Q. Digital close range photogrammetry for the study of rill development at flume scale. Catena 2016, 143, 265–274. [Google Scholar] [CrossRef]
  6. Yang, J.S.; Yao, W.Y.; Zheng, M.G.; Li, L. Analysis on gravitational sediment yield in the check-dam controlled basins of Chabagou Watershed. J. Hydraul. Eng. 2017, 48, 241–245. (In Chinese) [Google Scholar]
  7. Dong, Y.; Xiong, D.; Su, Z.; Duan, X.; Lu, X.; Zhang, S.; Yuan, Y. The influences of mass failure on the erosion and hydraulic processes of gully headcuts based on an in situ scouring experiment in Dry-hot valley of China. Catena 2019, 176, 14–25. [Google Scholar] [CrossRef]
  8. Liu, X.; Zhang, Y.; Zhang, L.; Fang, X.; Deng, W.; Liu, Y. Aggregate-associated soil organic carbon fractions in subtropical soil undergoing vegetative restoration. Land Degrad. Dev. 2023. early view. [Google Scholar] [CrossRef]
  9. Cai, Q.G.; Lu, Z.X.; Wang, G.P. Process-based soil erosion and sediment yield model in a small basin in the hilly Loess region. Acta Geogr. Sinca 1996, 51, 108–117. (In Chinese) [Google Scholar]
  10. Parise, M.; Wasowski, J. Landslide Activity Maps for Landslide Hazard Evaluation: Three Case Studies from Southern Italy. Nat. Hazards 1999, 20, 159–183. [Google Scholar] [CrossRef]
  11. Iverson, R.M.; Reid, M.E.; Iverson, N.R.; LaHusen, R.G.; Logan, M.; Mann, J.E.; Brien, D.L. Acute Sensitivity of Landslide Rates to Initial Soil Porosity. Science 2000, 290, 513–516. [Google Scholar] [CrossRef] [PubMed] [Green Version]
  12. Kirschbaum, D.B.; Adler, R.; Hong, Y.; Hill, S.; Lerner-Lam, A. A global landslide catalog for hazard applications: Method, results, and limitations. Nat. Hazards 2010, 52, 561–575. [Google Scholar] [CrossRef] [Green Version]
  13. Hu, G.; Wu, Y.; Liu, B.; Zhang, Y.; You, Z.; Yu, Z. The characteristics of gully erosion over rolling hilly black soil areas of Northeast China. J. Geogr. Sci. 2009, 19, 309–320. [Google Scholar] [CrossRef]
  14. Perroy, R.L.; Bookhagen, B.; Asner, G.P.; Chadwick, O.A. Comparison of gully erosion estimates using airborne and ground-based LiDAR on Santa Cruz Island, California. Geomorphology 2010, 118, 288–300. [Google Scholar] [CrossRef]
  15. Castillo, C.; Pérez, R.; James, M.R.; Quinton, J.N.; Taguas, E.V.; Gómez, J.A. Comparing the Accuracy of Several Field Methods for Measuring Gully Erosion. Soil Sci. Soc. Am. J. 2012, 76, 1319–1332. [Google Scholar] [CrossRef] [Green Version]
  16. Ehiorobo, J.O.; Audu, H.A.P. Monitoring of gully erosion in an urban area using geoinformation technology. J. Emerg. Trends Eng. Appl. Sci. 2012, 3, 270–275. [Google Scholar]
  17. Chandler, J. Effective application of automated digital photogrammetry for geomorphological research. Earth Surf. Process. Landf. 1999, 24, 51–63. [Google Scholar] [CrossRef]
  18. Carbonneau, P.E.; Lane, S.N.; Bergeron, N.E. Cost-effective non-metric close-range digital photogrammetry and its application to a study of coarse gravel river beds. Int. J. Remote Sens. 2003, 24, 2837–2854. [Google Scholar] [CrossRef]
  19. Gómez-Gutiérrez, A.; Schnabel, S.; Berenguer-Sempere, F.; Lavado-Contador, F.; Rubio-Delgado, J. Using 3D photo-reconstruction methods to estimate gully headcut erosion. Catena 2014, 120, 91–101. [Google Scholar] [CrossRef]
  20. Frankl, A.; Stal, C.; Abraha, A.; Nyssen, J.; Rieke-Zapp, D.; De Wulf, A.; Poesen, J. Detailed recording of gully morphology in 3D through image-based modelling. Catena 2015, 127, 92–101. [Google Scholar] [CrossRef] [Green Version]
  21. Lowe, D.G. Distinctive Image Features from Scale-Invariant Keypoints. Int. J. Comput. Vis. 2004, 60, 91–110. [Google Scholar] [CrossRef]
  22. Seitz, S.M.; Curless, B.; Diebel, J.; Scharstein, D.; Szeliski, R. A Comparison and Evaluation of Multi-View Stereo Reconstruction Algorithms. In Proceedings of the IEEE Computer Society Conference on Computer Vision and Pattern Recognition, New York, NY, USA, 17–22 June 2006. [Google Scholar]
  23. Snavely, N.; Seitz, S.M.; Szeliski, R. Modeling the World from Internet Photo Collections. Int. J. Comput. Vis. 2008, 80, 189–210. [Google Scholar] [CrossRef] [Green Version]
  24. Verhoeven, G.; Doneus, M.; Briese, C.; Vermeulen, F. Mapping by matching: A computer vision-based approach to fast and accurate georeferencing of archaeological aerial photographs. J. Archaeol. Sci. 2012, 39, 2060–2070. [Google Scholar] [CrossRef]
  25. Javernick, L.; Brasington, J.; Caruso, B. Modeling the topography of shallow braided rivers using Structure-from-Motion photogrammetry. Geomorphology 2014, 213, 166–182. [Google Scholar] [CrossRef]
  26. Matilde, B.; Angel, M.; Jose, L.; Sara, I. Estimation of small-scale soil erosion in laboratory experiments with Structure from Motion Photogrammetry. Geomorphology 2017, 295, 285–296. [Google Scholar]
  27. Eltner, A.; Kaiser, A.; Abellan, A.; Schindewolf, M. Time lapse structure-from-motion photogrammetry for continuous geomorphic monitoring. Earth Surf. Process. Landf. 2017, 42, 2240–2253. [Google Scholar] [CrossRef]
  28. Wu, C. Towards linear-time incremental structure from motion. In Proceedings of the 3DV-Conference, International Conference on IEEE Computer Society, Seattle, WA, USA, 29 June–1 July 2013; pp. 127–134. [Google Scholar] [CrossRef] [Green Version]
  29. Chandler, J.H.; Fryer, J.G. AutoDesk 123D Catch: How accurate is it? Geomat. World 2013, 2, 32–33. [Google Scholar]
  30. Brunier, G.; Fleury, J.; Anthony, E.J.; Gardel, A.; Dussouillez, P. Close-range airborne Structure-from-Motion Photogrammetry for high-resolution beach morphometric surveys: Examples from an embayed rotating beach. Geomorphology 2016, 261, 76–88. [Google Scholar] [CrossRef]
  31. Jancosek, M.; Pajdla, T. Multi-view reconstruction preserving weakly-supported surfaces. In Proceedings of the CVPR 2011, Colorado Springs, CO, USA, 20–25 June 2011; pp. 3121–3128. [Google Scholar] [CrossRef]
  32. Micheletti, N.; Chandler, J.H.; Lane, S.N. Investigating the geomorphological potential of freely available and accessible structure-from-motion photogrammetry using a smartphone. Earth Surf. Process. Landf. 2014, 40, 473–486. [Google Scholar] [CrossRef] [Green Version]
  33. Thoeni, K.; Giacomini, A.; Murtagh, R.; Kniest, E. A comparison of multi-view 3D reconstruction of a rock wall using several cameras and a laser scanner. ISPRS—Int. Arch. Photogramm. Remote Sens. Spat. Inf. Sci. 2014, 40, 573–580. [Google Scholar] [CrossRef] [Green Version]
  34. Mosbrucker, A.R.; Major, J.J.; Spicer, K.R.; Pitlick, J. Camera system considerations for geomorphic applications of SfM photogrammetry. Earth Surf. Process. Landf. 2017, 42, 969–986. [Google Scholar] [CrossRef] [Green Version]
  35. James, M.R.; Robson, S. Straightforward reconstruction of 3D surfaces and topography with a camera: Accuracy and geoscience application. J. Geophys. Res. Earth Surf. 2012, 117, 03017. [Google Scholar] [CrossRef] [Green Version]
  36. Fonstad, M.A.; Dietrich, J.T.; Courville, B.C.; Jensen, J.L.; Carbonneau, P.E. Topographic structure from motion: A new development in photogrammetric measurement. Earth Surf. Process. Landf. 2013, 38, 421–430. [Google Scholar] [CrossRef] [Green Version]
  37. Peter, K.D.; D’Oleire-Oltmanns, S.; Ries, J.B.; Marzolff, I.; Hssaine, A.A. Soil erosion in gully catchments affected by land-levelling measures in the Souss Basin, Morocco, analysed by rainfall simulation and UAV remote sensing data. Catena 2014, 113, 24–40. [Google Scholar] [CrossRef]
  38. Chandler, J.; Ashmore, P.; Paola, C.; Gooch, M.; Varkaris, F. Monitoring River-Channel Change Using Terrestrial Oblique Digital Imagery and Automated Digital Photogrammetry. Ann. Assoc. Am. Geogr. 2002, 92, 631–644. [Google Scholar] [CrossRef]
  39. Bird, S.; Hogan, D.; Schwab, J. Photogrammetric monitoring of small streams under a riparian forest canopy. Earth Surf. Process. Landf. 2010, 35, 952–970. [Google Scholar] [CrossRef]
  40. Gonçalves, J.A.; Henriques, R. UAV photogrammetry for topographic monitoring of coastal areas. ISPRS J. Photogramm. Remote Sens. 2015, 104, 101–111. [Google Scholar] [CrossRef]
  41. Woodget, A.S.; Carbonneau, P.E.; Visser, F.; Maddock, I.P. Quantifying submerged fluvial topography using hyperspatial resolution UAS imagery and structure from motion photogrammetry. Earth Surf. Process. Landf. 2015, 40, 47–64. [Google Scholar] [CrossRef] [Green Version]
  42. Westoby, M.; Brasington, J.; Glasser, N.F.; Hambrey, M.J.; Reynolds, J.M. ‘Structure-from-Motion’ photogrammetry: A low-cost, effective tool for geoscience applications. Geomorphology 2012, 179, 300–314. [Google Scholar] [CrossRef] [Green Version]
  43. Kaiser, A.; Neugirg, F.; Rock, G.; Müller, C.; Haas, F.; Ries, J.; Schmidt, J. Small-Scale Surface Reconstruction and Volume Calculation of Soil Erosion in Complex Moroccan Gully Morphology Using Structure from Motion. Remote Sens. 2014, 6, 7050–7080. [Google Scholar] [CrossRef] [Green Version]
  44. Glendell, M.; McShane, G.; Farrow, L.; James, M.R.; Quinton, J.; Anderson, K.; Evans, M.; Benaud, P.; Rawlins, B.; Morgan, D.; et al. Testing the utility of structure-from-motion photogrammetry reconstructions using small unmanned aerial vehicles and ground photography to estimate the extent of upland soil erosion. Earth Surf. Process. Landf. 2017, 42, 1860–1871. [Google Scholar] [CrossRef] [Green Version]
  45. Niethammer, U.; Rothmund, S.; Schwaderer, U.; Zeman, J.; Joswig, M. Open source image-processing tools for low-cost uav-based landslide investigations. ISPRS—Int. Arch. Photogramm. Remote Sens. Spat. Inf. Sci. 2012, 38, 161–166. [Google Scholar] [CrossRef] [Green Version]
  46. Xia, J.; Cai, C.; Wei, Y.; Wu, X. Granite residual soil properties in collapsing gullies of south China: Spatial variations and effects on collapsing gully erosion. Catena 2018, 174, 469–477. [Google Scholar] [CrossRef]
  47. Eltner, A.; Baumgart, P.; Maas, H.-G.; Faust, D. Multi-temporal UAV data for automatic measurement of rill and interrill erosion on loess soil. Earth Surf. Process. Landf. 2014, 40, 741–755. [Google Scholar] [CrossRef]
  48. James, M.; Robson, S.; D’Oleire-Oltmanns, S.; Niethammer, U. Optimising UAV topographic surveys processed with structure-from-motion: Ground control quality, quantity and bundle adjustment. Geomorphology 2017, 280, 51–66. [Google Scholar] [CrossRef] [Green Version]
  49. James, M.R.; Robson, S.; Smith, M.W. 3-D uncertainty-based topographic change detection with structure-from-motion photogrammetry: Precision maps for ground control and directly georeferenced surveys. Earth Surf. Process. Landf. 2017, 42, 1769–1788. [Google Scholar] [CrossRef]
  50. Stöcker, C.; Eltner, A.; Karrasch, P. Measuring gullies by synergetic application of UAV and close range photogrammetry—A case study from Andalusia, Spain. Catena 2015, 132, 1–11. [Google Scholar] [CrossRef]
  51. Xu, X.-Z.; Liu, Z.-Y.; Xiao, P.-Q.; Guo, W.-Z.; Zhang, H.-W.; Zhao, C.; Yan, Q. Gravity erosion on the steep loess slope: Behavior, trigger and sensitivity. Catena 2015, 135, 231–239. [Google Scholar] [CrossRef]
  52. Guo, W.-Z.; Xu, X.-Z.; Wang, W.-L.; Yang, J.-S.; Liu, Y.-K.; Xu, F.-L. A measurement system applicable for landslide experiments in the field. Rev. Sci. Instrum. 2016, 87, 044501. [Google Scholar] [CrossRef] [Green Version]
  53. Lague, D.; Brodu, N.; Leroux, J. Accurate 3D comparison of complex topography with terrestrial laser scanner: Application to the Rangitikei canyon (N-Z). ISPRS J. Photogramm. Remote Sens. 2013, 82, 10–26. [Google Scholar] [CrossRef] [Green Version]
  54. Clapuyt, F.; Vanacker, V.; Van Oost, K. Reproducibility of UAV-based earth topography reconstructions based on Structure-from-Motion algorithms. Geomorphology 2016, 260, 4–15. [Google Scholar] [CrossRef]
  55. Smith, M.W.; Vericat, D. From experimental plots to experimental landscapes: Topography, erosion and deposition in sub-humid badlands from Structure-from-Motion photogrammetry. Earth Surf. Process. Landf. 2015, 40, 1656–1671. [Google Scholar] [CrossRef] [Green Version]
  56. Goetz, J.; Brenning, A.; Marcer, M.; Bodin, X. Modeling the precision of structure-from-motion multi-view stereo digital elevation models from repeated close-range aerial surveys. Remote Sens. Environ. 2018, 210, 208–216. [Google Scholar] [CrossRef]
  57. Gessesse, G.D.; Fuchs, H.; Mansberger, R.; Klik, A.; Rieke-Zapp, D.H. Assessment of Erosion, Deposition and Rill Development on Irregular Soil Surfaces Using Close Range Digital Photogrammetry. Photogramm. Rec. 2010, 25, 299–318. [Google Scholar] [CrossRef]
  58. El-Din Fawzy, H. The accuracy of determing the volumes using close range photogrammetry. J. Mech. Civ. Eng. 2015, 12, 10–15. [Google Scholar]
  59. Guo, W.-Z.; Luo, L.; Wang, W.-L.; Liu, Z.-Y.; Chen, Z.-X.; Kang, H.-L.; Yang, B. Sensitivity of rainstorm-triggered shallow mass movements on gully slopes to topographical factors on the Chinese Loess Plateau. Geomorphology 2019, 337, 69–78. [Google Scholar] [CrossRef]
  60. Chandler, J.H.; Fryer, J.G.; Jack, A. Metric capabilities of low-cost digital cameras for close range surface measurement. Photogramm. Rec. 2005, 20, 12–26. [Google Scholar] [CrossRef]
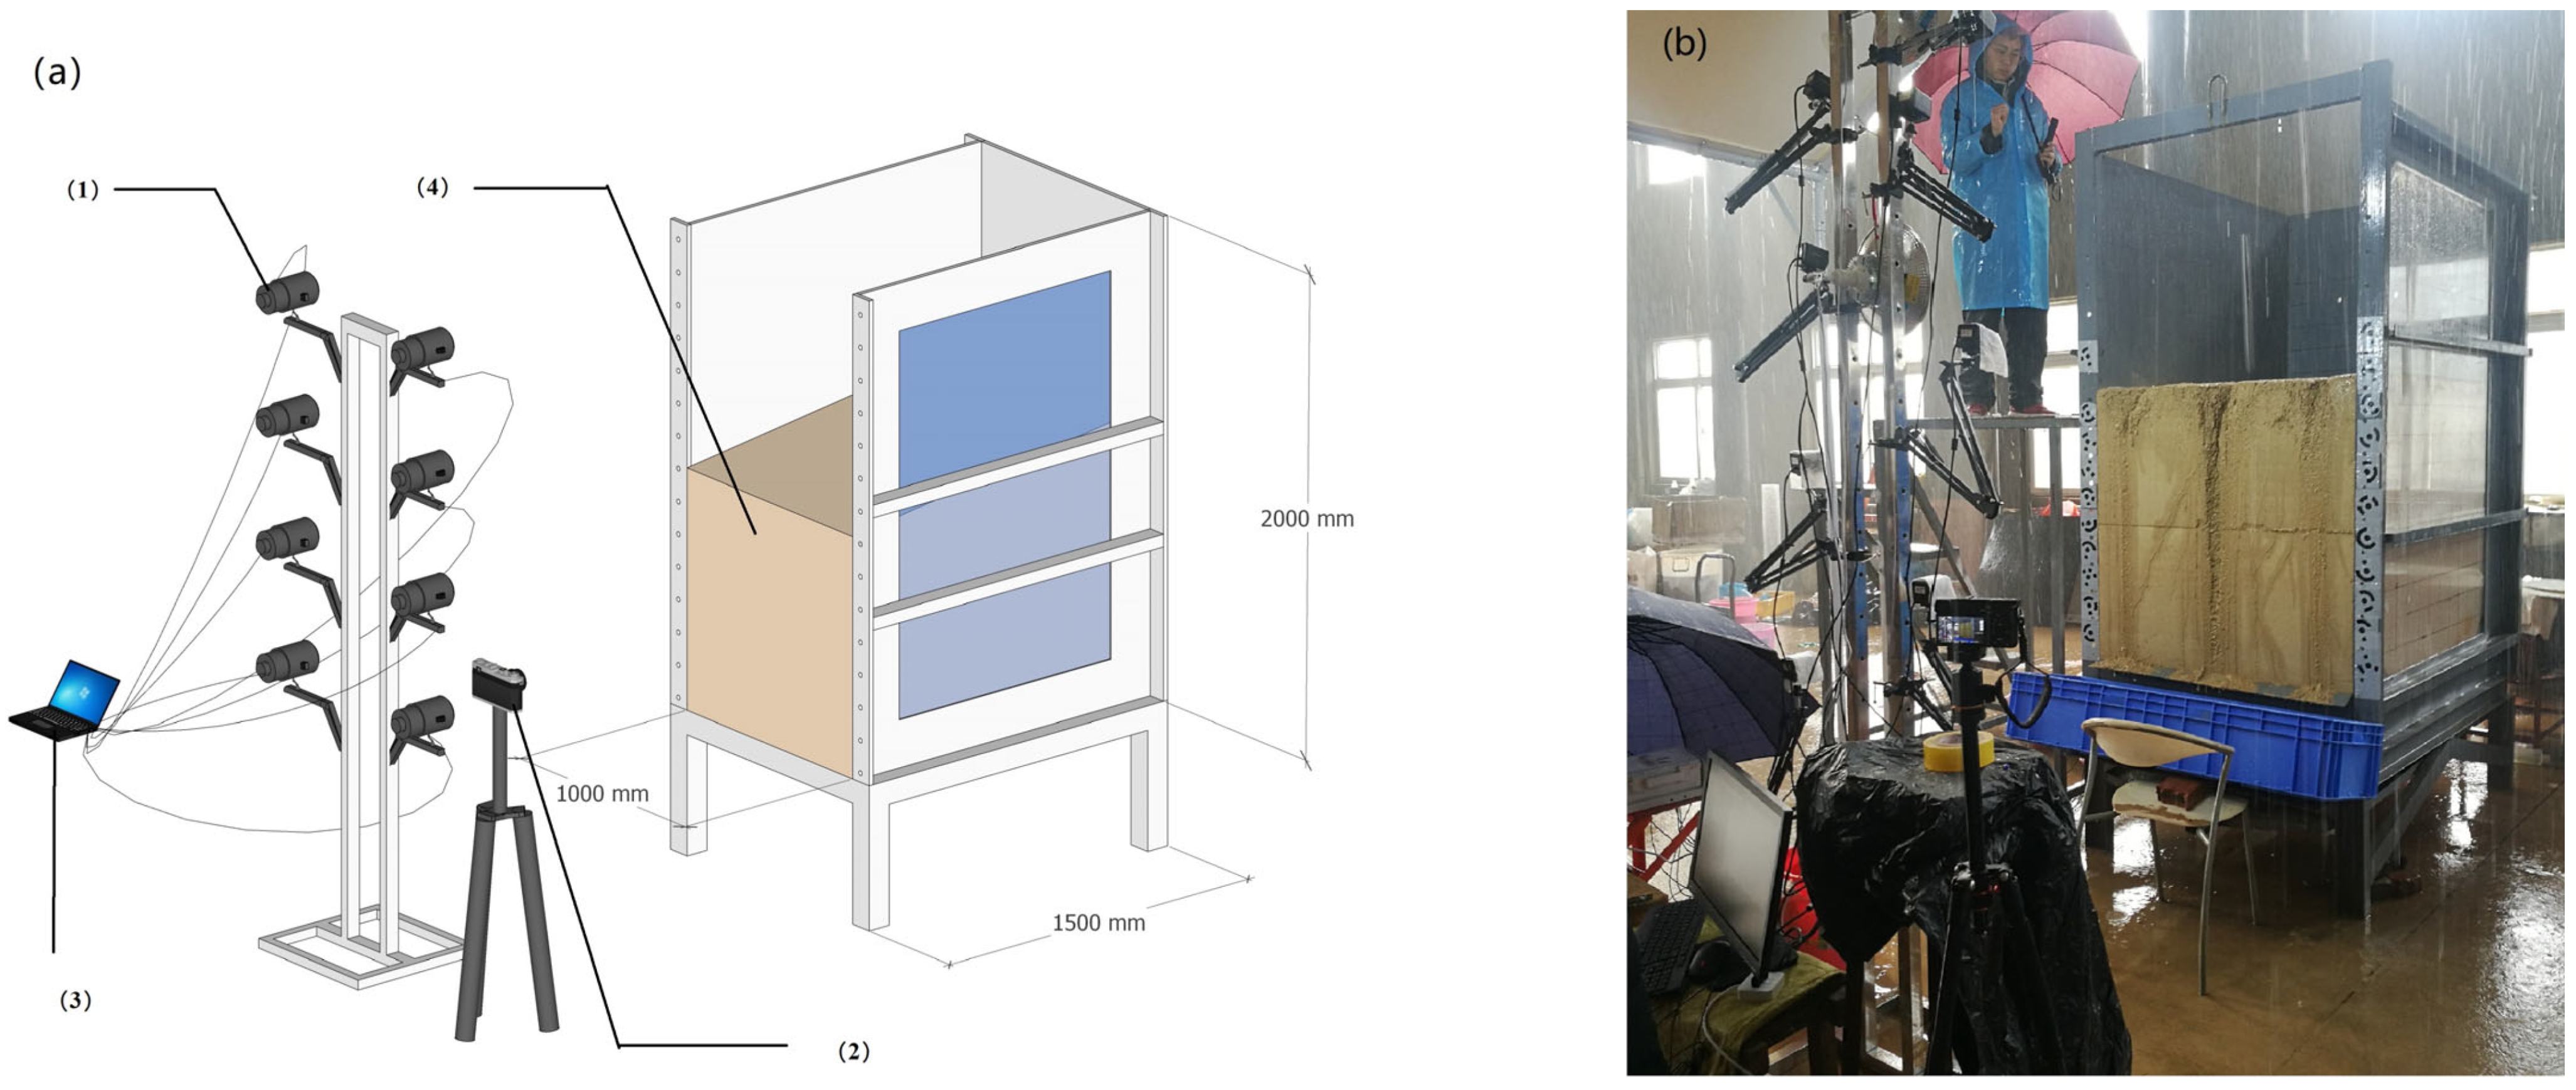
Figure 1. Sketch of experimental equipment. (a) Blue print of the experimental system; (b) Picture of an experimental site. (1) Image acquisition system; (2) camera, which was used to judge the type and position of gravity erosion after experiments; (3) computer, which was used to control the cameras and store images; and (4) constructed slope.
Water 15 02584 g001
Figure 2. Particle size distribution of sampling soil.
Water 15 02584 g002
Figure 3. The schematic illustration of the data acquisition and processing chain developed for 3D reconstruction with Sfm-MVS.
Water 15 02584 g003
Figure 4. The boxplot of residuals of reference control points and check control points for the X, Y, and Z directions.
Water 15 02584 g004
Figure 5. Histogram of cloud-to-cloud distance. Black line refers to the cloud-to-cloud distance between point cloud models derived from SfM-MVS and TLS, and red line refers to the reproducibility test.
Water 15 02584 g005
Figure 6. Relationships between gravity-erosion volumes calculated by (a) the SfM-MVS method and TLS, (b) the SfM-MVS method and conventional oven-drying method. Lines represent the best fit using linear regression.
Water 15 02584 g006
Figure 7. Distribution of gravity-erosion volume with rainfall time. (a) The 1 mm min−1 rainfall intensity; and (b) The 2 mm min−1 rainfall intensity.
Water 15 02584 g007
Table 1. Basic properties of sampling soil.
BD
(g cm−3)
PD
(g cm−3)
TP
(%)
CP
(%)
LL
(%)
PL
(%)
SOM
(g kg−1)
Fed
(g kg−1)
Feo
(g kg−1)
Ald
(g kg−1)
Alo
(g kg−1)
1.382.6146.3138.1936.4220.354.625.970.082.131.64
Disclaimer/Publisher’s Note: The statements, opinions and data contained in all publications are solely those of the individual author(s) and contributor(s) and not of MDPI and/or the editor(s). MDPI and/or the editor(s) disclaim responsibility for any injury to people or property resulting from any ideas, methods, instructions or products referred to in the content.