1. Introduction
The presence of vegetation in natural channels introduces considerable flow resistance, leading to significant alterations in flow characteristics, particularly in river environments, especially during periods of high water flow such as floods. Vegetation plays a crucial role in modifying the turbulence structures of flowing water, influencing the spatial distribution and intensity of turbulent flow phenomena. These changes in turbulence patterns caused by vegetation have wide-ranging implications for the hydraulic behaviour of channels, impacting sediment transport, water quality, and ecological processes. Understanding the intricate interplay between vegetation and flow turbulence is crucial for effective river management and ecosystem conservation. Based on Te Chow’s [
1] and Nezu and Nakagawa’s [
2] studies, the vertical distribution of longitudinal velocities is logarithmic in expected open channel flows without vegetation.
Nevertheless, vegetation adds resistance, induces drag force, and causes significant changes in velocity distribution. Vegetation inside channels could be either emergent or submerged. In emergent conditions, the vertical distribution of longitudinal velocities in a uniform condition varies with depth [
3,
4]. In submerged conditions, the vertical distribution of longitudinal velocities is more complicated than for emergent conditions [
5,
6,
7].
Riparian vegetation influences flood management, channel design, and ecological river management [
8,
9]. Velocity distribution has been widely studied in open channel flows with macro-roughness-like vegetations, influencing zonal and stage discharge [
10]. Recently, partly and multi-layered vegetation has been studied considerably, which controls the hydrodynamics of wetland and inland floodplains around riverine ecosystems [
11]. Rominger and Nepf [
12] show the momentum exchange and a strong flow gradient along partly obstructed vegetated and non-vegetated regions in open channel flows. Complex flow structures in partially placed vegetation are strongly dictated by the density and spacing of the vegetation established on the bed. The other type of vegetation configuration, which has flow complexity along the flow depth is concurrent to differential vegetation height such as double-layered vegetation [
13].
The concept of denser and sparser vegetation in lower and higher zones of roughness manifests as flow resistance and complexity of flow in the natural environment. The submergence ratio in such conditions plays a pivotal role which defines the flow structure influencing nutrient, sediment, and pollutant dispersion. Some studies have different submergence ratios of uniform height vegetation, using denser vegetation below and sparser vegetation above to study the dynamics of longitudinal distribution in flow [
14]. Previous research predominantly concentrated on experimental investigations of either submerged or emerged single-layered vegetation. As mentioned earlier, limited studies have specifically addressed the dynamics of flows involving a heterogeneous combination of short and tall vegetation.
Consequently, to accurately replicate the riparian environment, it becomes imperative to account for the influence of both short and tall vegetation in conjunction, thereby introducing heightened complexity to flow patterns. The interaction between flow and such mixed-layered vegetation configurations can generate intricate three-dimensional flow structures. In this study, numerical simulations are employed to comprehensively examine turbulence characteristics across different patches of vegetation within open channel flow. This endeavour aims to enhance our understanding of the complex flow dynamics arising from the interaction between flow and mixed-layered vegetation, thereby providing valuable insights into this complex phenomenon.
Besides the experimental investigation of differential height vegetation such as double-layered vegetation, many simple turbulence closure schemes were tested for immersion as drag source terms in Reynolds-Averaged Navier–Stokes equations for vegetation effects [
15,
16]. Furthermore, different numerical simulation techniques can compensate for space and time limitations of flow structure experiments in layered vegetation [
17]. Watanabe [
18] used Large Eddy Simulation (LES) to simulate the flow in a vegetated channel and studied vegetation’s role in momentum exchange. Other authors have also simulated 3D flow behaviour for micro-roughness studies, sediment transport, and suspended canopies [
19]. However, the influence of double-layered vegetation on the vertical distribution of longitudinal velocity profiles is still poorly understood numerically and experimentally. Sound knowledge of these influences is necessary for practical and natural river management and hydro informatics of ecosystems.
These studies have examined numerical modelling as a valuable tool for exploring the influence of double-layered vegetation on factors contributing to flow resistance induced by rigid vegetation. This study specifically focuses on the impact of vegetation on open channel flow, whereby turbulence is affected within the denser lower vegetation zone and the sparser upper vegetation zone. To comprehensively investigate this effect, an extensive series of experiments have been conducted at the hydraulic engineering laboratory located at the Nanjing Hydraulic Research Institute in China. These experiments encompass four distinct cases featuring linear or staggered arrangements of double-layered vegetation. Furthermore, the study also delves into the investigation of numerical modelling techniques across all experimental scenarios, intending to capture the longitudinal velocity profile over double-layered vegetation accurately. By employing both experimental and numerical approaches, a holistic understanding of the influence of vegetation on flow dynamics can be obtained.
The primary objective of this study is to examine how vegetation affects flow characteristics in open channel flows. Specifically, the focus is on the turbulence generated over the denser lower vegetation zone and the upper sparser vegetation zone. Specifically, one of the main objectives of this study is to analyse and quantify Turbulence Kinetic Energy within open channel flow with double-layered vegetation. By measuring and evaluating Turbulence Kinetic Energy under different arrangements of vegetation, the researchers seek to understand how vegetation influences turbulence patterns and energy dissipation in flow. In addition, the study aims to explore the use of numerical modelling techniques. The researchers intend to develop numerical models that can accurately simulate flow conditions and capture the longitudinal velocity profile over double-layered vegetation. This objective allows for a comparative analysis between experimental datasets and numerical simulations, providing a comprehensive understanding of flow characteristics. Ultimately, the study aims to contribute to the knowledge and understanding of the impact of vegetation on open channel flow. The findings from this research can be valuable for hydraulic engineers and practitioners involved in the design and management of river systems, flood control measures, and other related projects. The study’s objectives align with the broader goal of improving the accuracy and effectiveness of hydraulic engineering practices.
2. Vegetation Formation
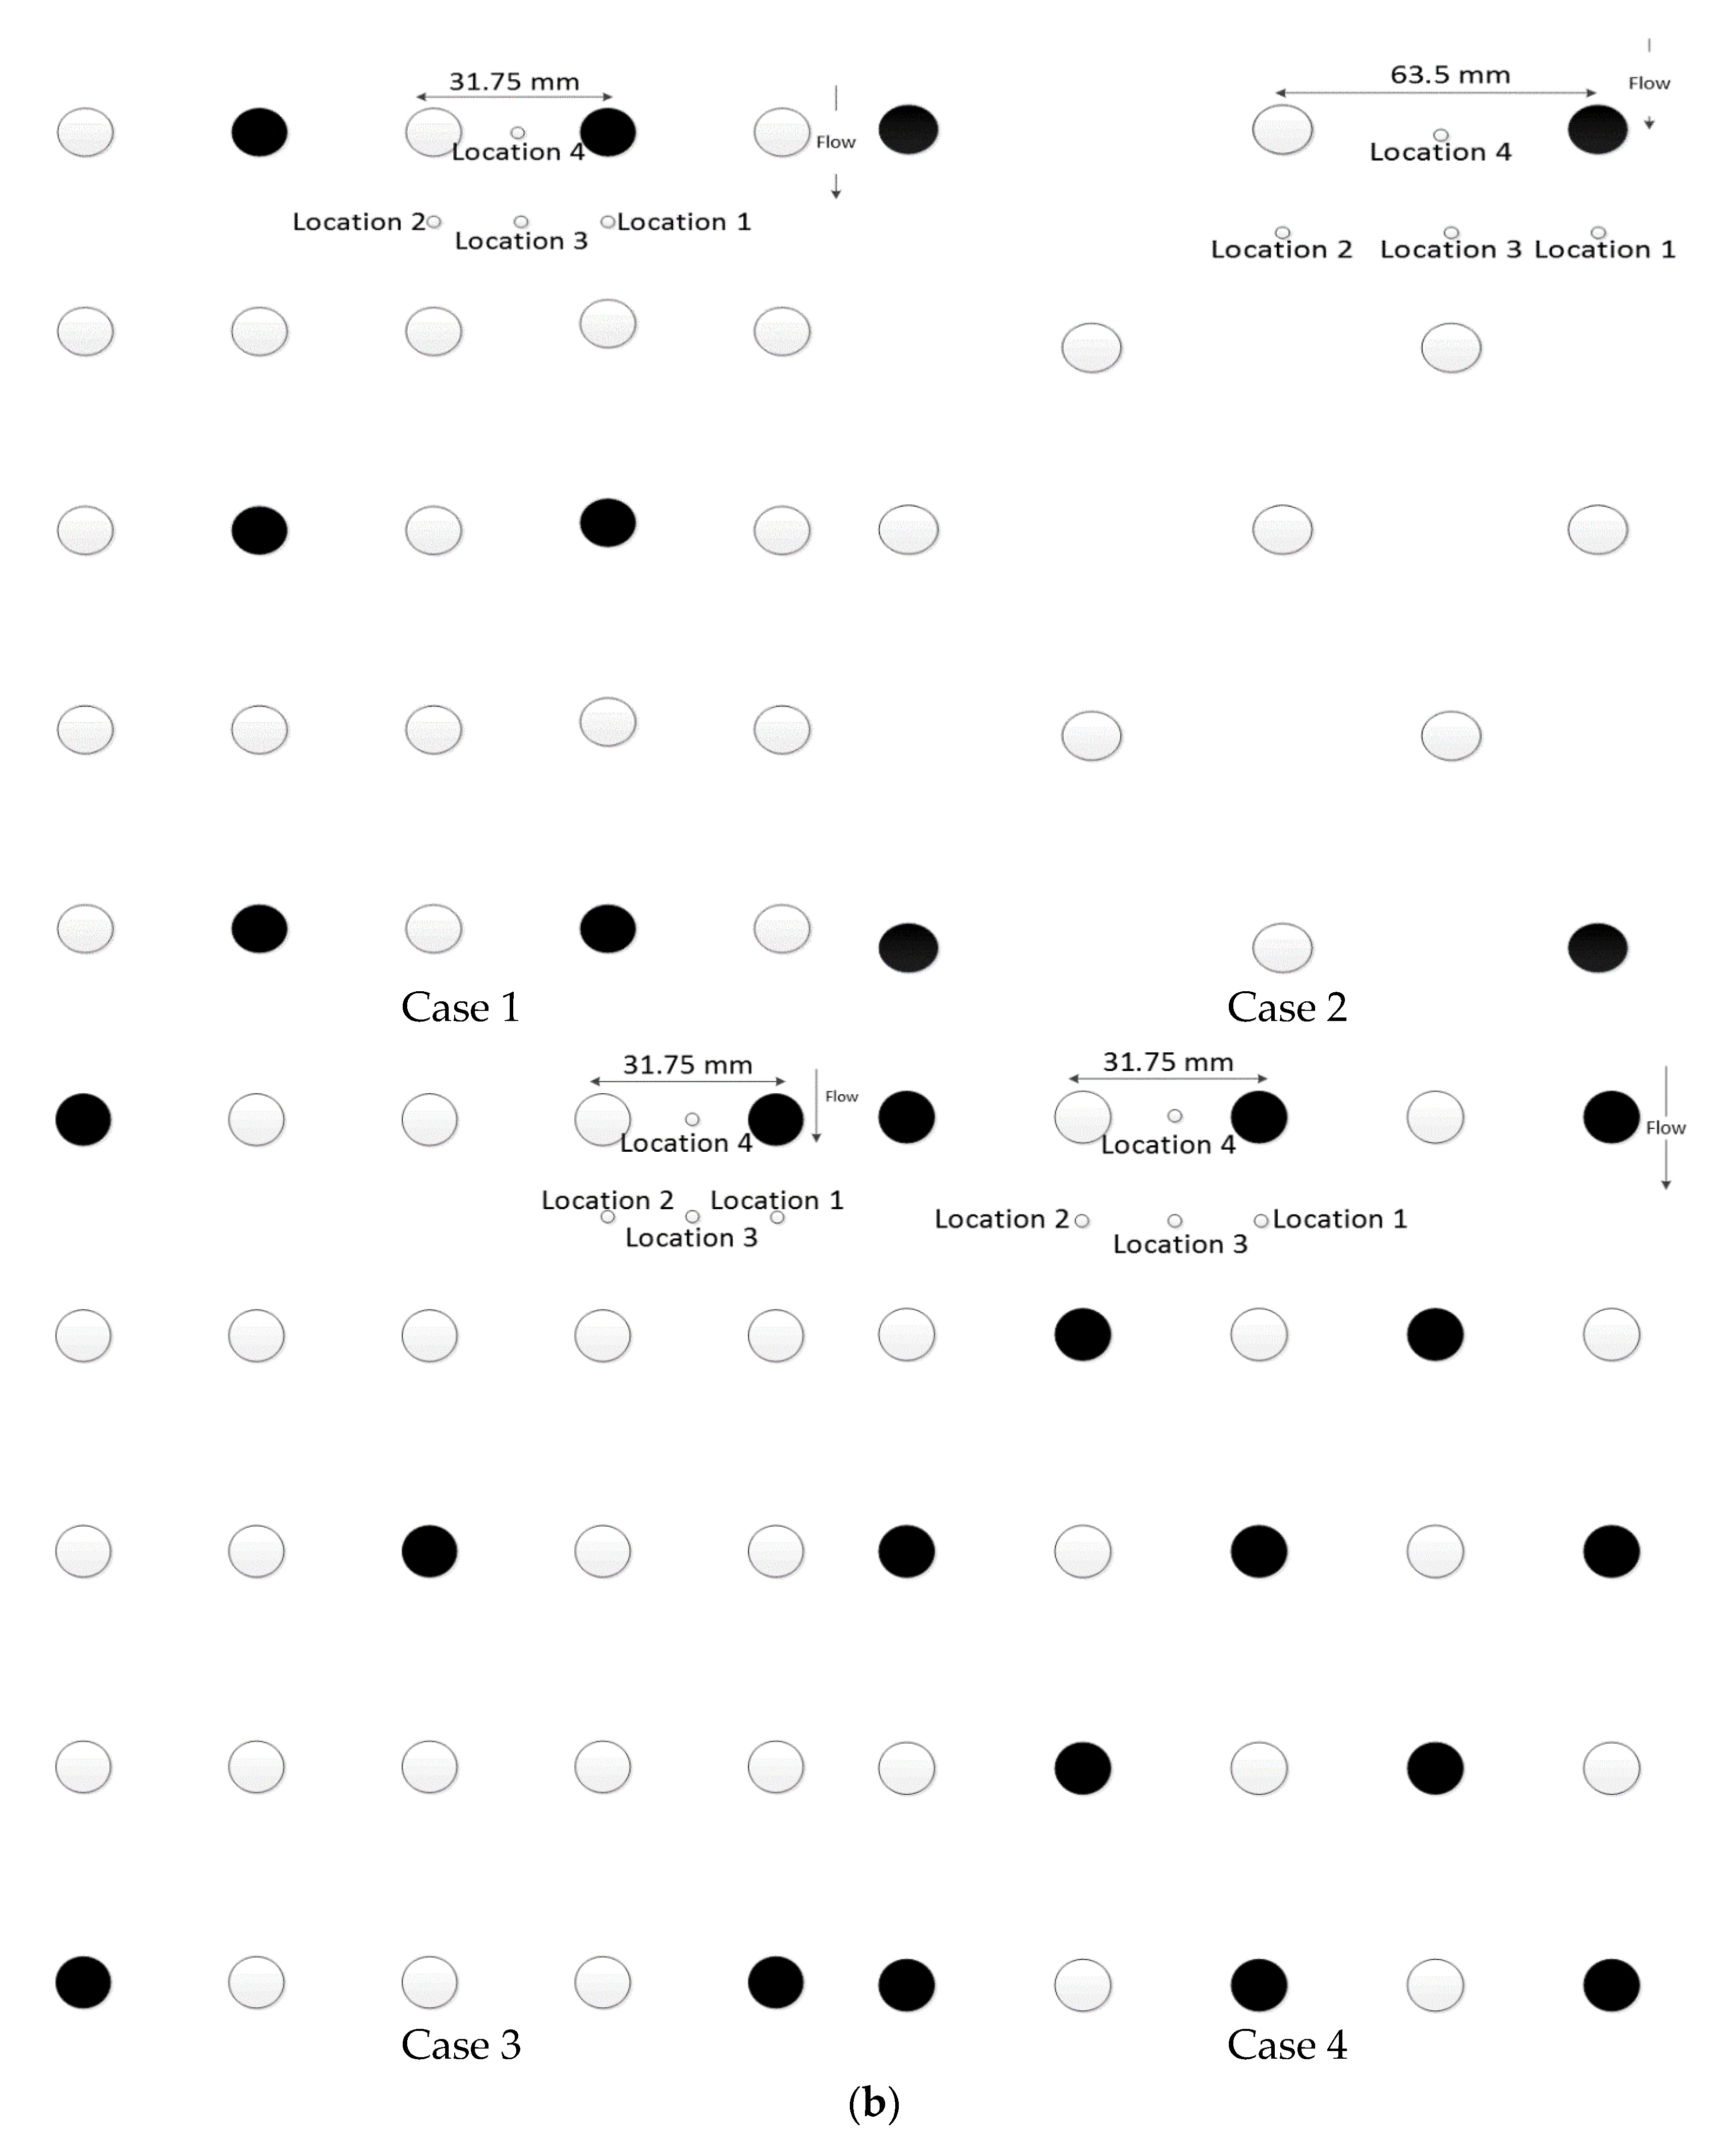
Experiments were conducted for four plans with different configurations and spacing (
Figure 1) in a 12 m length flume located in the Hydraulic Laboratory of the Nanjing Hydraulic Research Institute, with a width of 0.4 m and bed slope of 0.004 (m/m). While the bottom of the channel is made of concrete, the side walls are made of six adjacent glass panels to help visualize the flow. Generally, all the surfaces are hydraulically smooth. Water is pumped from a reservoir at the end of the channel, with a capacity of 3.5 m
3. A flowmeter installed in the inlet pipe monitors the flow of inlet discharge. During the experimental tests, an adjustable tailgate is located downstream of the channel to set the flow depth (H). In addition, the flume inlet has an acceleration ramp and honeycomb diffusers to curb large-scale turbulent structures.
The experiments aimed to investigate the flow hydrodynamics through a double-layered vegetation arrangement in an open channel measuring 12 m in length and 0.4 m in width. The rigid layered vegetation consisted of tall cylinders (0.2 m) and short cylinders (0.1 m) with a diameter (d) of 0.635 cm. The vegetation was mounted on the channel bed at a distance of 4 m from the inlet. The cylinders were arranged in a staggered pattern with a spacing ratio of Ss/d = 5 and 10 (spacing between short-layer cylinders) and St/d = 10 and 20 (spacing between tall cylinders). In our model, flow rates of between 42.67 (L/s) and 44.12 (L/s) were recorded, and flow depths were between 18.5 (cm) and 18.9 (cm). In addition, 3D-flow velocity was measured using a down-looking Acoustic Doppler Velocimeter (ADV), with a cylindrical sampling volume (4 mm tall and 6 mm diameter) at around 5 cm below the transmitter and an accuracy of ±0.5% of measured value ± 1 mm/s. The sampling frequency was 200 Hz, and the sampling duration was 2 min (24,000 samples). The data set was collected with a limit correlation of 70% and a signal-to-noise ratio above 15 dB. The collected data were post-processed by WinADV to remove spikes. Furthermore, the gradient of free surface flow was measured by a point gauge with an accuracy of ±0.1 mm.
A non-dimensional parameter of
is used to identify the distribution of dowels, in which
and
represent the distance between two dowels’ centres and the diameter, respectively. The design of vegetation configuration also reflects that vegetation in natural channels is usually denser in the lower layer and sparser in the upper layer. In addition, taller vegetation often grows near the river bank, i.e., the wall of the channel in the experiment, and shorter vegetation would be observed more in the inner part of the channel [
2].
Table 1 shows the details of four cases uniquely designed to study the effect of vegetation density and different formations.
3. Numerical Modelling
In the present study, a two-equation
model is used, which accounts for the kinetic energy of large-scale eddies (
) and its dissipation (
) into small-scale eddies through a phenomenon called energy cascade [
20]. Experimental studies showed that standard
equations proposed by Launder and Spalding [
21] do not present the results validated by experiments where flow is highly strained (i.e., strong streamline curvatures). In addition, initial studies have shown that the realisable
k–
ε model outperforms all other
k–
ε model versions for several separated flow conditions and flows with complex secondary flow features [
22]. Therefore, in strong streamlined curvatures, the flow separates at dowel walls and secondary flow is generated behind them. Thus, choosing a realisable
k–
ε to account for Reynolds stresses in momentum equations is reasonable.
For the current simulation, a pressure-based segregated solver is used. Governing fluid equations are continuity and momentum equations in the x, y, and z directions.
The multi-phase VOF model used in this study has a fraction function φ that shows the volume fraction of each cell with the following conditions:
for a cell without fluid
for a cell full of fluid
for a cell containing fluid
The continuity equation of a system that includes
m fluids so that
represents the
m-th volume fraction can be written as:
where
can be defined as:
For each cell, all properties can be calculated by a volume fraction average of all liquids in the cell.
The properties obtained from Equation (3) can be used to obtain a single momentum equation. Equations (1) and (3) are used to obtain an algorithm for pressure–velocity coupling. A momentum partial differential equation is represented using Equation (4):
where
represent components of streamwise and lateral velocity and
and
represent fluctuating velocity in the
x and
y directions, respectively. Furthermore,
stands for pressure and
and
represent water density and viscosity, respectively. Moreover,
means gravitational acceleration and varies in the
x and
y directions depending on the slope of the channel. The final term in Equation (4) accounts for turbulent momentum transfer within the flow and is called Reynolds stress. Only by computation of this term can turbulent flows be solved numerically. Two general numerical methods to resolve turbulent flows are Reynolds-Averaged Navier–Stokes (RANS) and Direct Numerical Simulation (DNS).
The Direct Numerical Simulation (DNS) method necessitates the computation of all turbulent length scales, resulting in substantial computational costs. Alternative methods, such as Large Eddy Simulation (LES), can mitigate these costs. LES combines aspects of both DNS and Reynolds-Averaged Navier–Stokes (RANS) methods by resolving the larger scales of eddies through space filtering. While both DNS and LES methods still incur significant computational expenses, the approach used in this study employs the
k–
ε model. Based on a two-equation eddy viscosity approach, this model requires fewer computational resources and less time than direct methods. It is widely applicable in solving engineering problems. ANSYS-FLUENT software solves the transport equations for Turbulence Kinetic Energy (
k) and its dissipation rate using a semi-empirical model. Incompressible fluid flow is governed by the Navier–Stokes equations, which are coupled with transport equations (Equations (5) and (6)) to incorporate closure schemes. By employing these computational techniques, a comprehensive understanding of the flow behaviour can be obtained with reasonable computational efficiency. Shih et al. [
23] showed the modelled transport equations for
and
in a realisable
k–
ε model for transient incompressible fluid flow in the absence of buoyancy effects as:
where
represents fluid kinematic viscosity. The model constants
and
(Prandtl number for Turbulence Kinetic Energy) and
(Prandtl number for turbulent dissipation rate) have been established to ensure that the model performs well for specific flows, and they are 1.9, 1.0, and 1.2, respectively.
represents the generation of Turbulence Kinetic Energy due to mean velocity gradients, and it is solved using Equation (7) [
21]:
where
and
S represent turbulent viscosity and mean rate-of-strain tensor, respectively.
can be obtained by Equation (8):
Ultimately,
is solved using Equation (9) [
21]:
Note that in Equation (9), unlike in the standard
k–
ε model,
is no longer a constant, and its value in the absence of a rotating reference frame is calculated using a set of Equations (10) and (11) [
23]:
Once turbulent viscosity
is calculated using Equation (9), the Reynolds Stress term in the momentum transport equation can be computed using the Boussinesq approximation in Equation (12) [
23]:
Equations (1)–(12) are second-order partial differential equations; therefore, no analytical means exist to solve them. To solve these equations numerically using the Finite Volume method in ANSYS© Fluent, equations must be discretised [
24]. The general discretised form of transport equations is presented below:
where
represents a scalar, e.g.,
x velocity.
represents a diffusive coefficient that accounts for the diffusion of the scalar
in the fluid domain.
is a source term and accounts for the generation or dissipation of
. These terms are in the general form of Equation (13), which can be specified for each partial differential equation mentioned previously (refer to
Table 2):
The realisable
k–
ε model employed in this study demonstrates remarkable performance compared to other eddy viscosity models. It can capture various flow phenomena, including rotation, boundary layers subjected to adverse solid pressure gradients, separation, and recirculation around bodies such as cylinders. The explicit set of equations is discretised using a central differencing scheme, which guarantees second-order accuracy in space. This scheme is widely employed to represent the diffusion term in steady diffusion problems, ensuring a reliable and precise representation of the flow physics. The study effectively captures and analyses complex flow dynamics with enhanced accuracy and fidelity by utilising a realisable
k–
ε model and a central differencing scheme. For pressure velocity coupling, the SIMPLE (Semi Implicit Method for Pressure Linked Equation) method has been used here based on Patankar and Spalding’s algorithm [
25].
3.1. Geometric Modelling and Dimension of Computational Field
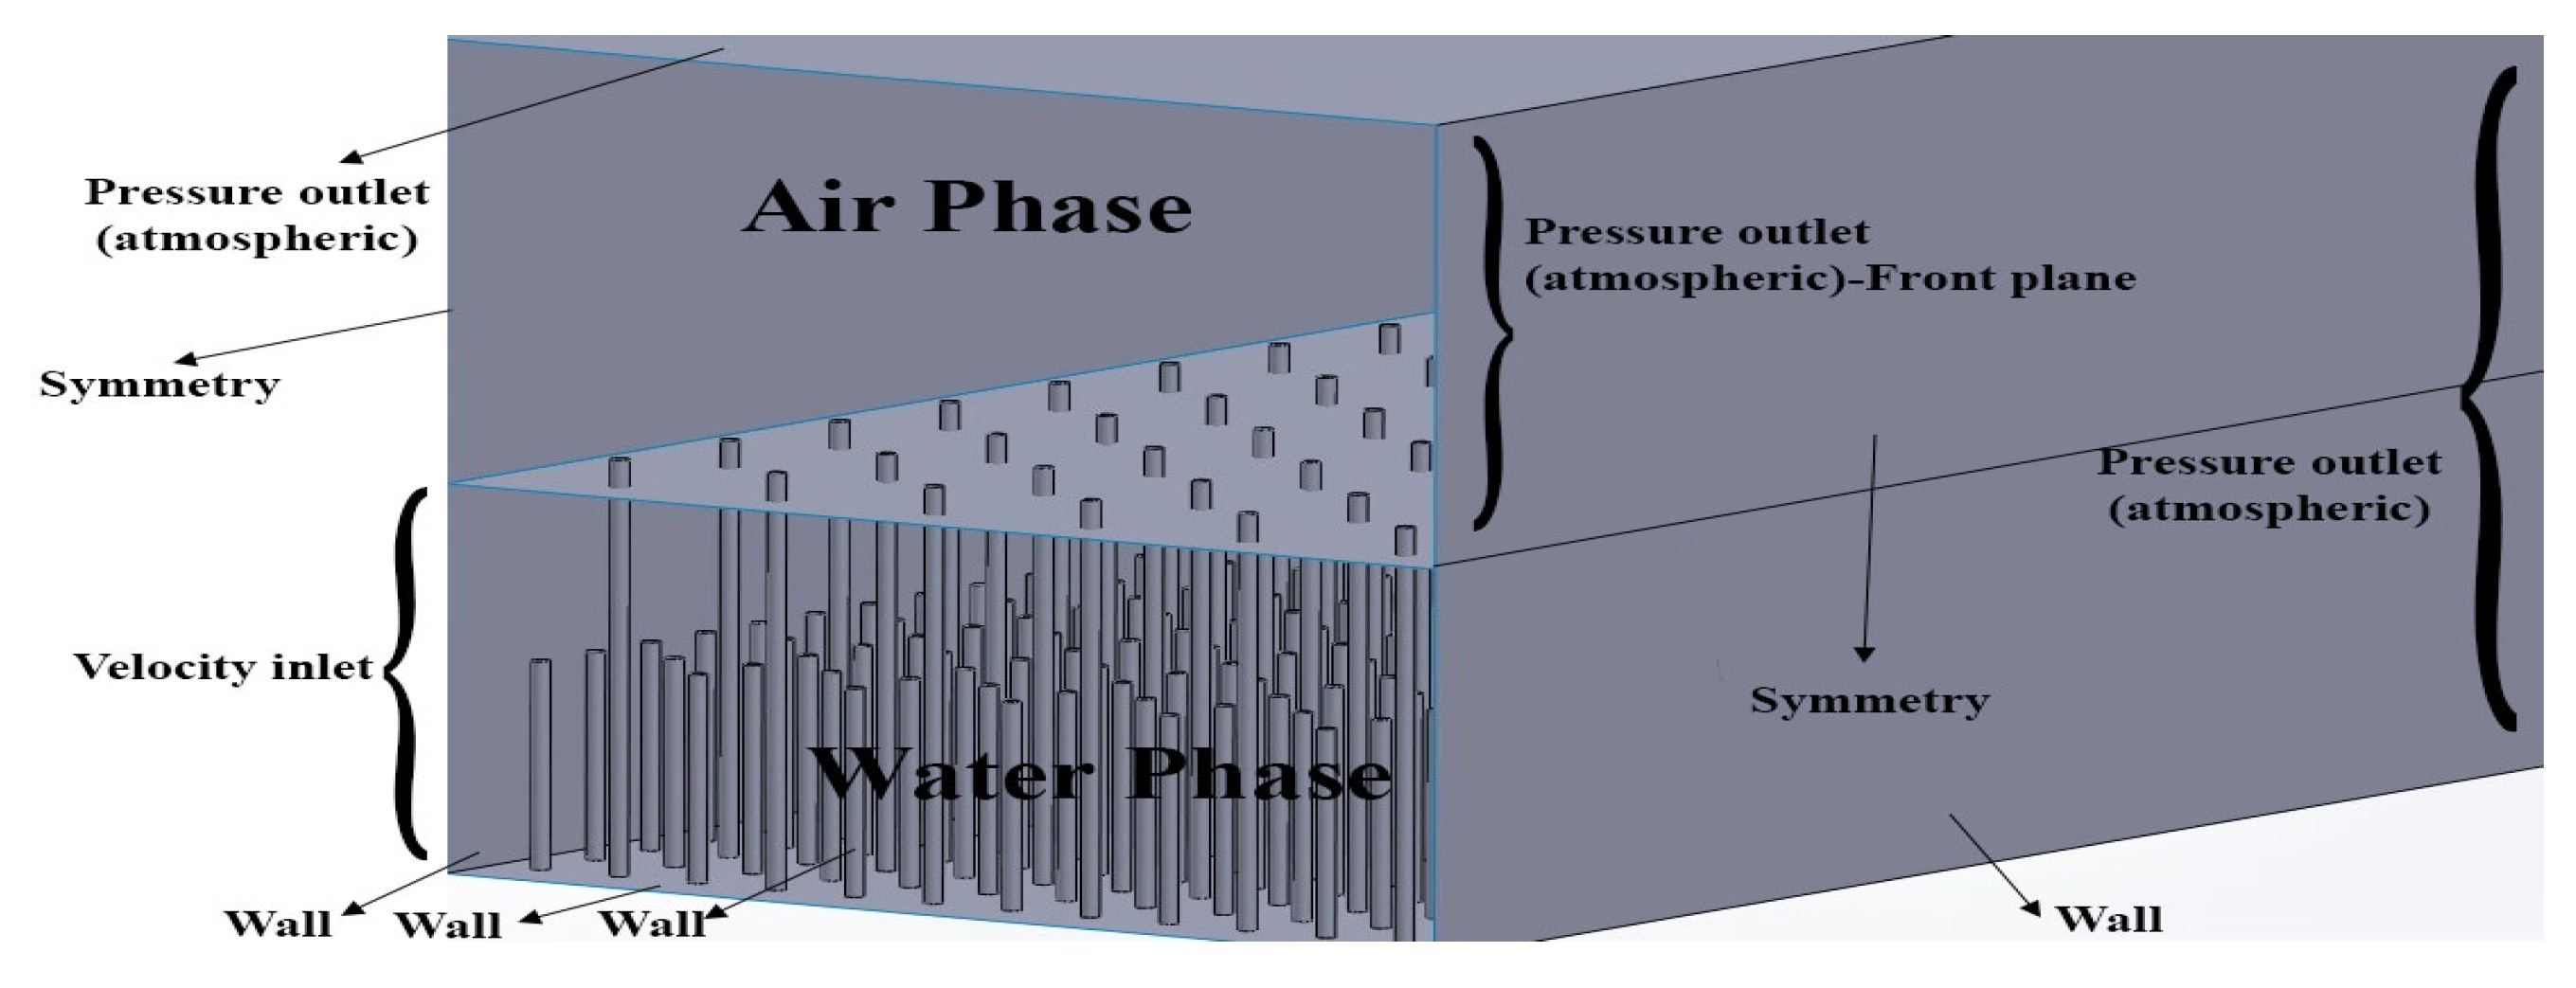
In the 3D modelling, the dimension of the channel is 12 m in length, 0.4 m in width, and 0.4 m in height. A vegetation section with a length of 7 m is located 3 m away from the beginning of the channel, and data are collected from a cross-section located 6.5 m away from the beginning of the channel (middle of vegetation plane). Six or seven locations have been defined for each plan to cover the flow behaviour in different regions with different types of dowels. Four boundary conditions used here are (a) velocity inlet (inflow boundary), (b) pressure outlet (outflow boundary), (c) symmetry, and (d) wall.
Figure 2 shows the boundary conditions applied in the software.
Moreover, the simulation incorporates a multi-phase model known as the Volume of Fluid (VOF) method in the present case. An implicit open channel model is employed, necessitating modifications to the boundary conditions for multi-phase parameters. Consequently, the volume fraction of the water phase is set to 1 at the inlet to represent the presence of water, while at the outlet it is set to 0 to indicate the absence of water. To ensure numerical stability and accuracy, certain parameters are adjusted. The volume fraction cutoff is set to a value of 1 × 10⁻⁶, which determines the threshold for considering a cell as either water or air. Additionally, the Courant number, a dimensionless parameter governing time step size and mesh size, is set to 0.25, ensuring stability in the simulation. By incorporating these adjustments, the simulation effectively captures multi-phase behaviour in an open channel flow scenario, providing reliable and accurate results.
3.2. Numerical Validation
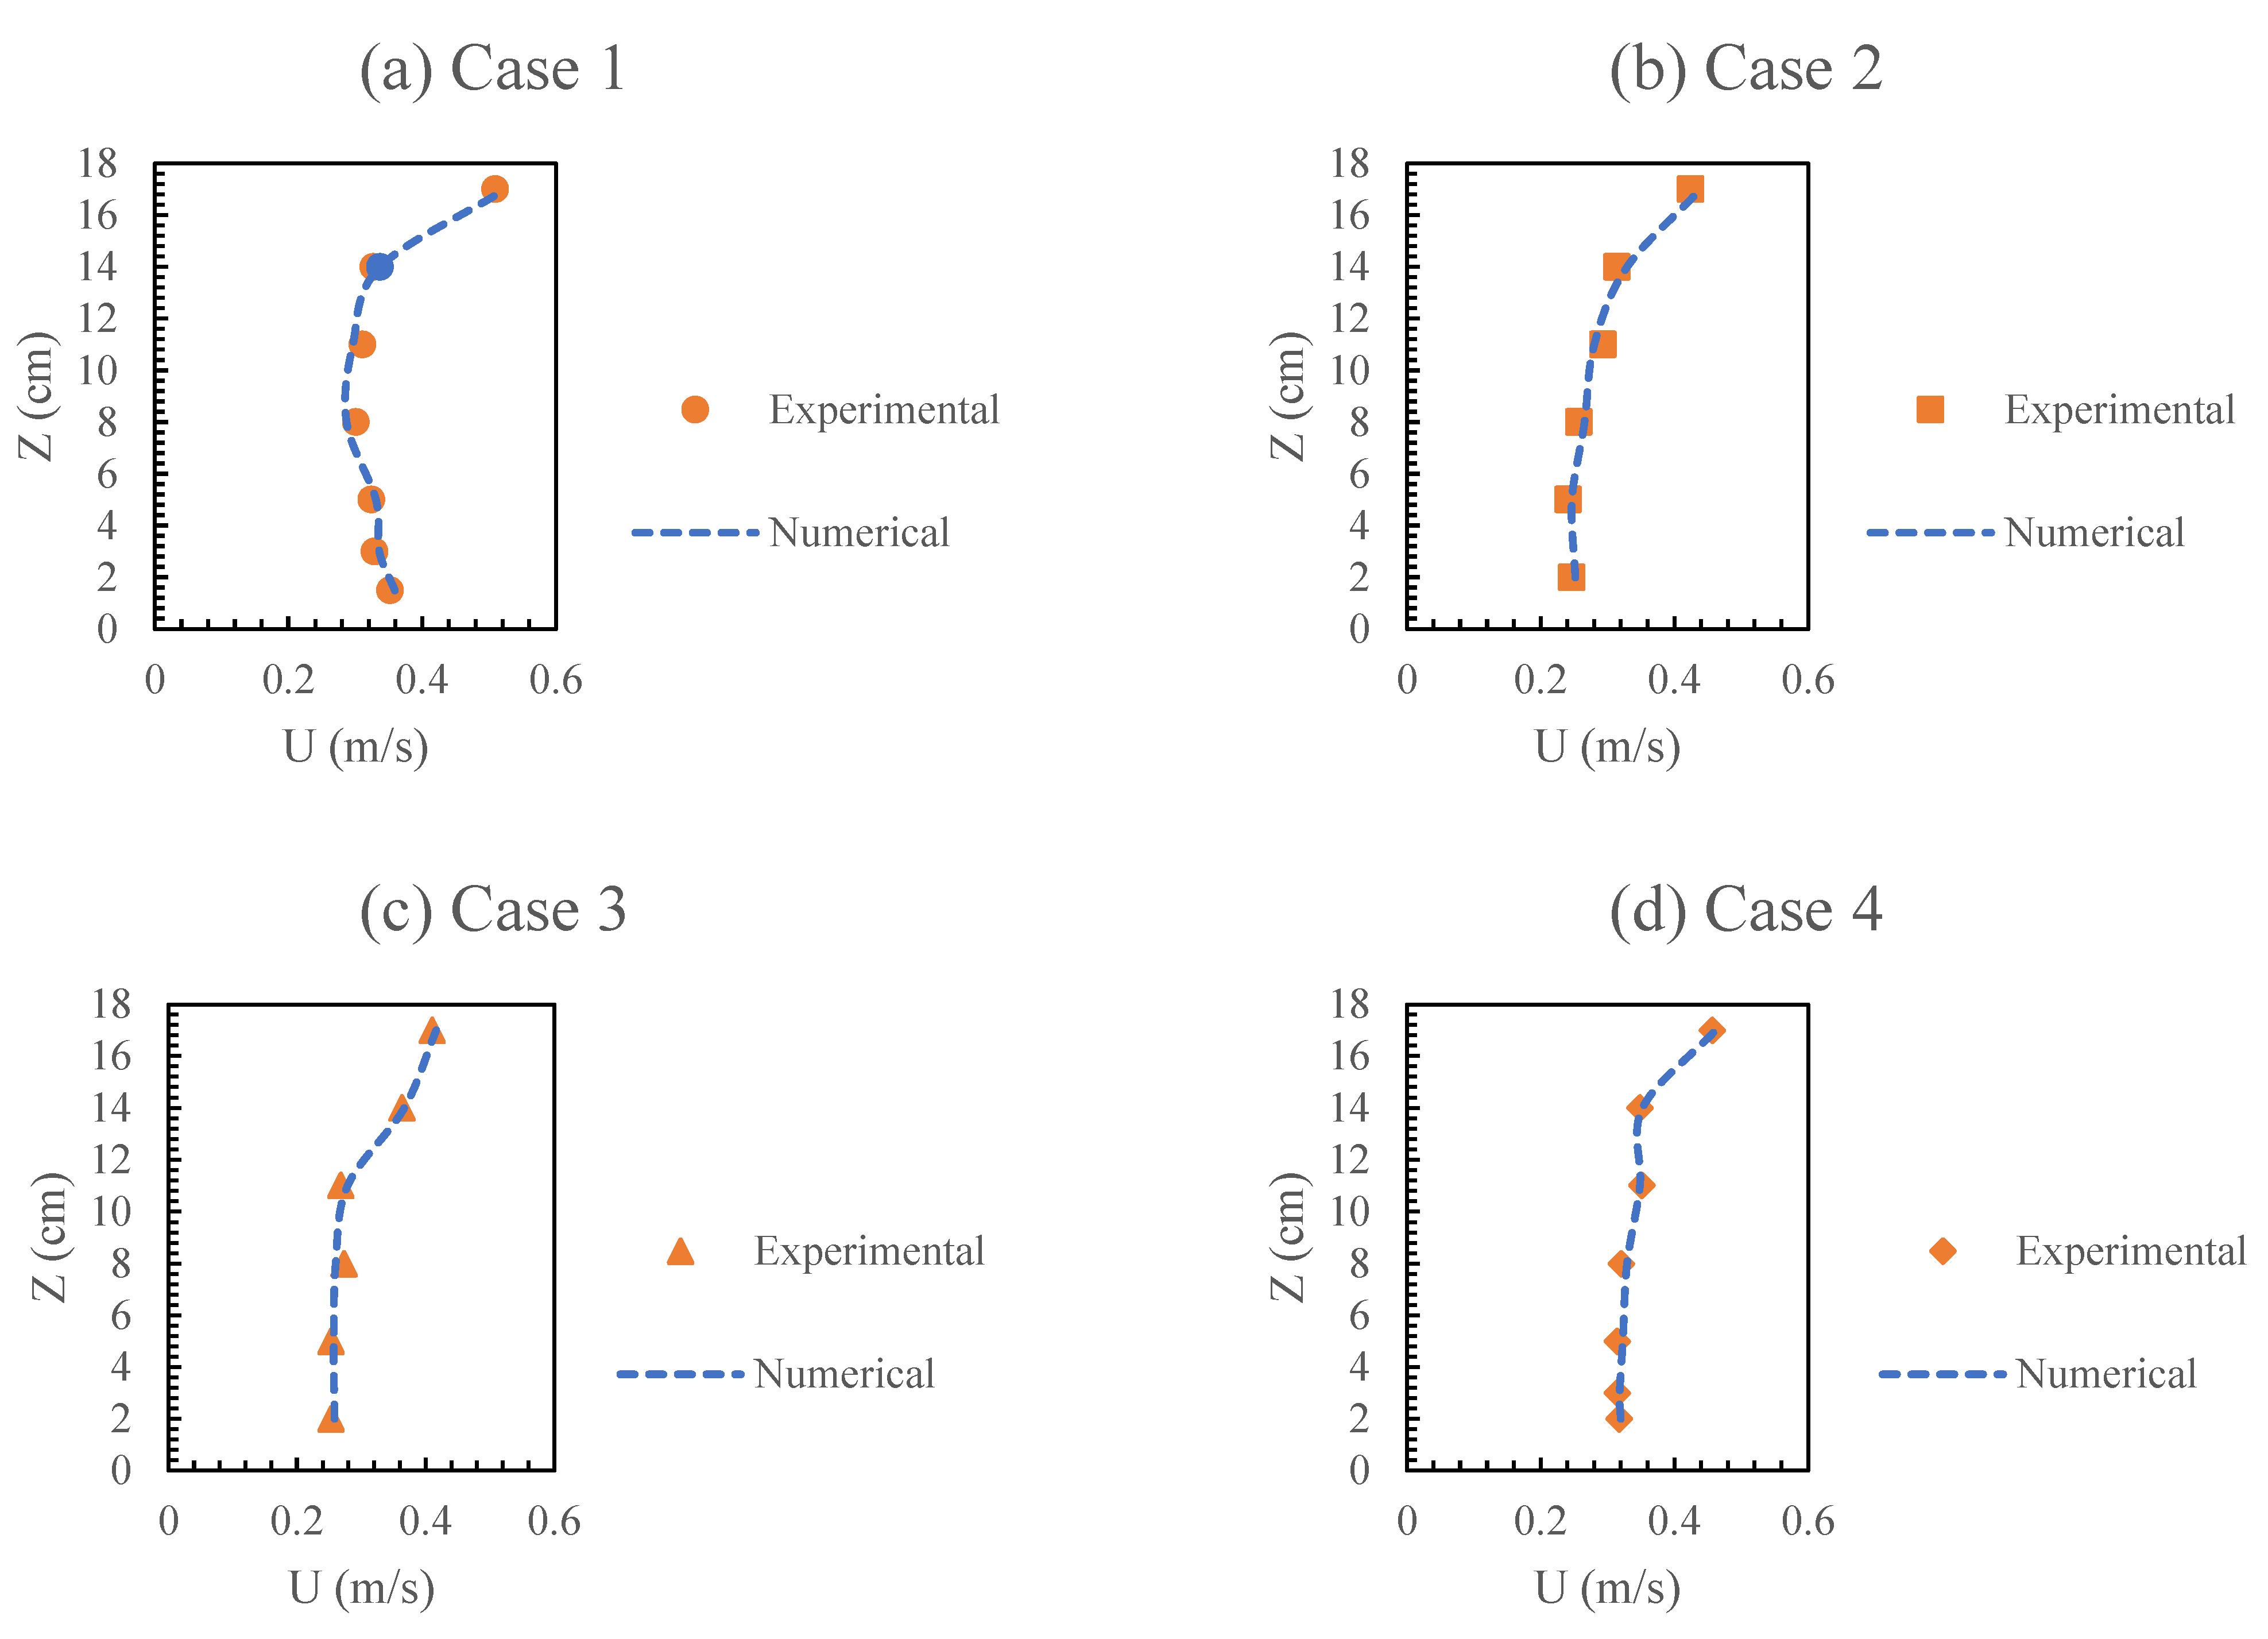
The distribution of average velocity over different locations for four cases of double-layered vegetation is validated and shown in
Figure 3. The results show that the flow behind the dowels is very unstable, with substantial mass and momentum exchange occurring over this region, which is also supported by [
13,
14]. As depicted in
Figure 3, numerical simulation results successfully capture the inflexion point near
z = 10 cm in the region behind the dowels. This indicates that the numerical approach accurately captures the mixing region. Furthermore, the numerical model accurately reproduces all the inflexion points, with only a slight underestimation of approximately 3.5%. This validation demonstrates the capability of the numerical model to simulate other formations and spacing, providing a comprehensive database. Such a comprehensive database will be instrumental in identifying trends and inflexion points at different depths, aiding in understanding flow behaviour in various vegetation configurations [
13].
Numerical model validation was conducted using data from the flume experiments performed by [
5], described in
Section 2. For numerical computations, the modelled domain comprised a periodic length of the vegetation arrangement, as shown in
Figure 2. The simulated results of the vertical distribution of longitudinal velocities at specific locations were compared with the corresponding experimental data, as illustrated in
Figure 3. The x-axis represents the vertical distribution of longitudinal velocities (m/s), while the y-axis represents flow depth (cm). The comparison between the experimental and numerical results demonstrates close agreement, thereby confirming the validity of the numerical model. However, a minor discrepancy of approximately 3% on average between the experimental and numerical results is observed, which could be attributed to simplifications in the modelling approach or inherent measurement errors associated with ADV.
4. Results
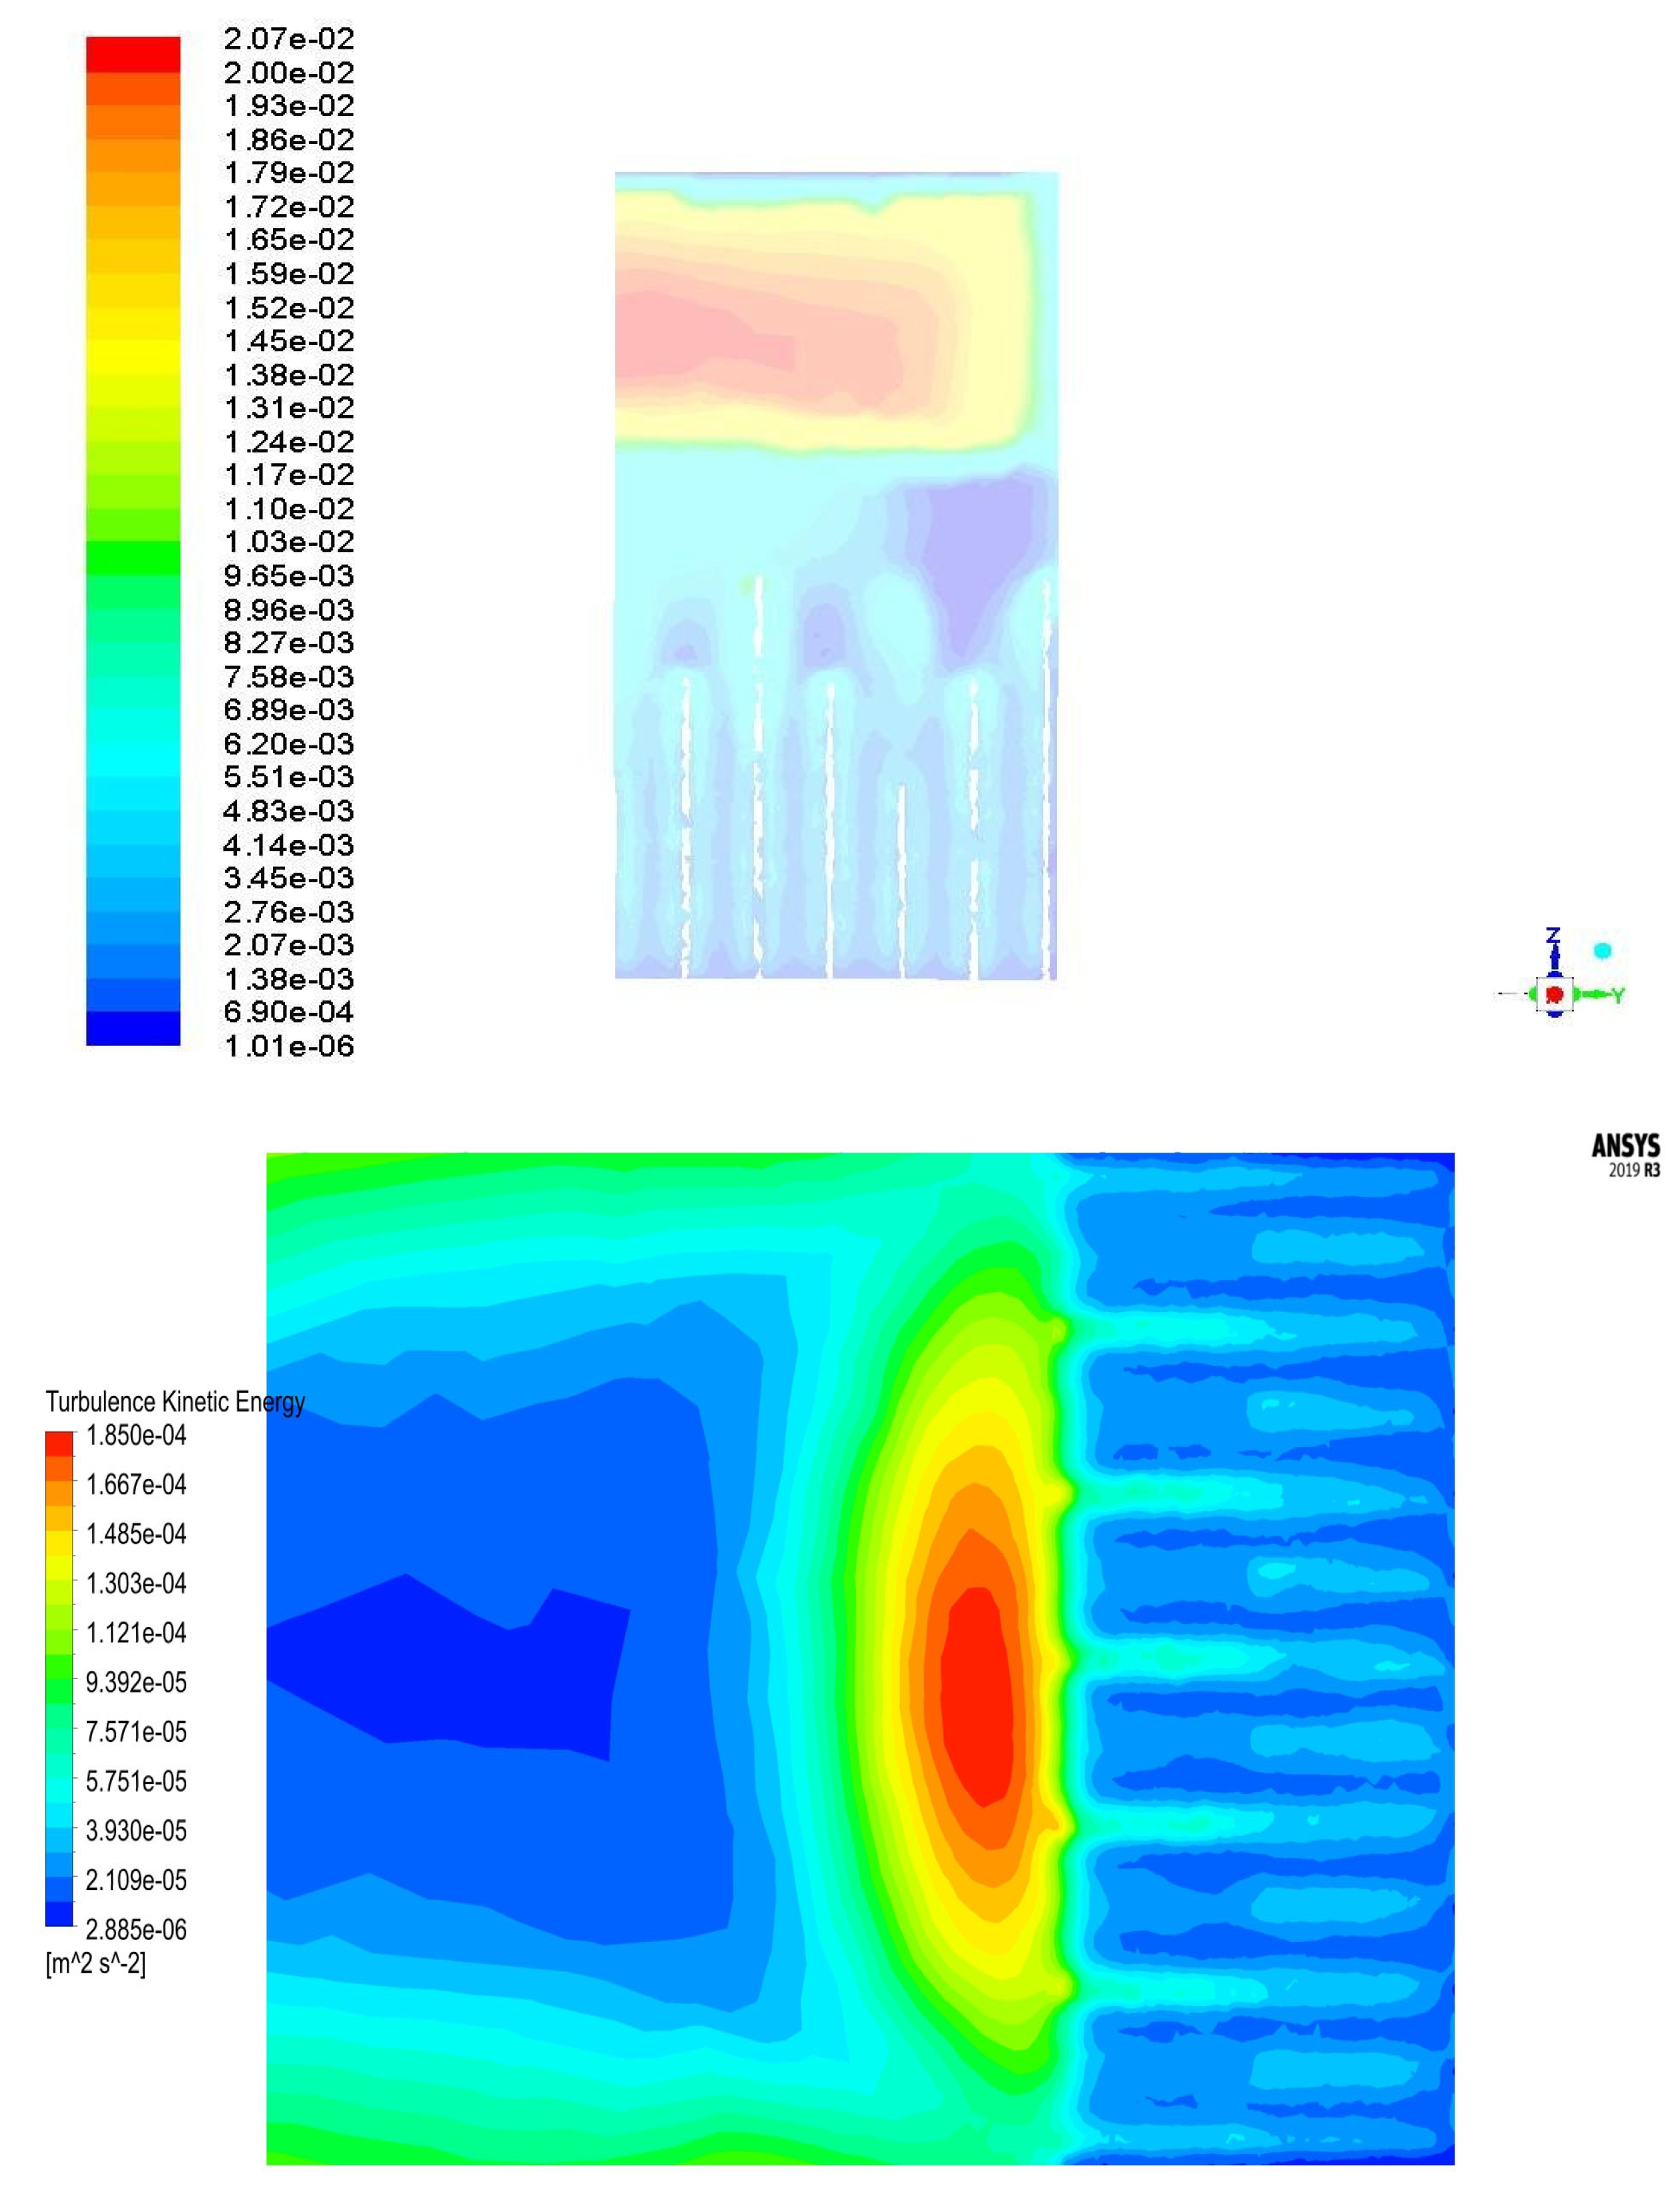
Figure 4 shows the contours of Turbulence Kinetic Energy in two different views in a defined cross-section. More flow details have been plotted in
Figure 5,
Figure 6,
Figure 7 and
Figure 8 based on the various locations.
In analysing the flow–dispersion interaction, Turbulence Kinetic Energy (TKE) is important in determining the turbulent dispersion coefficient and, thus, mass transport. The turbulent dispersion coefficient may be written as the product of length and velocity scales.
Turbulence Kinetic Energy (
TKE) can be defined as:
where
is the water density and
and
are velocity fluctuations in the
x,
y, and
z directions.
Namely, considering the production of Turbulence Kinetic Energy as the sum of wake and bed shear production terms, Nepf [
26] noted that, in the emergent case, the bed shear production is negligible over almost all the flow depth, apart from the zone very close to the bed. Consequently, Turbulence Kinetic Energy dissipation and wake production balance over practically all the flow depth, apart from the location close to the bottom. In the submerged case, shear at the top of the vegetation could provide an important source of turbulence. Nevertheless, Nepf and Vivoni [
27] proved that wake production is of the order of turbulence dissipation for shallow depth ratios, especially inside vegetation.
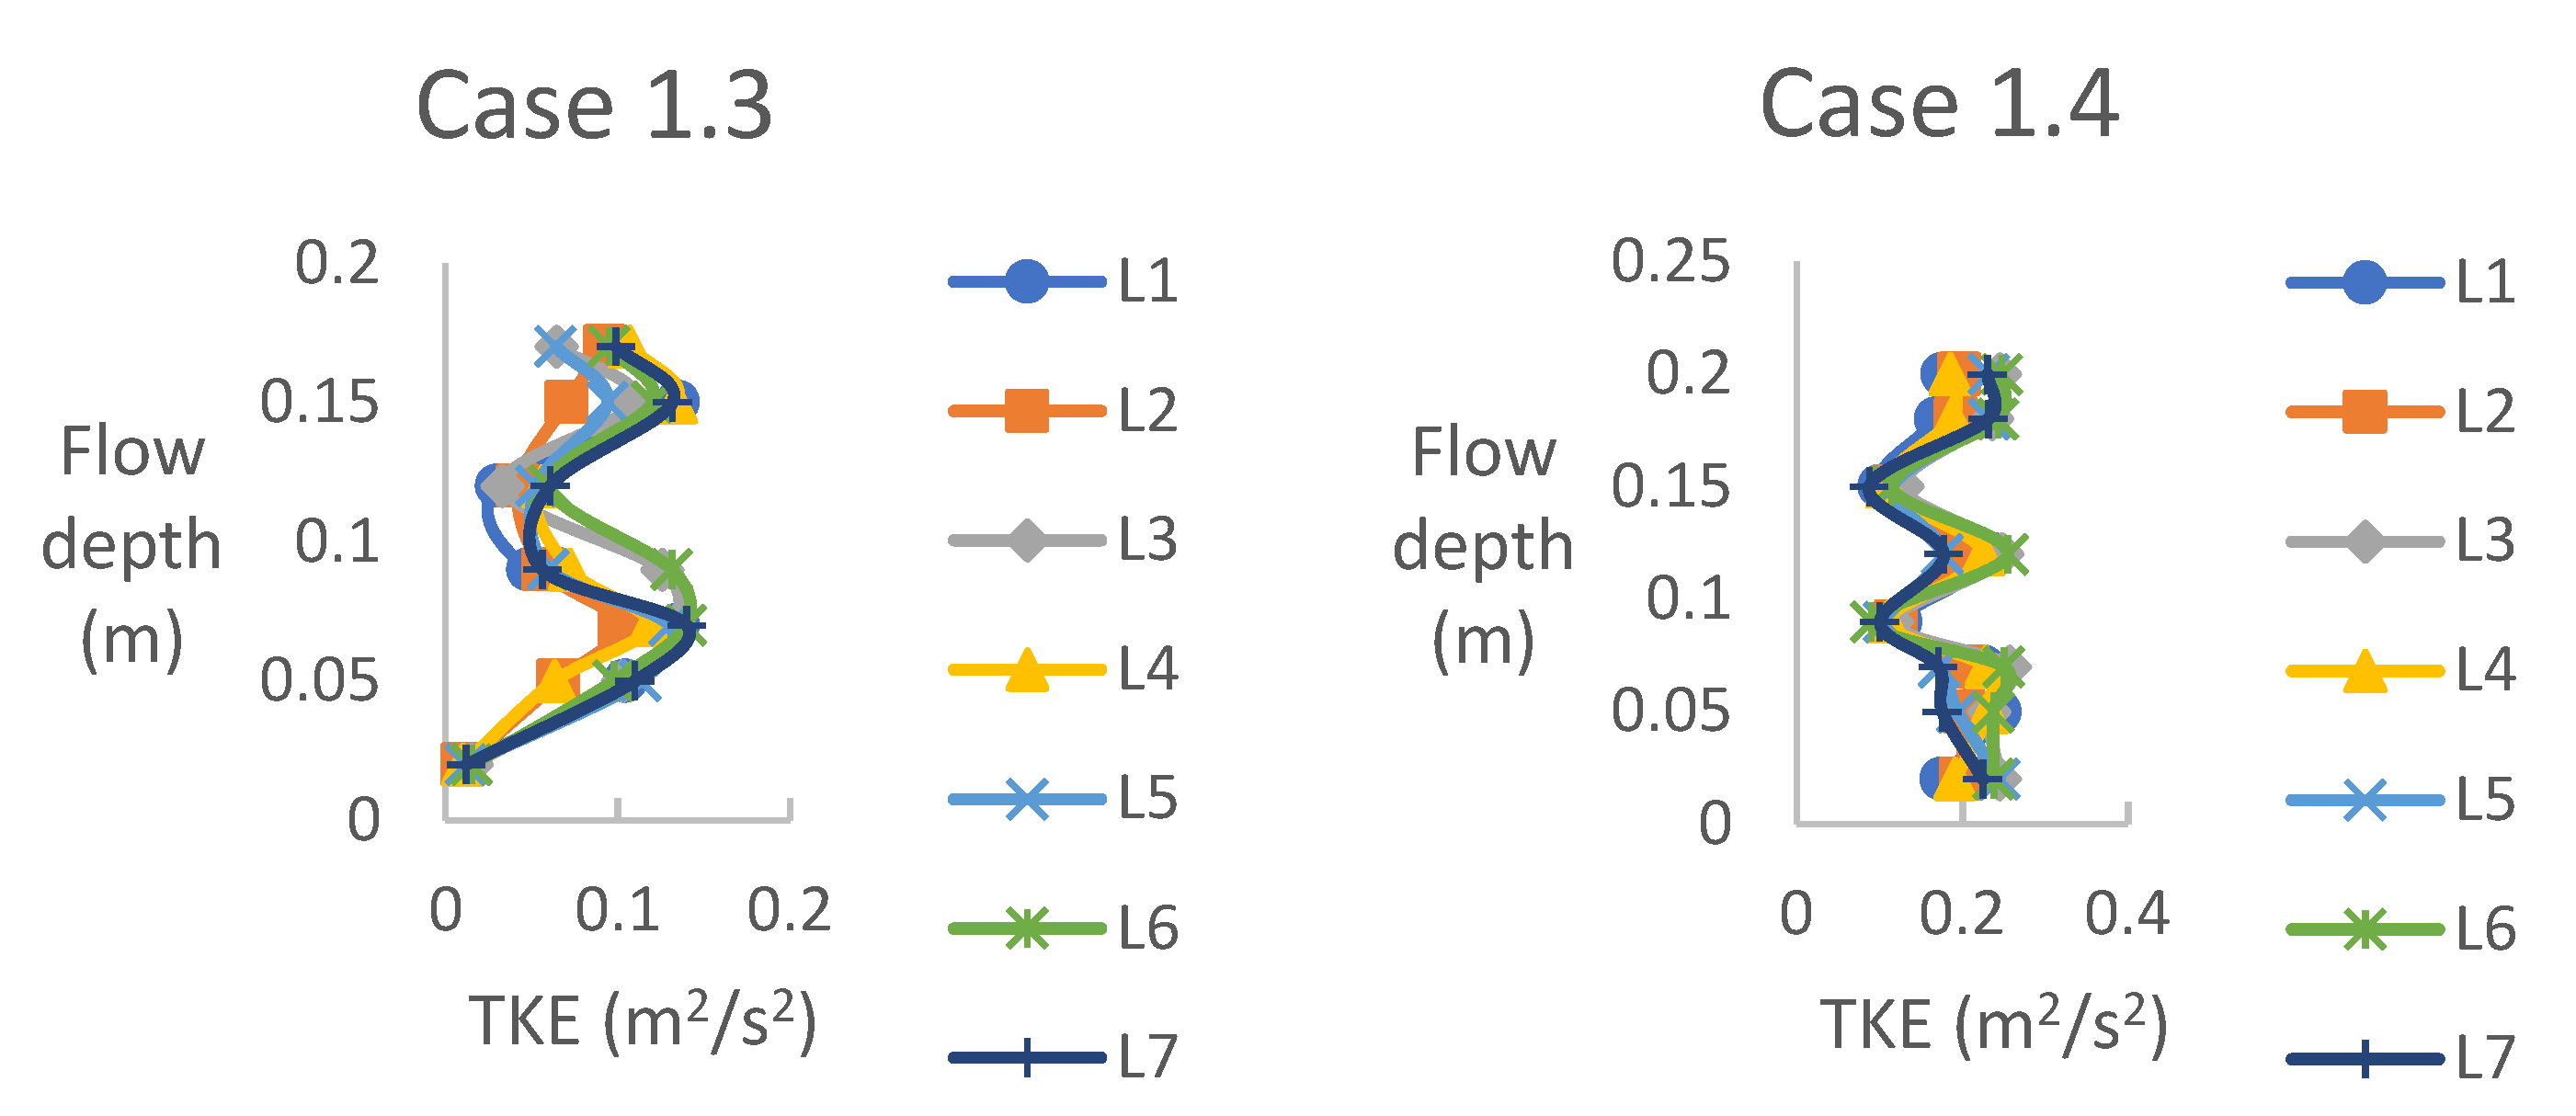
Figure 5 presents the Turbulence Kinetic Energy values for case 1, wherein short and tall dowels were arranged linearly. The observed trends closely resemble those observed for Reynolds stress. In the lower flow depth region (
z < 0.05 m), Turbulence Kinetic Energy remains relatively constant and experiences an increase near the edge of the short vegetation. For the lower flow depth, cases 1.1 and 1.2 in
Figure 5, TKE is negligible until
z < 0.05 m, depicting inflection with a high flow gradient above shorter vegetation. Conversely, in the higher flow depth region, Turbulence Kinetic Energy exhibits an initial increase from the onset of the trend, followed by pronounced fluctuations (refer to
Figure 5).
Figure 5 illustrates that the areas behind the taller dowels exhibit the highest Turbulence Kinetic Energy values. This occurrence can be attributed to heightened momentum exchange within that region, likely resulting from stem–wake turbulence. The manifestation of such turbulent phenomena contributes to the elevated Turbulence Kinetic Energy levels observed in those locations.
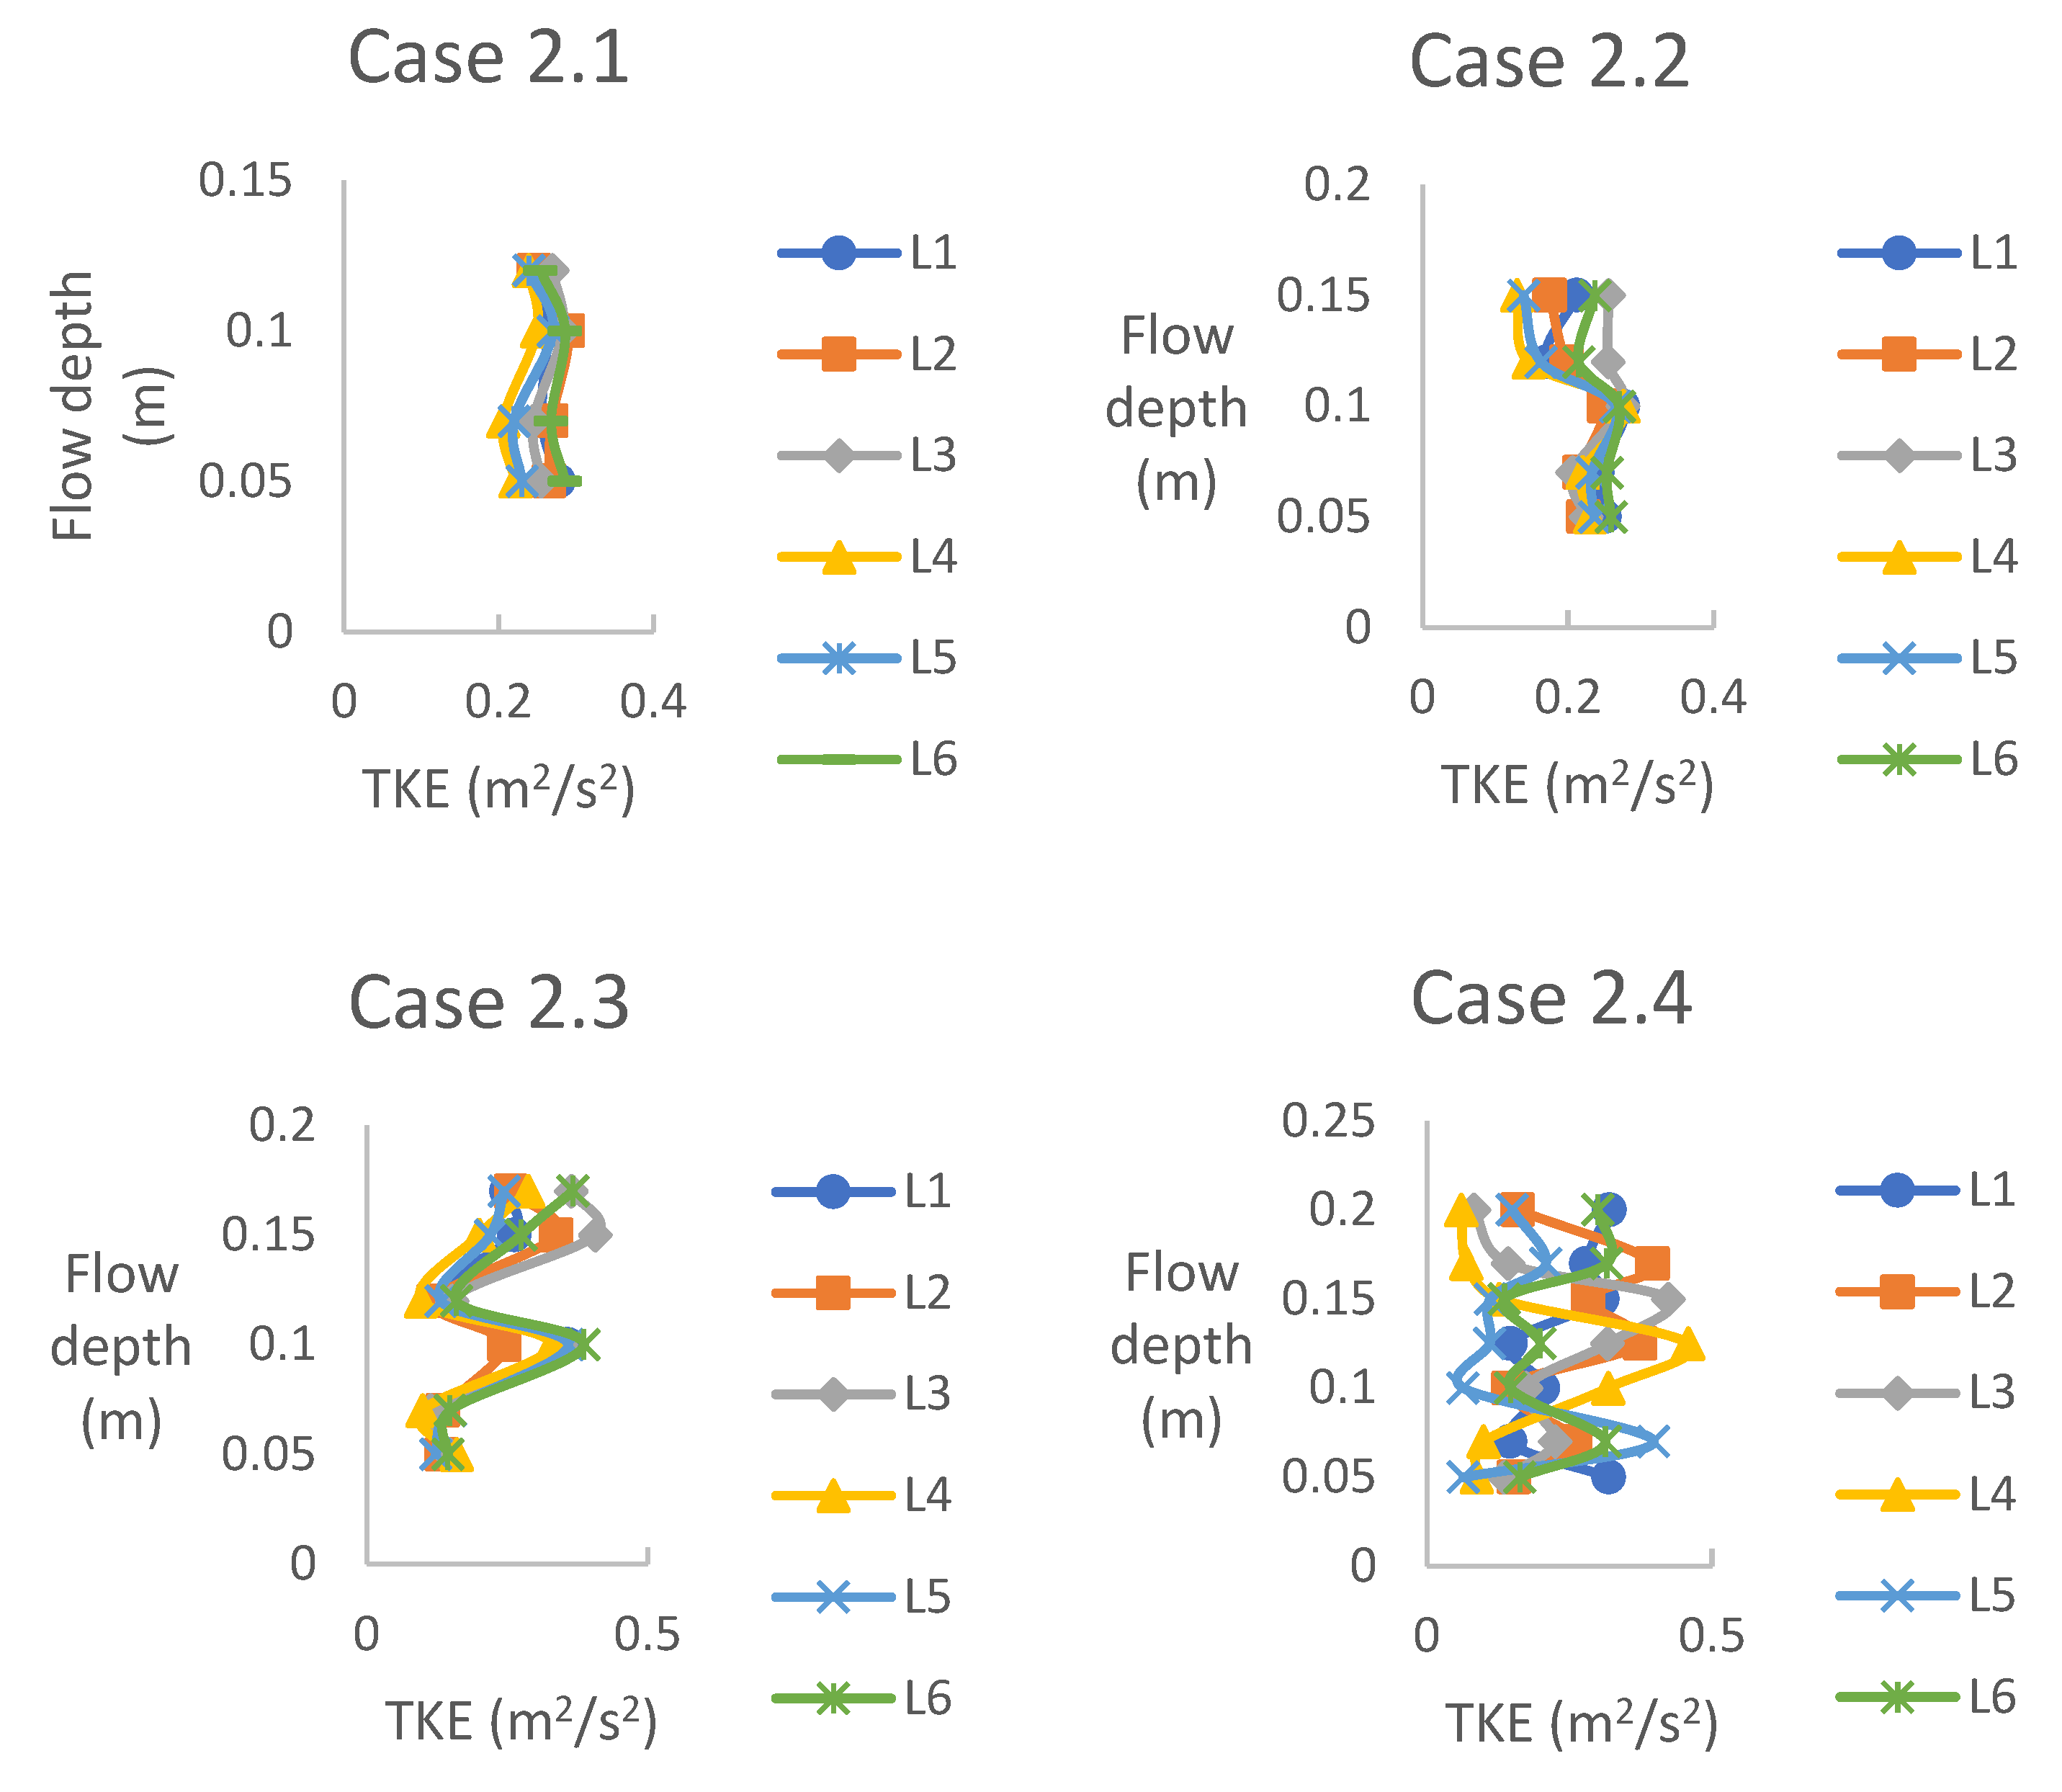
In the experiments conducted for case 2 across various flow depths, the observed Turbulence Kinetic Energy values were consistently higher compared to other formations. Turbulence Kinetic Energy exhibited an increasing trend with increasing flow depth, reaching its peak values under fully submerged conditions, specifically in experiment 2.4. The Turbulence Kinetic Energy profile for submerged cases revealed that higher Turbulence Kinetic Energy levels were observed within the vegetation-free upper and lower layers (see
z < 0.05 m,
Figure 6). Similarly,
Figure 6 illustrates that Turbulence Kinetic Energy within the vegetation-free upper layer demonstrated larger magnitudes for higher flow depths (refer to cases 2.3 and 2.4 in
Figure 6). However, the Turbulence Kinetic Energy (TKE) profile within the lower layer exhibited slightly lower values than in the vegetation-free layer. These findings highlight the influence of flow depth on Turbulence Kinetic Energy distribution, indicating that greater flow depths contribute to elevated Turbulence Kinetic Energy levels in the upper layer while the lower layer experiences slightly reduced Turbulence Kinetic Energy magnitudes.
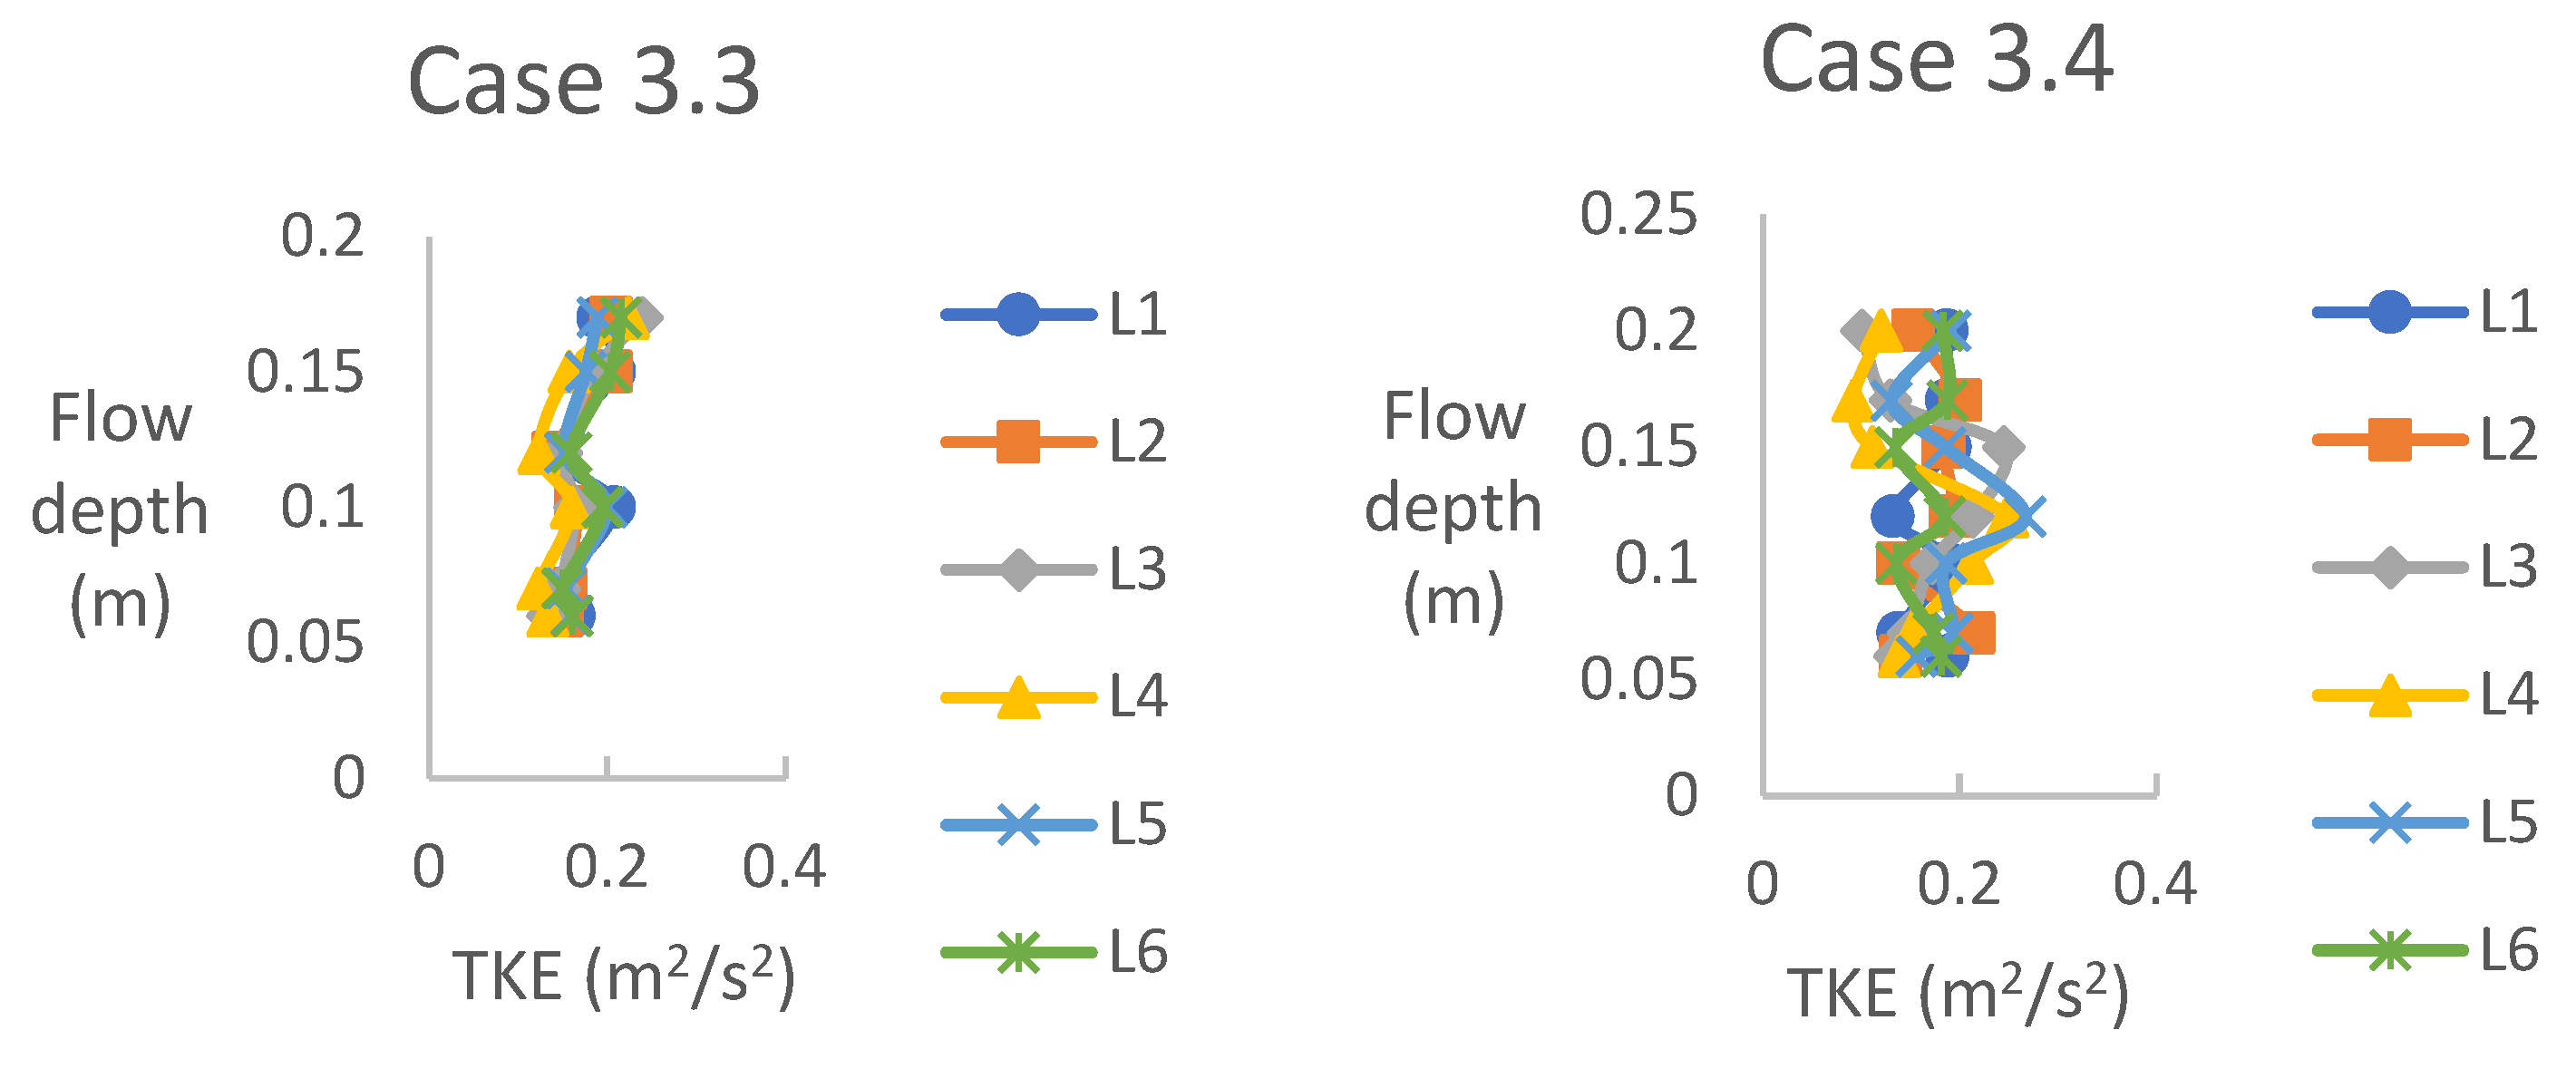
Figure 7 shows the distribution of Turbulence Kinetic Energy (TKE) for case 3 across four distinct flow depths. Notably, all four experiments reveal that Turbulence Kinetic Energy values are lowest in the free regions within the channel. Specifically, experiments 3.2 and 3.3 exhibit a distinctive “S” shape in their Turbulence Kinetic Energy profiles, with varying magnitudes. In experiment 3.1, Turbulence Kinetic Energy initially increases from the channel bed to the height of the short vegetation before gradually decreasing towards the water surface. The observed Turbulence Kinetic Energy variations can be attributed to the energy budget associated with the flow through the vegetation. As per this budget, all the energy extracted from the mean flow due to plant drag manifests as Turbulence Kinetic Energy, contingent upon factors such as vegetation density and submergence ratio. These findings underscore the intricate relationship between vegetation characteristics and the resulting Turbulence Kinetic Energy distribution within the flow.
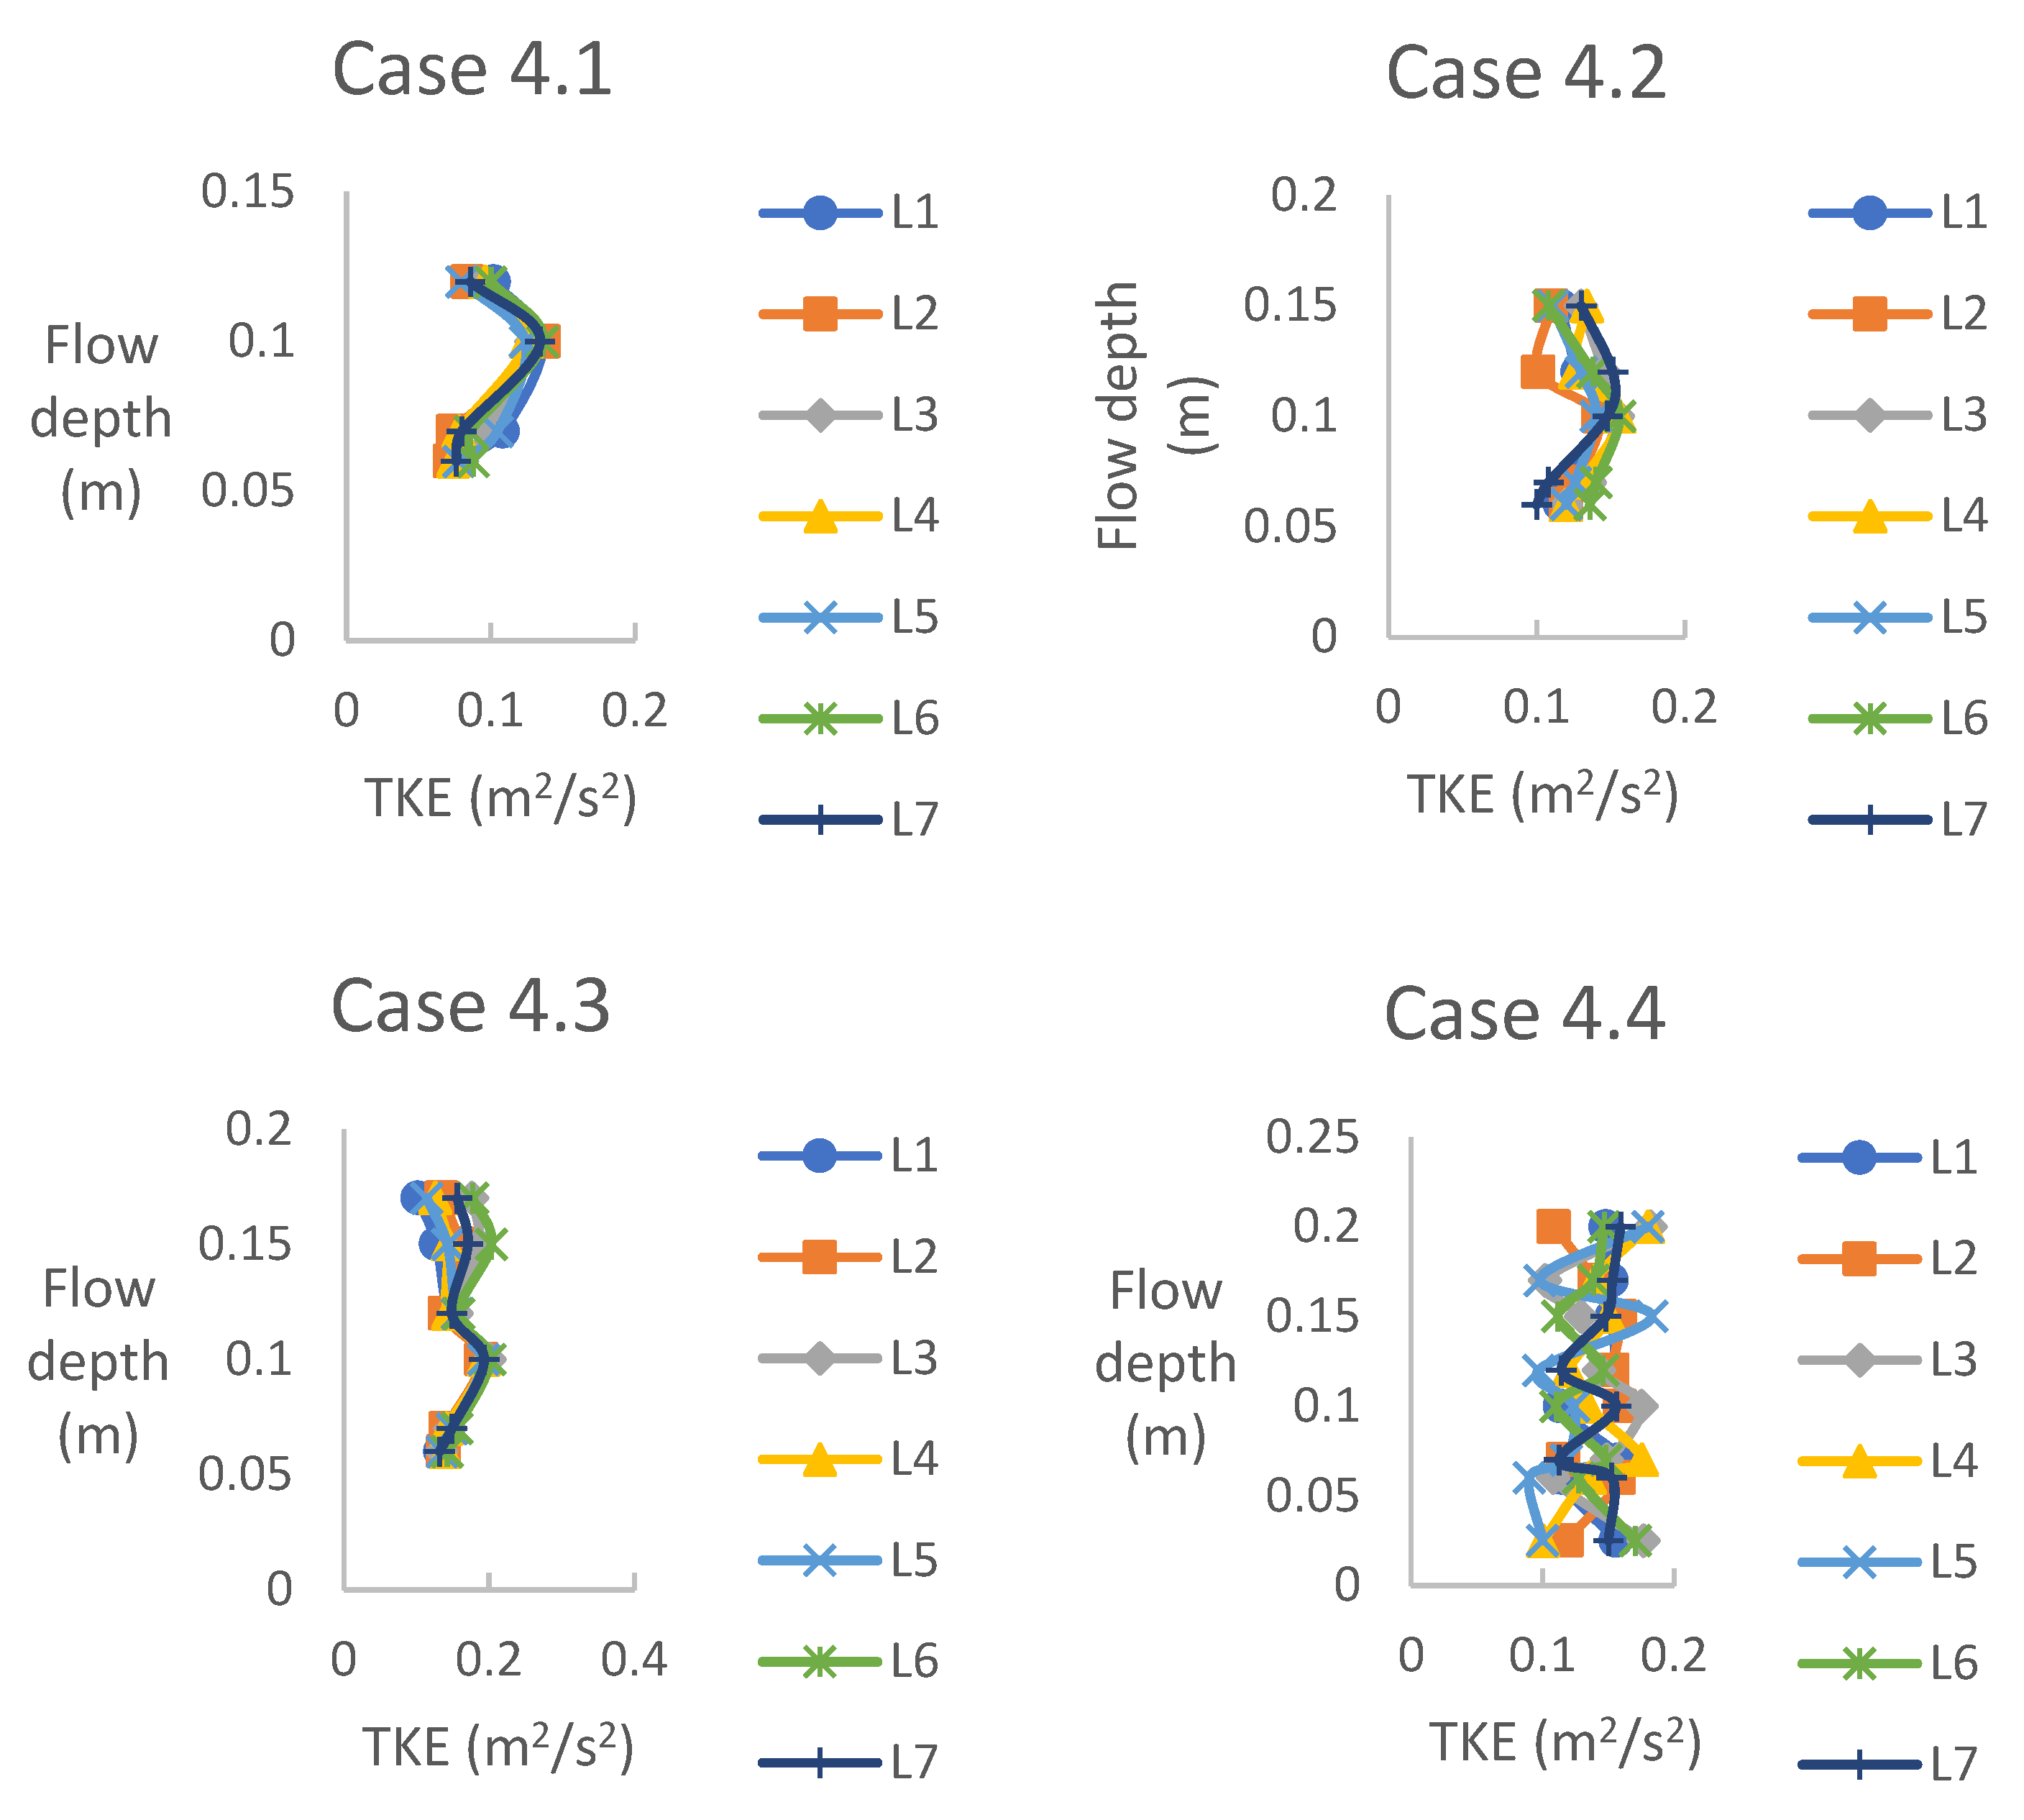
Figure 8 shows Turbulence Kinetic Energy (TKE) values for case 4, wherein a staggered formation of both short and tall dowels was employed. The experiments encompassed four distinct flow depths, with experiments 4.1, 4.2, and 4.3 representing half-submerged conditions, while experiment 4.4 simulated a fully submerged condition. Similar to the experiments conducted in other cases, experiment 4.4 exhibited irregular fluctuations and did not exhibit a coherent trend across all locations. In contrast, the other three experiments conducted at lower flow depths demonstrated an initial increase in Turbulence Kinetic Energy, followed by a subsequent deduction. The observed Turbulence Kinetic Energy behaviour highlights the influence of flow depth on turbulence dynamics within the staggered vegetation arrangement.

