
Assessment of Heavy Metal Contamination in Beach Sediments of Eastern St. Martin’s Island, Bangladesh: Implications for Environmental and Human Health Risks


 , , ,
, , ,  ,
, 
Abstract
1. Introduction
2. Materials and Methods
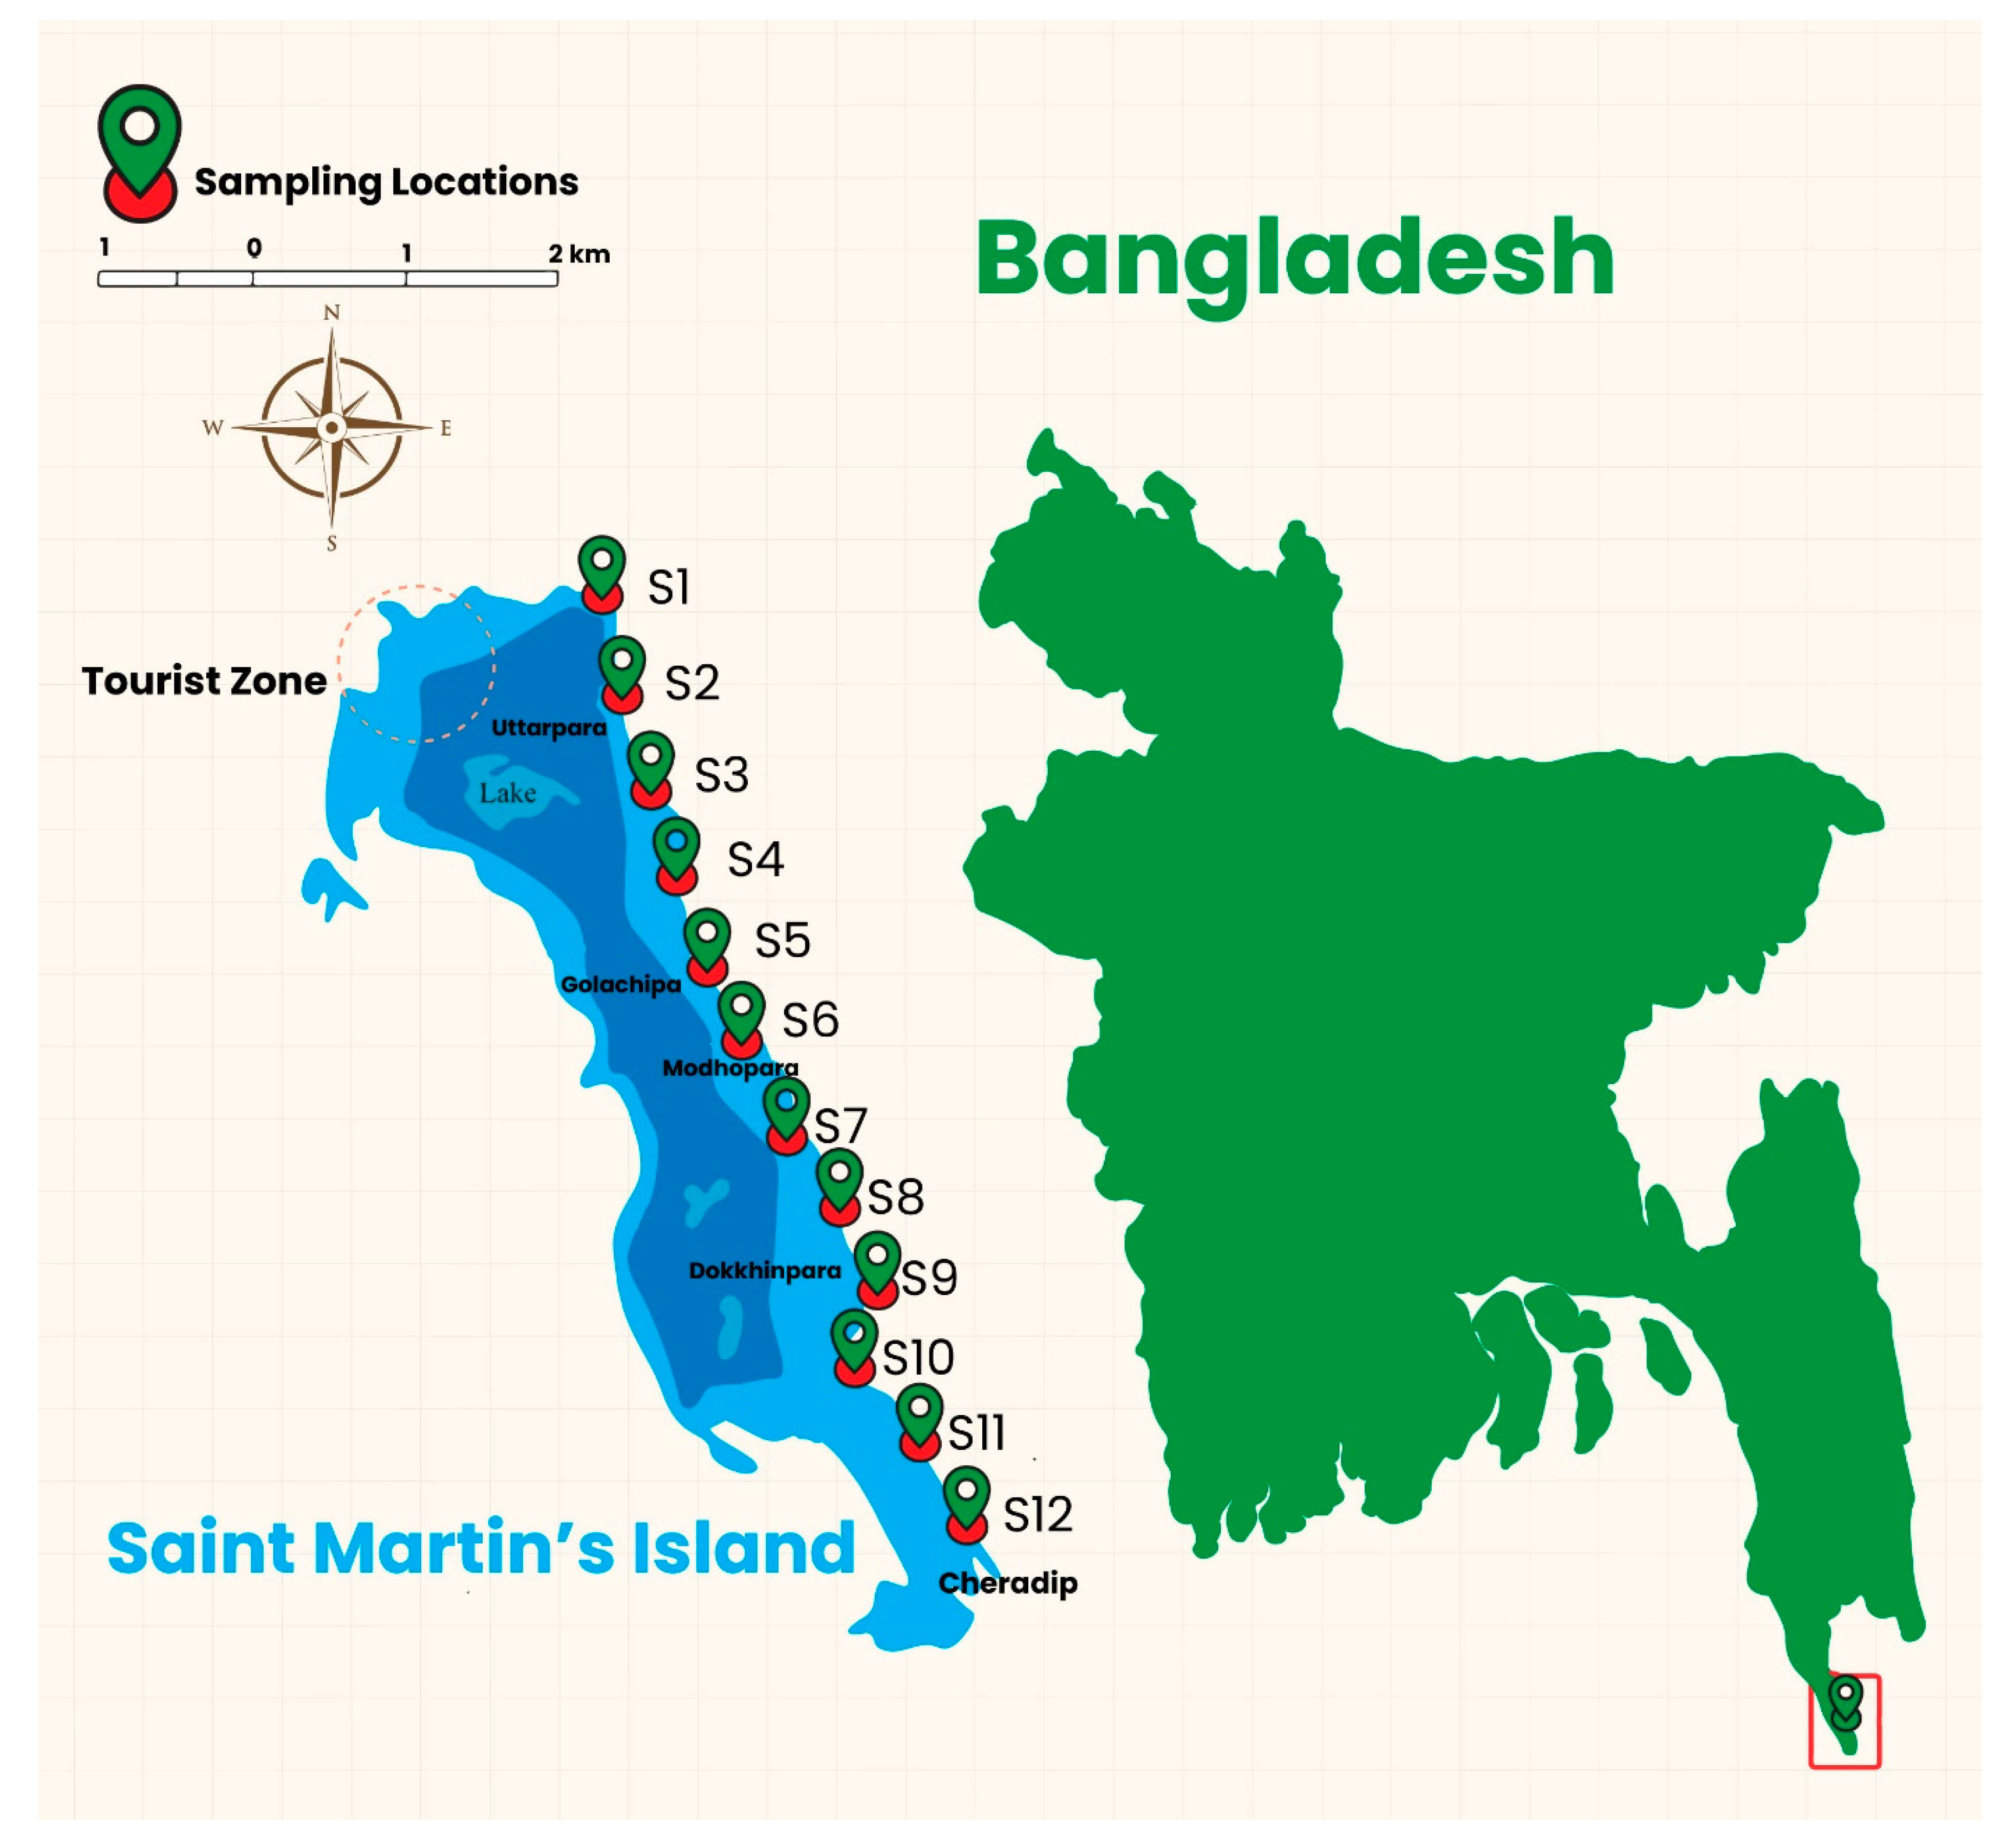
2.1. Study Area
2.2. Sample Collection and Preservation
2.3. Sample Digestion, Analysis, and Quality Control
2.4. Sediment Contamination Level Assessment
2.4.1. Evaluating Geoaccumulation Index (Igeo)
2.4.2. Evaluating Contamination Factor (CF) and Pollution Load Index (PLI)
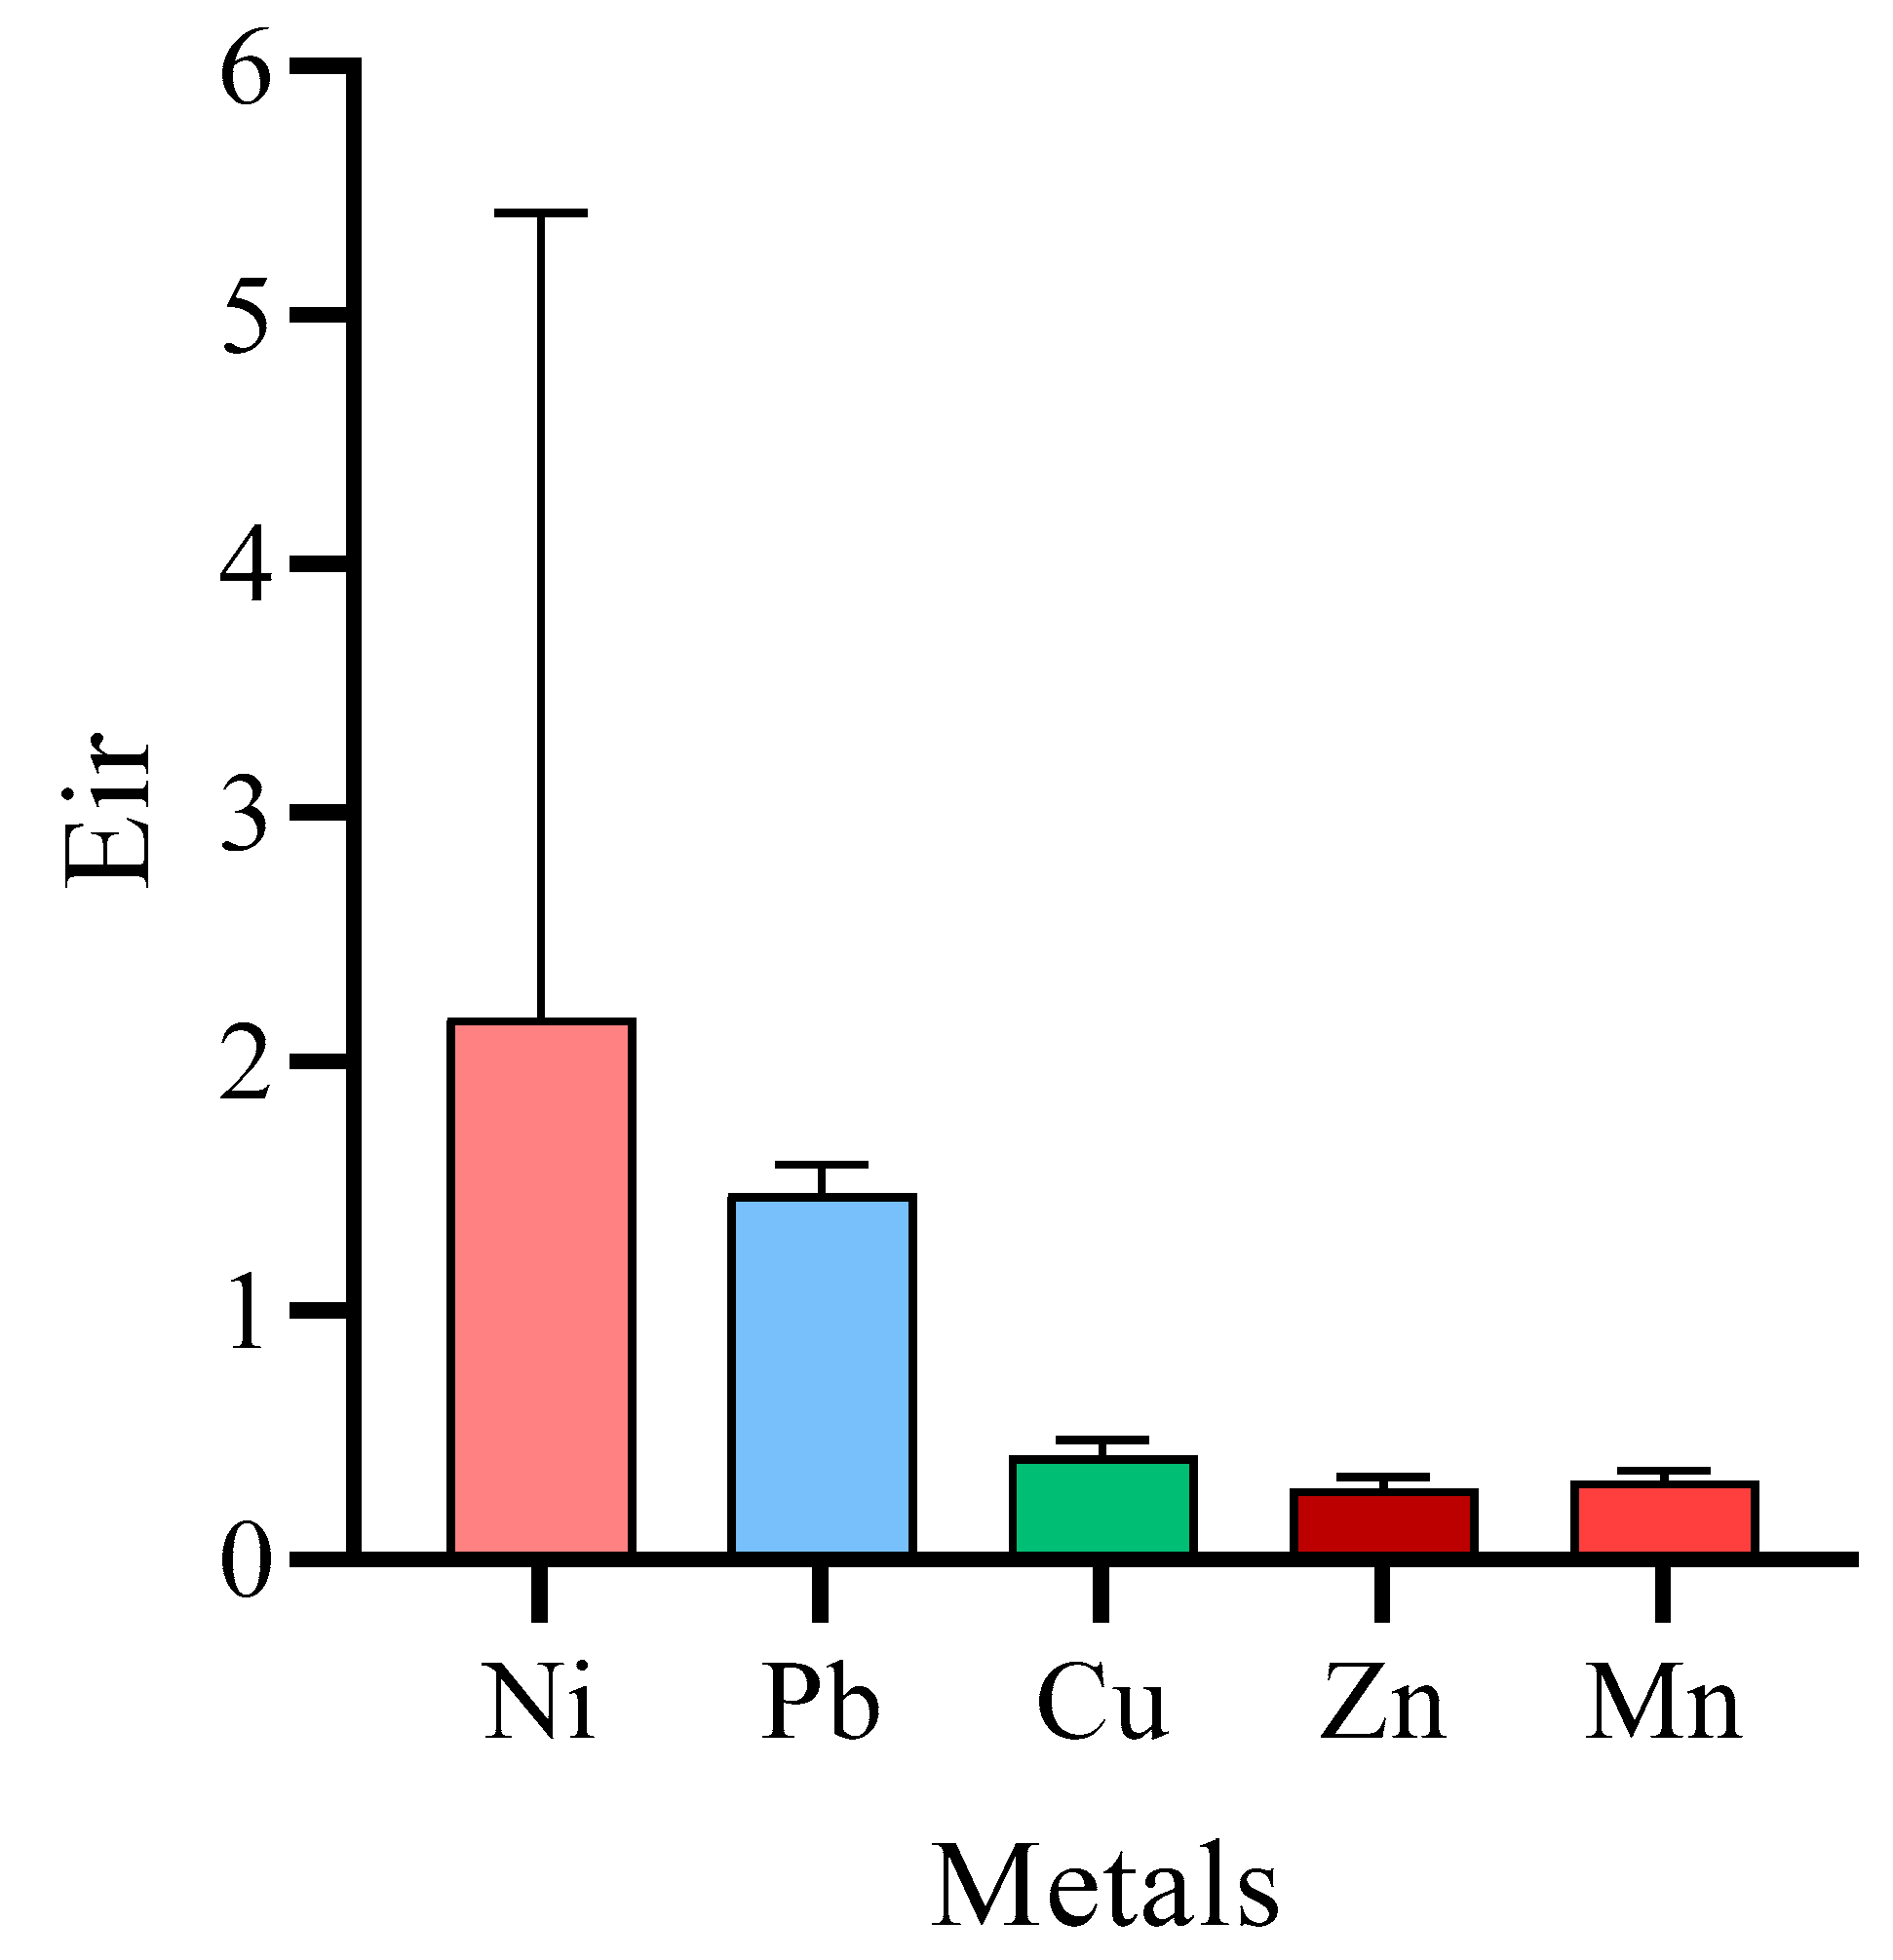
2.5. Evaluation of Potential Ecological Risk
2.6. Assessing Human Health Risk
2.6.1. Assessing Non-Carcinogenic Risk
2.6.2. Assessing Carcinogenic Risk
2.7. Statistical Analyses
3. Results and Discussion
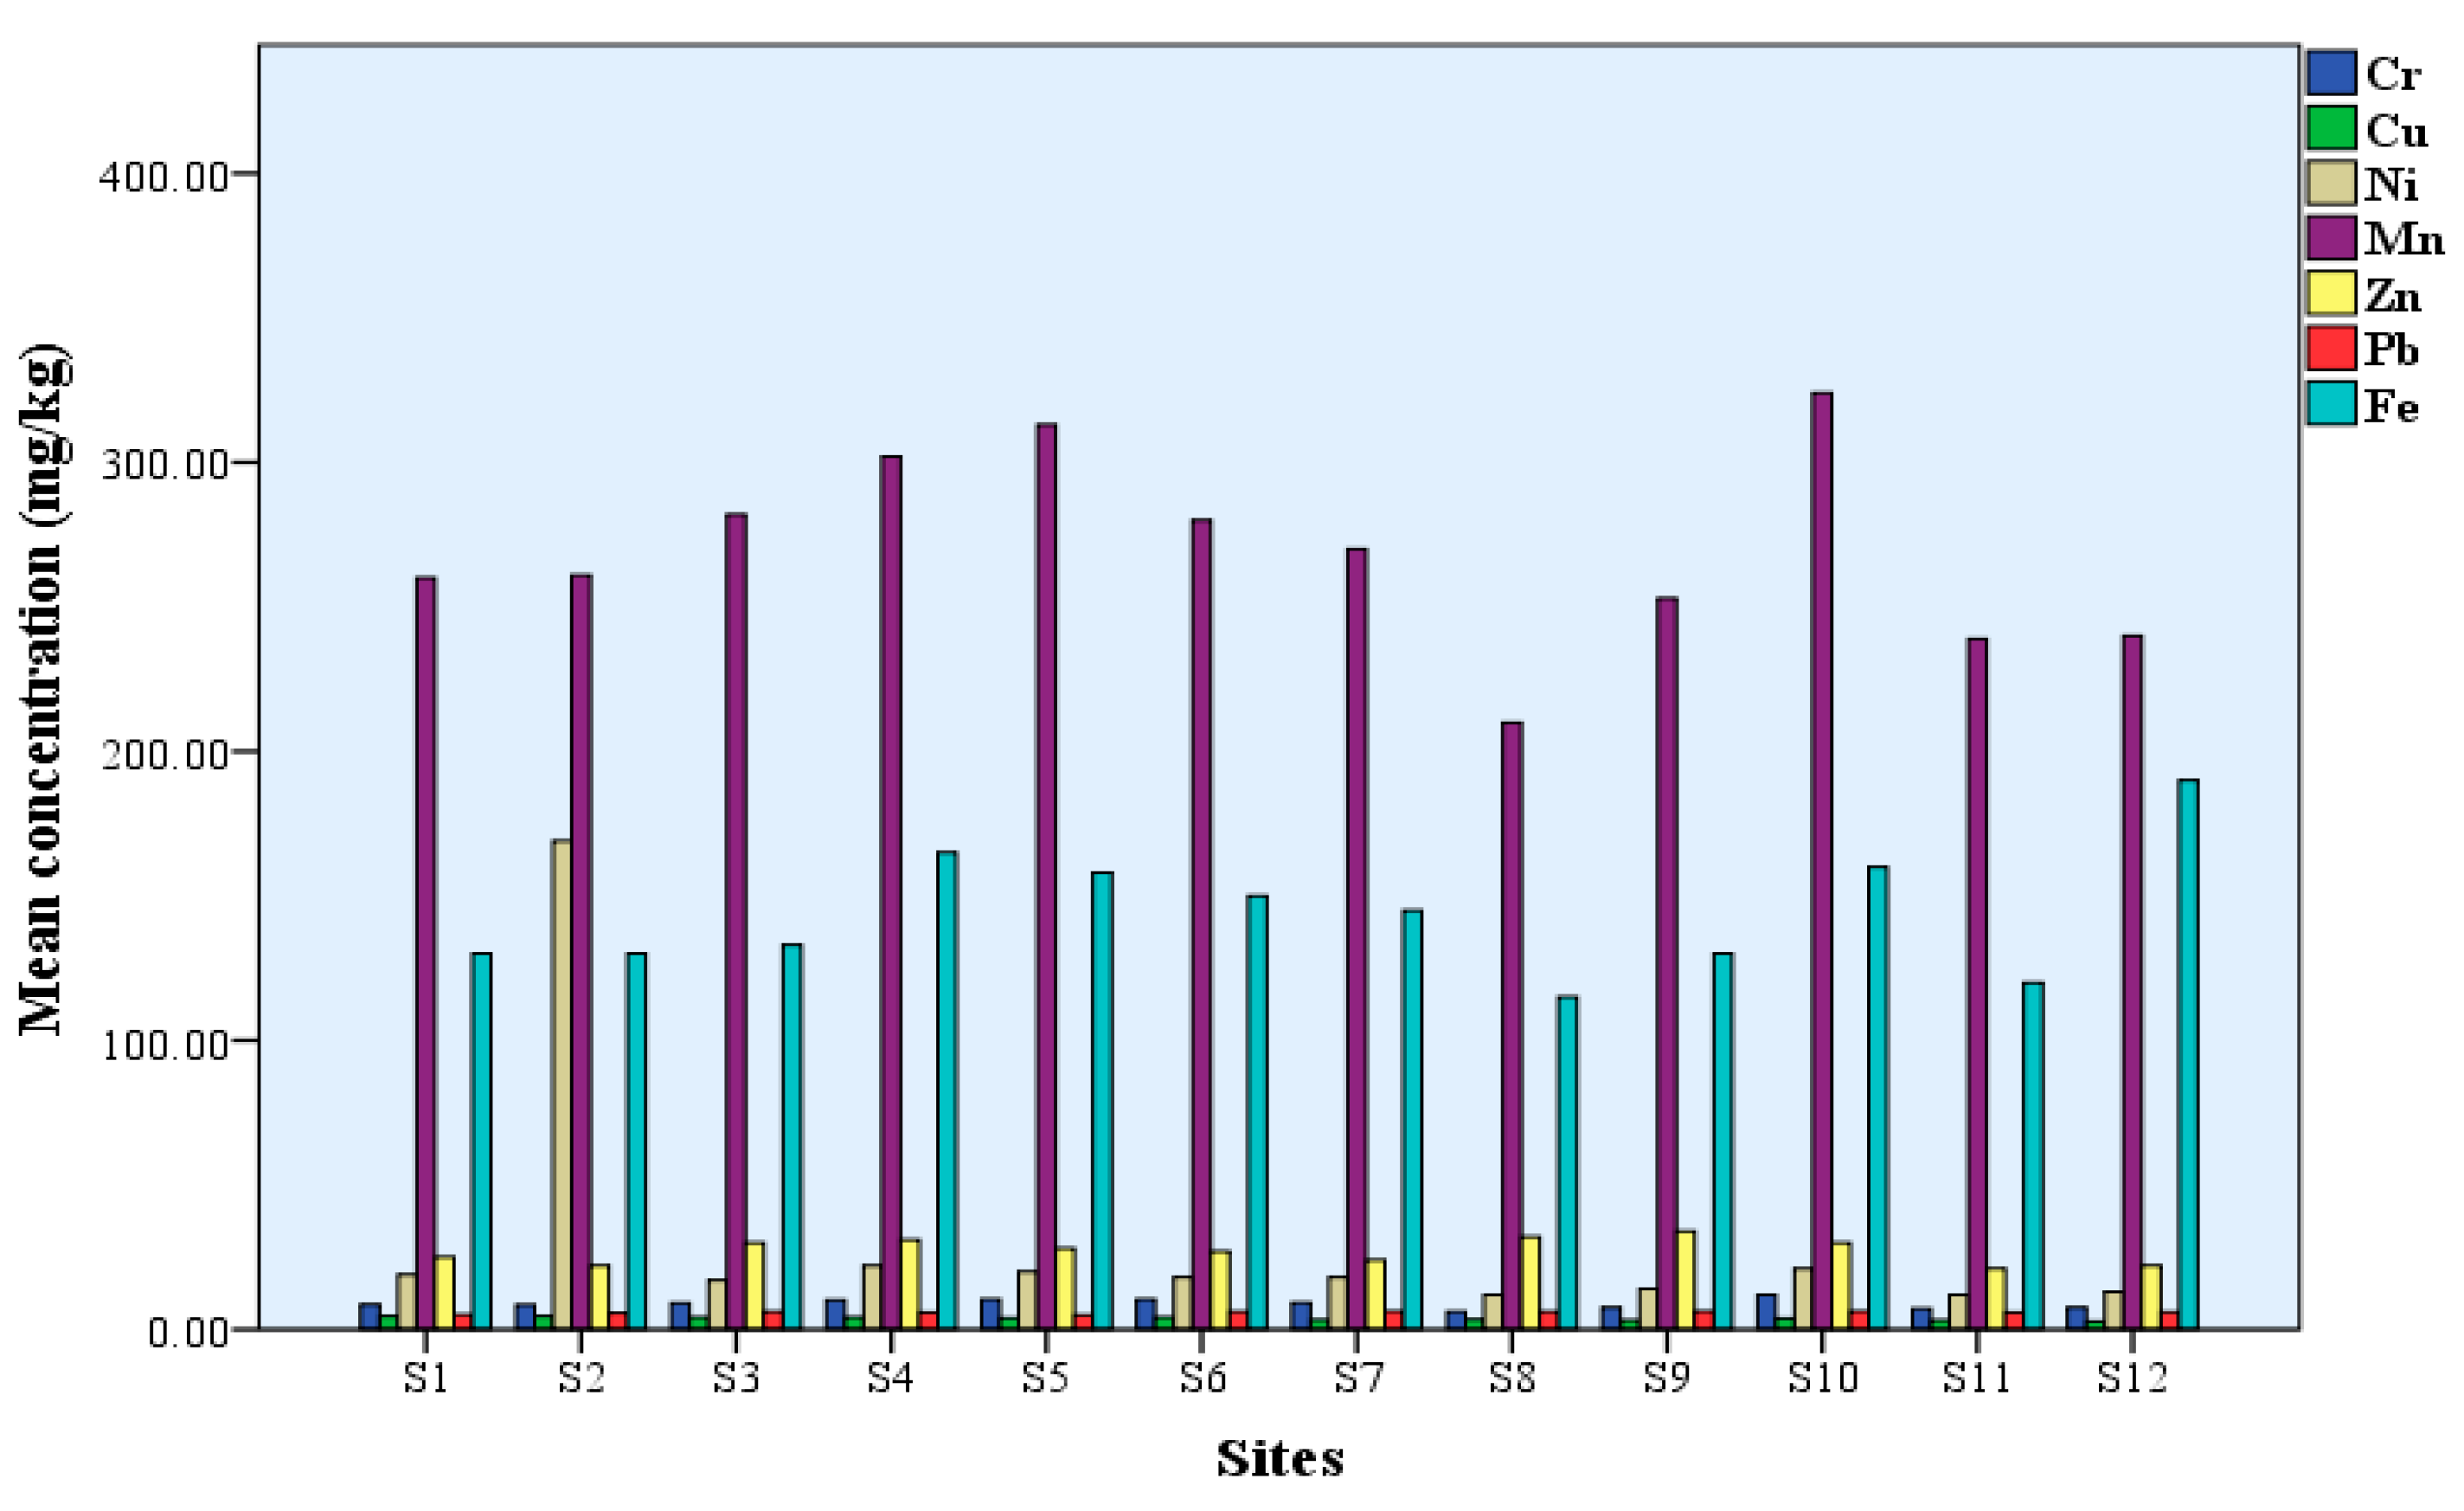
3.1. Heavy Metals Concentrations in Sediment
3.1.1. Chromium (Cr)
3.1.2. Copper (Cu)
3.1.3. Nickel (Ni)
3.1.4. Manganese (Mn)
3.1.5. Zinc (Zn)
3.1.6. Lead (Pb)
3.1.7. Iron (Fe)
3.2. Sediment Contamination Level Assessment
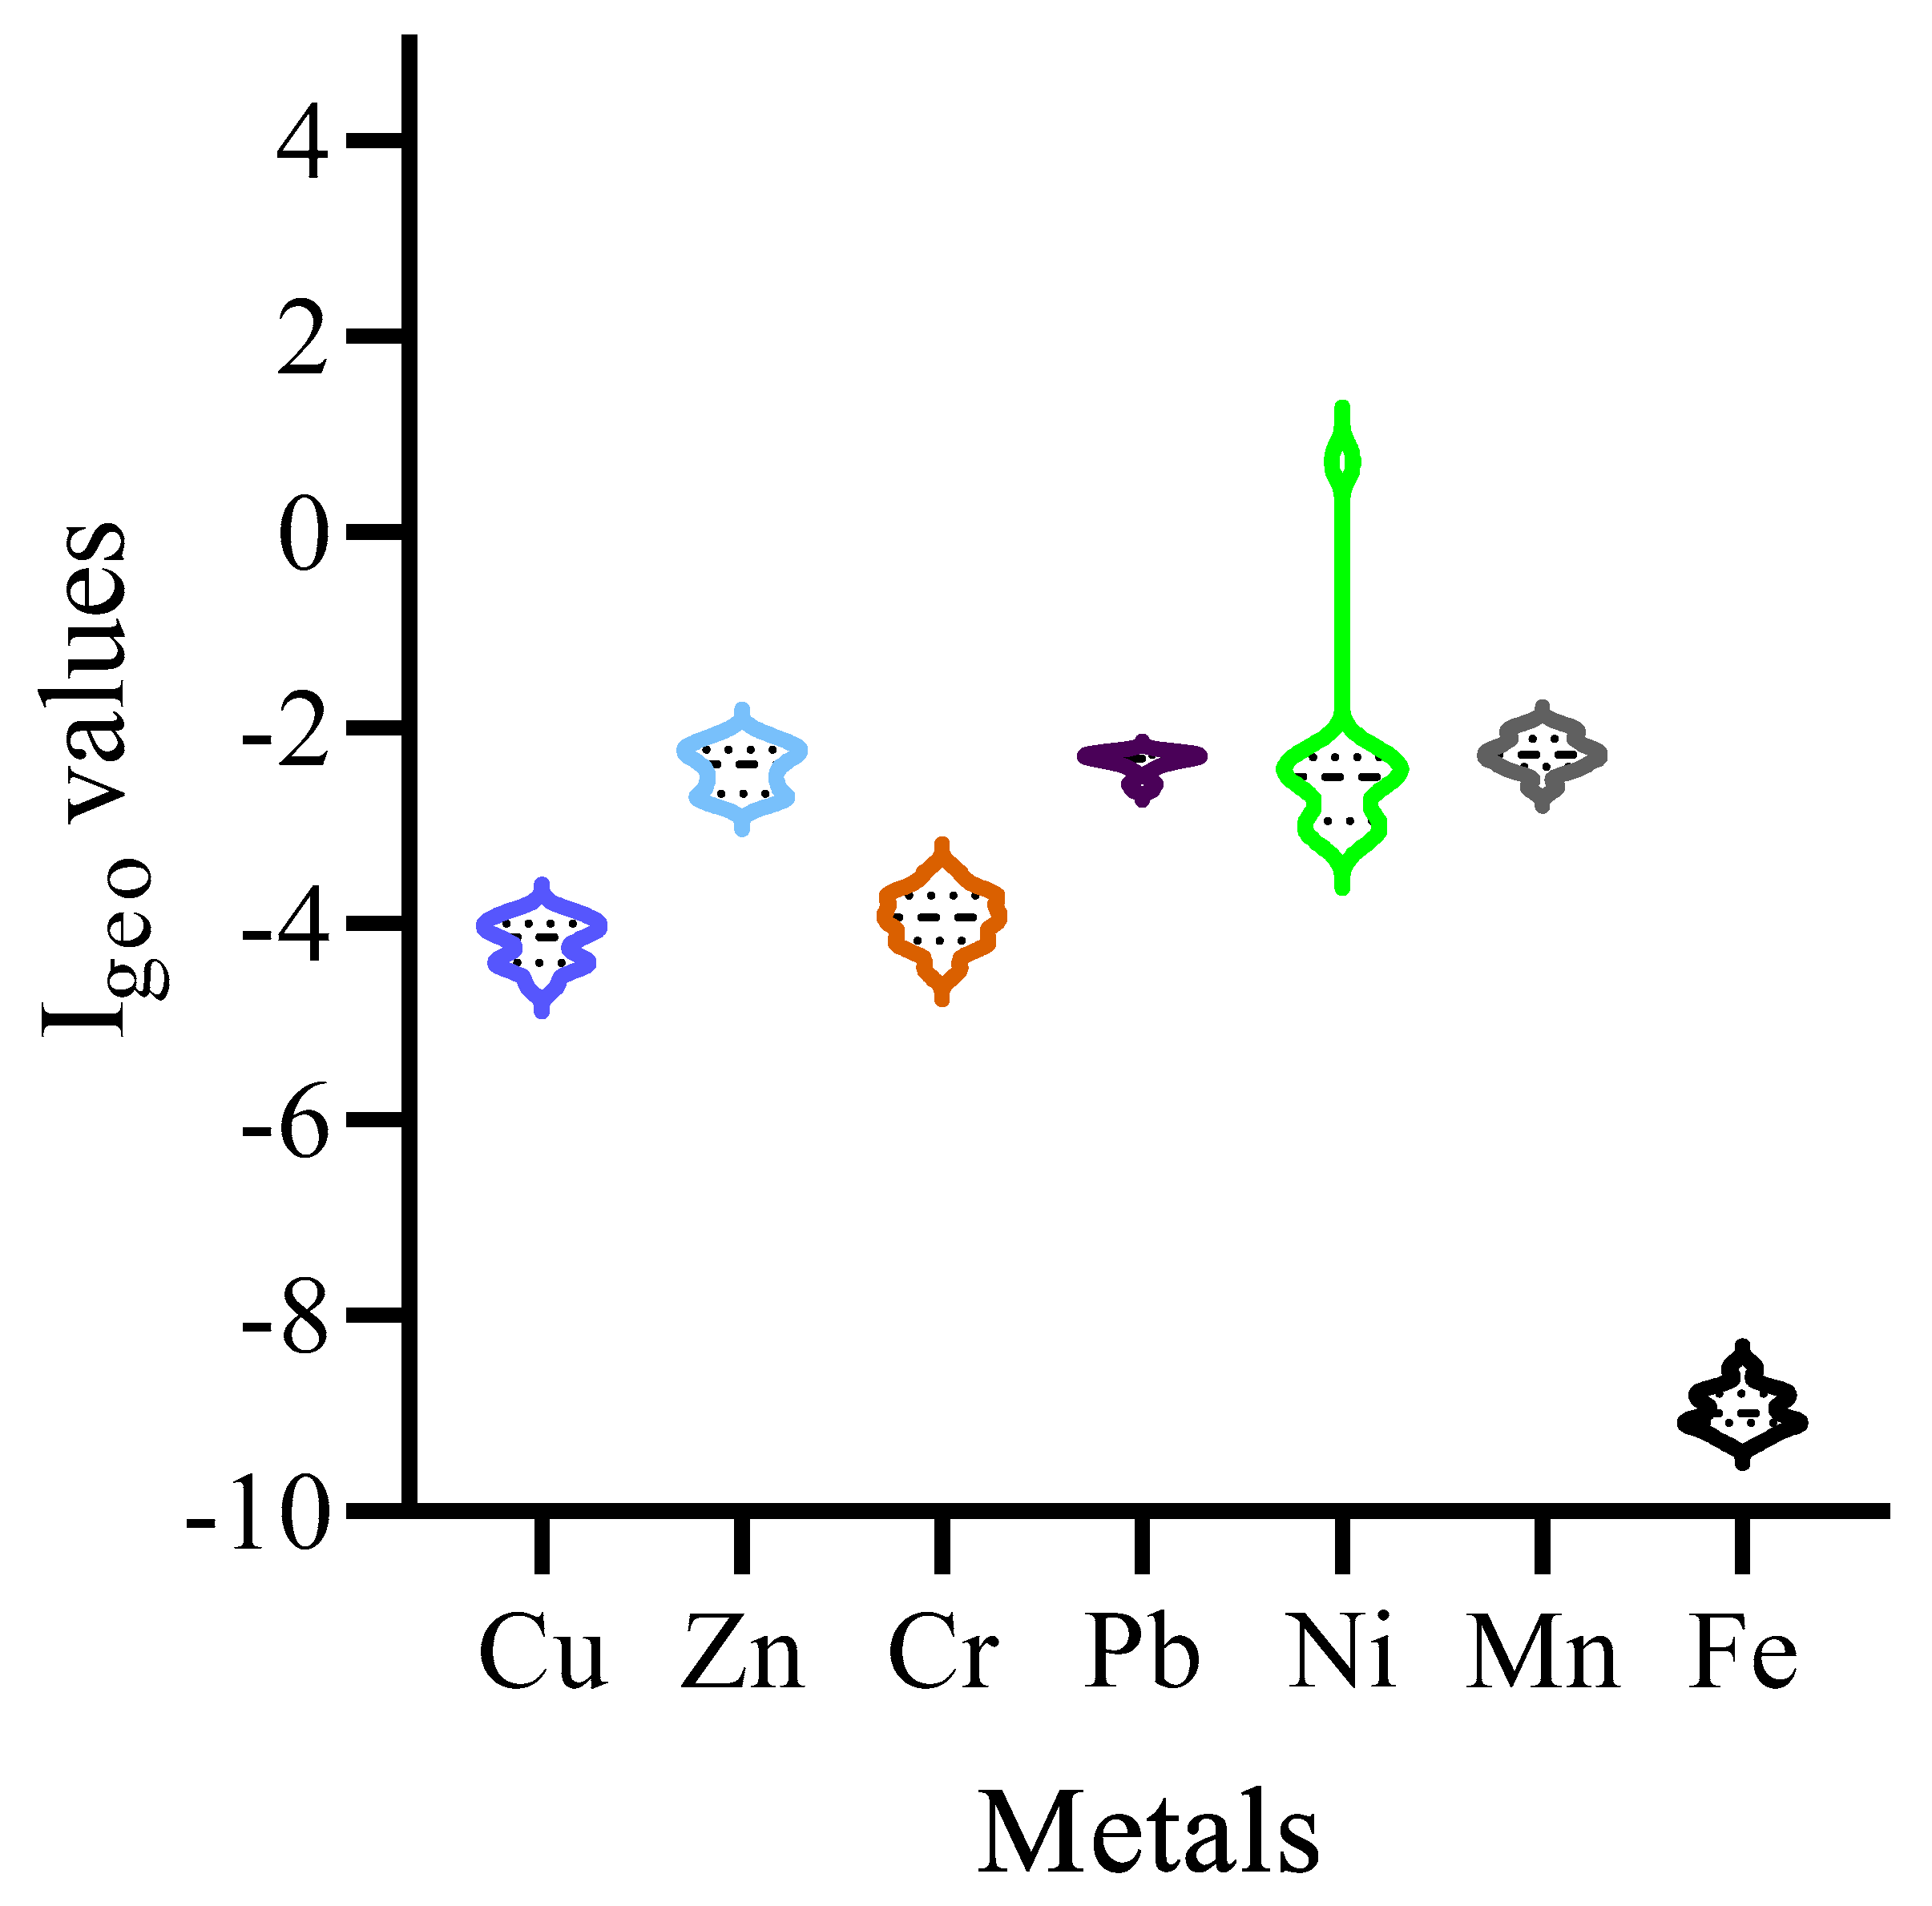
3.2.1. Geoaccumulation Index (Igeo)
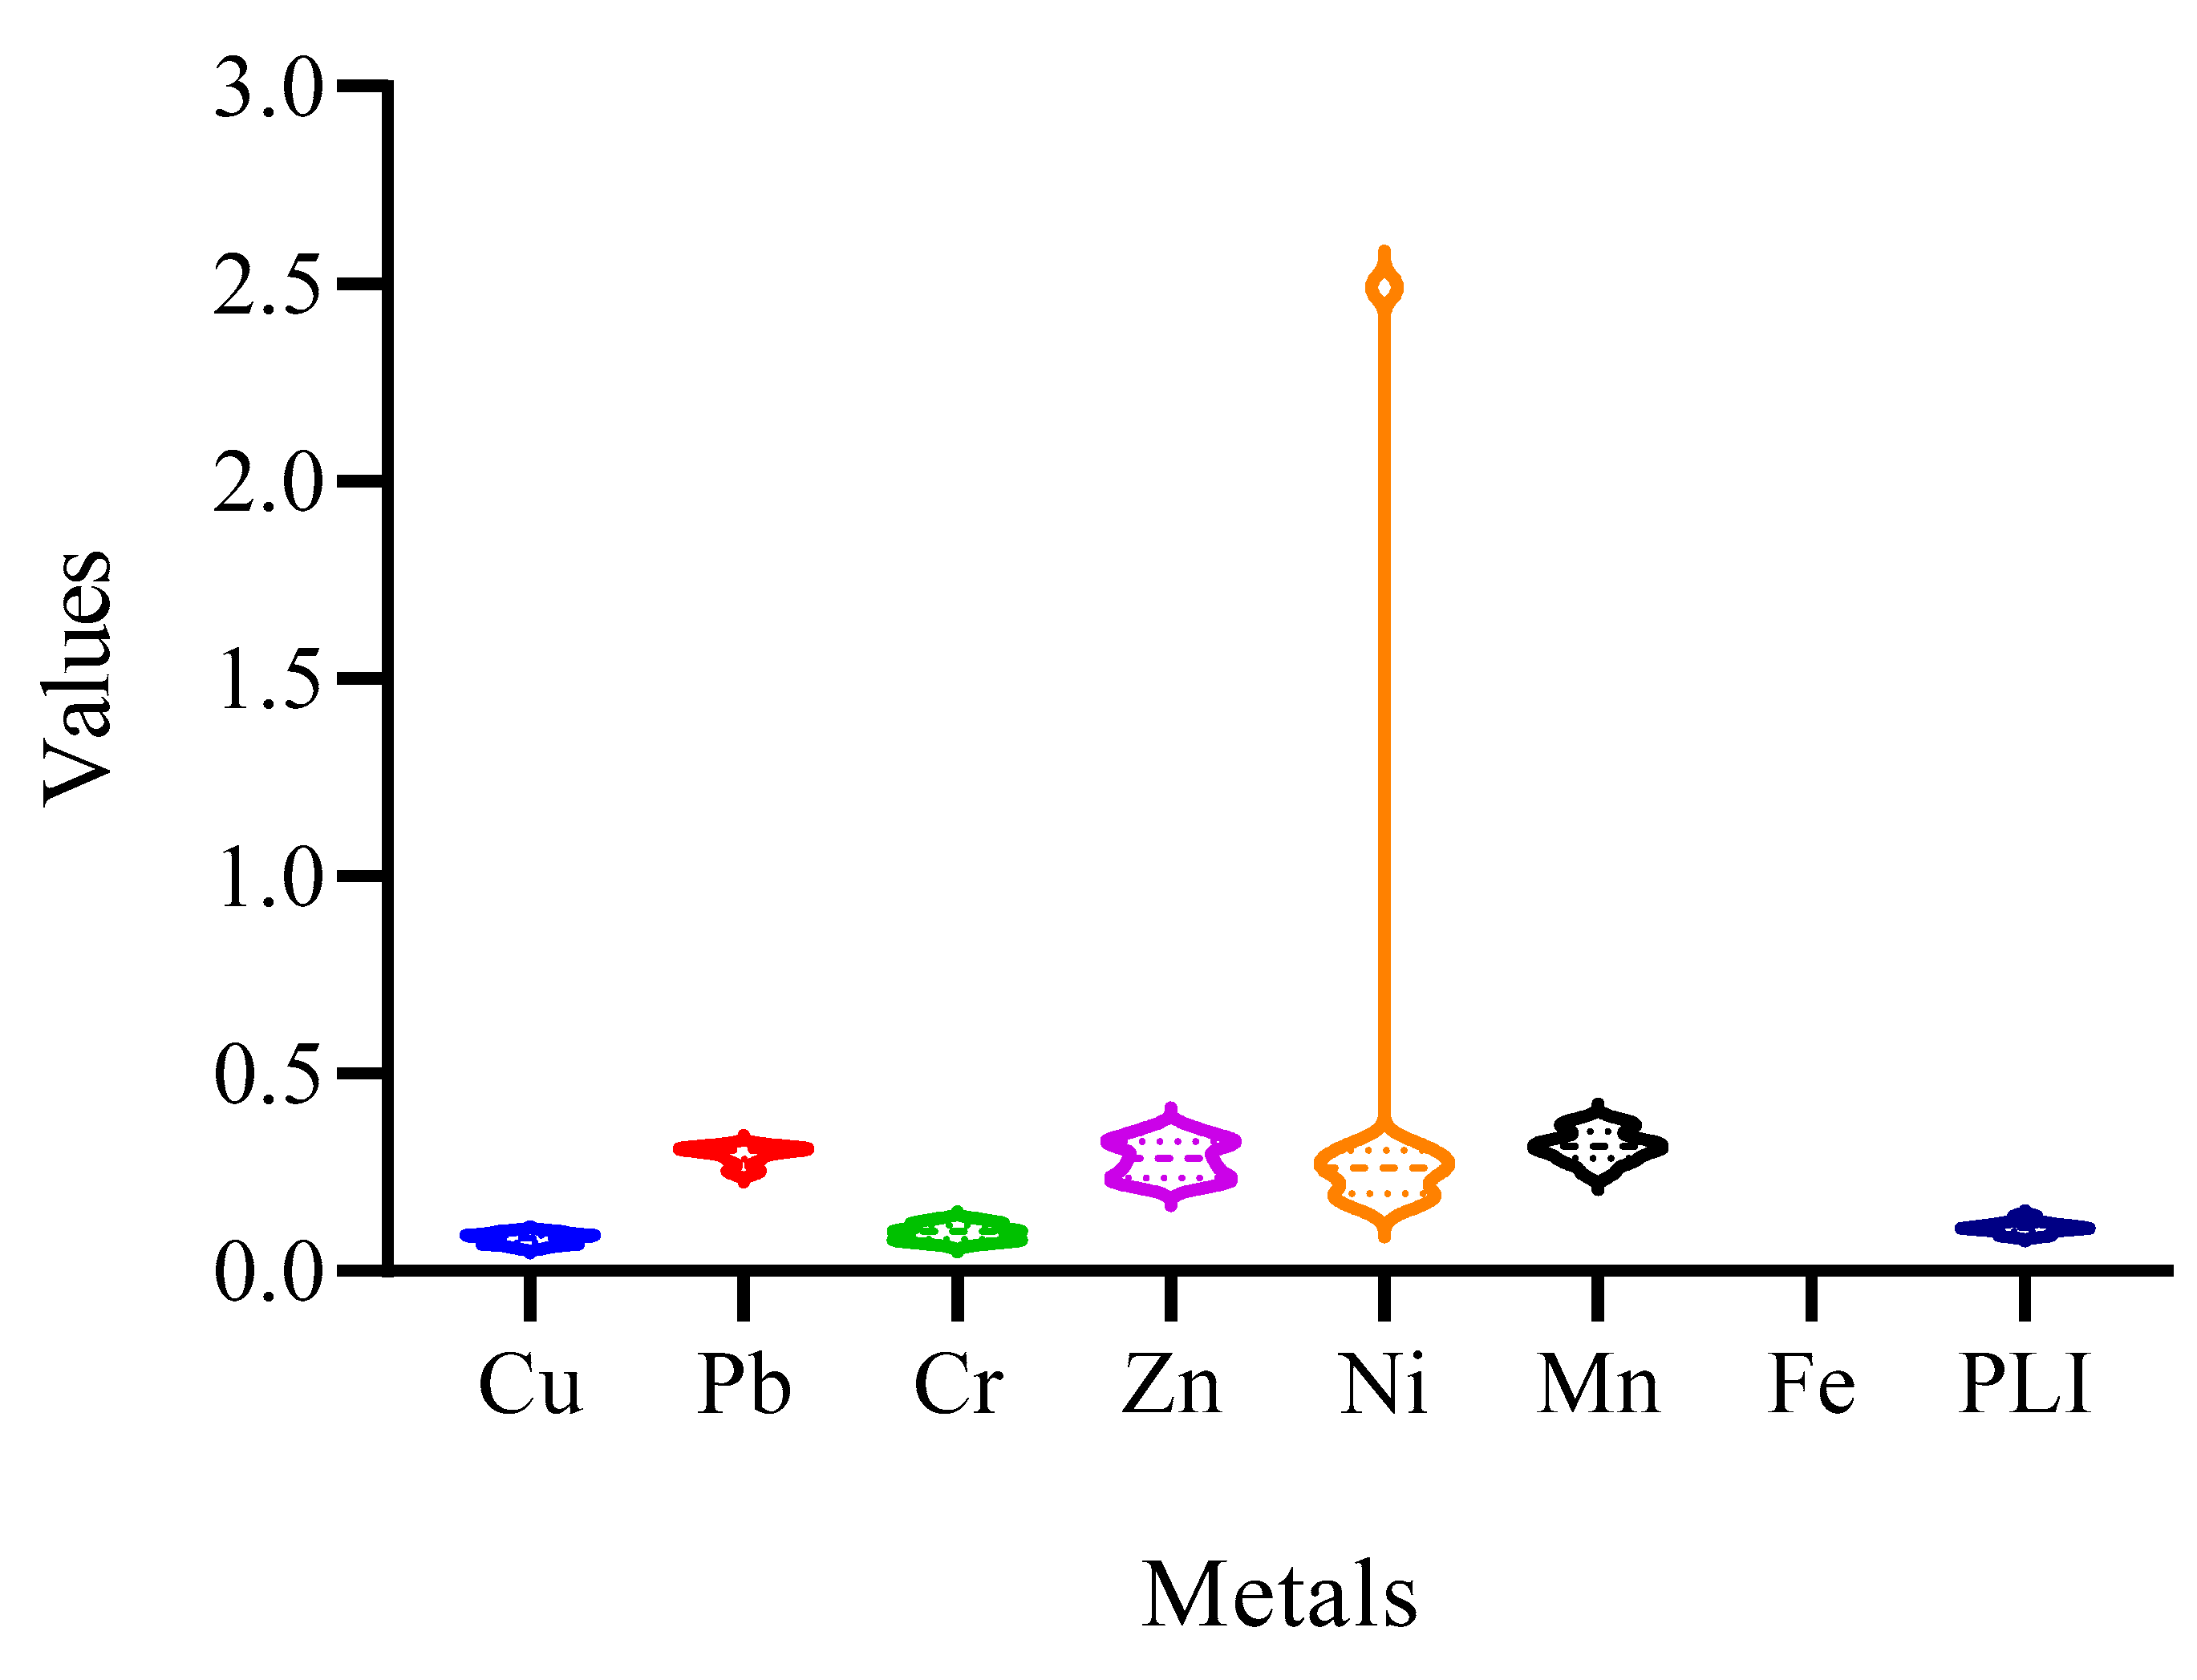
3.2.2. Assessing Contamination Factor (CF) and Pollution Load Index (PLI)
3.3. Assessing Potential Ecological Risk Index (PERI)
3.4. Human Health Risk Assessment
3.4.1. Estimating Chronic Daily Intake (CDI)
3.4.2. Assessing Target Hazard Quotient (THQ) (Non-Carcinogenic Risk)
3.4.3. Carcinogenic Risk (CR) Evaluation
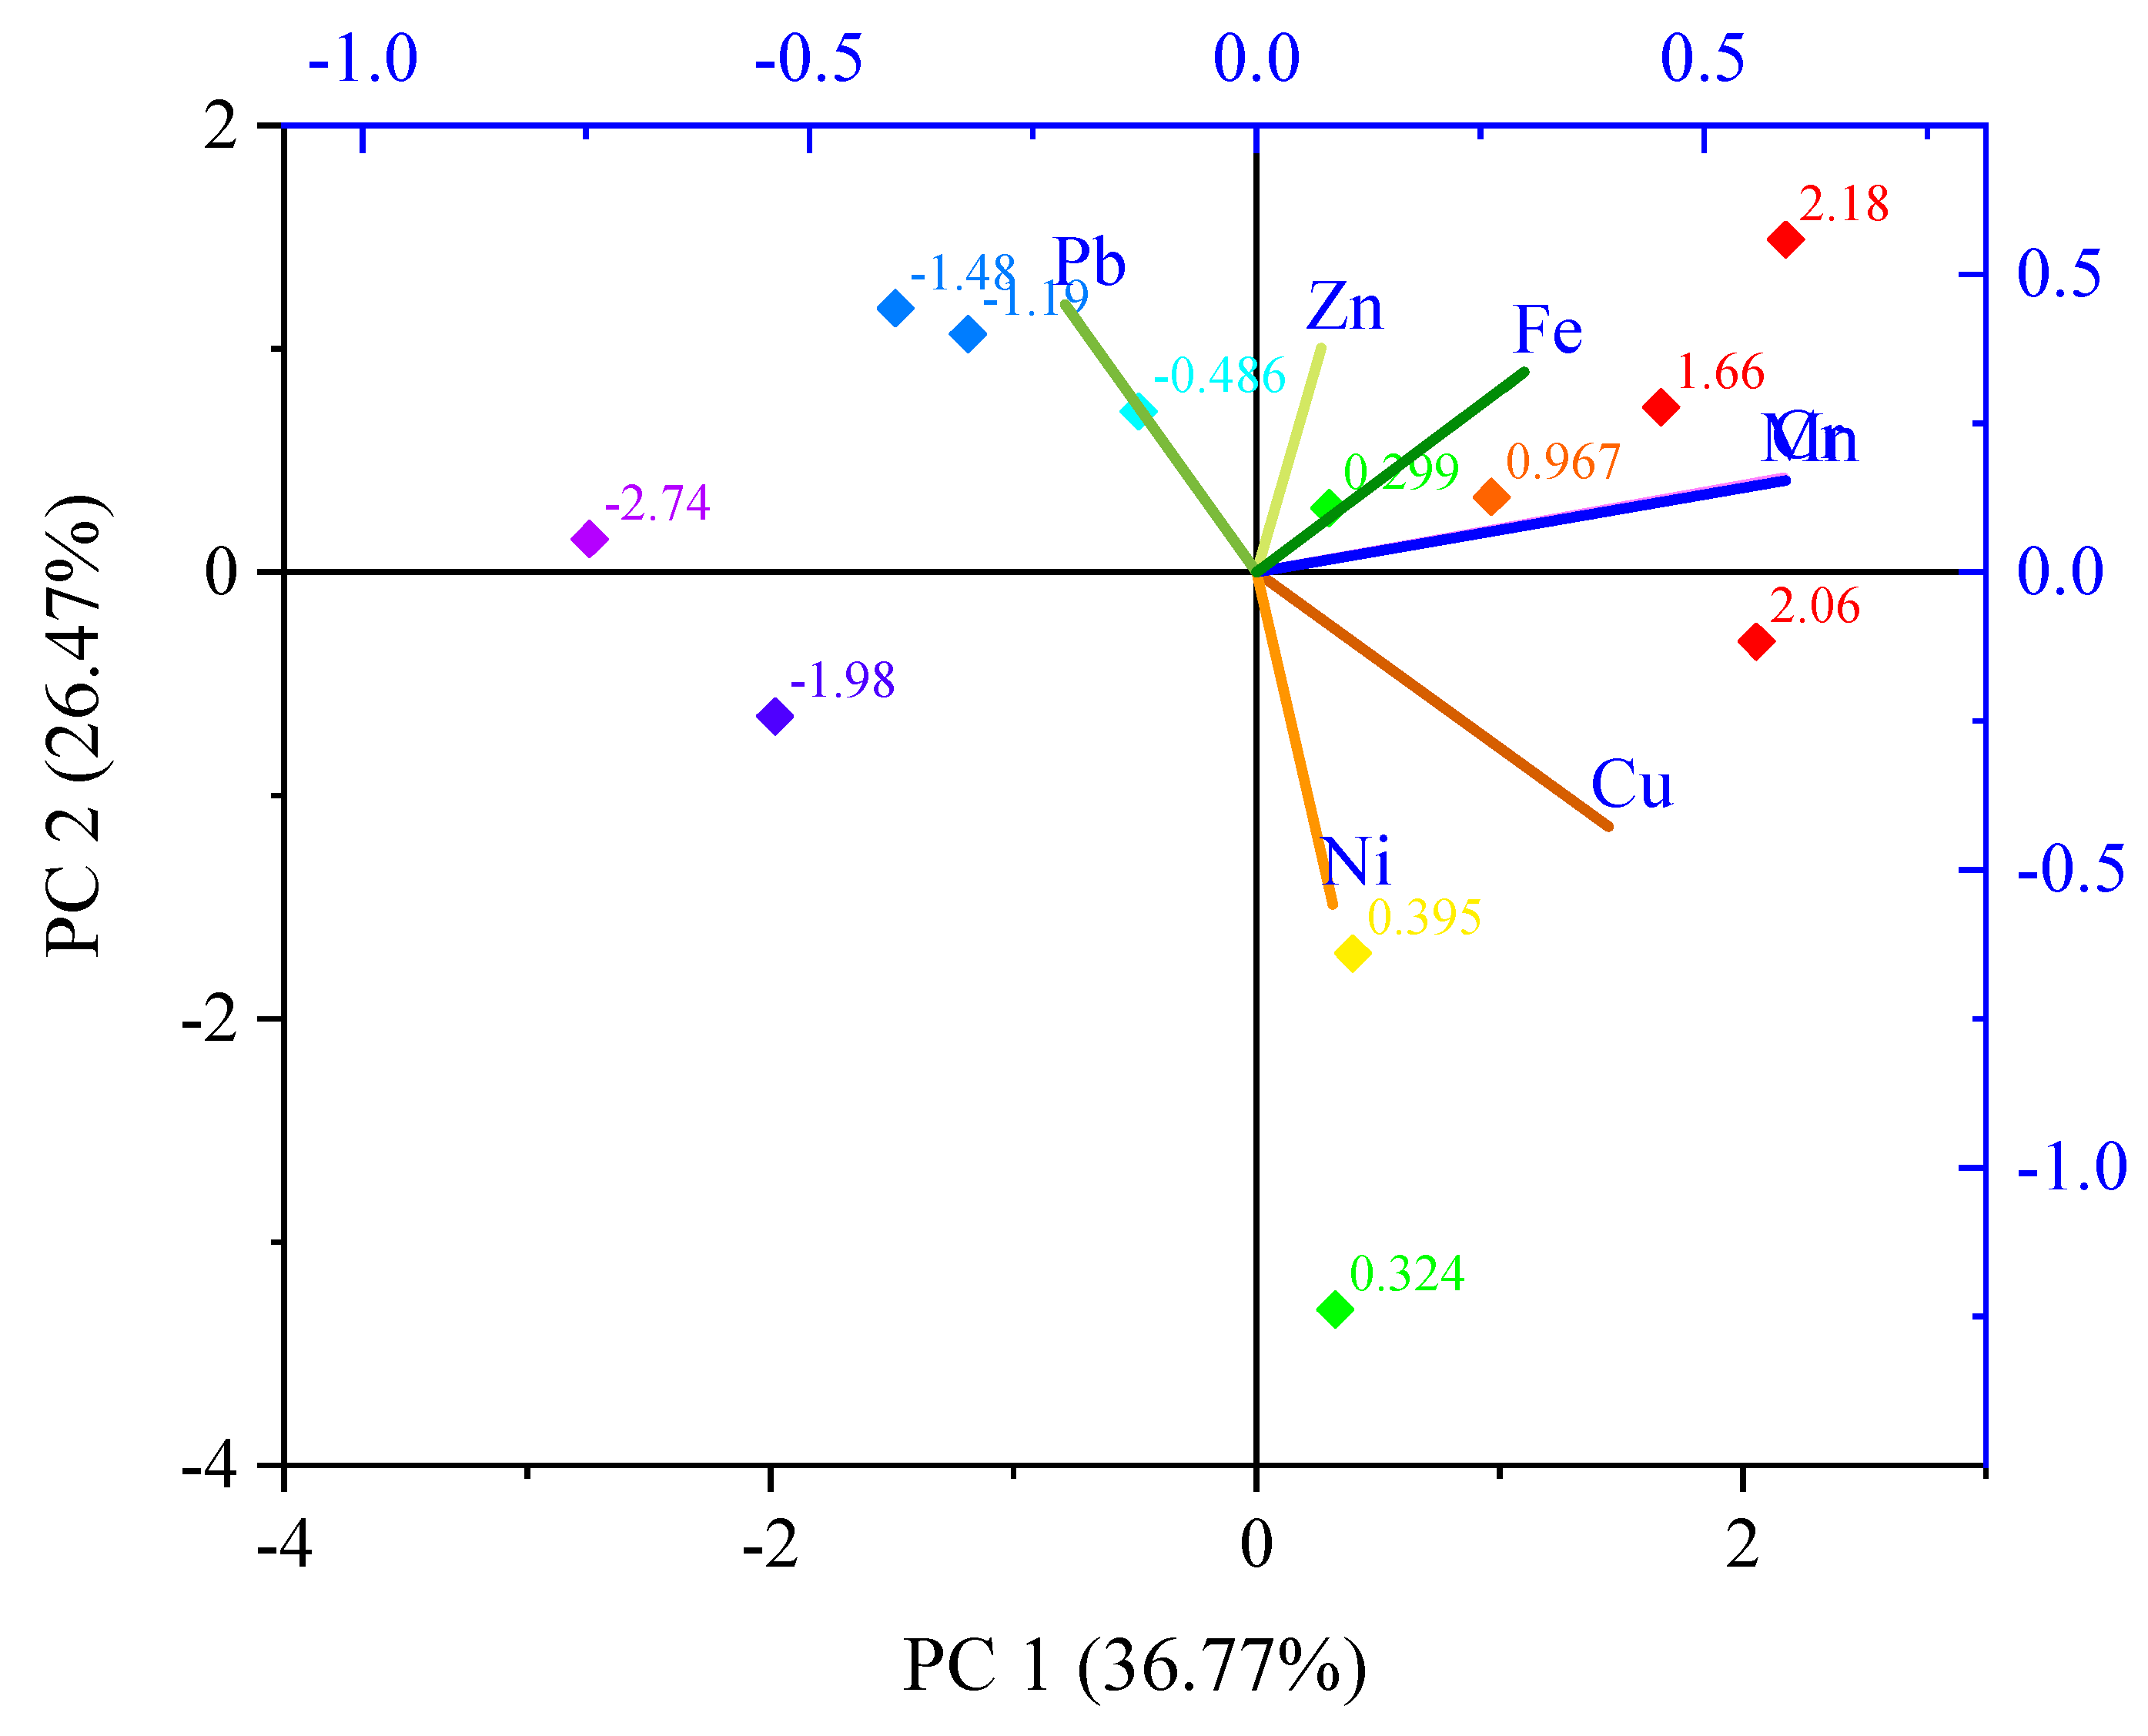
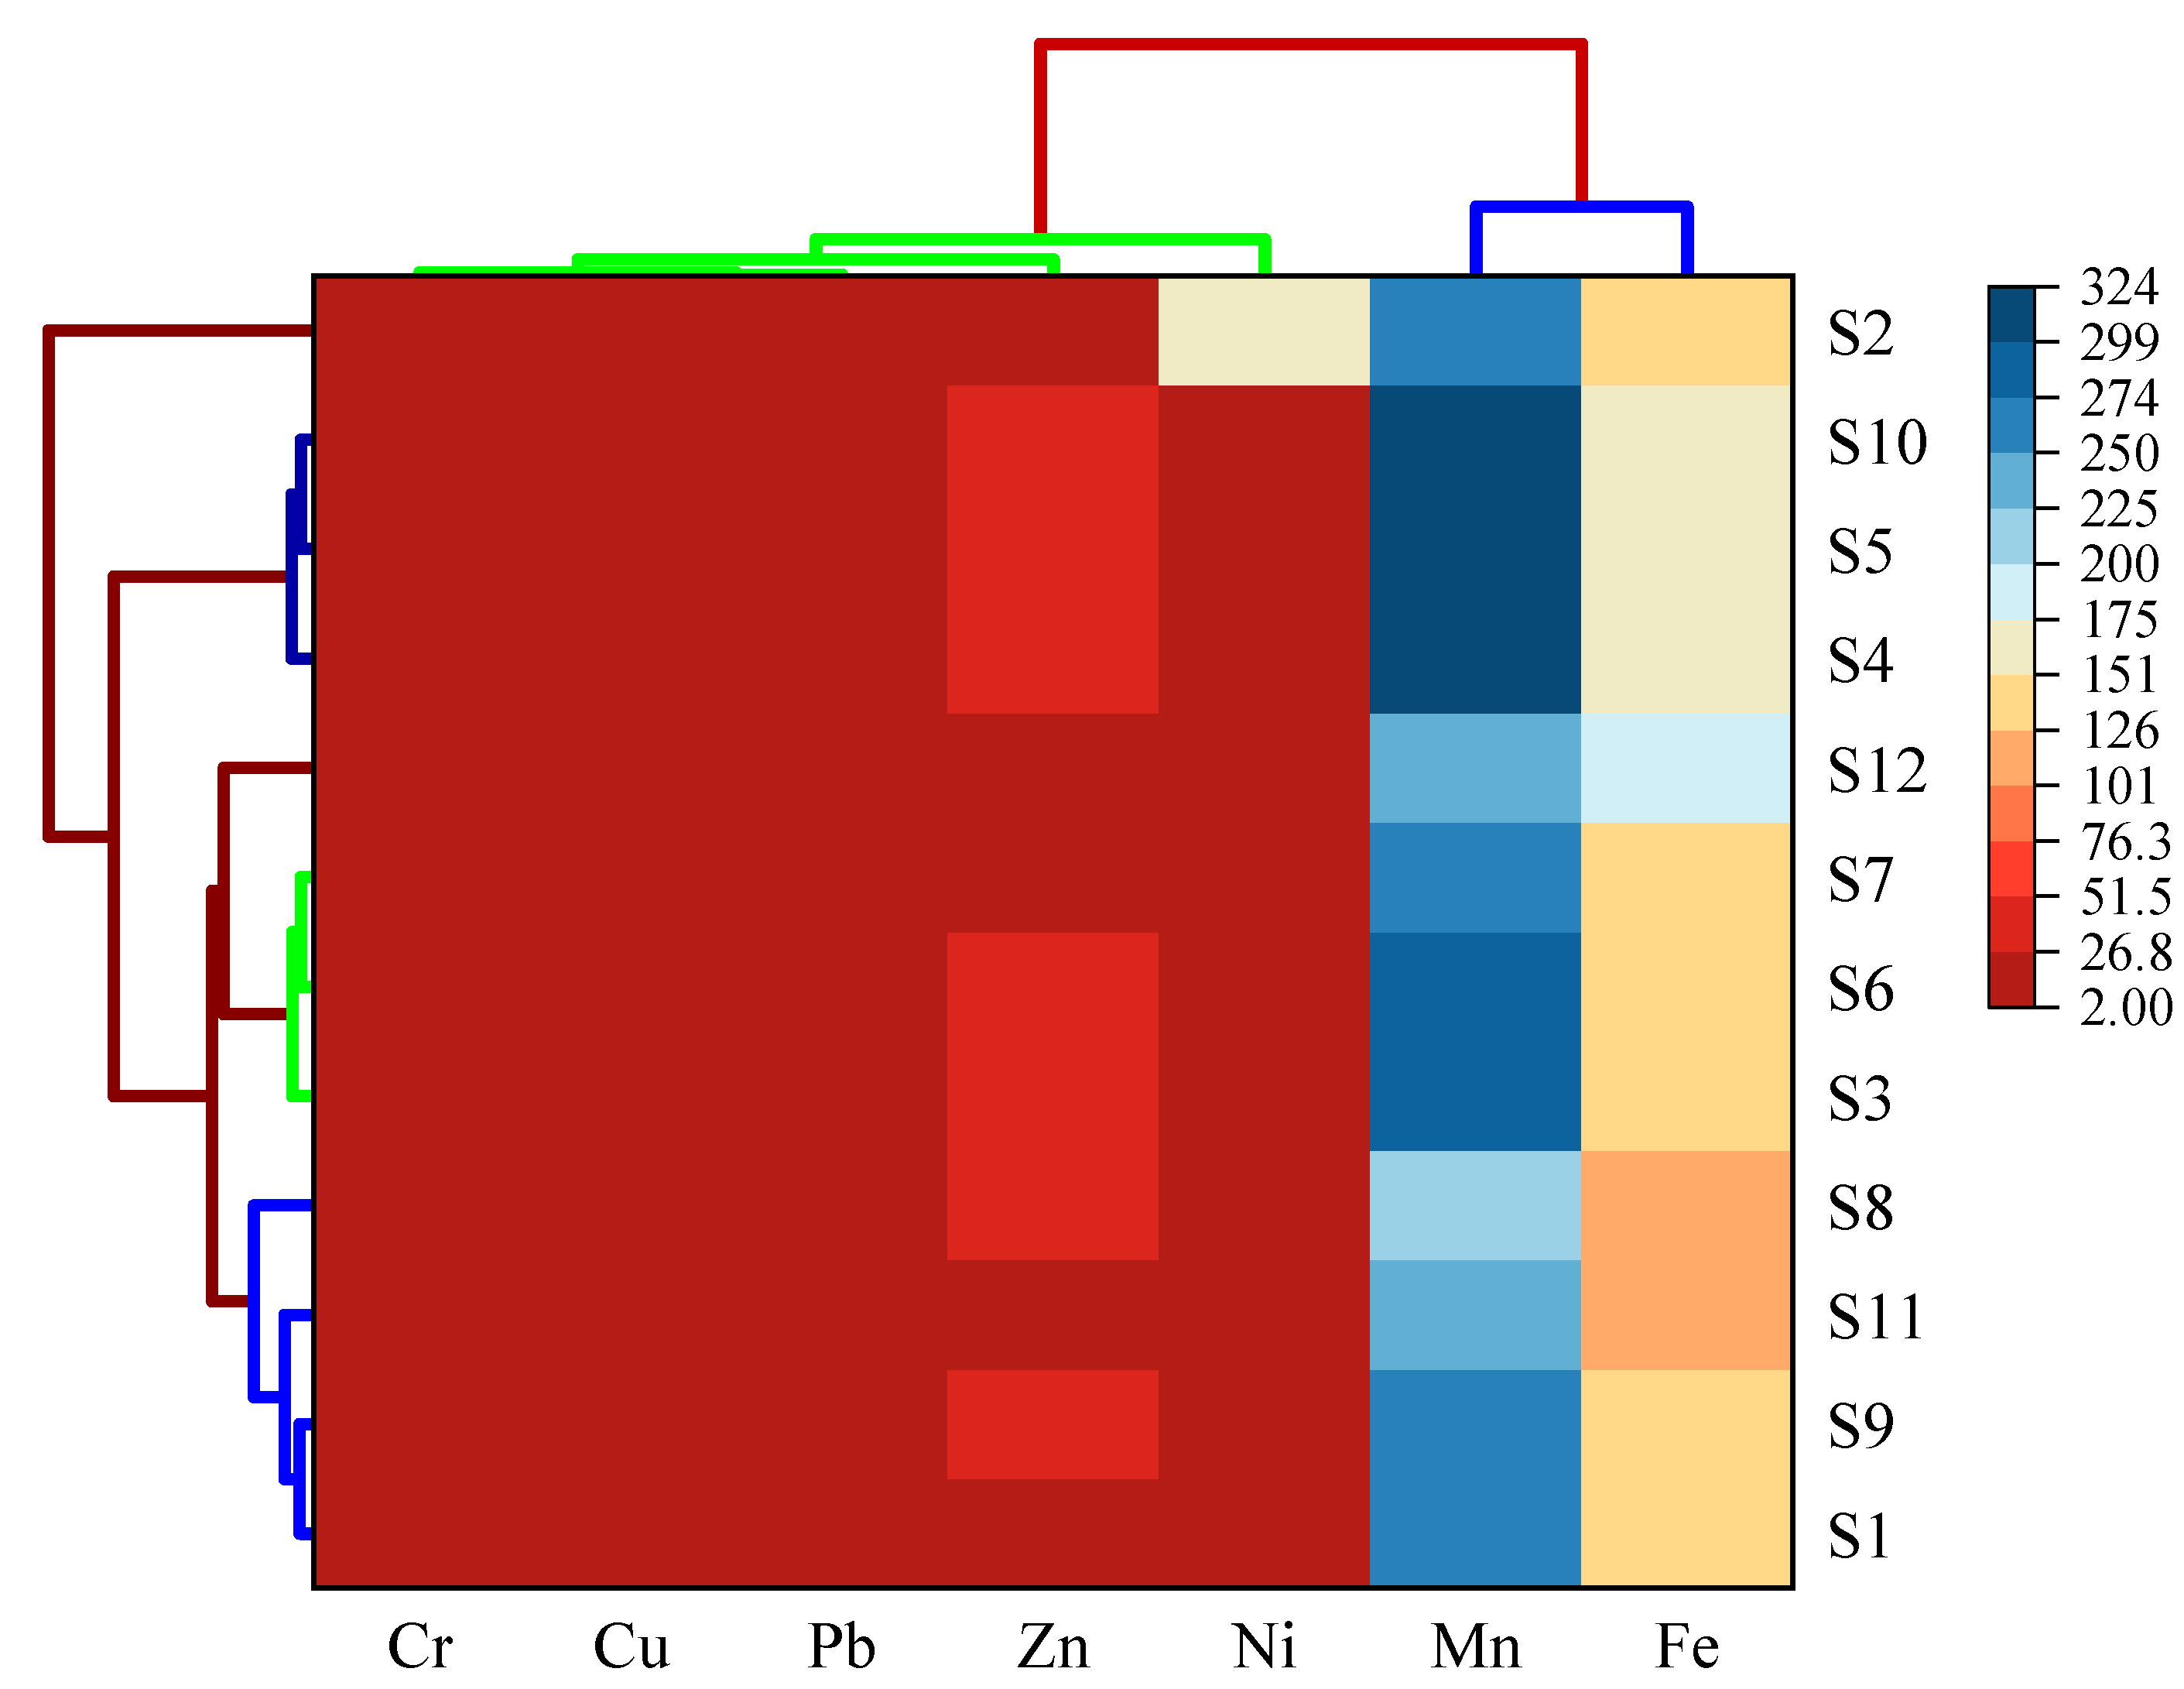
3.5. Identification of Sources of Heavy Metals in Sediment
3.6. Policy Implications
4. Conclusions
Author Contributions
Funding
Data Availability Statement
Acknowledgments
Conflicts of Interest
References
- Bat, L.; Öztekin, A.; Arici, E.; Şahin, F.; Bhuyan, S. Trace Element Risk Assessment for the Consumption of Sarda sarda (Bloch, 1793) from the mid-South Black Sea Coastline. Water Air Soil Pollut. 2022, 233, 44. [Google Scholar] [CrossRef]
- Ali, M.M.; Ali, M.L.; Bhuyan, M.; Islam, M.; Rahman, M.; Alam, M.; Mustary, S. Spatiotemporal variation and toxicity of trace metals in commercially important fish of the tidal Pasur River in Bangladesh. Environ. Sci. Pollut. Res. 2022, 29, 40131–40145. [Google Scholar] [CrossRef] [PubMed]
- Bhuyan, M.; Bakar, M.A.; Rashed-Un-Nabi, M.; Senapathi, V.; Chung, S.Y.; Islam, M. Monitoring and assessment of heavy metal contamination in surface water and sediment of the Old Brahmaputra River, Bangladesh. Appl. Water Sci. 2019, 9, 125. [Google Scholar] [CrossRef]
- Bhuyan, M.S.; Bakar, M.A.; Akhtar, A.; Hossain, M.B.; Ali, M.M.; Islam, M.S. Heavy metal contamination in surface water and sediment of the Meghna River, Bangladesh. Environ. Nanotechnol. Monit. Manag. 2017, 8, 273–279. [Google Scholar] [CrossRef]
- Bhuyan, M.S.; Bakar, M.A. Seasonal variation of heavy metals in water and sediments in the Halda River, Chittagong, Bangladesh. Environ. Sci. Pollut. Res. 2017, 24, 27587–27600. [Google Scholar] [CrossRef]
- Dvorak, P.; Roy, K.; Andreji, J.; Liskova, Z.D.; Mraz, J. Vulnerability assessment of wild fish population to heavy metals in military training area: Synthesis of a framework with example from Czech Republic. Ecol. Indic. 2020, 110, 105920. [Google Scholar] [CrossRef]
- Zhelev, Z.M.; Arnaudova, D.N.; Popgeorgiev, G.S.; Tsonev, S.V. In situ assessment of health status and heavy metal bioaccumulation of adult Pelophylax ridibundus (Anura: Ranidae) individuals inhabiting polluted area in southern Bulgaria. Ecol. Indic. 2020, 115, 106413. [Google Scholar] [CrossRef]
- Bacchi, E.; Cammilleri, G.; Tortorici, M.; Galluzzo, F.G.; Pantano, L.; Calabrese, V.; Vella, A.; Macaluso, A.; Dico, G.M.L.; Ferrantelli, V.; et al. First Report on the Presence of Toxic Metals and Metalloids in East Asian Bullfrog (Hoplobatrachus rugulosus) Legs. Foods 2022, 11, 3009. [Google Scholar] [CrossRef]
- Aydın, H.; Tepe, Y.; Ustaoğlu, F. A holistic approach to the eco-geochemical risk assessment of trace elements in the estuarine sediments of the Southeastern Black Sea. Mar. Pollut. Bull. 2023, 189, 114732. [Google Scholar] [CrossRef]
- Du, S.; Zhu, R.; Cai, Y.; Xu, N.; Yap, P.-S.; Zhang, Y.; He, Y.; Zhang, Y. Environmental fate and impacts of microplastics in aquatic ecosystems: A review. RSC Adv. 2021, 11, 15762–15784. [Google Scholar] [CrossRef]
- Anbuselvan, N.; Sridharan, M. Heavy metal assessment in surface sediments off Coromandel Coast of India: Implication on marine pollution. Mar. Pollut. Bull. 2018, 131, 712–726. [Google Scholar] [CrossRef]
- Hossain, M.B.; Shanta, T.B.; Ahmed, A.S.; Hossain, K.; Semme, S.A. Baseline study of heavy metal contamination in the Sangu River estuary, Chattogram, Bangladesh. Mar. Pollut. Bull. 2019, 140, 255–261. [Google Scholar] [CrossRef]
- Bhuyan, M.S.; Bakar, M.A. Assessment of water quality in Halda River (the Major carp breeding ground) of Bangladesh. Pollution 2017, 3, 429–441. [Google Scholar]
- Bhuyan, M.S.; Islam, M.S. Status and impacts of industrial pollution on the karnafully river in Bangladesh: A review. Int. J. Mar. Sci. 2017, 7, 16. [Google Scholar] [CrossRef]
- Sarker, K.K.; Bristy, M.S.; Alam, N.; Baki, M.A.; Shojib, F.H.; Quraishi, S.B.; Khan, F. Ecological risk and source apportionment of heavy metals in surface water and sediments on Saint Martin’s Island in the Bay of Bengal. Environ. Sci. Pollut. Res. 2020, 27, 31827–31840. [Google Scholar] [CrossRef]
- Tokatlı, C.; Varol, M.; Ustaoğlu, F. Ecological and health risk assessment and quantitative source apportionment of dissolved metals in ponds used for drinking and irrigation purposes. Environ. Sci. Pollut. Res. 2023, 30, 52818–52829. [Google Scholar] [CrossRef]
- Dogru, T.; Bulut, U.; Kocak, E.; Isik, C.; Suess, C.; Sirakaya-Turk, E. The nexus between tourism, economic growth, renewable energy consumption, and carbon dioxide emissions: Contemporary evidence from OECD countries. Environ. Sci. Pollut. Res. 2020, 27, 40930–40948. [Google Scholar] [CrossRef]
- Jafarabadi, A.R.; Bakhtiyari, A.R.; Toosi, A.S.; Jadot, C. Spatial distribution, ecological and health risk assessment of heavy metals in marine surface sediments and coastal seawaters of fringing coral reefs of the Persian Gulf, Iran. Chemosphere 2017, 185, 1090–1111. [Google Scholar] [CrossRef]
- Clark, N.; Rickards, L. An Anthropocene species of trouble? Negative synergies between earth system change and geological destratification. Anthr. Rev. 2022, 9, 425–442. [Google Scholar] [CrossRef]
- Ghose, T.; Hossain, M. Socioeconomic factors affecting profitability of seaweed culture in Saint Martin Island of Bangladesh. Progress. Agric. 2020, 31, 227–234. [Google Scholar] [CrossRef]
- Alam, O.; Deng, T.; Uddin, M.; Alamgir, M. Application of Environmental Ethics for Sustainable Development and Conservation of Saint Martin’s Island in Bangladesh. J. Environ. Sci. Nat. Resour. 2015, 8, 19–27. [Google Scholar] [CrossRef]
- Wildlife Conservation Society. A New Marine Protected Area to Protect Biodiversity and Coral Habitat Around Saint Martin’s Island in Bangladesh. Available online: https://newsroom.wcs.org/News-Releases/articleType/ArticleView/articleId/17095/A-New-Marine-Protected-Area-to-Protect-Biodiversity-and-Coral-Habitat-Around-Saint-Martins-Island-in-Bangladesh.aspx350593 (accessed on 2 April 2023).
- The Business Standard. High-Powered Team Suggested for Supervision of Marine Protected Areas. 2021. Available online: https://www.tbsnews.net/bangladesh/high-powered-team-suggested-supervision-marine-protected-areas-350593 (accessed on 2 February 2023).
- Banglapedia. St Martin’s Island. 2021. Available online: https://en.banglapedia.org/index.php/St_Martin’s_Island (accessed on 1 February 2023).
- Müller, G. Die Schwermetallbelstung der sedimente des Neckars und seiner Nebenflusse: Eine Bestandsaufnahme. Chemiker-Zeitung 1981, 105, 157–164. [Google Scholar]
- Håkanson, L. An ecological risk index for aquatic pollution control. A sedimentological approach. Water Res. 1980, 14, 975–1001. [Google Scholar] [CrossRef]
- Bi, B.; Liu, X.; Guo, X.; Lu, S. Occurrence and risk assessment of heavy metals in water, sediment, and fish from Dongting Lake, China. Environ. Sci. Pollut. Res. 2018, 25, 34076–34090. [Google Scholar] [CrossRef] [PubMed]
- Kusin, F.M.; Azani, N.N.M.; Hasan SN, M.S.; Sulong, N.A. Distribution of heavy metals and metalloid in surface sediments of heavily mined area for bauxite ore in Pengerang, Malaysia and associated risk assessment. Catena 2018, 165, 454–464. [Google Scholar] [CrossRef]
- Zhao, X.-M.; Yao, L.-A.; Ma, Q.-L.; Zhou, G.; Wang, L.; Fang, Q.-L.; Xu, Z.-C. Distribution and ecological risk assessment of cadmium in water and sediment in Longjiang River, China: Implication on water quality management after pollution accident. Chemosphere 2018, 194, 107–116. [Google Scholar] [CrossRef]
- Ahmed, A.S.S.; Hossain, M.B.; Babu, S.M.O.F.; Rahman, M.; Sun, J.; Sarker, M.S.I. Spatial distribution, source apportionment, and associated risks of trace metals (As, Pb, Cr, Cd, and Hg) from a subtropical river, Gomti, Bangladesh. Int. J. Sediment Res. 2021, 37, 83–96. [Google Scholar] [CrossRef]
- United States Environmental Protection Agency (USEPA). Exposure Factors Handbook 2011 Edition (Final). Available online: http://cfpub.epa.gov/ (accessed on 31 December 2022).
- United States Environmental Protection Agency (USEPA). Supplemental Guidance for Developing Soil Screening Levels for Superfund Sites OSWER 9355.4-24; USEPA: Washington, DC, USA, 2002.
- United States Environmental Protection Agency (USEPA). Risk Assessment Guidance for Superfund: Human Health Evaluation Manual, (Part A); Office of Emergency and Remedial Response: Washington, DC, USA, 1989; Volume I.
- United States Environmental Protection Agency (USEPA). Risk-Based Concentration Table; USEPA: Washington, DC, USA, 2000.
- Saha, N.; Mollah, M.; Alam, M.; Rahman, M.S. Seasonal investigation of heavy metals in marine fishes captured from the Bay of Bengal and the implications for human health risk assessment. Food Control 2016, 70, 110–118. [Google Scholar] [CrossRef]
- IARC. Cancer, Agents Classified by the IARC Monographs; IARC Monographs on the Evaluation of Carcinogenic Risks to Humans; IARC: Geneva, Switzerland, 2011.
- Ahmed, A.S.S.; Rahman, M.; Sultana, S.; Babu, S.M.O.F.; Sarker, M.S.I. Bioaccumulation and heavy metal concentration in tissues of some commercial fishes from the Meghna River Estuary in Bangladesh and human health implications. Mar. Pollut. Bull. 2019, 145, 436–447. [Google Scholar] [CrossRef]
- Ahmed, A.S.S.; Sultana, S.; Habib, A.; Ullah, H.; Musa, N.; Hossain, M.B.; Rahman, M.; Sarker, S.I. Bioaccumulation of heavy metals in some commercially important fishes from a tropical river estuary suggests higher potential health risk in children than adults. PLoS ONE 2019, 14, e0219336. [Google Scholar] [CrossRef]
- Yin, S.; Feng, C.; Li, Y.; Yin, L.; Shen, Z. Heavy metal pollution in the surface water of the Yangtze Estuary: A 5-year follow-up study. Chemosphere 2015, 138, 718–725. [Google Scholar] [CrossRef]
- Kalipci, E.; Cüce, H.; Ustaoğlu, F.; Dereli, M.A.; Türkmen, M. Toxicological health risk analysis of hazardous trace elements accumulation in the edible fish species of the Black Sea in Türkiye using multivariate statistical and spatial assessment. Environ. Toxicol. Pharmacol. 2023, 97, 104028. [Google Scholar] [CrossRef]
- Varol, M.; Şen, B. Assessment of surface water quality using multivariate statistical techniques: A case study of Behrimaz Stream, Turkey. Environ. Monit. Assess. 2009, 159, 543–553. [Google Scholar] [CrossRef]
- Otto, M. Multivariate Methods. In Analytical Chemistry; Kellner, R., Mermet, J., Otto, M., Widmer, H., Eds.; Wiley-VCH: Weinheim, Germany, 1998. [Google Scholar]
- Ward, J.H., Jr. Hierarchical grouping to optimize an objective function. J. Am. Stat. Assoc. 1963, 58, 236–244. [Google Scholar] [CrossRef]
- Shrestha, S.; Kazama, F. Assessment of surface water quality using multivariate statistical techniques: A case study of the Fuji river basin, Japan. Environ. Model. Softw. 2007, 22, 464–475. [Google Scholar] [CrossRef]
- Islam, M.A.; Das, B.; Quraishi, S.B.; Khan, R.; Naher, K.; Hossain, S.M.; Karmaker, S.; Latif, S.A.; Hossen, M.B. Heavy metal contamination and ecological risk assessment in water and sediments of the Halda river, Bangladesh: A natural fish breeding ground. Mar. Pollut. Bull. 2020, 160, 111649. [Google Scholar] [CrossRef]
- Genchi, G.; Lauria, G.; Catalano, A.; Carocci, A.; Sinicropi, M.S. The Double Face of Metals: The Intriguing Case of Chromium. Appl. Sci. 2021, 11, 638. [Google Scholar] [CrossRef]
- Maurya, P.; Kumari, R. Toxic metals distribution, seasonal variations and environmental risk assessment in surficial sediment and mangrove plants (A. marina), Gulf of Kachchh (India). J. Hazard. Mater. 2021, 413, 125345. [Google Scholar] [CrossRef]
- Mohiuddin, K.M.; Ogawa, Y.; Zakir, H.M.; Otomo, K.; Shikazono, N. Heavy metals contamination in water and sediments of an urban river in a developing country. Int. J. Environ. Sci. Technol. 2011, 8, 723–736. [Google Scholar] [CrossRef]
- Martin, S.; Griswold, W. Human health effects of heavy metals. Environ. Sci. Technol. Briefs Citiz. 2009, 15, 1–6. [Google Scholar]
- Islam, M.; Akther, S.M.; Hossain, F.; Parveen, Z. Spatial distribution and ecological risk assessment of potentially toxic metals in the Sundarbans mangrove soils of Bangladesh. Sci. Rep. 2022, 12, 10422. [Google Scholar] [CrossRef]
- Adani, P.; Sawale, A.A.; Nandhagopal, G. Bioaccumulation of heavy metals in the food components from water and sediments in the coastal waters of Kalpakkam, Southeast coast of India. Environ. Nanotechnol. Monit. Manag. 2022, 17, 100627. [Google Scholar] [CrossRef]
- Yang, C.; Yu, G.; Liu, Y.; Shan, B.; Wang, L.; Sun, D.; Huang, Y. Heavy Metal Distribution in Surface Sediments of the Coastal Pearl Bay, South China Sea. Processes 2022, 10, 822. [Google Scholar] [CrossRef]
- Rahman, M.; Saima, J.; Rima, S.A.; Hossain, I.S.; Das, D.K.; Abu Bakar, M.; Siddique, M.A.M. Ecological risks of heavy metals on surficial sediment of Nijhum Dweep (Island), an important biodiversity area of Bangladesh. Mar. Pollut. Bull. 2022, 179, 113688. [Google Scholar] [CrossRef] [PubMed]
- Rahman, M.S.; Ahmed, Z.; Seefat, S.M.; Alam, R.; Islam, A.R.M.T.; Choudhury, T.R.; Begum, B.A.; Idris, A.M. Assessment of heavy metal contamination in sediment at the newly established tannery industrial Estate in Bangladesh: A case study. Environ. Chem. Ecotoxicol. 2022, 4, 1–12. [Google Scholar] [CrossRef]
- Rakib, R.J.; Hossain, M.B.; Jolly, Y.N.; Akther, S.; Islam, S. EDXRF Detection of Trace Elements in Salt Marsh Sediment of Bangladesh and Probabilistic Ecological Risk Assessment. Soil Sediment Contam. Int. J. 2022, 31, 220–239. [Google Scholar] [CrossRef]
- Choudhury, T.R.; Acter, T.; Uddin, N.; Kamal, M.; Chowdhury, A.S.; Rahman, M.S. Heavy metals contamination of river water and sediments in the mangrove forest ecosystems in Bangladesh: A consequence of oil spill incident. Environ. Nanotechnol. Monit. Manag. 2021, 16, 100484. [Google Scholar] [CrossRef]
- Hossain, M.S.; Ahmed, M.K.; Liyana, E.; Hossain, M.S.; Jolly, Y.N.; Kabir, M.J.; Akter, S.; Rahman, M.S. A case study on metal contamination in water and sediment near a coal thermal power plant on the eastern coast of Bangladesh. Environments 2021, 8, 108. [Google Scholar] [CrossRef]
- Hossain, M.B.; Semme, S.A.; Ahmed, A.S.S.; Rahman, M.; Hossain, K.; Porag, G.S.; Parvin, A.; Shanta, T.B.; Senapathi, V.; Sekar, S. Contamination levels and ecological risk of heavy metals in sediments from the tidal river Halda, Bangladesh. Arab. J. Geosci. 2021, 14, 158. [Google Scholar] [CrossRef]
- Hasan, A.B.; Reza, A.H.M.; Kabir, S.; Siddique, M.; Bakar, A.; Ahsan, M.; Akbor, M. Accumulation and distribution of heavy metals in soil and food crops around the ship breaking area in southern Bangladesh and associated health risk assessment. SN Appl. Sci. 2020, 2, 155. [Google Scholar] [CrossRef]
- Rahman, M.S.; Hossain, M.B.; Babu, S.O.F.; Ahmed, A.S.; Jolly, Y.; Choudhury, T.; Begum, B.; Kabir, J.; Akter, S. Source of metal contamination in sediment, their ecological risk, and phytoremediation ability of the studied mangrove plants in ship breaking area, Bangladesh. Mar. Pollut. Bull. 2019, 141, 137–146. [Google Scholar] [CrossRef]
- Kabir, M.Z.; Deeba, F.; Majumder, R.K.; Khalil, M.I.; Islam, M.S. Heavy mineral distribution and geochemical studies of coastal sediments at Sonadia island, Bangladesh. Nucl. Sci. Appl. 2018, 27, 2. [Google Scholar]
- Islam, M.S.; Hossain, M.B.; Matin, A.; Sarker, M.S.I. Assessment of heavy metal pollution, distribution and source apportionment in the sediment from Feni River estuary, Bangladesh. Chemosphere 2018, 202, 25–32. [Google Scholar] [CrossRef]
- Ranjan, P.; Ramanathan, A.; Kumar, A.; Singhal, R.; Datta, D.; Venkatesh, M. Trace metal distribution, assessment and enrichment in the surface sediments of Sundarban mangrove ecosystem in India and Bangladesh. Mar. Pollut. Bull. 2018, 127, 541–547. [Google Scholar] [CrossRef]
- Rashid, T.; Hoque, S.; Akter, S. Pollution in the Bay of Bengal: Impact on Marine Ecosystem. Open J. Mar. Sci. 2015, 5, 55–63. [Google Scholar] [CrossRef]
- Hainan, C.H.E.N.; Zhang, C.; Guoqiang, L.I.U.; Qibin, L.A.O. Evaluation on Sediment Pollution and Potential Ecological Risks in Guangxi Beibu Gulf. Environ. Chem. 2022, 41, 2872–2879. [Google Scholar]
- Abidi, M.; Yahyaoui, A.; Ben Amor, R.; Chouba, L.; Gueddari, M. Evaluation of heavy metal pollution risk in surface sediment of the South Lagoon of Tunis by a sequential extraction procedure. Sci. Mar. 2022, 86, e028. [Google Scholar] [CrossRef]
- Huang, F.; Chen, C. GIS-based approach and multivariate statistical analysis for identifying sources of heavy metals in marine sediments from the coast of Hong Kong. Environ. Monit. Assess. 2023, 195, 518. [Google Scholar] [CrossRef]
- Lin, H.; Lan, W.; Feng, Q.; Zhu, X.; Li, T.; Zhang, R.; Song, H.; Zhu, Y.; Zhao, B. Pollution and ecological risk assessment, and source identification of heavy metals in sediment from the Beibu Gulf, South China Sea. Mar. Pollut. Bull. 2021, 168, 112403. [Google Scholar] [CrossRef]
- Ota, Y.; Suzuki, A.; Yamaoka, K.; Nagao, M.; Tanaka, Y.; Irizuki, T.; Fujiwara, O.; Yoshioka, K.; Kawagata, S.; Kawano, S.; et al. Geochemical distribution of heavy metal elements and potential ecological risk assessment of Matsushima Bay sediments during 2012–2016. Sci. Total Environ. 2021, 751, 141825. [Google Scholar] [CrossRef]
- Perumal, K.; Antony, J.; Muthuramalingam, S. Heavy metal pollutants and their spatial distribution in surface sediments from Thondi coast, Palk Bay, South India. Environ. Sci. Eur. 2021, 33, 63. [Google Scholar] [CrossRef]
- Agah, H. Ecological risk assessment of heavy metals in sediment, fish, and human hair from Chabahar Bay, Makoran, Iran. Mar. Pollut. Bull. 2021, 169, 112345. [Google Scholar] [CrossRef] [PubMed]
- Tham, T.T.; Lap, B.Q.; Mai, N.T.; Trung, N.T.; Thao, P.P.; Huong, N.T.L. Ecological Risk Assessment of Heavy Metals in Sediments of Duyen Hai Seaport Area in Tra Vinh Province, Vietnam. Water Air Soil Pollut. 2021, 232, 49. [Google Scholar] [CrossRef]
- Zhai, B.; Zhang, X.; Wang, L.; Zhang, Z.; Zou, L.; Sun, Z.; Jiang, Y. Concentration distribution and assessment of heavy metals in surface sediments in the Zhoushan Islands coastal sea, East China Sea. Mar. Pollut. Bull. 2021, 164, 112096. [Google Scholar] [CrossRef] [PubMed]
- Zhang, Q.; Ren, F.; Xiong, X.; Gao, H.; Wang, Y.; Sun, W.; Leng, P.; Li, Z.; Bai, Y. Spatial distribution and contamination assessment of heavy metal pollution of sediments in coastal reclamation areas: A case study in Shenzhen Bay, China. Environ. Sci. Eur. 2021, 33, 90. [Google Scholar] [CrossRef]
- Wu, M.-L.; Cheng, H.; Zhao, H.; Sun, F.-L.; Wang, Y.-T.; Yin, J.-P.; Fei, J.; Sun, C.-C.; Wang, Y.-S. Distribution patterns and source identification for heavy metals in Mirs Bay of Hong Kong in China. Ecotoxicology 2020, 29, 762–770. [Google Scholar] [CrossRef]
- Tan, I.; Aslan, E. Metal pollution status and ecological risk assessment in marine sediments of the inner Izmit Bay. Reg. Stud. Mar. Sci. 2020, 33, 100850. [Google Scholar] [CrossRef]
- Zhu, A.; Liu, J.; Qiao, S.; Zhang, H. Distribution and assessment of heavy metals in surface sediments from the Bohai Sea of China. Mar. Pollut. Bull. 2020, 153, 110901. [Google Scholar] [CrossRef]
- Yu, X.; Zhang, Z.; Feng, A.; Gu, D.; Zhang, R.; Xia, P.; Yan, W.; Zhou, X. Recent history of metal contamination in the Fangcheng Bay (Beibu Gulf, South China) utilizing spatially distributed sediment cores: Responding to local urbanization and industrialization. Mar. Pollut. Bull. 2020, 158, 111418. [Google Scholar] [CrossRef]
- Zhai, B.; Liu, Z.; Wang, X.; Bai, F.; Wang, L.; Chen, Z.; Zhang, X. Assessment of heavy metal contamination in surface sediments in the western Taiwan Strait. Mar. Pollut. Bull. 2020, 159, 111492. [Google Scholar] [CrossRef]
- Abbasi, A.; Mirekhtiary, F. Heavy metals and natural radioactivity concentration in sediments of the Mediterranean Sea coast. Mar. Pollut. Bull. 2020, 154, 111041. [Google Scholar] [CrossRef]
- Ye, Z.; Chen, J.; Gao, L.; Liang, Z.; Li, S.; Li, R.; Jin, G.; Shimizu, Y.; Onodera, S.-I.; Saito, M.; et al. 210Pb dating to investigate the historical variations and identification of different sources of heavy metal pollution in sediments of the Pearl River Estuary, Southern China. Mar. Pollut. Bull. 2020, 150, 110670. [Google Scholar] [CrossRef]
- Ogundele, L.T.; Ayeku, P.O. Source apportionment and associated potential ecological risk assessment of heavy metals in coastal marine sediments samples in Ondo, Southwest, Nigeria. Stoch. Environ. Res. Risk Assess. 2020, 34, 2013–2022. [Google Scholar] [CrossRef]
- Suami, R.B.; Sivalingam, P.; Al Salah, D.M.; Grandjean, D.; Mulaji, C.K.; Mpiana, P.T.; Breider, F.; Otamonga, J.-P.; Poté, J. Heavy metals and persistent organic pollutants contamination in river, estuary, and marine sediments from Atlantic Coast of Democratic Republic of the Congo. Environ. Sci. Pollut. Res. 2020, 27, 20000–20013. [Google Scholar] [CrossRef]
- Joksimović, D.; Perošević, A.; Castelli, A.; Pestorić, B.; Šuković, D.; Đurović, D. Assessment of heavy metal pollution in surface sediments of the Montenegrin coast: A 10-year review. J. Soils Sediments 2020, 20, 2598–2607. [Google Scholar] [CrossRef]
- Nour, H.E.; El-Sorogy, A.S. Heavy metals contamination in seawater, sediments and seashells of the Gulf of Suez, Egypt. Environ. Earth Sci. 2020, 79, 274. [Google Scholar] [CrossRef]
- Tian, K.; Wu, Q.; Liu, P.; Hu, W.; Huang, B.; Shi, B.; Zhou, Y.; Kwon, B.-O.; Choi, K.; Ryu, J.; et al. Ecological risk assessment of heavy metals in sediments and water from the coastal areas of the Bohai Sea and the Yellow Sea. Environ. Int. 2020, 136, 105512. [Google Scholar] [CrossRef]
- Zhao, M.; Wang, E.; Xia, P.; Feng, A.; Chi, Y.; Sun, Y. Distribution and pollution assessment of heavy metals in the intertidal zone environments of typical sea areas in China. Mar. Pollut. Bull. 2019, 138, 397–406. [Google Scholar] [CrossRef]
- Tanjung, R.H.R.; Hamuna, B.; Yonas, M.N. Assessing Heavy Metal Contamination in Marine Sediments Around the Coastal Waters of Mimika Regency, Papua Province, Indonesia. J. Ecol. Eng. 2019, 20, 35–42. [Google Scholar] [CrossRef]
- Chang, C.-Y.; Chen, S.-Y.; Klipkhayai, P.; Chiemchaisri, C. Bioleaching of heavy metals from harbor sediment using sulfur-oxidizing microflora acclimated from native sediment and exogenous soil. Environ. Sci. Pollut. Res. 2019, 26, 6818–6828. [Google Scholar] [CrossRef]
- Ben Amor, R.; Yahyaoui, A.; Abidi, M.; Chouba, L.; Gueddari, M. Bioavailability and Assessment of Metal Contamination in Surface Sediments of Rades-Hamam Lif Coast, around Meliane River (Gulf of Tunis, Tunisia, Mediterranean Sea). J. Chem. 2019, 2019, 4284987. [Google Scholar] [CrossRef]
- Zhang, M.; He, P.; Qiao, G.; Huang, J.; Yuan, X.; Li, Q. Heavy metal contamination assessment of surface sediments of the Subei Shoal, China: Spatial distribution, source apportionment and ecological risk. Chemosphere 2019, 223, 211–222. [Google Scholar] [CrossRef] [PubMed]
- Liu, B.; Wang, J.; Xu, M.; Zhao, L.; Wang, Z. Spatial distribution, source apportionment and ecological risk assessment of heavy metals in the sediments of Haizhou Bay national ocean park, China. Mar. Pollut. Bull. 2019, 149, 110651. [Google Scholar] [CrossRef]
- Li, L.; Jiang, M.; Liu, Y.; Shen, X. Heavy metals inter-annual variability and distribution in the Yangtze River estuary sediment, China. Mar. Pollut. Bull. 2019, 141, 514–520. [Google Scholar] [CrossRef] [PubMed]
- Xu, Y.; Jiang, T.; Yang, Q.; Zhao, J.; Qu, K.M. Distribution characteristics and pollution assessment of heavy metals in the surface sediments of the central region of the Bohai Sea during the summer. Prog. Fish. Sci. 2019, 40, 52–61. [Google Scholar]
- Gu, Y.-G.; Gao, Y.-P. An unconstrained ordination- and GIS-based approach for identifying anthropogenic sources of heavy metal pollution in marine sediments. Mar. Pollut. Bull. 2019, 146, 100–105. [Google Scholar] [CrossRef]
- Lao, Q.; Su, Q.; Liu, G.; Shen, Y.; Chen, F.; Lei, X.; Qing, S.; Wei, C.; Zhang, C.; Gao, J. Spatial distribution of and historical changes in heavy metals in the surface seawater and sediments of the Beibu Gulf, China. Mar. Pollut. Bull. 2019, 146, 427–434. [Google Scholar] [CrossRef]
- Gholizadeh, M.; Patimar, R. Ecological risk assessment of heavy metals in surface sediments from the Gorgan Bay, Caspian Sea. Mar. Pollut. Bull. 2018, 137, 662–667. [Google Scholar] [CrossRef]
- Ding, X.; Ye, S.; Yuan, H.; Krauss, K.W. Spatial distribution and ecological risk assessment of heavy metals in coastal surface sediments in the Hebei Province offshore area, Bohai Sea, China. Mar. Pollut. Bull. 2018, 131, 655–661. [Google Scholar] [CrossRef]
- Liang, X.; Song, J.; Duan, L.; Yuan, H.; Li, X.; Li, N.; Qu, B.; Wang, Q.; Xing, J. Source identification and risk assessment based on fractionation of heavy metals in surface sediments of Jiaozhou Bay. China Mar. Pollut. Bull. 2018, 128, 548–556. [Google Scholar] [CrossRef]
- Gu, Y.-G. Heavy metal fractionation and ecological risk implications in the intertidal surface sediments of Zhelin Bay, South China. Mar. Pollut. Bull. 2018, 129, 905–912. [Google Scholar] [CrossRef]
- Chen, F.; Lin, J.; Qian, B.; Wu, Z.; Huang, P.; Chen, K.; Li, T.; Cai, M. Geochemical Assessment and Spatial Analysis of Heavy Metals in the Surface Sediments in the Eastern Beibu Gulf: A Reflection on the Industrial Development of the South China Coast. Int. J. Environ. Res. Public Health 2018, 15, 496. [Google Scholar] [CrossRef]
- Kahal, A.Y.; El-Sorogy, A.S.; Alfaifi, H.J.; Almadani, S.; Ghrefat, H.A. Spatial distribution and ecological risk assessment of the coastal surface sediments from the Red Sea, northwest Saudi Arabia. Mar. Pollut. Bull. 2018, 137, 198–208. [Google Scholar] [CrossRef]
- El-Sorogy, A.; Al-Kahtany, K.; Youssef, M.; Al-Kahtany, F.; Al-Malky, M. Distribution and metal contamination in the coastal sediments of Dammam Al-Jubail area, Arabian Gulf, Saudi Arabia. Mar. Pollut. Bull. 2018, 128, 8–16. [Google Scholar] [CrossRef]
- Hariri, M.S.B.; Abu-Zied, R.H. Factors influencing heavy metal concentrations in the bottom sediments of the Al-Kharrar Lagoon and Salman Bay, eastern Red Sea coast, Saudi Arabia. Arab. J. Geosci. 2018, 11, 495. [Google Scholar] [CrossRef]
- Tang, H.; Ke, Z.; Yan, M.; Wang, W.; Nie, H.; Li, B.; Zhang, J.; Xu, X.; Wang, J. Concentrations, Distribution, and Ecological Risk Assessment of Heavy Metals in Daya Bay, China. Water 2018, 10, 780. [Google Scholar] [CrossRef]
- Rao, Q.; Sun, Z.; Tian, L.; Li, J.; Sun, W.; Sun, W. Assessment of arsenic and heavy metal pollution and ecological risk in inshore sediments of the Yellow River estuary, China. Stoch. Environ. Res. Risk Assess. 2018, 32, 2889–2902. [Google Scholar] [CrossRef]
- Zhao, Y.; Xu, M.; Liu, Q.; Wang, Z.; Zhao, L.; Chen, Y. Study of heavy metal pollution, ecological risk and source apportionment in the surface water and sediments of the Jiangsu coastal region, China: A case study of the Sheyang Estuary. Mar. Pollut. Bull. 2018, 137, 601–609. [Google Scholar] [CrossRef]
- Zhao, B.; Wang, X.; Jin, H.; Feng, H.; Shen, G.; Cao, Y.; Yu, C.; Lu, Z.; Zhang, Q. Spatiotemporal variation and potential risks of seven heavy metals in seawater, sediment, and seafood in Xiangshan Bay, China (2011–2016). Chemosphere 2018, 212, 1163–1171. [Google Scholar] [CrossRef]
- Bibak, M.; Sattari, M.; Agharokh, A.; Tahmasebi, S.; Namin, J.I. Assessing some heavy metals pollutions in sediments of the northern Persian Gulf (Bushehr province). Environ. Health Eng. Manag. 2018, 5, 175–179. [Google Scholar] [CrossRef]
- El-Taher, A.; Zakaly, H.M.; Elsaman, R. Environmental implications and spatial distribution of natural radionuclides and heavy metals in sediments from four harbours in the Egyptian Red Sea coast. Appl. Radiat. Isot. 2018, 131, 13–22. [Google Scholar] [CrossRef] [PubMed]
- Birch, G.; Taylor, S.; Matthai, C. Small-scale spatial and temporal variance in the concentration of heavy metals in aquatic sediments: A review and some new concepts. Environ. Pollut. 2001, 113, 357–372. [Google Scholar] [CrossRef] [PubMed]
- Yunus, K.; Zuraidah, M.; John, A. A review on the accumulation of heavy metals in coastal sediment of Peninsular Malaysia. Ecofeminism Clim. Chang. 2020, 1, 21–35. [Google Scholar] [CrossRef]
- Singh, R.; Gautam, N.; Mishra, A.; Gupta, R. Heavy metals and living systems: An overview. Indian J. Pharmacol. 2011, 43, 246–253. [Google Scholar] [CrossRef]
- Al-Fartusie, F.S.; Mohssan, S.N. Essential trace elements and their vital roles in the human body. Indian J. Adv. Chem. Sci. 2017, 5, 127–136. [Google Scholar]
- USEPA. Screening Level Ecological Risk Assessment Protocol for Hazardous Waste Combustion Facilities; Appendix E Toxicity Ref Values; USEPA: Washington, DC, USA, 1999; Volume 3.
- Turekian, K.K.; Wedepohl, K.H. Distribution of the elements in some major units of the earth’s crust. Geol. Soc. Am. Bull. 1961, 72, 175–192. [Google Scholar] [CrossRef]
- Barg, U.C. Guidelines for the Promotion of Environmental Management of Coastal Aquaculture Development; Food & Agriculture Organization: Rome, Italy, 1992; Volume 328. [Google Scholar]
- Fan, Y.; Chen, X.; Chen, Z.; Zhou, X.; Lu, X.; Liu, J. Pollution characteristics and source analysis of heavy metals in surface sediments of Luoyuan Bay, Fujian. Environ. Res. 2022, 203, 111911. [Google Scholar] [CrossRef]
- Kanwar, V.S.; Sharma, A.; Srivastav, A.L.; Rani, L. Phytoremediation of toxic metals present in soil and water environment: A critical review. Environ. Sci. Pollut. Res. 2020, 27, 44835–44860. [Google Scholar] [CrossRef]
- Cempel, M.; Nikel, G.J.P.J.S. Nickel: A review of its sources and environmental toxicology. Pol. J. Environ. Stud. 2006, 15, 375–382. [Google Scholar]
- Neves, A.; Godina, R.; Azevedo, S.G.; Matias, J.C.O. A comprehensive review of industrial symbiosis. J. Clean. Prod. 2020, 247, 119113. [Google Scholar] [CrossRef]
- Abioye, O.P.; Loto, C.A.; Fayomi, O.S.I. Evaluation of Anti-biofouling Progresses in Marine Application. J. Bio- Tribo-Corros. 2019, 5, 22. [Google Scholar] [CrossRef]
- Kambe, T.; Tsujimura, N.; Hashimoto, A.; Itsumura, N.; Nakagawa, M.; Miyazaki, S.; Kizu, K.; Goto, T.; Komatsu, Y.; Matsunaga, A.; et al. The Physiological, Biochemical, and Molecular Roles of Zinc Transporters in Zinc Homeostasis and Metabolism. Physiol. Rev. 2015, 95, 749–784. [Google Scholar] [CrossRef]
- Giannakoula, A.; Therios, I.; Chatzissavvidis, C. Effect of lead and copper on photosynthetic apparatus in citrus (Citrus aurantium L.) plants. The role of antioxidants in oxidative damage as a response to heavy metal stress. Plants 2021, 10, 155. [Google Scholar] [CrossRef]
- Fasae, K.D.; Abolaji, A.O. Interactions and toxicity of non-essential heavy metals (Cd, Pb and Hg): Lessons from Drosophila melanogaster. Curr. Opin. Insect Sci. 2022, 51, 100900. [Google Scholar] [CrossRef]
- Whiteside, M.; Herndon, J.M. Role of aerosolized coal fly ash in the global plankton imbalance: Case of Florida’s toxic algae crisis. Asian J. Biol. 2019, 8, 1–24. [Google Scholar] [CrossRef]
- Gopal, V.; Krishnamurthy, R.R.; Vignesh, R.; SabariNathan, C.; Anshu, R.; Kalaivanan, R.; Mohana, P.; Magesh, N.S. Heavy metal pollution in the surface sediments off the Vedaranyam coast, Southern India. Res. Sq. 2022, preprint. [Google Scholar]
- Jonathan, M.P.; Ram-Mohan, V.; Srinivasalu, S. Geochemical variations of major and trace elements in recent sediments, off the Gulf of Mannar, the southeast coast of India. Environ. Geol. 2004, 45, 466–480. [Google Scholar] [CrossRef]
- Liaghati, T.; Preda, M.; Cox, M. Heavy metal distribution and controlling factors within coastal plain sediments, Bells Creek catchment, southeast Queensland, Australia. Environ. Int. 2004, 29, 935–948. [Google Scholar] [CrossRef]
- Boughriet, A.; Proix, N.; Billon, G.; Recourt, P.; Ouddane, B. Environmental Impacts of Heavy Metal Discharges from a Smelter in Deûle-canal Sediments (Northern France): Concentration Levels and Chemical Fractionation. Water Air Soil Pollut. 2007, 180, 83–95. [Google Scholar] [CrossRef]
- Ke, X.; Gui, S.; Huang, H.; Zhang, H.; Wang, C.; Guo, W. Ecological risk assessment and source identification for heavy metals in surface sediment from the Liaohe River protected area, China. Chemosphere 2017, 175, 473–481. [Google Scholar] [CrossRef]
- Islam, M.S.; Ahmed, M.K.; Habibullah-Al-Mamun, M.; Hoque, M.F. Preliminary assessment of heavy metal contamination in surface sediments from a river in Bangladesh. Environ. Earth Sci. 2015, 73, 1837–1848. [Google Scholar] [CrossRef]
- Hassan, M.; Tanvir Rahman, M.A.T.M.; Saha, B.; Kamal, A.K.I. Status of Heavy Metals in Water and Sediment of the Meghna River, Bangladesh. Am. J. Environ. Sci. 2015, 11, 427–439. [Google Scholar] [CrossRef]
- Suresh, G.; Sutharsan, P.; Ramasamy, V.; Venkatachalapathy, R. Assessment of spatial distribution and potential ecological risk of the heavy metals in relation to granulometric contents of Veeranam lake sediments, India. Ecotoxicol. Environ. Saf. 2012, 84, 117–124. [Google Scholar] [CrossRef] [PubMed]
- Tomlinson, D.L.; Wilson, J.G.; Harris, C.R.; Jeffrey, D.W. Problems in the assessment of heavy-metal levels in estuaries and the formation of a pollution index. Helgoländer Meeresunters. 1980, 33, 566–575. [Google Scholar] [CrossRef]
- Karydas, C.G.; Tzoraki, O.; Panagos, P. A New Spatiotemporal Risk Index for Heavy Metals: Application in Cyprus. Water 2015, 7, 4323–4342. [Google Scholar] [CrossRef]
- El-Alfy, M.A.; Darwish, D.; El-Amier, Y.A. Land use Land cover of the Burullus Lake shoreline (Egypt) and health risk assessment of metal-contaminated sediments. Hum. Ecol. Risk Assess. Int. J. 2021, 27, 898–920. [Google Scholar] [CrossRef]
- Chonokhuu, S.; Batbold, C.; Chuluunpurev, B.; Battsengel, E.; Dorjsuren, B.; Byambaa, B. Contamination and Health Risk Assessment of Heavy Metals in the Soil of Major Cities in Mongolia. Int. J. Environ. Res. Public Health 2019, 16, 2552. [Google Scholar] [CrossRef]
- Hu, B.; Jia, X.; Hu, J.; Xu, D.; Xia, F.; Li, Y. Assessment of Heavy Metal Pollution and Health Risks in the Soil-Plant-Human System in the Yangtze River Delta, China. Int. J. Environ. Res. Public Health 2017, 14, 1042. [Google Scholar] [CrossRef]
- Ahmed, A.S.S.; Hossain, M.B.; Semme, S.A.; Babu, S.M.O.F.; Hossain, K.; Moniruzzaman, M. Accumulation of trace elements in selected fish and shellfish species from the largest natural carp fish breeding basin in Asia: A probabilistic human health risk implication. Environ. Sci. Pollut. Res. 2020, 27, 37852–37865. [Google Scholar] [CrossRef]
- Shikazono, N.; Tatewaki, K.; Mohiuddin, K.M.; Nakano, T.; Zakir, H.M. Sources, spatial variation, and speciation of heavy metals in sediments of the Tamagawa River in Central Japan. Environ. Geochem. Health 2012, 34, 13–26. [Google Scholar] [CrossRef]
- Yang, Z.; Wang, Y.; Shen, Z.; Niu, J.; Tang, Z. Distribution and speciation of heavy metals in sediments from the mainstream, tributaries, and lakes of the Yangtze River catchment of Wuhan, China. J. Hazard. Mater. 2009, 166, 1186–1194. [Google Scholar] [CrossRef]
- Sundaray, S.K.; Nayak, B.B.; Lin, S.; Bhatta, D. Geochemical speciation and risk assessment of heavy metals in the river estuarine sediments—A case study: Mahanadi basin, India. J. Hazard. Mater. 2011, 186, 1837–1846. [Google Scholar] [CrossRef]
- Chung, C.-Y.; Chen, J.-J.; Lee, C.-G.; Chiu, C.-Y.; Lai, W.-L.; Liao, S.-W. Integrated estuary management for diffused sediment pollution in Dapeng Bay and neighboring rivers (Taiwan). Environ. Monit. Assess. 2011, 173, 499–517. [Google Scholar] [CrossRef]
- Bera, A.; Meraj, G.; Kanga, S.; Farooq, M.; Singh, S.K.; Sahu, N.; Kumar, P. Vulnerability and Risk Assessment to Climate Change in Sagar Island, India. Water 2022, 14, 823. [Google Scholar] [CrossRef]
- Singh, S.; Singh, S.K.; Prajapat, D.K.; Pandey, V.; Kanga, S.; Kumar, P.; Meraj, G. Assessing the Impact of the 2004 Indian Ocean Tsunami on South Andaman’s Coastal Shoreline: A Geospatial Analysis of Erosion and Accretion Patterns. J. Mar. Sci. Eng. 2023, 11, 1134. [Google Scholar] [CrossRef]
- Meraj, G.; Kanga, S.; Kranjčić, N.; Đurin, B.; Singh, S.K. Role of Natural Capital Economics for Sustainable Management of Earth Resources. Earth 2021, 2, 622–634. [Google Scholar] [CrossRef]
- Debnath, J.; Meraj, G.; Das Pan, N.; Chand, K.; Debbarma, S.; Sahariah, D.; Gualtieri, C.; Kanga, S.; Singh, S.K.; Farooq, M.; et al. Integrated remote sensing and field-based approach to assess the temporal evolution and future projection of meanders: A case study on River Manu in North-Eastern India. PLoS ONE 2022, 17, e0271190. [Google Scholar] [CrossRef]
- Bera, A.; Taloor, A.K.; Meraj, G.; Kanga, S.; Singh, S.K.; Đurin, B.; Anand, S. Climate vulnerability and economic determinants: Linkages and risk reduction in Sagar Island, India; A geospatial approach. Quat. Sci. Adv. 2021, 4, 100038. [Google Scholar] [CrossRef]
- Meraj, G.; Singh, S.K.; Kanga, S.; Islam, N. Modeling on comparison of ecosystem services concepts, tools, methods and their ecological-economic implications: A review. Model. Earth Syst. Environ. 2021, 8, 15–34. [Google Scholar] [CrossRef]
- Naser, H.A. Assessment and management of heavy metal pollution in the marine environment of the Arabian Gulf: A review. Mar. Pollut. Bull. 2013, 72, 6–13. [Google Scholar] [CrossRef]
- Lakshmi, E.; Priya, M.; Achari, V.S. An overview on the treatment of ballast water in ships. Ocean Coast. Manag. 2021, 199, 105296. [Google Scholar] [CrossRef]
- Clausen, A.; Vu, H.H.; Pedrono, M. An evaluation of the environmental impact assessment system in Vietnam: The gap between theory and practice. Environ. Impact Assess. Rev. 2011, 31, 136–143. [Google Scholar] [CrossRef]
- Chowdhury, P.A.; Ali, M.M.; Shahjahan, A.T. Impacts of Ship Breaking Industries on Environment and Socio-Economic Condition of Bangladesh-A Case Study of Sitakunda Shitolpur Ship Breaking Yard, Chittagong. Doctoral Dissertation, Chittagong University of Engineering & Technology, Chattogram, Bangladesh, 2015. [Google Scholar]


| Heavy Metals | Wave Length (nm) | Lamp Current (mA) | Slit (nm) | Detection Limit (mg/L) | Calibration Range (mg/L) |
|---|---|---|---|---|---|
| Cr | 357.9 | 12 | 0.5 | 0.25–2.0 | Flame-AAS |
| Cu | 324.8 | 5 | 0.5 | 0.25–2.0 | Flame-AAS |
| Ni | 232.0 | 15 | 0.2 | 0.25–2.0 | Flame-AAS |
| Mn | 279.5 | 12 | 0.2 | 0.25–2.0 | Flame-AAS |
| Zn | 213.9 | 10 | 0.2 | 0.25–2.0 | Flame-AAS |
| Pb | 217.0 | 10 | 0.5 | 0.25–2.0 | Flame-AAS |
| Fe | 248.3 | 15 | 0.2 | 0.25–2.0 | Flame-AAS |
| Classification | Contamination Degree |
|---|---|
| Igeo less than 0 | Practically uncontaminated |
| 0 less than or equivalent Igeo less than 1 | Uncontaminated to moderately contaminated |
| 1 less than or equivalent Igeo less than 2 | Moderately contaminated |
| 2 less than or equivalent Igeo less than 3 | Moderately to heavily contaminated |
| 3 less than or equivalent Igeo less than 4 | Heavily contaminated |
| 4 less than or equivalent Igeo less than 5 | Heavily to extremely contaminated |
| Igeo greater than or equivalent to 5 | Extremely contaminated |
| Sites | Cr | Cu | Ni | Mn | Zn | Pb | Fe | Country | References |
|---|---|---|---|---|---|---|---|---|---|
| National | |||||||||
| Saint Martin’s Island | 8.91 | 3.76 | 29.6 | 269.5 | 27.17 | 5.88 | 143.8 | Bangladesh | Present study |
| Nijhum Dweep | 7.2 | 37 | 9.26 | 95.2 | 20.7 | 5.63 | 4706.2 | Bangladesh | [53] |
| Sitakunda shipbreaking area | 121.9 | na | na | na | na | 65.3 | na | Bangladesh | [2] |
| Dhaleshwari River | 186 | 1.76 | 3.12 | 8.78 | 42.7 | Bangladesh | [54] | ||
| Sundarbans | 48.8 | 41.8 | 103.95 | 803.14 | 72.1 | 39.1 | 38,432.5 | Bangladesh | [49] |
| Hatiya and Chairman Ghat and ship-breaking yards | na | 42.9 | na | na | 41.7 | 5.48 | 31,658 | Bangladesh | [55] |
| Sundarbans Sela River | 40.11 | 33.7 | na | 476.6 | 74.4 | 26.6 | 30,255 | Bangladesh | [56] |
| Kutubdia Channel | 10.7–12.2 | 145.6–135.4 | na | 570.7–606.3 | 149.8–146.9 | 21.6–23.9 | 2317.1–2434.7 | Bangladesh | [57] |
| Halda river | 31.9 | 31.9 | 26.7 | na | 71.9 | 20.5 | na | Bangladesh | [58] |
| Meghna River estuary | 10.6 | 6.22 | na | na | 42.4 | 12.5 | 1290 | Bangladesh | [58] |
| Sitakunda shipbreaking area | 64.6 | 255.4 | 54.2 | 1084.7 | 1226.3 | 68.3 | 93,015.1 | Bangladesh | [59] |
| Halda river | 23.8 | 9.44 | 100 | 24 | 24.5 | 3320 | [45] | ||
| St. Martin’s Island | <5.0–30.1 | <3.0–30.9 | <4.0–48.3 | na | 24.1–88.0 | <10.0–37.5 | na | Bangladesh | [45] |
| Sangu River estuary | 25.1 | 29.2 | 32.8 | na | 89 | 19.6 | na | Bangladesh | [12] |
| Shipbreaking area | 7.95–19.2 | 15.4–22.0 | BDL | na | 124.3–176.4 | 65.5–116.9 | 62,990–75,210 | Bangladesh | [60] |
| Brahmaputra River | 6.6 | 6.2 | 12.8 | 162.2 | 52.7 | 7.6 | na | Bangladesh | [7] |
| Sonadia Island | na | 18.1 | 16 | 390.73 | 38.8 | 9.03 | 15,127 | Bangladesh | [61] |
| Feni River estuary | 35.3 | na | 33.3 | 37.9 | na | 6.47 | na | Bangladesh | [62] |
| Sundarban | 56.9–78.6 | 28.7–41.2 | 26.3–39.2 | 400–700 | 55.9–77.3 | 33.4–48.0 | 26,000–35,000 | Bangladesh | [63] |
| Bay of Bengal coast | 14.5 | na | 16.3 | na | 184.6 | 12.7 | 316.1 | Bangladesh | [64] |
| International | |||||||||
| Coastal Pearl Bay | 35.8 | 24.2 | na | na | 48.5 | 31.3 | na | China | [51] |
| Kalpakkam coast | 6.48–8.86 | 3.59–5.07 | na | 1.83–2.77 | 8.34–10.7 | 0.32–0.60 | 3067.4–4545.7 | India | [50] |
| Beibu Gulf | na | 11.2 | na | na | 27.8 | 18.9 | na | China | [65] |
| South Lagoon | 99.8 | 27.3 | 71.8 | na | 148.5 | 102.2 | 41,727.2 | Tunisia | [66] |
| Hong Kong coast | 37.6 | 66.9 | 21.8 | na | 172.1 | 51.7 | 29,295.7 | Hong Kong | [67] |
| Beibu Gulf | 2.1–51 | 0.7–73 | na | na | 3.5–161 | 2.4–62 | na | China | [68] |
| Matsushima Bay | 28.5 | 11.8 | 859.8 | 134.8 | 21.6 | 38,900 | Japan | [69] | |
| Palk Bay | 290.3 | 54.7 | 27.7 | 686.1 | 252.9 | 14.1 | 52,802.3 | India | [70] |
| Chabahar Bay | 92.3 | 14.1 | 58 | 422 | 39.6 | 9.2 | 3.11 | Iran | [71] |
| Duyen Hai Seaport | 5.11 | na | na | 149 | 72.6 | na | Vietnam | [72] | |
| Zhoushan Islands | 74.5 | 67.8 | na | na | 107.8 | 33.9 | na | China | [73] |
| Shenzhen Bay | 40.6 | 50.8 | na | na | 175.8 | 37.1 | na | China | [74] |
| Mirs Bay | 20–38 | 8–42 | na | na | 55–290 | 26–99 | na | China | [75] |
| Izmit Bay | 74.9 | 79.6 | 42.1 | na | 211.1 | 21 | 45,700 | China | [76] |
| Bohai Bay | 72.4 | 28 | na | na | 87.6 | 24.3 | na | China | [77] |
| Fangcheng Bay | 28.5 | 20.5 | na | na | 62.4 | 43.5 | na | China | [78] |
| Western Taiwan Strait | 86.89 | 22.8 | 31.3 | na | 64 | 18.3 | na | Taiwan | [79] |
| Mediterranean Sea | 15–93 | 11–49 | na | na | 26–72 | 11–22 | na | Turkey | [80] |
| Pearl River Estuary | 79.8 | 38.1 | na | na | 121.8 | 44.8 | na | China | [81] |
| Ondo coastal area (Awoye) | 0.92 | 3.21 | 6.69 | 2.77 | 7.27 | 14.5 | 23.6 | Nigeria | [82] |
| Ondo coastal area (Ayetoro) | 8.93 | 5.45 | 12.3 | 2.59 | 8.36 | 18.2 | 25.3 | Nigeria | [82] |
| Ondo coastal area (Abereke) | 21.1 | 13.4 | 17.2 | 1.84 | 19.3 | 15.9 | 20.4 | Nigeria | [82] |
| Atlantic Coast | 187 | 217 | 30 | na | 687 | 125 | na | Congo | [83] |
| Montenegrin coast | 97.6 | 154 | 83.3 | 634 | 234 | 70.3 | 23,400 | Montenegro | [84] |
| Gulf of Suez | 55.5 | 5.07 | 2.89 | na | 22.4 | 17.3 | 2384 | Egypt | [85] |
| Bohai Sea | 60.4 | 23.1 | 23.1 | na | 79 | 26.3 | na | China | [86] |
| Yellow Sea | 49.4 | 22.5 | 24.9 | na | 78.7 | 26.1 | na | China | [86] |
| Yellow Sea | 31 | 16.9 | 21.8 | na | 71.8 | 31 | na | South Korea | [86] |
| Liaodong Bay | 53 | 18.5 | 23.5 | na | 64.7 | 24.9 | na | China | [77] |
| Bohai Bay | 72.4 | 28 | 33 | na | 87.6 | 24.3 | na | China | [77] |
| Laizhou Bay | 61.4 | 18.6 | 26.7 | na | 57.2 | 20.7 | na | China | [77] |
| Bohai Sea | 14.4–88.3 | 3.36–30.1 | na | na | 24.0–99.8 | 11.9–28.1 | na | China | [87] |
| Yellow Sea | 0–88.8 | 2.98–24.6 | na | na | 8.84–70.1 | 18.6–26.5 | na | China | [87] |
| East China Sea | 38.4–95.9 | 17.4–43.4 | na | na | 86.6–180.6 | 24.2–74.3 | na | China | [87] |
| South China Sea | 14.4–35.3 | 2.21–16.7 | na | na | 8.47–64.4 | 4.81–63.9 | na | China | [87] |
| Mimika | na | <0.02–0.54 | na | na | <0.25–0.59 | na | Indonesia | [88] | |
| Kaohsiung Harbor | 127 | 687 | 56 | na | 960 | 83 | na | Taiwan | [89] |
| Gulf of Tunis | 15–55 | 1.5–19 | 14–51 | na | 27–450 | 16–107 | na | Tunisia | [90] |
| Subei shoal | 19.2 | 11.3 | 47.9 | na | 38.2 | 0.13 | na | China | [91] |
| Haizhou Bay | 76.4 | 32 | na | na | 78.3 | 28 | na | China | [92] |
| Yangtze River Estuary | na | 26.6 | na | na | 63.9 | 21.7 | na | China | [93] |
| Bohai Sea | na | 6.7–34.6 | na | na | 28.7–61.2 | 8.7–32.3 | na | China | [94] |
| Bohai Sea | 89–219.1 | 38.1–61.9 | na | na | na | 42.8–73.6 | na | China | [93] |
| Red Sea coast | na | 9.43 | 17.5 | 198.8 | 44.2 | 11.4 | 8451.6 | Egypt | [85] |
| Pearl River Estuary | 39.3 | 88.7 | 20.4 | na | 146 | 47.9 | na | Hong Kong | [95] |
| Beibu Gulf | 44.4 | 15.1 | na | na | 52.4 | 14.6 | na | China | [96] |
| Coromandel Coast | 109.5 | 76.5 | na | na | 78.76 | 49.6 | na | India | [11] |
| Gorgan Bay | 17.9 | 16.8 | 16.6 | na | 29.5 | 7.4 | na | Iran | [97] |
| Bohai Bay | 48.8 | 16.1 | na | na | 50 | 19.4 | na | China | [98] |
| Jiaozhou Bay | na | 27.3 | na | na | 76 | 38.5 | na | China | [99] |
| Zhelin Bay | 23.1 | 7.95 | 7.5 | na | 75 | 35.7 | na | China | [100] |
| Eastern Beibu Gulf | 46.2 | 27 | na | na | 80.1 | 16.4 | na | China | [101] |
| Red Sea coast | 20.2 | 18.7 | 13.7 | na | 16.8 | 3.5 | 1413 | Saudi Arabia | [102] |
| Arabian Gulf | 64 | 297 | 77 | 112 | 48.3 | 5.3 | 8474 | Saudi Arabia | [103] |
| Al-Kharrar Lagoon | na | 22.4 | 26.9 | 328.9 | 23.6 | 0.05 | 18,730 | Saudi Arabia | [104] |
| Salman Bay | na | 7.45 | 2.72 | 94 | 8.9 | 0.14 | 6150 | Saudi Arabia | [104] |
| Daya Bay | 108.7 | 24.1 | 26.8 | na | 108.9 | 35.3 | na | Saudi Arabia | [105] |
| Yellow River estuary | 61.6 | 29.4 | 27.3 | na | 71.3 | 24.6 | na | China | [106] |
| Coramandal Coast | 85.3 | 54.7 | 16 | na | 31.4 | 18.8 | 32,059.3 | India | [11] |
| Sheyang Estuary | 37.2 | 23.5 | na | na | 62.2 | 16.9 | na | China | [107] |
| Xiangshan Bay | 81.7 | 36.8 | na | na | 121 | 38.5 | na | China | [108] |
| Persian Gulf | 10.2–16.8 | 3.45–5.50 | 8.19–18.1 | na | 4.75–14.2 | 2.77–12.3 | 773.5–8420 | Iran | [109] |
| Quseir Harbor | na | 35.8 | 51 | 736.8 | 79.6 | 48.2 | 12,003 | Egypt | [110] |
| Abutartour Harbor | na | 46.7 | 62 | 653.3 | 91.7 | 63.3 | 15,333 | Egypt | [110] |
| Touristic Harbor | na | 21.3 | 32 | 322.3 | 47.7 | 39 | 15,433 | Egypt | [110] |
| Crustal value | 100 | 55 | 75 | 950 | 70 | 12.5 | 56,300 | Egypt | [111] |
| Metals | CDI | HQ | HI | CR | TCR | ||||||
|---|---|---|---|---|---|---|---|---|---|---|---|
| Inhalation | Dermal | Ingestion | Inhalation | Dermal | Ingestion | Inhalation | Dermal | Ingestion | |||
| Adults | |||||||||||
| Cr | 6.47 × 10⁻⁹ | 4.87 × 10⁻⁸ | 1.22 × 10⁻⁵ | 2.16 × 10⁻⁶ | 1.62 × 10⁻⁵ | 4.07 × 10⁻³ | 4.09 × 10⁻³ | 3.23 × 10⁻⁹ | 2.43 × 10⁻⁸ | 6.10 × 10⁻⁶ | 6.13 × 10⁻⁶ |
| Pb | 4.27 × 10⁻⁹ | 3.22 × 10⁻⁸ | 8.06 × 10⁻⁶ | 1.22 × 10⁻⁶ | 9.19 × 10⁻⁶ | 2.30 × 10⁻³ | 2.31 × 10⁻³ | ||||
| Cu | 2.73 × 10⁻⁹ | 2.06 × 10⁻⁸ | 5.15 × 10⁻⁶ | 6.82 × 10⁻⁸ | 5.14 × 10⁻⁷ | 1.29 × 10⁻⁴ | 1.29 × 10⁻⁴ | ||||
| Zn | 1.97 × 10⁻⁸ | 1.48 × 10⁻⁷ | 3.72 × 10⁻⁵ | 9.86 × 10⁻⁷ | 7.42 × 10⁻⁶ | 1.86 × 10⁻³ | 1.87 × 10⁻³ | ||||
| Mn | 1.96 × 10⁻⁷ | 1.47 × 10⁻⁶ | 3.69 × 10⁻⁴ | 1.40 × 10⁻⁶ | 1.05 × 10⁻⁵ | 2.64 × 10⁻³ | 2.65 × 10⁻³ | ||||
| Ni | 2.15 × 10⁻⁸ | 1.62 × 10⁻⁷ | 1.89 × 10⁻⁴ | 1.95 × 10⁻⁶ | 1.47 × 10⁻⁵ | 1.72 × 10⁻² | 1.72 × 10⁻² | ||||
| Fe | 1.04 × 10⁻⁷ | 7.86 × 10⁻⁷ | 1.97 × 10⁻⁴ | 1.49 × 10⁻⁷ | 1.12 × 10⁻⁶ | 2.81 × 10⁻⁴ | 2.83 × 10⁻⁴ | ||||
| Children | |||||||||||
| Cr | 3.02 × 10⁻⁸ | 3.19 × 10⁻⁷ | 5.69 × 10⁻⁵ | 1.01 × 10⁻⁵ | 1.06 × 10⁻⁴ | 1.90 × 10⁻² | 1.91 × 10⁻² | 1.51 × 10⁻⁸ | 1.59 × 10⁻⁷ | 2.84 × 10⁻⁵ | 2.86 × 10⁻⁵ |
| Pb | 1.99 × 10⁻⁸ | 2.11 × 10⁻⁷ | 3.76 × 10⁻⁵ | 5.70 × 10⁻⁶ | 6.02 × 10⁻⁵ | 1.07 × 10⁻² | 1.08 × 10⁻² | ||||
| Cu | 1.27 × 10⁻⁸ | 1.35 × 10⁻⁷ | 2.40 × 10⁻⁵ | 3.18 × 10⁻⁷ | 3.37 × 10⁻⁶ | 6.01 × 10⁻⁴ | 6.05 × 10⁻⁴ | ||||
| Zn | 1.00 × 10⁻⁷ | 9.73 × 10⁻⁷ | 1.74 × 10⁻⁴ | 5.01 × 10⁻⁶ | 4.86 × 10⁻⁵ | 8.68 × 10⁻³ | 8.74 × 10⁻³ | ||||
| Mn | 9.13 × 10⁻⁷ | 9.65 × 10⁻⁶ | 1.72 × 10⁻³ | 6.52 × 10⁻⁶ | 6.89 × 10⁻⁵ | 1.23 × 10⁻² | 1.24 × 10⁻² | ||||
| Ni | 1.00 × 10⁻⁷ | 1.06 × 10⁻⁶ | 3.72 × 10⁻⁵ | 9.11 × 10⁻⁶ | 9.63 × 10⁻⁵ | 1.86 × 10⁻³ | 1.97 × 10⁻³ | ||||
| Fe | 4.87 × 10⁻⁷ | 5.15 × 10⁻⁶ | 9.19 × 10⁻⁴ | 6.96 × 10⁻⁷ | 7.36 × 10⁻⁶ | 1.31 × 10⁻³ | 1.32 × 10⁻³ |
| Cr | Cu | Ni | Mn | Zn | Pb | Fe | PC1 | PC2 | PC3 | |
|---|---|---|---|---|---|---|---|---|---|---|
| Cr | 1 | 0.589 | 0.158 | −0.010 | ||||||
| Cu | 0.463 | 1 | 0.394 | −0.428 | 0.362 | |||||
| Ni | −0.002 | 0.446 | 1 | 0.085 | −0.558 | −0.061 | ||||
| Mn | 0.960 | 0.438 | −0.011 | 1 | 0.592 | 0.154 | 0.036 | |||
| Zn | 0.146 | 0.053 | −0.358 | 0.223 | 1 | 0.072 | 0.376 | 0.703 | ||
| Pb | −0.084 | −0.474 | −0.204 | −0.179 | 0.28 | 1 | −0.214 | 0.450 | 0.117 | |
| Fe | 0.498 | −0.187 | −0.170 | 0.467 | −0.12 | 0.009 | 1 | 0.299 | 0.336 | −0.596 |
| Eigenvalue | 2.57 | 1.85 | 1.21 | |||||||
| % of Variance | 36.77% | 26.47% | 17.32% | |||||||
| Cumulative % | 36.77% | 63.24% | 80.56% | |||||||
Disclaimer/Publisher’s Note: The statements, opinions and data contained in all publications are solely those of the individual author(s) and contributor(s) and not of MDPI and/or the editor(s). MDPI and/or the editor(s) disclaim responsibility for any injury to people or property resulting from any ideas, methods, instructions or products referred to in the content. |
© 2023 by the authors. Licensee MDPI, Basel, Switzerland. This article is an open access article distributed under the terms and conditions of the Creative Commons Attribution (CC BY) license (https://creativecommons.org/licenses/by/4.0/).
Share and Cite
Bhuyan, M.S.; Haider, S.M.B.; Meraj, G.; Bakar, M.A.; Islam, M.T.; Kunda, M.; Siddique, M.A.B.; Ali, M.M.; Mustary, S.; Mojumder, I.A.; et al. Assessment of Heavy Metal Contamination in Beach Sediments of Eastern St. Martin’s Island, Bangladesh: Implications for Environmental and Human Health Risks. Water 2023, 15, 2494. https://doi.org/10.3390/w15132494
Bhuyan MS, Haider SMB, Meraj G, Bakar MA, Islam MT, Kunda M, Siddique MAB, Ali MM, Mustary S, Mojumder IA, et al. Assessment of Heavy Metal Contamination in Beach Sediments of Eastern St. Martin’s Island, Bangladesh: Implications for Environmental and Human Health Risks. Water. 2023; 15(13):2494. https://doi.org/10.3390/w15132494
Chicago/Turabian StyleBhuyan, Md. Simul, Sayeed Mahmood Belal Haider, Gowhar Meraj, Muhammad Abu Bakar, Md. Tarikul Islam, Mrityunjoy Kunda, Md. Abu Bakar Siddique, Mir Mohammad Ali, Sobnom Mustary, Istiak Ahamed Mojumder, and et al. 2023. "Assessment of Heavy Metal Contamination in Beach Sediments of Eastern St. Martin’s Island, Bangladesh: Implications for Environmental and Human Health Risks" Water 15, no. 13: 2494. https://doi.org/10.3390/w15132494
APA StyleBhuyan, M. S., Haider, S. M. B., Meraj, G., Bakar, M. A., Islam, M. T., Kunda, M., Siddique, M. A. B., Ali, M. M., Mustary, S., Mojumder, I. A., & Bhat, M. A. (2023). Assessment of Heavy Metal Contamination in Beach Sediments of Eastern St. Martin’s Island, Bangladesh: Implications for Environmental and Human Health Risks. Water, 15(13), 2494. https://doi.org/10.3390/w15132494