Article

An Antifouling Redox Sensor with a Flexible Carbon Fiber Electrode for Machine Learning-Based Dissolved Oxygen Prediction in Severely Eutrophic Waters

1
Department of Ocean Engineering, Pukyong National University, 45 Yongso-ro, Busan 48513, Republic of Korea
2
Graduate School of Advanced Science and Engineering, Hiroshima University, Kagamiyama 1-4-1, Higashihiroshima 739-8527, Japan
3
Coastal and Estuarine Sediment Dynamics Group, Port and Airport Research Institute, 3-1-1 Nagase, Yokosuka 239-0826, Japan
*
Author to whom correspondence should be addressed.
Water 2023, 15(13), 2467; https://doi.org/10.3390/w15132467
Submission received: 25 May 2023 / Revised: 3 July 2023 / Accepted: 4 July 2023 / Published: 5 July 2023
(This article belongs to the Special Issue Environmental Chemistry of Water Quality Monitoring II)

Abstract

:
Machine-learning-based models are used to predict dissolved oxygen (DO); however, acquiring continuous water quality data for input variables in harsh environments remains challenging. Herein, redox potential (ORP) determined by a thermo-treated flexible carbon fiber electrode was introduced as a single or preferential input variable for machine-learning-based DO prediction in a year-round eutrophic estuary. The novel ORP sensor was operated for 4 months, and DO was predicted from ORP and six water quality data sources using a long short-term memory (LSTM) neural network. ORP and DO concentration showed a linear correlation, but the first-order correlation slopes varied seasonally. The optimal LSTM hyperparameters were proposed, which depended on the prediction time step and predictor case. Simulation results showed higher seasonal DO dynamics reproduced using ORP alone (RMSE = 1.09) than that predicted using six other water quality parameters (RMSE = 1.32). In addition, ORP played a key role in DO prediction when combined with all water quality parameters (RMSE = 1.08). The feature importance of ORP as a predictor was evaluated from a random forest model. Overall, the highly selective redox sensor has a distinct response to DO concentration and offers a novel and cost-effective approach for monitoring or predicting DO in eutrophic waters.

1. Introduction

Dissolved oxygen (DO) is a crucial parameter for regulating biological activities in aqueous environments. Insufficient oxygen availability leading to hypoxia is one of the most severe environmental problems observed in estuaries and coastal seas worldwide [1]. Seasonal hypoxia is generally caused by the seasonal growth-settling-decay cycle of phytoplankton and the significant seasonality in water column stratification and air temperature [2]. Thus, nutrient input stimulated by tidal oscillation during spring and subsequent algal blooms lead to large amounts of organic matter settling at the bottom of water bodies. Subsequently, intense DO consumption during summer with stratification causes a vertical imbalance in DO supply and consumption, leading to a hypoxic water mass at the bottom [3]. These external forces, such as nutrient loadings, algal bloom, water temperature, and stratification, determine the seasonal DO dynamics in most eutrophic estuaries [1].
With the increasing availability of observed water quality (WQ) data and advances in machine learning (ML) techniques, data-driven or ML-based modeling has been applied to predict DO [4]. Among these models, recurrent neural network (RNN) is an iterative algorithm designed for processing sequential data [5]. It possesses important attributes including memory, parameter sharing, and primitive integrity. Consequently, RNNs are extensively utilized for acquiring non-linear features from sequences, such as speech recognition and time series prediction [6]. Among the various RNN variants, the long short-term memory network (LSTM) is presently the most prevalent model; the LSTM addresses the issues of gradient vanishing and exploding gradients in RNN, resulting in significantly enhanced prediction accuracy [7]. Therefore, LSTM has demonstrated better performance in predicting DO concentration compared to other models, such as backpropagation neural network, extreme learning machine, k-nearest neighbors, and support vector machine [5,6,7]. However, accurate simulation or prediction of DO in severely eutrophic estuaries remains challenging because of several unpredictable variables: (1) the eutrophic estuaries are exposed to various anthropogenic activities (e.g., industrial and livestock sewage discharges) with frequent fluctuations in WQ, and (2) DO dynamics involve nonlinear and complex biochemical processes in addition to physicochemical parameters [8]. Therefore, high precision DO prediction in these areas requires a significant volume of datasets on multiple WQ parameters to train ML tools, which is a typical drawback of ML techniques [1]. Although state-operated buoy sensors for WQ management have become available in some developed countries, acquiring multiple long-term datasets remains difficult in most estuaries and coastal areas worldwide for technical and economic reasons.
The use of oxidation–reduction potential (redox potential; ORP) may provide highly accurate DO predictions without the need for multiple WQ datasets, because ORP is a parameter representing DO-related thermodynamic reactions in aqueous environments, such as the aerobic/anaerobic respiration by microorganisms and the circulation of organic/inorganic compounds (such as redox reactions of hydrogen sulfide (H2S) and ammonia and reactive oxygen species generated via photosynthesis) [9,10,11,12]. However, ORP measured using conventional equipment may be difficult to use in estuaries where various determinants coexist; therefore, ORP has been utilized only where WQ is controlled, such as in sewage treatment plants. In our previous study, the ORP measured using a thermo-treated flexible carbon fiber electrode (ORP/C) had high selectivity and sensitivity toward DO concentration, and the ORP/C successfully operated for 4 months in eutrophic estuaries without maintenance [13]. These findings suggest that the ORP/C reflects the DO determinants and concentration and overcomes the limitations of conventional ORP that provides only qualitative information on the degree of oxidation or reduction [14]. Herein, ORP/C was evaluated as a predictor in ML-based DO prediction; the underlying hypothesis is that ORP/C reflects seasonal DO characteristics in eutrophic environments.
The purpose of this study is to predict DO concentration by installing a minimum number of sensors in an area where continuous long-term WQ data are difficult to obtain, and ORP/C was reviewed as a single or preferential input variable. The primary goal of the present study is to elucidate the significance of ORP/C as a WQ parameter and evaluate its value as a predictor of DO. The findings of this study can provide empirical evidence linking oxidation–reduction reactions and annual DO fluctuation in eutrophic estuaries; they contribute to an improved understanding of the mechanisms of hypoxia in situ, as well as ML-based DO prediction.

2. Materials and Methods

2.1. Preparation of Capacitive Electrode

An indicator electrode for ORP/C measurements was prepared using a flexible carbon fiber (CF; E-C-CC1-06, Electro-Chem, Woburn, MA, USA). The preparation method has been comprehensively described previously [13]. Briefly, the CF (15 × 15 cm2) was heated at 500 °C in a muffle furnace for 30 min. This process conferred the CF a capacitive performance, attributed to nitrogen bonding. A 10-cm titanium collector wire (φ 0.80 mm, 99.5%; TI-451465, Nilaco, Tokyo, Japan) was sewn to the treated CF. The titanium wire was soldered to an insulated 18 AWG copper wire. The soldering joints were sealed using an acrylic waterproof tape (AS-02-50, Okamoto, Tokyo, Japan). The capacitance of the CF electrode was calculated as follows using the cyclic voltammetry (CV) technique:
I = v ( C + V d C d V )
where I is the difference between anodic and cathodic currents (A), v is scanning speed (V/s), V is voltage (V), and C is capacitance (F). CV peaks for natural organic matters of flexible carbon fibers are provided in previous report [15]. The response of the ORP/C to DO concentration was tested as described below. Thirty milligrams of sodium sulfite (Na2SO3; Nacalai Tesque, Kyoto, Japan) was added to one liter of deionized water. DO concentration was determined using an air pump. During this process, the potential of the original and heat-treated CF electrodes (i.e., ORP/C) was measured using an Ag/AgCl reference electrode.

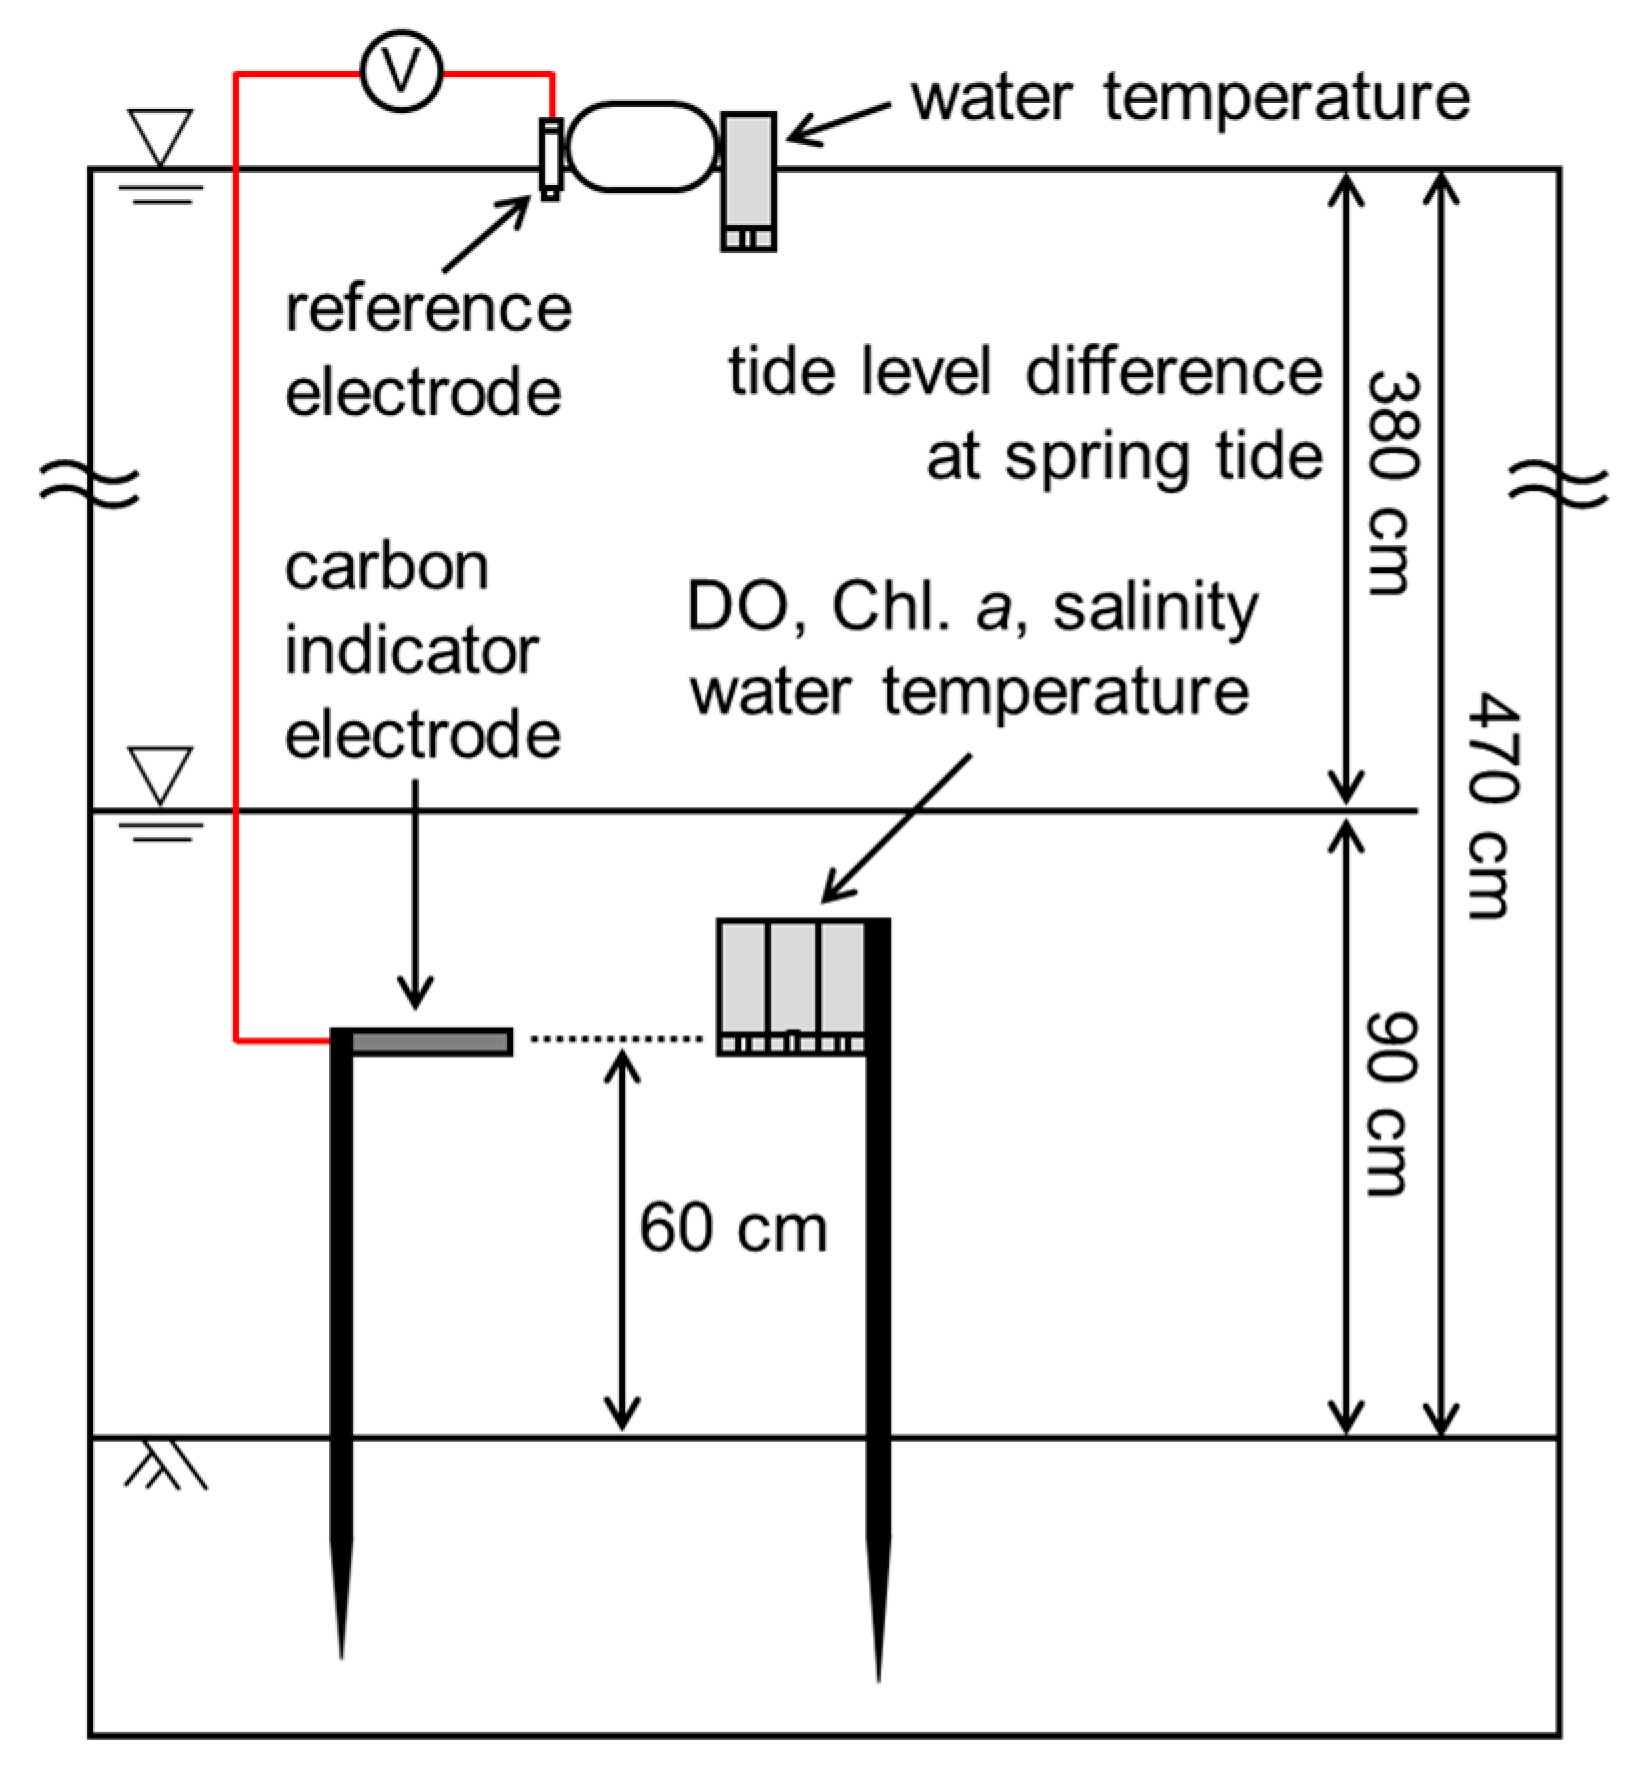
2.2. Field Experiment

Field measurements were conducted at Fukuyama Inner Bay, Japan (34°28′52′′ N 133°22′55′′ E) from 22 July 2016 through 6 December 2016. The study area was eutrophic throughout the year, owing to the direct inflow of untreated wastewater from the combined sewage system [16]. A schematic of the experimental setup is shown in Figure 1. The indicator electrode was positioned 60 cm above the seabed. A double-junction Ag/AgCl reference electrode (W-RE-7A, Toyo Corp., Tokyo, Japan) was placed on the water surface and replaced with a new electrode at monthly intervals. The redox potential was measured by connecting the indicator and reference electrodes to the cathode and anode of a voltmeter (VR-71, T&D Corp., Tokyo, Japan), respectively. The voltmeter was housed in a custom databox installed on the land.
Water temperature and salinity (TD701, JFE Advantech, Nishinomiya, Japan), DO concentration (AROW0377, JFE Advantech), and chlorophyll a (Chl. a; CLW0075, JFE Advantech) were measured at 60 cm above the seabed. The water temperature was also measured at the water surface. Rainfall records were obtained from rain gauge data of the Ministry of Land, Infrastructure, and Transport, Japan. The time and amount of sewage discharge almost coincided with those of rainfall.

2.3. Statistical Assessment

Pearson correlation coefficient (R) analysis was performed for the network analysis in Jeffrey’s Amazing Statistics Program (JASP) on the bootnet package in R statistical software [17]. The nodes were positioned using the Fruchterman–Reingold algorithm, which organizes the network based on the strength of the connections between nodes.
The predictive performance of the models was evaluated using the coefficient of determination (R2) and root mean square error (RMSE) as follows:
R 2 = 1 ( x i m e a s u r e d x i e s t i m a t e d ) 2 ( x i m e a s u r e d x m e a n m e a s u r e d ) 2
RMSE = i = 1 N ( x i e s t i m a t e d x i m e a s u r e d ) 2 N

2.4. Data Partitioning

All data described in Section 2.2 were obtained at one-hour intervals, and data for 124 d (22 July 2016 to 23 November 2016) were used for the LSTM model development. Table 1 presents the statistics of the collected data for input variables. The number of data points for all parameters was n = 2970, and the missing values and outliers were obtained through linear interpolation. Eighty percent of the randomly selected datasets were used for the model training, and the remaining 20% were used for model validation. Random selection was performed because the characteristics of seasonal DO dynamics in the study area varied considerably; thus, training from a continuous dataset may lead to modeling bias. The datasets were standardized with a mean of 0 and a standard deviation of 1.

2.5. Long Short-Term Memory Network

The LSTM neural network is a model of the RNN series that forms a cyclic structure between memory cells; this model is suitable for processing sequence data. The hyperparameters of LSTM include epochs, number of hidden nodes, number of hidden layers (layer depth, LD), and sequence length (SL). The number of hidden nodes was dependent on the number of hidden layers. The structure of the LSTM model is presented in Figure 2.
When selecting predictors for ML-based prediction of DO concentration, identifying the factors that influence DO is crucial. The saturated DO concentration is negatively correlated with water temperature and salinity [18]. Water temperature can also influence DO concentration through processes such as stratification, vertical mixing, and microbial metabolic activity [19]. The water level can contribute to the physical mixing between the surface and bottom layers because of the large tidal difference in this area. As mentioned in Section 2.2, the time and amount of sewage discharge almost coincided with precipitation. DO concentration was predicted using three cases: (1) WQ parameters, (2) ORP/C, and (3) WQ parameters and ORP/C (WQ-ORP/C). The WQ parameters included the surface water temperature (SWT), bottom water temperature (BWT), the difference between SWT and BWT (dTemp), bottom water salinity, water level, and precipitation. The optimal hyperparameter combinations for the prediction time steps of 0, 1, 6, 12, and 24 h were investigated. The conditions of the input hyperparameters are presented in Table 2.

2.6. Feature Importance Based on the Random Forest Model

The importance of the features in DO prediction was evaluated using the random forest technique. A random forest is an ensemble model in which multiple decision trees are combined, and each decision tree model randomly selects part of the original data and uses it as the training dataset. The difference between the estimated and observed values obtained by placing an unselected dataset into a trained decision tree model is known as the out-of-bag (OOB) error. The feature importance of a specific variable was determined by considering the mean ( d ¯ ) and standard deviation (S) of the OOB error difference (d) between the existing and random datasets as follows:
d i = e i r i ,   i = 1 ,   2 ,   3 ,   ,   t
v i = d ¯ S
where i and t are the decision tree and total numbers, respectively; r and e are the OOB errors of the existing and random datasets, respectively; and v is the feature importance.
The values of a specific variable for which feature importance is to be calculated in the existing dataset are arbitrarily changed in a random dataset. The larger the difference between the two OOB errors of a specific variable, the greater the influence of that specific variable on the model results, and the higher the feature importance.

3. Results and Discussion

3.1. Reactivity of Flexible Carbon Fiber Electrode

The change of electrode reactivity according to the capacitance of the electrode was investigated. The voltammogram of CF according to thermal treatment is shown in Figure 3a. In the CV test, the capacitive electrode has a voltammogram close to a square because the amount of current rapidly increases at the beginning of the cathodic and anodic scans. Capacitance can be calculated from the size of the internal area of the voltammogram. CF, CF300, and CF400 showed no potential-dependent current (i.e., dC/dV = 0), and the capacitance of CF and CF300 with a size of 25 cm2 was 0.065 F. This was similar to the level of a commercial aluminum electrolytic capacitor. In a previous study, the capacitance of a 225 cm2 CF was 0.65 F, which was similar to the level of a commercial coin-type capacitor [10]. In contrast, CF500 displayed a voltammogram close to an ellipse. This indicates that the capacitance changes in a potential-dependent manner, and the capacitance was determined by changes in electric double layer thickness according to the potential. The capacitance-induced current of CF500 was 6.2 times higher than that of CF or CF400.
The increased capacitance with thermal treatment suggests an increase in electric double layer thickness, possibly due to an increased number of oxygen and nitrogen bonds in the CF components. An increased capacitance causes more redox-active substances to attach to the electrode surface, which may increase the potential response. As shown in Figure 3b, the responses (slopes) of potential to the DO concentration of CF and CF500 were 0.0016 and 0.0079, respectively; the response to DO concentration increased five-fold in CF500. Figure 3c shows a schematic diagram of the increase in potential response with capacitance. In this study, ORP measured by CF500 was defined as ORP/C. We expected the enhanced reactivity of ORP/C to DO concentration to allow simulating of the DO concentration in eutrophic estuaries rich in redox-active substances.

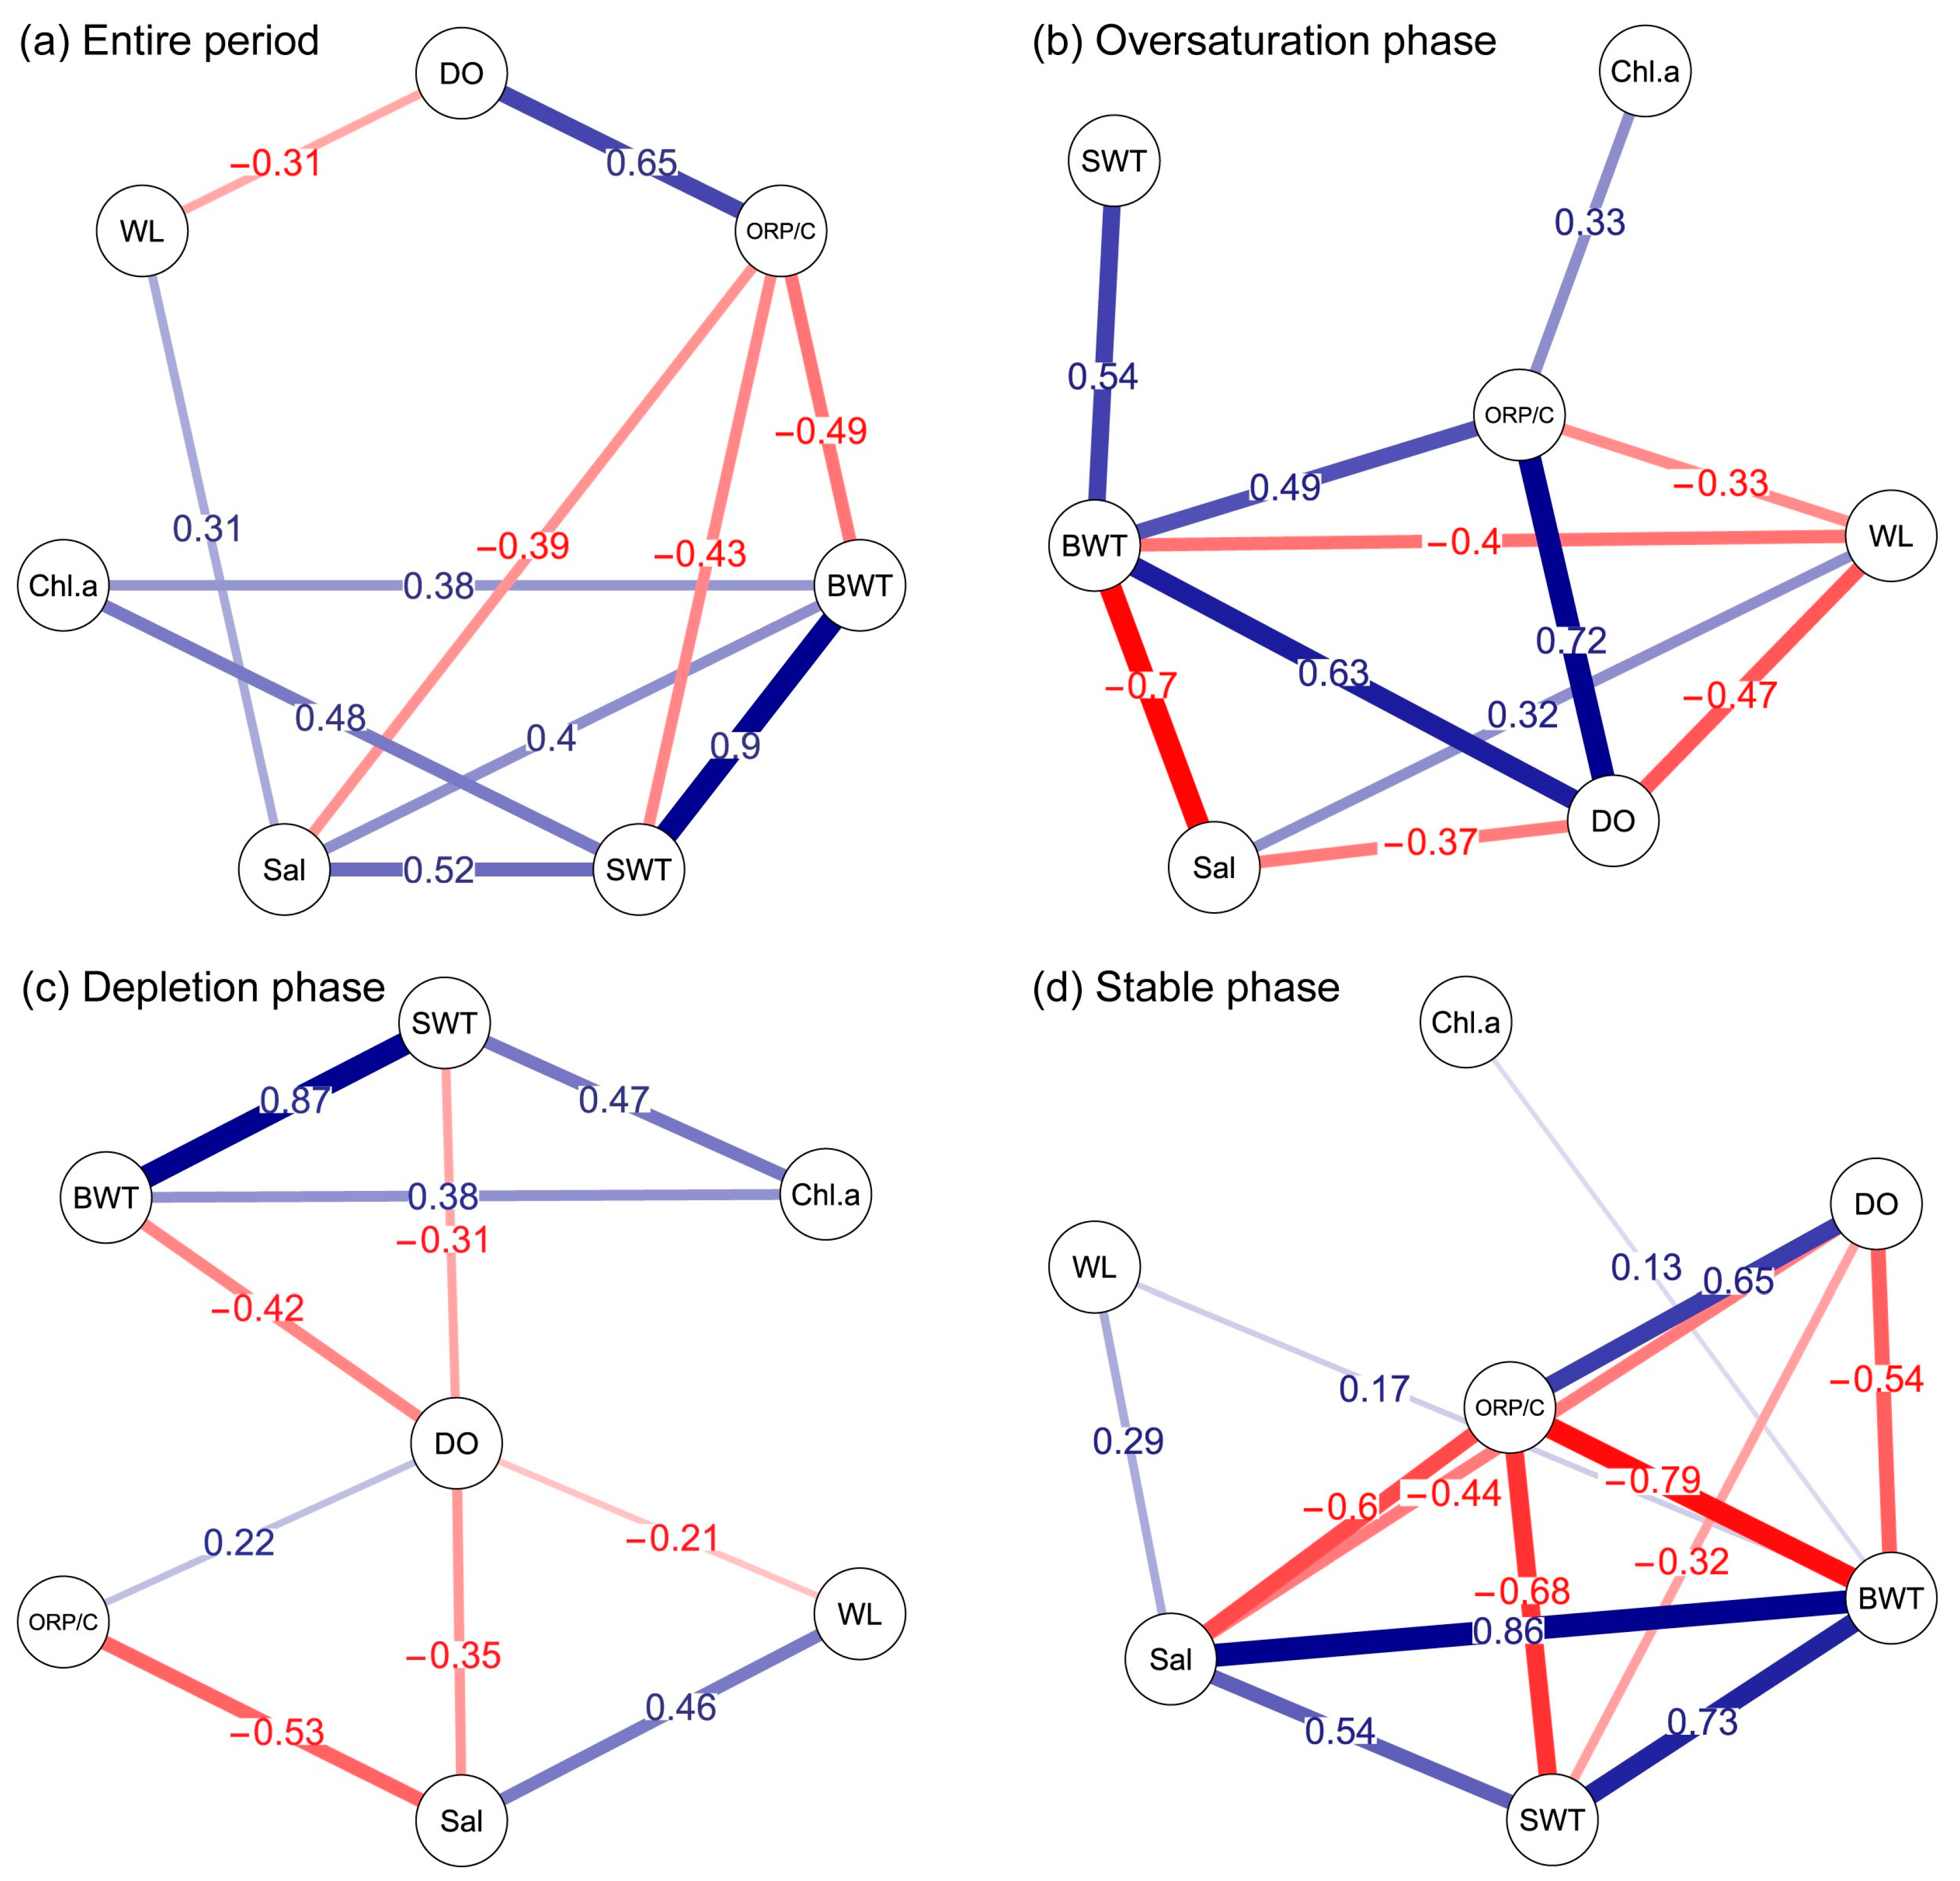
3.2. Correlations between Dissolved Oxygen Concentration and Predictors

The time-series of obtained WQ data is shown in Figure 4. DO concentration showed significant seasonal variations from depletion to oversaturation of 23 mg L−1. The DO conditions were divided into three phases: oversaturation, depletion, and stable. In the oversaturation phase, during which DO concentration exceeded the saturation criterion of 8 mg L−1, a distinct stratification was formed owing to drought (Figure 4c,d). Based on the high chl. a concentration in these seasons (Figure 4f), the oversaturation of DO is attributed to photosynthesis during algal bloom. Oversaturation was observed only at low tide, and DO was depleted again at high tide. DO depletion at high tide suggests that the elution of oxygen-consuming substances such as H2S from anaerobic sediments is the direct cause of bottom hypoxia [8]. On the 38th day, the depletion phase started, even though the algae were still thriving, meaning that chl. a concentration was not a major limiting factor for photosynthesis in this area. During this phase, concentrated rainfall and sewage discharge were observed, possibly because of the continued East Asian monsoon in September. In October, the DO concentration in the bottom layer entered a stable phase at 2.8 ± 1.1 mg L−1 because the metabolic activities of the microorganisms (photosynthesis and anaerobic degradation) were inhibited with decreasing water temperature and sewage discharge. The responses of ORP/C to DO concentration during the three phases are shown in Figure 5. The slope in the stable phase was approximately 10 times higher than that in the depletion phase (0.071 and 0.007, respectively), and ORP/C represented seasonal characteristics of DO activity. For the oversaturation phase, the fluctuation of first-order correlation suggests that stable and depleted DO conditions were repeated with the tide.
The correlation between DO concentration and the predictors was investigated according to seasonal environmental changes (Figure 6). For the entire measurement period, ORP/C was the parameter that had the highest correlation with the DO concentration (R = 0.65), as indicated in the correlation network plot (Figure 6a). The correlation was strong (R = 0.72) in the photosynthetic oversaturation phase because DO is generally a dominant determinant of redox potential in this environment. By contrast, the correlation was very weak (R = 0.22) during the depletion phase because ORP/C did not reflect the intermittent increase in DO concentration in an environment with abundant H2S, as indicated in Figure 5b. BWT was moderately correlated (|R| = 0.42 to 0.63) with the DO concentration in each phase; therefore, it was considered a parameter correlated with DO. Other predictors had a weak or no correlation with the DO concentration (|R| = ~0.47).
Nevertheless, all parameters were statistically significantly correlated with the DO concentration, except for Chl. a (p < 0.05), and had seasonally varying multicollinearity in the data matrix. For example, the R values between DO concentration and BWT were 0.63 and −0.42 in the oversaturation and depletion phases, respectively, which was attributed to the occurrence of stratification in the water column (Figure 4c). In addition, BWT had a strong negative correlation (R = −0.70) with salinity in the oversaturation phase, in which stratification existed, but had a strong positive correlation (R = 0.86) in the stable phase, in which stratification no longer existed. Consequently, the BWT had a moderate correlation with the DO concentration as a parameter indicating the inflow of surface water to the bottom layer with the tide. However, the BWT may not directly determine the chemical reactions involving DO in the bottom water, where photosynthesis and H2S determine the DO concentration. Notably, the activity of Chl. a was the most important external force determining seasonal DO dynamics in this estuary, but the correlations with the DO concentration were absent in all phases because it was extremely high throughout the year (Figure 4f). Overall, the DO characteristics of eutrophic estuaries were seasonally distinct, which requires training with complex neural networks for ML-based DO prediction.
A high BWT should promote anaerobic degradation in the sediment; thus, ORP/C was probably determined by the oxidation reaction of the eluted H2S in this environment. By contrast, low BWT limited biochemical DO consumption; thus, the half reaction of O2/H2O determined the ORP/C value. The ORP/C determined by DO and H2S can be expressed according to the Nernst equation as follows [20]:
ORP / C ( V ) = 0.0148 log a O 2 / a H 2 O   for   O 2 / H 2 O   half   reaction
ORP / C ( V ) = 0.0074 log a SO 4 2 / a H 2 S   for   SO 4 2 / H 2 S   half   reaction
where a is the thermodynamic activity of the redox substance. Equations (6) and (7) show that the DO activity is proportional to ORP/C. DO is an electron acceptor for H2S oxidation in most natural estuaries; thus, a H 2 S is substituted with a O 2 [21]. Thus, Equations (6) and (7) suggest that the weight of DO concentration to ORP/C theoretically doubles from 0.0074 to 0.0148 in an environment where the biochemical activity of DO is limited. Therefore, BWT was closely related to the correlation between the DO concentration and ORP/C.
Overall, the correlations of all the WQ parameters with the DO concentration varied seasonally, and some parameters reversed their positive or negative correlations. This type of variability generally decreases the reliability of DO prediction. In contrast, ORP/C was a parameter proportional to the thermodynamic activity of DO according to the Nernst equation; thus, it may be a useful predictor for training ML tools to predict the DO dynamics.

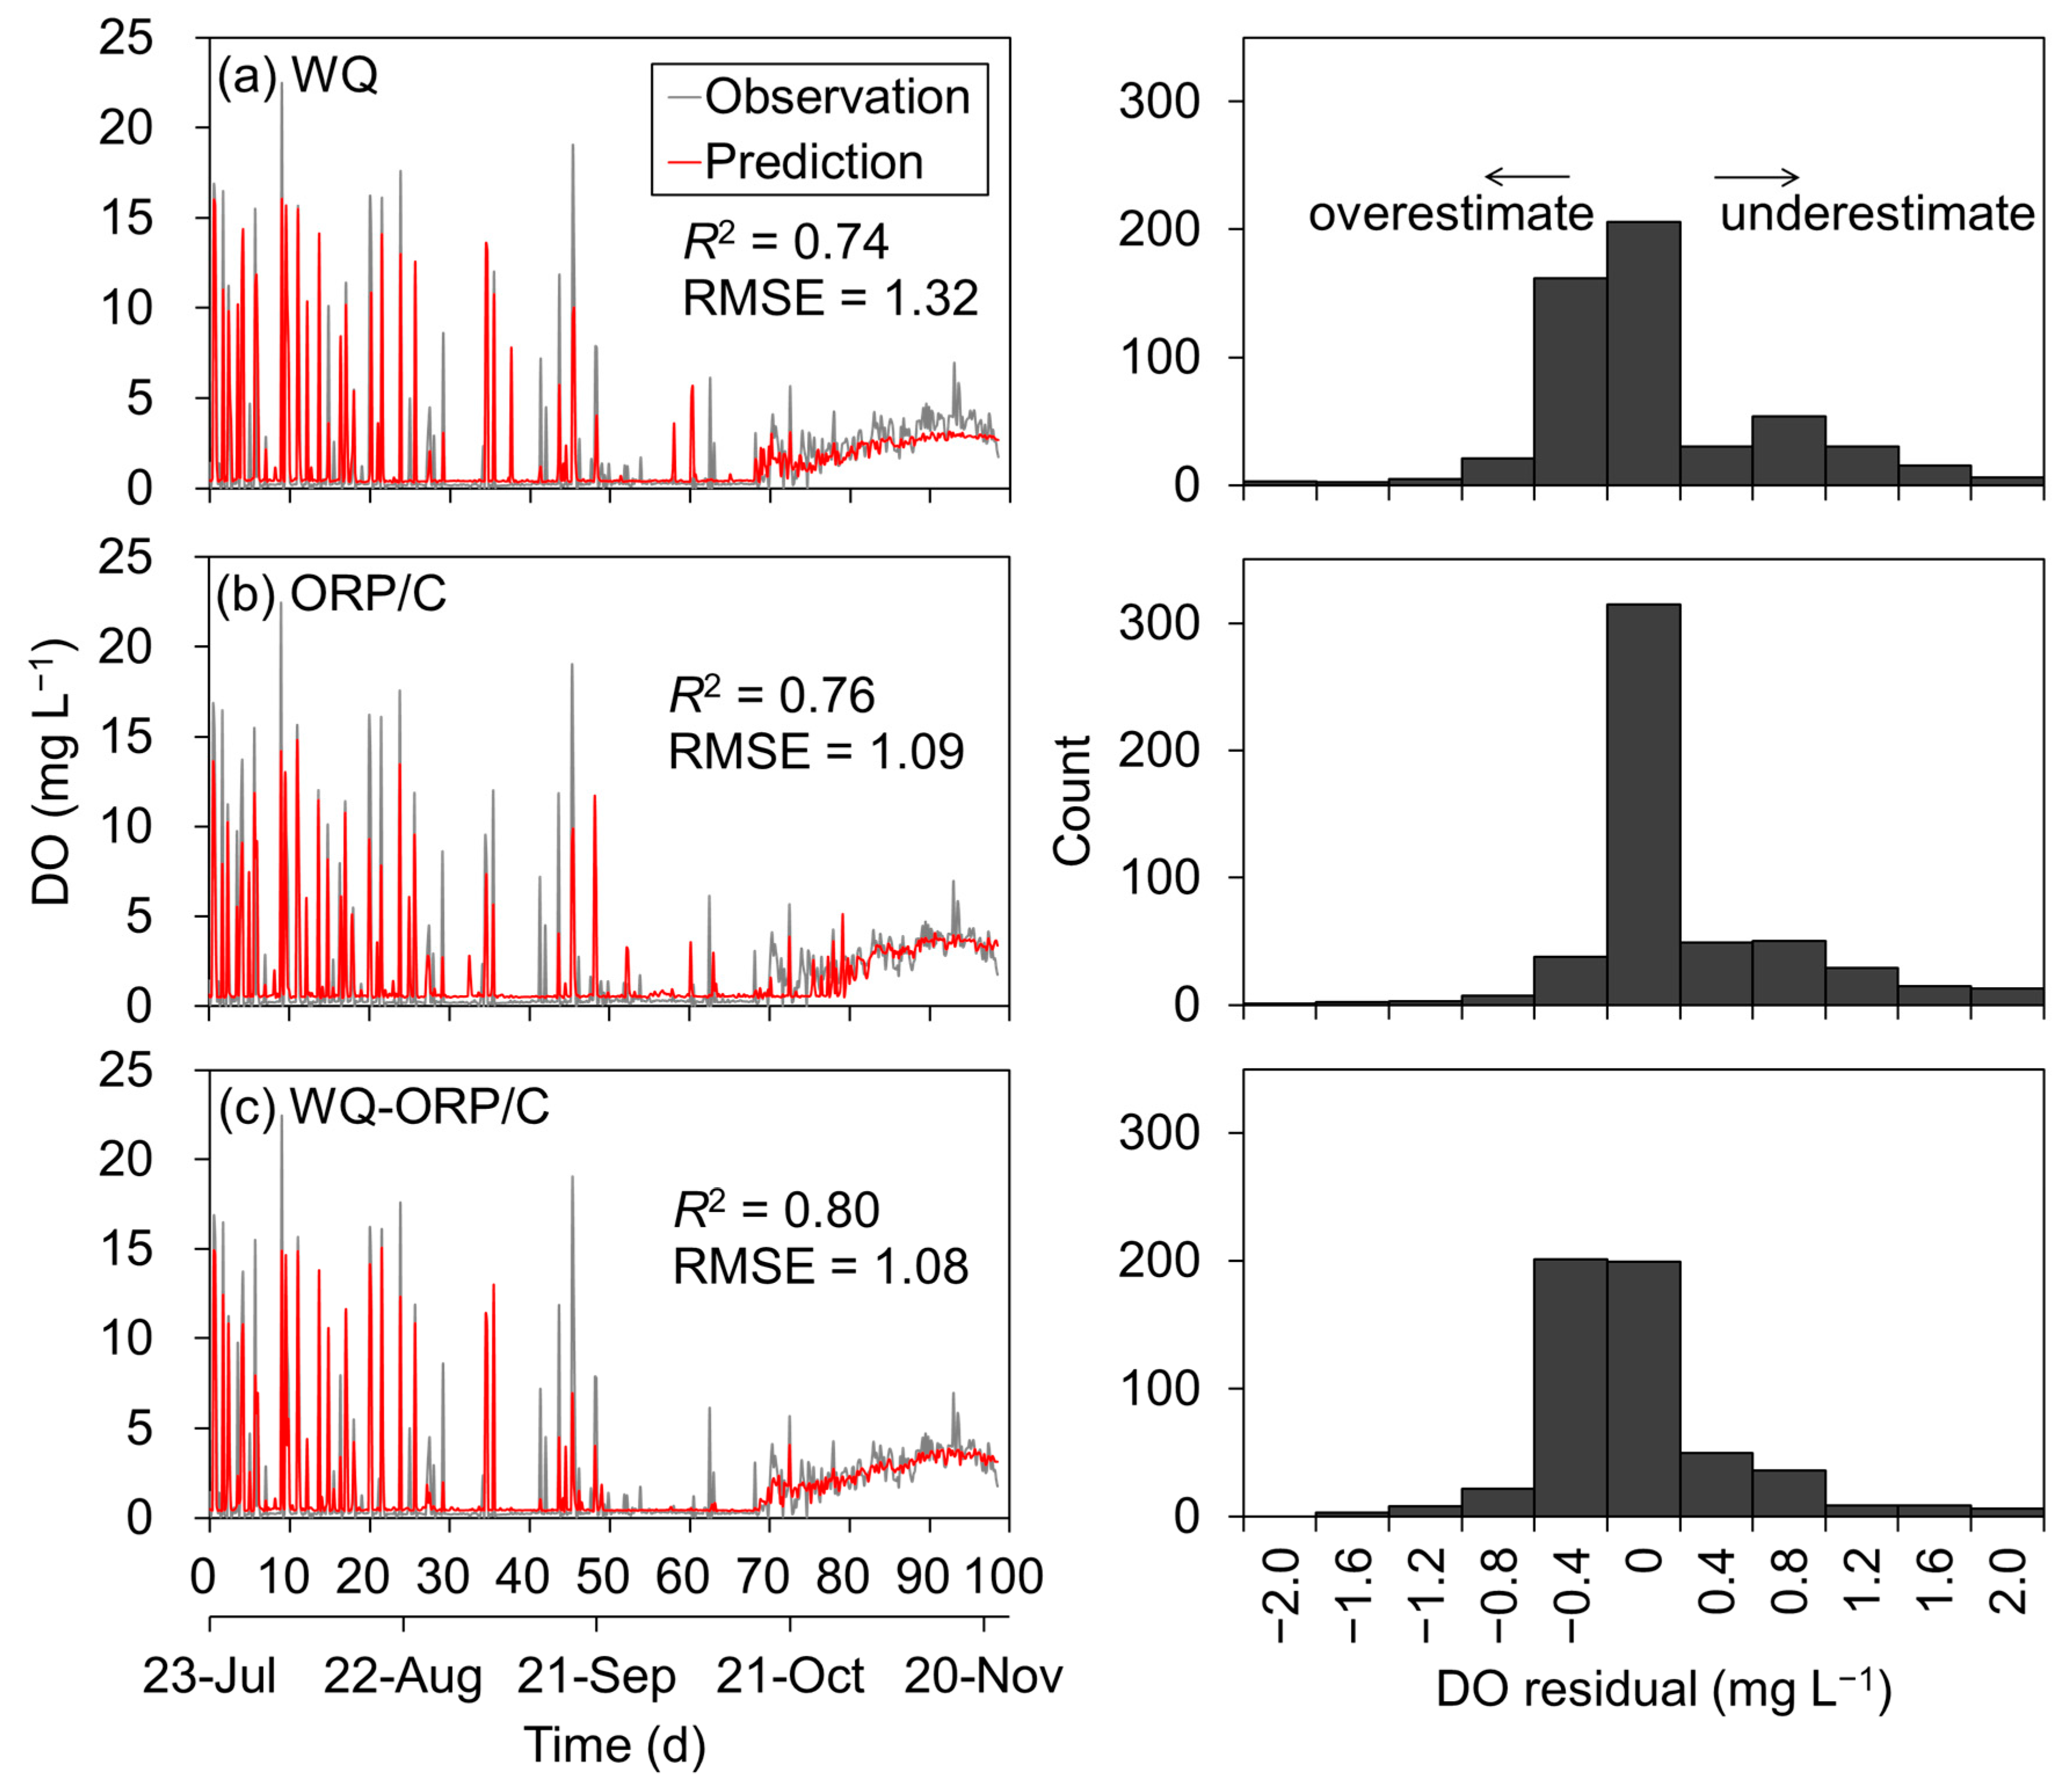
3.3. Prediction of Dissolved Oxygen Concentration

Seasonal DO dynamics were predicted for three cases using (a) WQ parameters, (b) ORP/C, and (c) WQ-ORP/C as predictors. Figure 7 shows the time-series variation between the observed and predicted DO concentrations and a histogram of residuals. In this study, R2 was relatively lower (R2 = 0.74–0.80) than that of our previous studies or literature predicting the DO in coastal areas using the LSTM model [22]. This suggests that the annual environmental fluctuation in this eutrophic estuary was relatively unpredictable, probably due to a high biodegradation rate with untreated sewage inflow, strong stratification, low water exchange rate, and large tidal difference (water level increased from 0.9 to 4.7 m during spring tide). Nevertheless, LSTM neural networks, which have superior sequence data processing abilities, predicted successive changes in the DO concentration in the oversaturation, depletion, and stable phases [6].
The R2 and RMSE in the case of WQ parameters were the lowest and highest, respectively, probably because the correlation between physicochemical WQ parameters, and the DO concentration varied significantly seasonally (Figure 6) [23]. In this case, the DO concentration was slightly overestimated during the depletion phase (residuals varying from −0.6 to +0.2 mg L−1). By contrast, the DO concentration was underestimated during the stable phase (residuals varying from +0.2 to +1.8 mg L−1). This finding is probably because the increase in oxygen saturation owing to the decrease in water temperature was not trained, as 2/3 of the training dataset (oversaturation and depletion phases) had a high water temperature (≥27 °C) [24]. Residuals > ±2 mg L−1 primarily occurred during the oversaturation phase, probably because the photosynthetic oversaturation of DO in eutrophic environments does not follow the WQ conditions in the normal state. DO prediction using ORP/C showed higher reproducibility (R2 and RMSE) than that using the WQ parameters, suggesting that ORP/C alone may replace multiple predictors in seasonal DO prediction. In addition, ORP/C predicted the DO concentration with a smaller deviation than WQ-ORP/C when evaluated by the residual counts. The ORP/C was proportional to the activity of DO, not to the DO concentration, as discussed in Section 3.2, suggesting ORP/C could be a predictor of seasonal DO characteristics. However, the reproducibility of DO was highest when combined with the ORP/C and WQ predictors, with the highest R2 and lowest RMSE. The combination had fewer residual counts of 0 ± 0.2 mg L−1 than that with ORP/C alone but suppressed the dispersion of residuals compared to that by ORP/C.

3.4. Dominant Predictors

The dominant predictors of DO using the LSTM model were evaluated using the random forest technique. The relative importance scores of the variables influencing the DO prediction are shown in Figure 8. BWT, salinity, and ORP/C were the variables with the highest influence in the oversaturation, depletion, and stable phases, respectively. The variability of the variable with the highest score in each phase suggests the complexity of the seasonal DO dynamics. The ORP/C and BWT had scores of ≥0.65 in all of the phases, and were the variables with the highest influence on annual DO prediction. BWT directly determines oxygen saturation and vertical mass circulation, and the importance of DO prediction in eutrophic estuaries was confirmed in our previous studies [25]. Notably, the ORP/C had a score equivalent to that of the BWT. ORP/C represents the biochemical reaction of DO by reflecting the thermodynamic activity of DO and the redox couple that reduces the DO concentration according to the Nernst equation [20]. A common characteristic of these two variables is that the statistical correlation with the DO concentration varies significantly in each seasonal phase, with a relatively high R score (Figure 6). Therefore, the parameter that indicates the seasonal DO variation characteristics may be considered an influencing predictor for annual DO [26]. In contrast, its importance as a predictor of physicochemical parameters related to DO circulation would be increased in estuaries where seasonal fluctuations in biological and chemical DO activity are stable. Consequently, the dTemp, SWT, and water level scores increased to approximately ≥0.4 in the stable phase.
The optimal hyperparameter conditions for predicting the DO were investigated (Table 3). The epochs for the prediction time steps of 0, 1, and 48 h were 1000 for ORP/C, indicating that this predictor required a relatively small amount of training for the ML algorithm [27]. The 5 LD for the WQ-ORP/C was also associated with a large amount of training, owing to the complexity of the datasets. Therefore, ORP/C reduced the number of datasets for ML-based DO prediction and contributed to cost-effective ML operation. The SL in the cases of WQ parameters and ORP/C were determined by diurnal and semi-diurnal tides and the change in diurnal water temperature. This diurnal change was distinct during the stable phase, as shown in Figure 6. During the stable phase, the RMSE values for WQ parameters, ORP/C, and WQ-ORP/C were 0.93, 0.82, and 0.68 mg L−1, respectively, indicating that the diurnal DO changes were well reproduced when ORP/C and WQ parameters were combined as predictors. The prediction using ORP/C had lower RMSE and R2 values than that using WQ parameters for prediction time steps of 1 and 48 h. The lower RMSE suggests that ORP/C was a parameter closely related to the DO concentration with a higher influence than that of the other WQ parameters. A relatively low R2 value indicates that time-series DO prediction using only ORP/C may have structural limitations in the LSTM model. Nevertheless, the ORP/C plays a crucial role in long-term time-series DO prediction, from the high R2 and low RMSE in the case of WQ-ORP/C compared to those in the case of WQ parameters. This is probably because ORP/C is a dependent variable of DO; thus, ORP/C reflects the information of the present time, and the WQ parameters reflect the information of past time-series, which leads to increased reproducibility when using their combination.

3.5. Implications and Prospects

The WQ of coastal areas is increasingly being threatened by anthropogenic activities, which lead to DO depletion; therefore, accurate and reliable DO prediction is crucial for assessing the health of marine ecosystems and supporting various industries, including aquaculture and environmental management. For example, Hiroshima Bay in Japan, near to the area where this study was conducted, is the largest producer of farmed Pacific oyster Crassostrea gigas in Japan, and floating farms are evacuated to the far sea when red tide (eutrophication) or blue tide (hypoxia) occur. This evacuation relies on the experience of farmers, and thus, (near-) real time monitoring or prediction of seasonal DO fluctuations with ORP/C contributes to sustainable management strategies and mitigation measures to safeguard the coastal aquaculture. In addition, one of advantages of the redox sensor with the flexible carbon fiber electrode is its cost-effectiveness; the sensor can be manufactured at a price point below 2000 USD, making it an affordable solution for coastal areas where long-term datasets are not available for technical and economic reasons. Another advantage is the simplicity of its manufacturing, which can be measured by heating the flexible carbon fiber at 500 °C in a muffle furnace for 30 min to fabricate an indicator electrode and connecting it to a data logger with a commercially available Ag/AgCl reference electrode.
This study suggests that the response of ORP/C to seasonal DO activity is a powerful monitoring or simulation tool for DO concentration; however, a study area that is eutrophic all year round is one specific environment, and future work should focus on the response of ORP/C in typical coastal environments for generalization. In addition, the response mechanism and its correlation with other chemical parameters, such as nutrient concentration and pH, should be further elucidated. Because the flexible carbon fiber electrode is exposed to the water column, a unique response can be expected, owing to the formation of a biofilm [28]; that is, the electrode response at the end of the experiment may be different from that at the beginning of the experiment and may also vary depending on the water environments. This characteristic of the flexible carbon fibers contributed to the high correlation with DO concentration in eutrophic waters in this study; however, the repeatability of the sensor remains to be verified.

Author Contributions

Conceptualization, S.P. and K.K. (Kyeongmin Kim); Methodology, S.P. and K.K. (Kyeongmin Kim); Software, S.P. and K.K. (Kyunghoi Kim); Formal Analysis, S.P. and K.K. (Kyeongmin Kim); Investigation, Y.S. and T.F.; Writing—Original Draft Preparation, S.P. and K.K. (Kyeongmin Kim); Writing—Review & Editing, S.P., K.K. (Kyunghoi Kim) and K.K. (Kyeongmin Kim); Visualization, S.P. and K.K. (Kyeongmin Kim); Supervision, K.K. (Kyunghoi Kim) and K.K. (Kyeongmin Kim); Project Administration, T.H.; Funding Acquisition, T.H. and K.K. (Kyeongmin Kim). All authors have read and agreed to the published version of the manuscript.

Funding

This work was supported by the Japan Society for the Promotion of Science (JSPS) Aid for Scientific Research (KAKENHI) [grant number JP22K14330].

Data Availability Statement

The data sets generated and analysed during the current study are available from the corresponding author on reasonable request.

Conflicts of Interest

The authors declare no conflict of interest.

References

  1. Li, W.; Fang, H.; Qin, G.; Tan, X.; Huang, Z.; Zeng, F.; Du, H.; Li, S. Concentration estimation of dissolved oxygen in Pearl River Basin using input variable selection and machine learning techniques. Sci. Total Environ. 2020, 731, 139099. [Google Scholar] [CrossRef] [PubMed]
  2. Taft, J.L.; Taylor, W.R.; Hartwig, E.O.; Loftus, R. Seasonal oxygen depletion in Chesapeake Bay. Estuaries 1980, 3, 242. [Google Scholar] [CrossRef] [Green Version]
  3. Yu, X.; Shen, J.; Du, J. A machine-learning-based model for water quality in coastal waters, taking dissolved oxygen and hypoxia in Chesapeake Bay as an example. Water Resour. Res. 2020, 56, e2020WR027227. [Google Scholar] [CrossRef]
  4. Ross, A.C.; Stock, C.A. An assessment of the predictability of column minimum dissolved oxygen concentrations in Chesapeake Bay using a machine learning model. Estuar. Coast. Shelf Sci. 2019, 221, 53–65. [Google Scholar] [CrossRef]
  5. Chen, Y.; Cheng, Q.; Fang, X.; Yu, H.; Li, D. Principal component analysis and long short-term memory neural network for predicting dissolved oxygen in water for aquaculture. Trans. Chin. Soc. Agric. Eng. 2018, 34, 183–191. [Google Scholar] [CrossRef]
  6. Huan, J.; Li, H.; Li, M.; Chen, B. Prediction of dissolved oxygen in aquaculture based on gradient boosting decision tree and long short-term memory network: A study of Chang Zhou fishery demonstration base. Chin. Comput. Electron. Agric. 2020, 175, 105530. [Google Scholar] [CrossRef]
  7. Kim, Y.W.; Kim, T.; Shin, J.; Go, B.; Lee, M.; Lee, J.; Koo, J.; Cho, K.H.; Cha, Y. Forecasting abrupt depletion of dissolved oxygen in urban streams using discontinuously measured hourly time-series data. Water Resour. Res. 2021, 57, e2020WR029188. [Google Scholar] [CrossRef]
  8. Quinn, N.W.T.; Jacobs, K.; Chen, C.W.; Stringfellow, W.T. Elements of a decision support system for real-time management of dissolved oxygen in the San Joaquin River Deep Water Ship Channel. Environ. Model Softw. 2005, 20, 1495–1504. [Google Scholar] [CrossRef] [Green Version]
  9. Christwardana, M.; Yoshi, L.A.; Setyonadi, I.; Maulana, M.R.; Fudholi, A. A novel application of simple submersible yeast-based microbial fuel cells as dissolved oxygen sensors in environmental waters. Enzyme Microb. Technol. 2021, 149, 109831. [Google Scholar] [CrossRef]
  10. Jing, X.; Cao, D.; Liu, Y.; Wang, G.; Yin, J.; Wen, Q.; Gao, Y. The open circuit potential of hydrogen peroxide at noble and glassy carbon electrodes in acidic and basic electrolytes. J. Electroanal. Chem. 2011, 658, 46–51. [Google Scholar] [CrossRef]
  11. Kim, K.; Nakashita, S.; Yoshimura, K.; Hibino, T. In situ electrochemical remediation of brackish river sediment rich in aromatic organic matter using steel-slag-combined sediment microbial fuel cells. J. Clean. Prod. 2021, 315, 128206. [Google Scholar] [CrossRef]
  12. Yu, R.-F.; Liaw, S.-L.; Chang, C.-N.; Lu, H.-J.; Cheng, W.-Y. Monitoring and control using on-line ORP on the continuous-flow activated sludge batch reactor system. Water Sci. Technol. 1997, 35, 57–66. [Google Scholar] [CrossRef]
  13. Kim, K.; Nakagawa, Y.; Takahashi, T.; Yumioka, R.; Hibino, T. High-resolution monitoring of seasonal hypoxia dynamics using a capacitive potentiometric sensor: Capacitance amplifies redox potential. Sci. Total Environ. 2022, 836, 155435. [Google Scholar] [CrossRef]
  14. Rosenberg, R.; Nilsson, H.C.; Diaz, R.J. Response of benthic fauna and changing sediment redox profiles over a hypoxic gradient. Estuar. Coast. Shelf Sci. 2001, 53, 343–350. [Google Scholar] [CrossRef]
  15. Kim, K.; Takahashi, T.; Yumioka, R.; Hibino, T. Sediment microbial fuel cells in oxidative sedimentary environments using iron substrate as voltage booster. J. Power Sources 2023, 557, 232510. [Google Scholar] [CrossRef]
  16. Touch, N.; Hibino, T.; Yamaji, S.; Takata, H. Nutrient salt removal by steel-making slag in sediment microbial fuel cells. Environ. Technol. 2019, 40, 2906–2912. [Google Scholar] [CrossRef]
  17. Eliasz-Kowalska, M.; Wojtal, A.Z.; Barinova, S. Influence of selected environmental factors on diatom β diversity (Bacillariophyta) and the value of diatom indices and sampling issues. Water 2022, 14, 2315. [Google Scholar] [CrossRef]
  18. Timmons, M.B.; Ebeling, J.M.; Wheaton, F.W.; Summerfelt, S.T.; Vinci, B.J. Recirculating Aquaculture Systems, 2nd ed.; Cayuga Aqua Ventures: Ithaca, NY, USA, 2002. [Google Scholar]
  19. Townsend, S.A. The seasonal pattern of dissolved oxygen, and hypolimnetic deoxygenation, in two tropical Australian reservoirs. Lakes Reserv. Res. Manag. 1999, 4, 41–53. [Google Scholar] [CrossRef]
  20. Stumm, W.; Morgan, J.J. Aquatic Chemistry: An Introduction Emphasizing Chemical Equilibria in Natural Waters, 2nd ed.; Wiley: New York, NY, USA, 1981. [Google Scholar]
  21. Mansfeldt, T. In situ long-term redox potential measurements in a dyked marsh soil. Z. Pflanzenernähr. Bodenkd. 2003, 166, 210–219. [Google Scholar] [CrossRef]
  22. Eze, E.; Ajmal, T. Dissolved oxygen forecasting in aquaculture: A hybrid model approach. Appl. Sci. 2020, 10, 7079. [Google Scholar] [CrossRef]
  23. Park, S.; Kim, K. Prediction of DO concentration in Nakdong River estuary through case study based on long short term memory model. J. Korean Soc. Coastal Ocean Eng. 2021, 33, 238–245. [Google Scholar] [CrossRef]
  24. Li, W.; Wu, H.; Zhu, N.; Jiang, Y.; Tan, J.; Guo, Y. Prediction of dissolved oxygen in a fishery pond based on gated recurrent unit (GRU). Inf. Process. Agric. 2021, 8, 185–193. [Google Scholar] [CrossRef]
  25. Park, S.; Kim, K. Preliminary study on the reproduction of dissolved oxygen concentration in Jinhae Bay based on deep learning model. J. Korean Soc. Mar. Environ. Saf. 2022, 28, 193–200. [Google Scholar] [CrossRef]
  26. Ahmed, M.H.; Lin, L.S. Dissolved oxygen concentration predictions for running waters with different land use land cover using a quantile regression forest machine learning technique. J. Hydrol. 2021, 597, 126213. [Google Scholar] [CrossRef]
  27. Justus, D.; Brennan, J.; Bonner, S.; McGough, A.S. Predicting the computational cost of deep learning models. In Proceedings of the 2018 IEEE International Conference on Big Data, Seattle, WA, USA, 10–13 December 2018; pp. 3873–3882. [Google Scholar] [CrossRef] [Green Version]
  28. Burge, S.R.; Hristovski, K.D.; Burge, R.G.; Hoffman, D.A.; Saboe, D.; Chao, P.; Taylor, E.; Koenigsberg, S.S. Microbial potentiometric sensor: A new approach to longstanding challenges. Sci. Total Environ. 2020, 742, 140528. [Google Scholar] [CrossRef] [PubMed]
Figure 1. Schematic of the experimental setup (DO: dissolved oxygen, Chl. a: chlorophyll a). Reproduced with permission from [13] Kim et al., Science of the Total Environment; published by Elsevier, 2022.
Water 15 02467 g001
Figure 2. Structure of (a) the LSTM model and (b) LSTM cell (hidden unit). The number of hidden units depends on the number of hidden layers (L; i.e., number of hidden units = 2 L). Here, X is the input, h is the hidden state, C is the cell state, and y is the response variable.
Water 15 02467 g002
Figure 3. (a) Cyclic voltammetry analysis for capacitance calculation (CF—carbon fiber, and 300, 400, 500 are combustion temperatures), (b) reactivity of potential to dissolved oxygen (DO) concentration, and (c) schematic of capacitance and potential.
Water 15 02467 g003
Figure 4. Temporal changes in (a) DO concentration and (b) redox potential measured using a flexible carbon fiber electrode (ORP/C), (c) surface and bottom water temperature, (d) rainfall, (e) amount of sewage discharge, and (f) chlorophyll a concentration. Reproduced with permission from [13] Kim et al., Science of the Total Environment; published by Elsevier, 2022.
Water 15 02467 g004
Figure 5. Correlation between DO concentration and ORP/C in each phase.
Water 15 02467 g005
Figure 6. Correlation coefficient (R) network among WQ variables for the entire period and during each phase. Blue and red lines represent positive and negative correlations, respectively. WL—water level, DO—dissolved oxygen, Chl. a—chlorophyll a, ORP/C—redox potential measured using a flexible carbon fiber electrode, Sal—salinity, SWT—surface water temperature, and BWT—bottom water temperature.
Water 15 02467 g006
Figure 7. Observation and model simulation of dissolved oxygen concentration using (a) six WQ parameters, (b) ORP/C, and (c) WQ and ORP/C as predictors. The histograms of residual DO concentration obtained at intervals of ±0.2 mg L−1 are presented on the right side.
Water 15 02467 g007
Figure 8. Feature importance for DO prediction for the different phases and entire period. BWT—bottom water temperature, ORP/C—redox potential measured using a flexible carbon fiber electrode, dTemp—water temperature difference between surface and bottom, and SWT—surface water temperature.
Water 15 02467 g008
Table 1. Statistics of the measured water quality parameters.
DO
(mg L−1) a
ORP/C
(V) b
Water Level
(m)
SWT
(°C) c
BWT
(°C) d
dTemp
(°C) e
Salinity
(psu)
Precipitation (mm h−1)
Mean1.8−0.22.725.825.60.224.20.1
SD f2.90.10.94.23.12.02.40.8
Min.0.0−0.40.615.27.2−5.90.10.0
Median0.3−0.22.726.826.8−0.124.30.0
Max.22.50.44.935.533.811.829.516.5
Notes: a Dissolved oxygen; b Redox potential measured using a flexible carbon fiber electrode; c Surface water temperature; d Bottom water temperature; e Water temperature difference (SWT−BWT); and f Standard deviation.
Table 2. Hyperparameter input conditions.
HyperparameterCase
Prediction time step (h)0, 1, 6, 12, 24, 48
Sequence length (h)1, 6, 12, 24
Epoch300, 500, 1000, 2000
Layer depth1, 3, 5
Table 3. Optimal hyperparameters for the prediction time step of up to 48 h for three predictor combinations.
PredictorPrediction Time StepOptimal Hyperparameter
EpochLD aSL bR2RMSE
WQ020003120.741.32
120005120.711.43
4810003240.581.34
ORP/C010005120.761.09
110003240.551.29
4810005240.501.62
WQ-ORP/C01000560.801.08
12000560.691.33
4820005240.671.38
Notes: a Layer depth; b Sequence length. R2, Coefficient of determination; RMSE, Root mean square error; WQ, Water quality; and ORP/C, Redox potential measured using a flexible carbon fiber electrode.
Disclaimer/Publisher’s Note: The statements, opinions and data contained in all publications are solely those of the individual author(s) and contributor(s) and not of MDPI and/or the editor(s). MDPI and/or the editor(s) disclaim responsibility for any injury to people or property resulting from any ideas, methods, instructions or products referred to in the content.

