Abstract
This study used a two-stage network data envelopment analysis model to measure the water use efficiency of 108 cities in the Yangtze River Economic Belt in the initial water use and wastewater treatment phases from 2009 to 2019. We divided the urban water use efficiency of six significant urban clusters in the Yangtze River Economic Belt using the Dagum Gini coefficient. We also tested the convergence characteristics of urban water use efficiency in six significant urban clusters in the Yangtze River Economic Belt using convergence and convergence kinds. According to this report, the Yangtze River Economic Zone’s cities often have low levels of water use efficiency, which is primarily due to ineffective wastewater treatment. The 108 cities in the Yangtze River Economic Zone are divided into four types based on the average values of water use efficiency in the initial use and wastewater treatment phases; the highest number of cities are in the double-low category, with low average values of water use efficiency in the initial use and wastewater treatment phases. During the study period, spatial differences in urban water use efficiency in the Yangtze River Economic Zone narrowed, with the differences stemming mainly from hyperdensity, followed by intra- and inter-regional differences. Meanwhile, there is convergence in urban water use efficiency in the Yangtze River Economic Belt, significant β convergence in the urban agglomerations of the Yangtze River Delta, Jianghuai, middle reaches of the Yangtze River, Chengdu–Chongqing, and Central Yunnan, and insignificant β convergence in the Central Qian urban agglomeration. After considering control factors, such as industrial structure, financial development level, environmental regulation, economic development level, and science and education development level, the water use efficiency of the six major urban clusters in the Yangtze River Economic Belt converges faster, but the influence of these control factors on the water use efficiency of each urban cluster is heterogeneous. Research results have reference value for the development of improvement strategies on differentiated urban water use efficiency in the Yangtze River Economic Belt. By measuring the regional differences in water use efficiency of urban agglomerations in the Yangtze River Economic Belt and clarifying their convergence mechanism, it provides a basis for analyzing the spatial pattern of water use efficiency in urban agglomerations and has reference value for formulating differentiated urban water use efficiency improvement strategies in the Yangtze River Economic Belt.
1. Introduction
Accelerated urbanization and industrialization, urban water resource demand, and wastewater discharge increase have resulted in water resources and water environments becoming rigid conditions that constrain urban development. Under a certain scale of total water resources and supply, improving the efficiency of urban water resource utilization has become the key to alleviating the contradiction between supply and demand [1]. In 2016, the Ministry of Environmental Protection took the lead in the Yangtze River Economic Zone with a special action for environmental enforcement of drinking water sources; a total of 490 drinking water source problems were identified in 126 prefecture-level cities in 11 provinces and cities along the river [2]. The Ministry of Ecology and Environment and Development and Reform Commission jointly released the Action Plan for the Battle of Yangtze River Protection and Restoration Attack in January 2019, proposing to strengthen water environment management in cities at the prefecture level and above in response to water environment issues in the Yangtze River Economic Belt. In September 2022, 17 departments and units, including the Ministry of Ecology and Environment, National Development and Reform Commission, Supreme People’s Court, and Supreme People’s Procuratorate, jointly issued the In-depth Battle of Yangtze River Protection Action Plan for Restoring the Battle of the Yangtze River. This action plan provides measures to strengthen the construction of municipal sewage networks in cities at the prefecture level and above and to improve the centralized collection rate of urban domestic sewage. The Yangtze River basin is where 45.94% of China’s water resources are concentrated [3]. Moreover, cities along the river depend on it, and the problems of wasteful urban water resources, low utilization efficiency, prominent contradictions between supply and demand, and significant differences in regional water resource utilization efficiency still exist owing to various factors (e.g., water conservation and environmental protection technology, industrial structure, and economic development level) [4]. Accordingly, the key to solving these problems lies in improving urban water use efficiency and promoting inter-city collaborative management. Under the core concept of “ecological priority and green development”, improving urban water use efficiency in the Yangtze River Economic Zone is of immense practical significance for the high-quality development of this area.
A nonparametric system analysis technique called data envelopment analysis (DEA) that is based on the idea of production functions assesses the relative efficiency of decision units with numerous inputs and many outputs of the same kind [5]. Given that multiple inputs and outputs can be considered simultaneously and no specific functional forms need to be set [6,7], the DEA method is widely used for water use efficiency evaluation. The relevant research results focus on the following five aspects. (1) In the aspect of performance evaluation of the water sector, Carvalho et al. [8] noted that the performance application of the water sector includes the optimal scale of water facilities, scope economy of different service types and water supply production chains. Pinto et al. [9] incorporated the operating environment and service quality into the analysis framework to measure the water supply performance of different water systems. (2) Capital, labor, and water resources are used as input factors and gross regional product as output factors to measure water use efficiency and analyze its spatial and temporal characteristics and influencing factors. Francisco et al. [10] evaluated agricultural water use efficiency in Spain using DEA. He Wei et al. measured the water resource utilization efficiency of cities in the Yellow River basin by taking the total water supply, domestic water consumption, number of people using water, number of employed people, and total fixed asset investment as input indicators and the GDP of municipalities as output indicators. Additionally, they examined the effects of characteristics, including economic development level, industrial structure, level of marketization, and water resource endowment on the efficiency of water resource utilization [11]. Yao et al. [12] used the DEA model to examine the water utilization efficiency of Beijing, Tianjin, and Hebei and its spatial and temporal characteristics. They chose six indicators: water consumption of CNY 10,000 GDP, water consumption of CNY 10,000 industrial value added, pipeline network leakage rate, per capita daily domestic water consumption, sewage treatment rate, and crop water utilization efficiency. (3) Wastewater is included as a non-desired output element in DEA to measure water usage efficiency, taking into account the effects on the water environment. “Non-consensual” output was initially introduced into the productivity analysis method by Pittman et al. [13]. Since then, scholars have gradually included environmental pollution as a non-desired output in DEA models to analyze water use efficiency. Yang et al. [14] used the slacks-based model (SBM) to measure the water resource use efficiency of cities in the Huaihe eco-economic zone by including wastewater emissions as a non-desired output. Yue et al. [15] measured the green development efficiency of cities in the Yellow River Basin by taking real GDP, average urban residents’ wage, and park green area as desired outputs and industrial wastewater emissions as non-desired outputs. Gao et al. [16] used the super-efficient SBM (SE-SBM) model based on non-consensual outputs and selected total fixed asset investment, employment, and total water consumption as input indicators, and selected gross regional product and wastewater discharge as consensual output indicators and non-consensual output indicators, respectively, to measure the water resource utilization efficiency of 33 prefecture-level cities in Northwest China from 2010 to 2018. (4) Using a multi-stage DEA model to measure the efficiency of water resource use, we tried to open the “black box” of water resource use efficiency. Färe and Grosskopf constructed a multi-stage DEA model in an attempt to open the “black box” of multi-stage performance assessment. Tone and Tsutsui [17] developed a relaxation-based network DEA model. Li et al. [18] developed a two-stage network DEA model. Bian et al. [19] subdivided the entire water use process into an initial water use stage and a wastewater treatment stage and eventually built a two-stage DEA model to calculate water use efficiency and wastewater treatment efficiency. M. Moran Valencia et al. [20] constructed a two-stage DEA model to evaluate the efficiency of water system management in Mexico. Zhao et al. [21] used two stages to evaluate inter-provincial water resource efficiency in China. Based on a network SBM-DEA model and Global Malmquist–Luenberger (GML) index, Deng et al. [22] found large differences in industrial water use efficiency among Chinese provinces in the production and wastewater management stages. The hybrid network topology of the water resources system was used by Zhang et al. [23] to build a DEA model that measures water usage efficiency from two stages: initial water use and wastewater treatment stages. (5) From the provincial or central city level, the DEA or SBM model was used to study the water resource utilization efficiency of the Yangtze River Economic Zone. Ren et al. [24] measured the urban water use efficiency of the Yangtze River Economic Belt using the super-efficient DEA (SE-DEA) model and the Malmquist index and examined its influencing factors using the Tobit model. To measure the industrial green water efficiency of 11 provinces and cities in the Yangtze River Economic Belt from 2005 to 2014, Wang et al. [25] built the epsilon-based measure (EBM)–Tobit two-stage efficiency analysis model, incorporating industrial water use and water pollution discharge into the analytical framework. To measure the industrial green water efficiency of 11 provinces and cities in the Yangtze River Economic Belt from 2005 to 2014, Wang et al. [26] built the epsilon-based measure (EBM)–Tobit two-stage efficiency analysis model, incorporating industrial water use and water pollution discharge into the analytical framework. An et al. [4] used the SE-SBM model to measure the green water resources efficiency of 45 cities along the Yangtze River Economic Belt from 2010 to 2019. The following shortcomings exist in the existing studies. First, the scale of research is mainly focused on the provincial level, but no sufficient research has been conducted on cities with high production and domestic water consumption, particularly the water use efficiency of urban clusters, which is the main form of China’s new urbanization. Second, in terms of “black box” research on water resource utilization efficiency, the relevant research has mainly focused on industrial and agricultural water resources efficiency. Moreover, the results of “black box” research on urban water resource utilization efficiency are relatively few.
The existing achievements have made relative progress in terms of research objects, contents, and methods, but there is still room for expansion. The contributions of the current paper are as follows. (1) Given that the Yangtze River Economic Belt is a major national development region, of immense practical significance for the high-quality economic development of this region is to take its urban water use efficiency as the research object and to provide a new perspective for exploring urban water use efficiency research, to explore its regional differences and the convergence of urban water use efficiency from the perspective of urban clusters. (2) Considering the non-expected output as an intermediate variable into consideration, a two-stage network DEA model was established, which opened the “black box” of urban water use efficiency in the Yangtze River Economic Zone and provided a brand-new idea for evaluating urban water use efficiency, which uncovered the correlation between inputs and outputs in the urban water use system. These outcomes can more clearly and objectively reflect urban water use efficiency at different stages and propose more accurate urban water use efficiency improvement strategies. (3) Using the Dagum Gini coefficient and its decomposition, it not only describes the size and source of the difference but also effectively solves the overlapping between samples and reveals the size and source of the regional difference in water use efficiency of six urban agglomerations in the Yangtze River Economic Belt. With the help of σ convergence and β convergence, the convergence mechanism of water use efficiency of six urban agglomerations is explored, and the strategies to improve the water use efficiency of urban agglomerations are put forward. The structure of this paper is as follows: the second part introduces the research area, the third part introduces the research methods and data processing, the fourth part explores the regional differences and convergence characteristics of urban water use efficiency in the Yangtze River Economic Belt and analyzes the influencing factors of urban water use efficiency spatial differences, the fifth part discusses and puts forward policy recommendations, and the sixth part draws corresponding conclusions. The objectives of this study are: (1) to measure the two-stage water use efficiency of cities in the Yangtze River Economic Belt, (2) to analyze the regional differences in water use efficiency in urban agglomerations in the Yangtze River Economic Belt, and (3) to explore the convergence characteristics and influencing factors.
2. Overview of the Study Area
The Yangtze River Economic Belt is a new economic support belt of China based on the Yangtze River Golden Waterway, with urban agglomerations as the main form, covering nine provinces and two cities (i.e., Shanghai, Jiangsu, Zhejiang, Anhui, Jiangxi, Hubei, Hunan, Chongqing, Sichuan, Yunnan, and Guizhou) (Figure 1). With six urban agglomerations of various sizes and phases of development, including the Yangtze River Delta, Jianghuai, the middle reaches of the Yangtze River, Chengdu–Chongqing, Central Guizhou, and central Yunnan, this region makes for nearly 40% of the nation in terms of people and regional GDP [27]. With the advancement of urbanization, urban water consumption and wastewater emissions in the Yangtze River Economic Zone have been increasing, which has grown to be a significant element hurting the region’s biological environment’s ability to develop sustainably. Statistical data show that the total urban water supply in the Yangtze River Economic Belt from 2009 to 2019 increased from 173,808,568,000 m3 in 2009, accounting for 34.99% of the national proportion, to 239,137,793,000 m3 in 2019, accounting for 38.06% of the national proportion; urban wastewater discharge increased from 128,704,430,000 m3 in 2009, accounting for 34.67% of the national proportion rose, to 2,009,794 million m3 in 2019, accounting for 36.24% of the national proportion; and the region’s total urban water supply and wastewater discharge exceeded 1/3 of the country.
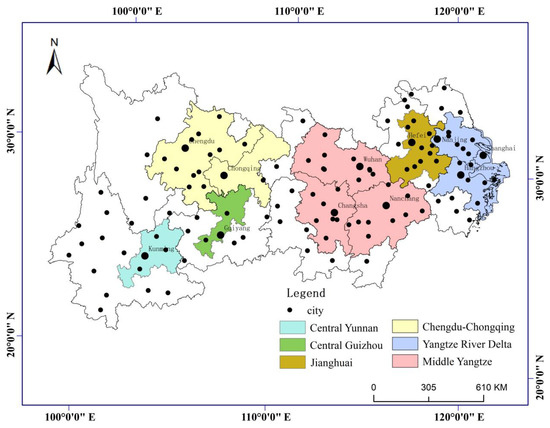
Figure 1.
Six major urban agglomerations in Yangtze River Economic Belt.
3. Research Methodology and Data Processing
3.1. Two-Stage Network DEA Model
Urban water use is a long-term process, and its performance evaluation can be divided into two stages: preliminary water use and sewage treatment; therefore, the phased assessment of urban water use efficiency is worth investigating. This process starts with urban water supply facilities and is transported to each water-using unit through urban water supply pipelines. After the initial water use stage, the corresponding economic, ecological, and social expected output is produced, and the corresponding non-expected output of sewage is discharged, so the two must be treated separately. After the initial water use stage, each water-using unit in the city collects urban sewage through urban drainage pipes to urban sewage treatment facilities and generates the corresponding sewage treatment volume after the sewage treatment stage. The volume of sewage discharge links the original water use and sewage treatment processes. Sewage treatment investment is added to the sewage treatment process as a second stage input factor. On the basis of the aforementioned urban water use, this research constructs a two-stage network DEA model of urban water use efficiency and attempts to open the “black box” of urban water use systems (Figure 2). In the first stage of initial water use, capital, labor, and water input indicators are indispensable. Capital input is characterized by fixed asset investment in urban municipal utility construction and the length of water pipelines, labor input is characterized by urban water population, and water input is characterized by total urban water supply. The desired output should include economic, ecological, and social aspects, and it includes the gross regional product, green area, and the average wage of employees on the job; the non-desired output is sewage discharge. In the second stage of wastewater treatment, the input elements include the “non-desired output” of the initial water use stage and the length of drainage pipes, and the desired output is the total amount of wastewater treatment.
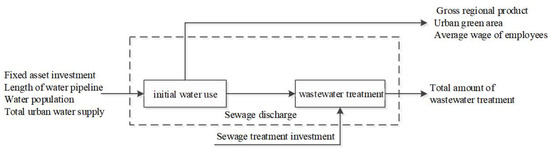
Figure 2.
Urban water system structure.
In the traditional DEA efficiency evaluation system, only initial inputs and final outputs should be considered, the influence of relevant intermediate inputs and outputs on the overall efficiency is disregarded, and substantial important information is lost in an invisible way [28]. In real production activities, the system consists of several departments that collaborate with each other to complete various production activities. When studying the system input–output efficiency, the efficiency of different departmental inputs and outputs should be understood. Thus, Färe and Grosskopf [16] proposed a network DEA model to open the “black box” of the evaluation system and uncover the correlation between inputs and outputs in the system. Guo et al. [29] divided haze generation and treatment into two stages and constructed a two-stage DEA model with intermediate input and intermediate output, which well measured the emission efficiency of haze generation and treatment stage in 31 provinces in China. Given that there are various forms of network structure models [30,31,32], this research chooses a combination of network structures for urban water input–output efficiency measurement. The first and second phases of the first city’s two-stage efficiency are referred to as the first and second stages, and the efficiency of the decision unit in the first and second stages can be determined by the first of the two models below [29]:
where m denotes the number of inputs, s denotes the number of outputs, D denotes the number of denotes intermediate outputs, n denotes the number of decision units, denotes the efficiency of the decision unit in the first stage, denotes the efficiency of the decision unit in the second stage, denotes the ith input indicator of the kth decision unit in the urban initial water use phase, denotes the rth output indicator of the kth decision unit in the urban initial water use phase, denotes the intermediate product, and and denotes the weights of and and ; denotes the pth input indicator of the kth decision unit in the urban initial water use stage, and denotes the gth output indicator of the kth decision unit in the urban initial water use stage, and and are, respectively, the weights of and and . The assumption is that the intermediate product is the output and input of the first and second stages, respectively, and the weights of the first and second stages are equal.
3.2. Dagum’s Gini Coefficient and Decomposition Method
Urban clusters’ and their sources’ geographic variations in water consumption efficiency were examined using the Dagum Gini coefficient approach. This method can not only describe the size and source of difference but also effectively solve the cross-overlap between samples, making up for the shortcomings of the traditional Gini coefficient and Theil index. The Gini coefficient G is defined as follows using the Gini coefficient Dagum proposed and its division into subgroups [33]:
where , h is the different regional subscripts, i and r are city subscripts, n is the total number of cities, k is the total number of regions, and is the number of cities within the j(h)th region. In addition, is the water use efficiency of city i(r) within region j(h) and is the average of the water use efficiency of all cities.
In decomposing the overall Gini coefficient G by region, the k regions were ranked according to the average of urban water efficiency in each region. Thereafter, the Gini coefficient G was decomposed into three components: the contribution of intra-regional (within-group) variation to G, the contribution of intra-regional (inter-group) differences to G, the contribution of inter-regional (inter-group) differences to G, and the contribution of inter-regional (inter-group) hyper-variance density to G. The three components satisfy G = , where the Gini coefficient of region j and the intra-regional variance are calculated using Equations (4) and (5), respectively. The Gini coefficients between regions j and h and the inter-regional net difference are Equations (6) and (7), respectively. The formula for calculating the inter-regional hypervariable density is given in Equation (8).
In Equation (7), ; ; j = 1, 2, 3… In Equation (9), is the relative impact of urban water use efficiency between regions j and h (see Equation (11)); is the difference in urban water use efficiency between regions (see Equation (10) and represents the mathematical expectation of all , which is the mathematical expectation of the sum of the samples between regions j and h; is the hypervariable first-order moment, which represents the mathematical expectation of all in regions j and h.
where denotes the cumulative distribution function of urban water use efficiency in region j(h).
3.3. Convergence Model
An examination of convergence, including convergence and convergence, was conducted to look at the evolutionary tendency of water use efficiency along the Yangtze River Economic Zone and urban clusters.
In particular, convergence means that the deviation of water use efficiency in different regions shows a decreasing trend with time. The coefficient of variation is used to measure convergence, with the following equation [34]:
where denotes convergence coefficient, j denotes the number of regions (j = 1, 2, 3…), i denotes the number of cities in the region (i = 1, 2, 3…), is the number of cities in each region, and is the average value of urban water use efficiency in region j in period t.
The convergence model is as follows [29]:
The left-hand side of the convergence is the growth rate of urban water use efficiency calculated using the log-difference. is the convergence coefficient, is a fixed effect, is the time fixed effect, is the random error term, and t is the time of the probation period span.
By including a number of control variables, the conditional convergence model transforms the convergence model into an absolute convergence model. In this study, other control variables include population density, economic development level, industrial structure, financial development level, and levels of science and education. This is the conditional convergence model:
The regression takes logarithms for each variable. This research uses a two-way fixed effects model to improve the coefficient estimation accuracy. Robust error criteria are used for clustering to the city level. If and significant, then there is convergence in urban water use efficiency, and if vice versa, then there is divergence. The rate of convergence .
3.4. Data Sources and Processing
China City Statistical Yearbook is an informative annual publication that comprehensively reflects the socioeconomic development of Chinese cities. This publication contains the main statistical data on the socioeconomic development of cities above the prefecture level nationwide. Data on the gross regional product, green area, the average wage of employees on the job, gross secondary industry, employed population, the balance of deposits and loans, expenditure on science and technology and education as a percentage of public expenditure, among others, are directly obtained from the China Urban Statistical Yearbook 2010–2020. The China Urban Construction Statistical Yearbook comprehensively reflects the construction and development of urban and rural municipal utilities in China and is published publicly once a year. Data on fixed asset investment in municipal utility construction, the length of water supply pipes, the length of drainage pipes, the population of water users, total water supply, sewage discharge, and total sewage treatment are directly obtained from the China Urban Construction Statistical Yearbook 2010–2020. In particular, investment in fixed assets for the construction of urban municipal utilities is calculated using the perpetual inventory method, the formula of which is , where and denote the number of provinces in the capital stock, fixed asset investment, and capital depreciation rate in the period. Capital stock in the base period is calculated using the formula , where gi is the geometric average growth rate of fixed asset investment in the province. Before estimating the stock, fixed asset investments in urban municipal utility construction have been translated to equivalent prices for the base period of 2009 alone. Gross regional product is converted to constant prices using 2009 as the base year based on the resident consumption index.
Among the control variables, population density is measured using the proportion of the resident population in the land area of the region; industrial structure is measured using the share of GDP of the secondary industry in GDP and taking the logarithm. Marketization level is measured using the share of employment in the tertiary industry in total employment. The level of financial development is measured using the share of deposit and loan balance in GDP and taking the logarithm. Lastly, the level of science and education is measured using the share of expenditure on science, technology, and education in public expenditure. Descriptive statistics are shown in Table 1.

Table 1.
Descriptive statistics.
4. Results and Analysis
4.1. General Characteristics of Urban Water Use Efficiency in the Yangtze River Economic Zone
From 2009 to 2019, the initial water use stage, pollution control stage, and overall water use efficiency of cities in the Yangtze River Economic Zone showed the evolution characteristics of “decline–rise–decline” (Figure 3). Note that after 2017, the initial urban water use phase, pollution treatment phase, and overall water use efficiency declined. Such a decline indicates that although the Yangtze River coastline industries are transforming, upgrading, and developing green, they should also focus on the economical and intensive use of urban water resources, strengthen urban sewage treatment, and improve urban water use efficiency. The average values of the urban initial water use stage, sewage treatment stage, and overall water use efficiency are 0.708, 0.632, and 0.507, respectively. Compared with optimal efficiency, there is still room for improvement potential of 29.2%, 36.8%, and 49.3% (Table 2), respectively. This result indicates that the overall efficiency level of urban water use is low, and the problems of urban water waste and water environment management are prominent. The low overall efficiency level of urban water use mainly comes from the low efficiency of water use in the urban wastewater treatment stage.
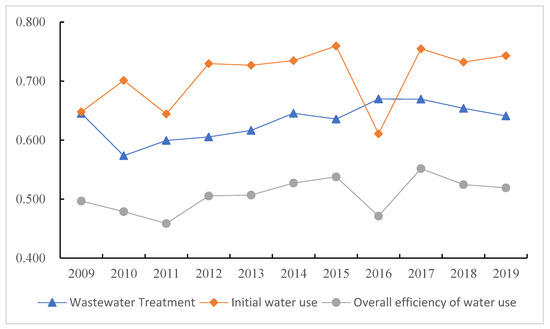
Figure 3.
Urban water use efficiency evolution from 2009 to 2019.
Table 2.
Average urban water use efficiency values from 2009 to 2019.
Table 2 shows that the highest mean value of initial water use phase efficiency from 2009 to 2019 is 0.909 for the Central Yunnan urban agglomeration, followed by the urban agglomerations of the Yangtze River Delta (0.867), Central Qian (0.746), Chengdu–Chongqing (0.668), Middle Yangtze River (0.649), and Jianghuai (0.624). Shanghai, Nanjing, Changzhou, Suzhou, Yangzhou, Hangzhou, Ningbo, Zhoushan, Wuhan, Xiangfan, Changsha, Chongqing, Yuxi, Lijiang and Lincang have the best initial water use efficiency of 1.000. Moreover, the highest pollution control efficiency of 0.682 is in the Central Yunnan urban agglomeration, followed by the urban agglomerations of the Middle Yangtze River (0.660), Jianghuai (0.634), Central Guizhou (0.625), Yangtze River Delta (0.623), and Chengdu–Chongqing (0.597). The average value of water use efficiency in the pollution control stage in Shanghai reaches the optimal 1.000; those in Nanjing, Changsha, Lincang, and Liupanshui exceed 0.900; and those of all other cities are below 0.900. These results indicate that most cities have low efficiency values in the sewage control stage, which is a key element of urban water environment control in the future. The highest average value of overall urban water use efficiency is 0.645 in the Yunnan Central urban agglomeration, followed by the urban agglomerations in the Yangtze River Delta, Central Guizhou, Yangtze River Central, Chengdu–Chongqing, and Jianghuai. Except for Shanghai, where the average value of overall water use efficiency is 1.000, and Nanjing, Pingxiang, Yingtan, Wuhan, Changsha, Guang’an, and Lincang, where the average value of overall water use efficiency is above 0.800, all other cities are below 0.800, indicating that most cities have low overall water use efficiency, and it should pay attention to the water efficiency of the vast majority of cities.
From the changes in the average value of urban water use efficiency from 2009 to 2019, the average value of urban initial water use stage efficiency showed an increasing trend, from 0.648 in 2009 to 0.743 in 2019. The average value of water use efficiency in the wastewater treatment stage showed a decreasing trend, from 0.645 in 2009 to 0.641 in 2019. Lastly, the average value of water use efficiency in the wastewater treatment stage was lower than that in the initial. In comparison to the equivalent period in the initial water use stage, the average value of water usage efficiency in the sewage treatment stage is lower. It showed that the water efficiency of the two stages showed uneven characteristics. From different areas, the average value of water use efficiency in the initial water use stage of the Yangtze River Delta, middle reaches of the Yangtze River, Chengdu–Chongqing, and Central Yunnan urban agglomerations relatively increased. Meanwhile, the Jianghuai and Central Guizhou urban agglomerations decreased relatively. Accordingly, there is a certain degree of decline. It shows that there are differences in water use efficiency in different urban agglomerations, and differentiated strategies should be implemented in future governance processes.
4.2. Classification of City Types in the Yangtze River Economic Zone
On the bases of the average values of water use efficiency in the initial water use and wastewater treatment stages of cities from 2009 to 2019, vertical dividing Line1 was the average water use efficiency in the primary water use stage, and horizontal dividing Line2 was the average water use efficiency in the sewage treatment stage. Meanwhile, the 108 cities were divided into four basic types: high–high type (high water use efficiency values in the initial water use and wastewater treatment stages of cities), high–low type (high water use efficiency values in the initial water use and low water use efficiency values in the wastewater treatment stages of cities), low–high type (low water use efficiency values in the initial water use and high water use efficiency value in the urban initial water use phase and low water use efficiency value in the sewage treatment phase), and low–low type (low water use efficiency value in the urban initial water use and sewage treatment phases) (Figure 4).
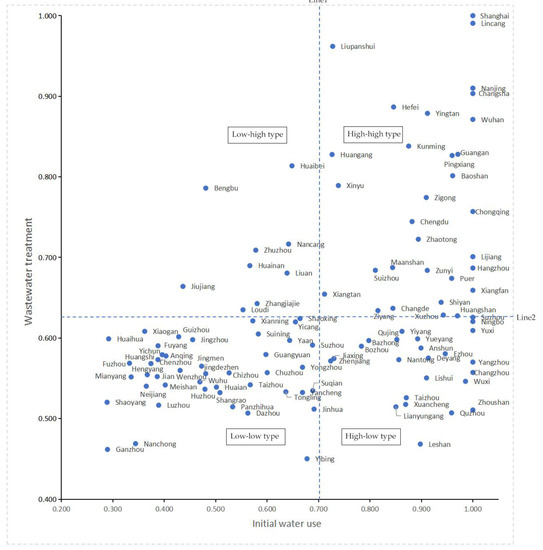
Figure 4.
Classification of urban water efficiency types.
(1) High–high type cities. Shanghai, Nanjing, Wuhan, Chengdu, Chongqing, Kunming, and 29 other cities belong to the high–high type. That is, the average values of water use efficiency in the initial water use and sewage treatment stages of cities are high, accounting for approximately 26.85% of the total number of cities. Most cities in the center of urban clusters belong to this type. Note that except for Shanghai, other cities belong to the high–high type, but sewage treatment efficiency is not optimal. In addition, these cities still need to increase their sewage treatment effort and improve water use efficiency in the sewage treatment stage.
(2) High–low type cities. Ningbo, Suzhou, Wuxi, Changzhou, Yueyang, Quzhou, Nantong, and 26 other cities belong to the high–low type. That is, the average values of water use efficiency in the initial water use and sewage treatment stages are high and low, respectively, accounting for approximately 24.07% of the total number of cities. Although the average value of urban initial water use efficiency in these cities is high, the average value of water use efficiency in the sewage treatment stage is low owing to the influence of such factors as urban industrial structure and industrial foundation. Consequently, urban sewage treatment becomes difficult and exerts considerable pressure on the water environment.
(3) Low–high type cities. Nanchang, Zhuzhou, Jiujiang, Loudi, Bengbu, Huabei, and nine other cities belong to the low–high type. That is, the average values of water use efficiency in the initial water use and sewage treatment stages are low and high, respectively, accounting for approximately 8.33% of the total number of cities. These cities are mainly located in the middle reaches of the Yangtze River, and there are still water waste problems in urban water use.
(4) Low–low type cities. Guiyang, Wenzhou, Yibin, Huaihua, Ganzhou, Panzhihua, Tongling, and 44 other cities belong to the low–low type. That is, the average value of water use efficiency in the initial water use and sewage treatment stages of cities is low, accounting for approximately 40.74% of the total number of cities, with a large number and high proportion. These cities have many resource-based industries with heavy energy consumption and high pollution, and their sewage treatment and industrial technologies are relatively backward [30].
4.3. Decomposition of Water Use Efficiency Differences among Urban Agglomerations in the Yangtze River Economic Zone
This study calculates and decomposes the Dagum Gini coefficient in order to identify the variations in water use efficiency between the Yangtze River Economic Zone’s minor cities and the six largest urban agglomerations.
Table 3 indicates that the overall urban water use efficiency Gini coefficient shows a downward trend in fluctuation. The Gini coefficient decreased from 0.271 in 2009 to 0.184 in 2019 (a decrease of 0.087), indicating a reduction in overall variation. The mean contributions of the three types of density—intra-regional, inter-regional, and hypervariable—were 20.42%, 20.01%, and 59.57%, respectively, during the course of the sample period. This result indicates that the sources leading to the differences in water use efficiency of urban agglomerations in the Yangtze River Economic Belt were (in order) hypervariable density, intra-regional differences, and inter-regional differences. Among them, hypervariable density is the main source of differences among urban clusters in the Yangtze River Economic Belt. Moreover, its changes show a fluctuating downward trend, indicating that water resources management and governance among cities in the Yangtze River Economic Belt are insufficiently integrated and coordinated [31]. In addition, water resource utilization and pollution crossover problems among cities are serious, making it the main source of urban water use efficiency differences. The contribution rate of intra-regional differences shows a slightly increasing development in fluctuation, even though the change is small, which is within the range of 19.80% to 21.10%. Inter-regional variation initially declines and increases thereafter, with a greater variation than the intra-regional variation and within the range of 14.58% to 30.92%. From the changing trend, the source of regional difference contribution rate changes from inter-regional water use efficiency cross-term to inter-regional difference, indicating that water use system management and water environment management in the Yangtze River Economic Zone were effective in these years.
Table 3.
Decomposition of the Gini coefficient of urban water use efficiency.
The differences within the six major urban agglomerations (i.e., Yangtze River Delta, Jianghuai, Yangtze River midstream, Chengdu–Chongqing, Central Guizhou, and Central Yunnan) show a respective decreasing development (Figure 5). In terms of intra-regional variation, the urban agglomerations of Chengdu–Chongqing, the middle reaches of the Yangtze River, and Jianghuai are in the top three, with mean values of 0.258, 0.246, and 0.199, respectively. The urban agglomerations of Central Yunnan, Central Qian, and Yangtze River Delta are in the bottom three, with mean values of 0.108, 0.169, and 0.171, respectively. A possible reason is that there are fewer cities in the Central Yunnan and Central Guizhou urban agglomerations, and most of them are provincial capitals or central cities. Hence, the mean value of urban water efficiency is higher. In terms of the size of the differences, the Gini coefficients of the six major urban agglomerations are characterized by staggered changes (Figure 5), with the largest intra-regional Gini coefficients in the middle Yangtze River from 2009 to 2013 and the largest Gini coefficients in Chengdu–Chongqing from 2014 to 2018. Overall, the Gini coefficients of the middle Yangtze River urban agglomeration are relatively large. The differences are consistently smallest and relatively small in the Central Yunnan and Central Qian urban agglomerations. This result indicates that urban imbalance within the Chengdu–Chongqing and the middle reaches of the Yangtze River urban agglomerations is more prominent, and urban imbalance within the Central Yunnan and Central Qian urban agglomerations is weaker.
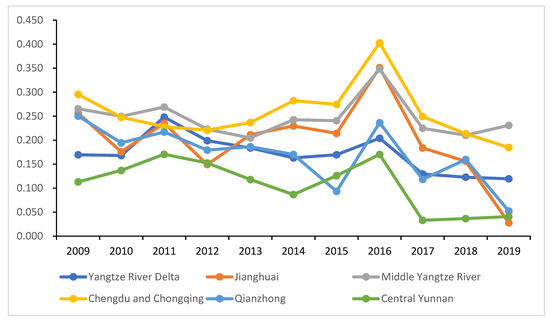
Figure 5.
Intra-regional variation in water use efficiency.
In terms of the evolution of inter-regional differences, the differences among the six major urban agglomerations all show a decreasing trend in fluctuations (Figure 6). Among them, the urban agglomerations of JAC and Central Guizhou, Central Yunnan and Yangtze River Delta, and Central Guizhou and Chengdu–Chongqing ranked in the top three in terms of decline, decreasing by 78.05%, 49.15%, and 46.57%, respectively. In terms of the difference values between regions, the largest difference values are found between the urban agglomerations of Chengdu–Chongqing and middle Yangtze River, Chengdu–Chongqing and Central Yunnan, and Chengdu–Chongqing and Jianghuai, with mean values of 0.259, 0.248, and 0.245, respectively, during the sample period. Large discrepancies between the upper, medium, and lower reaches of urban agglomeration are indicated by this conclusion. The possible main reason is the differences in socioeconomic levels and urban development stages between the upper, middle, and lower reaches of the urban agglomerations, resulting in different water resource utilization efficiency and wastewater management levels.
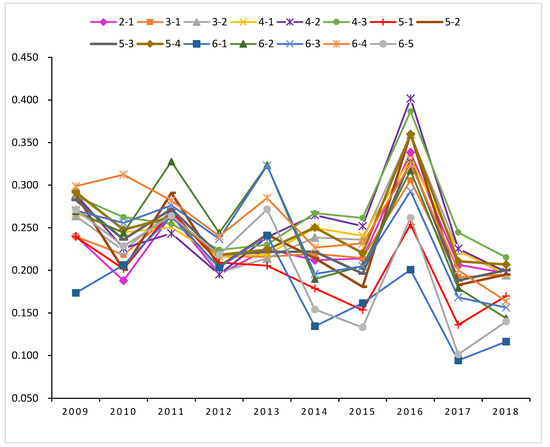
Figure 6.
Inter-regional differences in water use efficiency. Note: 1. Yangtze River Delta City Cluster, 2. Jianghuai City Cluster, 3. Middle Yangtze River City Cluster, 4. Chengdu–Chongqing City Cluster, 5. Central Guizhou City Cluster, 6. Central Yunnan City Cluster.
4.4. Convergence Analysis of Water Use Efficiency of Urban Clusters in the Yangtze River Economic Zone
4.4.1. σ. Convergence Analysis
The convergence coefficient of σ for the water use efficiency of cities in the Yangtze River Economic Zone decreased from 0.482 in 2009 to 0.338 in 2019 (a decrease of 29.86%). These results indicate that there is σ convergence in the water use efficiency of cities in the region. That is, the regional differences in the water use efficiency of cities in the region have narrowed, which is consistent with the results of the study that the water use efficiency of cities in the region as measured by Dagum’s Gini coefficient is on a narrowing trend. The convergence coefficients of σ for the water use efficiency of the six major urban agglomerations all decreased to different degrees, indicating that their water use efficiency converged to σ (Figure 7). That is, the regional differences in water use efficiency of the six major urban agglomerations decreased.
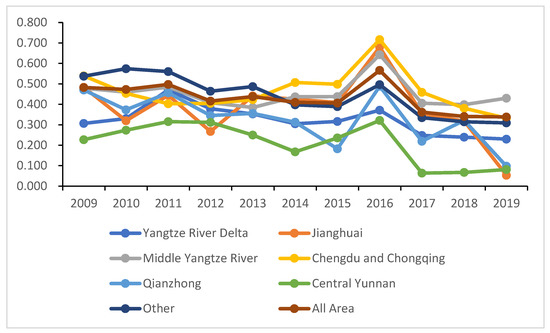
Figure 7.
Evolution of σ convergence of water use efficiency.
4.4.2. β-Absolute Convergence Analysis
Table 4 reports the results of the absolute β convergence test of water efficiency in urban agglomerations in the Yangtze River Economic Belt. Overall, the global convergence coefficient of the Yangtze River Economic Belt is significantly negative at the 1% level, indicating that there is an absolute convergence trend β. From difficult areas, the absolute β convergence coefficients of water use efficiency of the Yangtze River Economic Belt, Yangtze River Delta, Jianghuai, middle Yangtze River, Chengdu–Chongqing, and Central Yunnan urban agglomerations are all negative at 1% significance, indicating a β convergence of urban water use efficiency. In other words, the disparity in urban water use efficiency is diminished. The absolute β convergence coefficient of water use efficiency of the Central Guizhou urban agglomeration is negative, but it does not pass the significance test, indicating an insignificant absolute β convergence. On the basis of the absolute value of the β convergence coefficient, a comparison of the convergence speeds of urban water use development efficiency of urban clusters indicated that convergence speed differs significantly among urban clusters, with the fastest and slowest convergence speeds in the urban clusters of Central Yunnan (18.71%) and Yangtze River Delta (8.49%), respectively. It shows that the water efficiency of cities in different urban agglomerations will gradually tend to the same steady-state level at different convergence speeds.
Table 4.
Absolute β convergence of water use efficiency.
4.4.3. β-Conditional Convergence Analysis
According to the conditional β convergence results(Table 5), the Chengdu–Chongqing, Central Yunnan, and Central Guizhou urban agglomerations, Yangtze River Economic Belt, Yangtze River Delta, Jianghuai, Yangtze River midstream, and Yangtze River are all Yangtze River urban agglomerations with considerably negative convergence coefficients at the 1% level. This result indicates that conditional β convergence exists for the entire Yangtze River Economic Belt and the urban water use efficiency of the six major urban agglomerations. Compared with the absolute value of the absolute β convergence coefficient, the absolute values of the conditional β convergence coefficients of the Yangtze River Economic Belt, Yangtze River Delta, Jianghuai, Yangtze River midstream, Chengdu–Chongqing, Central Yunnan, and Central Guizhou urban agglomerations are larger. This result indicates that their urban water use efficiency converges faster after considering the control factors, such as industrial structure, financial development level, environmental regulation, economic development level, and science and education development level.
Table 5.
Water use efficiency condition β convergence.
The industrial structure has a significant negative impact on the improvement of water use efficiency in the entire Yangtze River Economic Belt and the middle reaches of the Yangtze River and the metropolitan centers in the Yangtze River Delta and a significant positive impact on the improvement of water use efficiency in the cities of Central Guizhou urban agglomeration. This finding suggests that the industrial structure will hinder the urban agglomerations of the Yangtze River Delta and the middle reaches of the Yangtze River from converging to a higher steady-state level and the water usage efficiency of the entire region from increasing. The reason is that the industrial structure of cities in the Yangtze River Economic Zone is biased toward heavy chemical industries, and the pressure on water resource utilization efficiency increases owing to energy consumption and pollutant emissions during industrial structure transformation and upgrading. The industrial structure will promote the convergence of the water use efficiency of the urban cluster in Central Guizhou to a higher steady-state level, indicating that the industrial structure adjustment in Guizhou has been effective over the years, thereby promoting urban water conservation and sewage treatment.
In the entire Yangtze River Economic Belt, the Yangtze River Delta, and the Chengdu–Chongqing city clusters, the level of financial growth has a substantial detrimental impact on the improvement of water usage efficiency. This result indicates that financial development levels will prevent urban water use efficiency from converging to a higher steady-state level. This outcome may be related to the fact that the development of urban financial markets is still immature, the financial system is not perfect, and financial regulation capacity is insufficient. These problems in the financial market restrict the improvement of urban water use efficiency.
In the middle reaches of the Yangtze River and Central Guizhou urban agglomerations, environmental regulation has a significant positive impact on the improvement of water use efficiency; however, it has a significant negative impact on the improvement of water use efficiency in the central Yunnan urban agglomeration. This result indicates that environmental regulation promotes the convergence of water use efficiency to a higher steady-state level in the middle reaches of the Yangtze River and Central Guizhou urban agglomerations, and vice versa in the Central Yunnan urban agglomeration. Strict environmental regulations can promote water conservation and improve urban water consumption efficiency and wastewater treatment efficiency in the middle reaches of the Yangtze River and Central Guizhou urban agglomerations. Meanwhile, urban wastewater treatment costs increase in the Central Yunnan urban agglomeration under the constraint of strict environmental regulations, thereby hindering the improvement of urban water use efficiency.
The middle reaches of the Yangtze River urban cluster and the entire Yangtze River Economic Belt both benefit greatly from the degree of research and education growth. The reason is that the development of science and education levels can promote the study and development of technology that reduces emissions and saves energy, improvement of water use processes, and improvement of sewage treatment levels.
5. Discussion
(1) The Yangtze River Economic Zone’s “black box” of urban water use efficiency can be opened by the two-stage network DEA model, which measures the degree of efficiency in the initial water consumption and wastewater treatment phases. The results of the study show that the overall efficiency of urban water use in the Yangtze River Economic Zone is low, which is consistent with the findings of the study in [35,36]. According to data from the two-stage network DEA model, the low level of water use efficiency in the wastewater treatment stage is mostly to blame for the low level of overall urban water use efficiency. Zhang et al. [37] showed that the efficiency of the industrial production water use phase in the Yangtze River Economic Zone is higher than that of the wastewater treatment phase, which has some similarities with the findings of the current study. Thus, the key to improving urban water use efficiency in the Yangtze River Economic Belt currently lies in improving the efficiency of urban wastewater treatment. On the one hand, urban water conservation technology and process transformation should be strengthened, and the level of urban water conservation and intensification must be improved. On the other hand, there is a need to strictly control urban wastewater discharge, increase urban wastewater treatment, improve wastewater treatment process and technology, increase the rate of centralized wastewater treatment, and promote the improvement of urban wastewater treatment efficiency.
(2) The basin economy has the regional economic and water resources’ common characteristics [38]. The Yangtze River Economic Belt spans a large geographical area, and the differences in natural conditions and resource endowments lead to different degrees and modes of development, which eventually manifest in some form of urban economic and social–spatial differentiation and segmental variability [39]. Thus, influenced by such factors as city scale, development stage, and resource endowment, urban water efficiency in the Yangtze River Economic Belt has significant spatial differences [40], showing the spatial characteristics of provincial capital cities and central cities with high water efficiency values, similar to the findings of reference [41]. For the mean values of water efficiency of urban clusters, the urban cluster of central Yunnan in the upper reaches of the Yangtze River has the highest mean values of initial water use phase, wastewater treatment phase, and overall efficiency. Central Qian and Chengdu–Chongqing, two urban centers on the upper reaches of the Yangtze River, also place highly. The possible reason is that the urban clusters in the upper reaches of the Yangtze River are mostly composed of provincial capitals or regional central cities. Moreover, there are only a few cities with high mean values of urban water use efficiency. The Central Yunnan urban agglomeration, for instance, only consists of the three prefecture-level cities of Kunming, Qujing, and Yuxi. A significant factor is also the superior performance of upstream cities’ municipal wastewater management systems [38]. In view of the significant spatial differences in urban water use efficiency, differentiated urban water use efficiency improvement strategies should be formulated based on the technical and economic conditions and resource endowments of different regions. The technical and economic advantages of provincial capital cities or regional central cities in water use efficiency should be considered. Through their driving and diffusion effects, collaborative urban water use efficiency governance should be promoted, particularly collaborative governance and integrated planning among cities within urban clusters. Additionally, cities’ water consumption efficiency needs to be increased. Non-provincial capital cities and non-regional central cities need to take the initiative to absorb regional spillover funds and technologies from provincial capital cities and regional central cities to effectively promote the improvement of local water use efficiency.
(3) When improving urban water use efficiency in the Yangtze River Economic Belt, focus should be given to the heterogeneity of factors, such as industrial structure, financial development level, environmental regulation, level of economic development, and science and education development level on urban water use efficiency [42]. Moreover, the positive effects of these factors must be highlighted. For example, optimizing the industrial structure, promoting economic transformation, attaching importance to the utilization efficiency of water resources, and promoting intensive economic development. Increasing investment in science and technology education and strengthening the innovation of water resources monitoring technology. Given that the six largest metropolitan agglomerations in the Yangtze River Economic Belt vary in size and stage of development, the factors affecting their urban water use efficiency vary. Therefore, in terms of intensive urban water resource utilization and sewage treatment, differentiated combination strategies should be formulated based on the factor endowment, socioeconomic development stage, and industrialization level of the urban agglomerations to promote urban water use efficiency. For example, the middle reaches of the Yangtze River and Central Guizhou urban agglomerations need to strengthen the construction of environmental regulation and play their role in promoting urban water use efficiency. Urban agglomerations in the Yangtze River Delta and Chengdu–Chongqing need to tighten control over their financial markets, improve the financial system, and enhance the financial regulation capacity to encourage greater urban water use efficiency.
6. Conclusions
From 2009 to 2019, the Yangtze River Economic Belt’s urban water consumption efficiency was evaluated using the two-stage DEA model. Moreover, the Dagum Gini coefficient was used to measure and decompose the differences in water use efficiency between the six largest urban areas in the Yangtze River Economic Belt. Lastly, the σ convergence, β convergence, and β conditional convergence of the urban agglomerations’ water use efficiency were tested. The main findings are as follows.
(1) The overall efficiency of urban water use in the Yangtze River Economic Zone shows a trend of growth in fluctuation. However, the overall efficiency level of urban water use is low, mainly from the low efficiency of water use in the sewage treatment stage. Urban water use efficiency varies significantly depending on location, with province capital cities and regional centers generally having high water use efficiency ratings. The urban agglomeration of Central Yunnan upstream has a high average rating for water use efficiency. On the basis of the average values of water use efficiency in the initial water use and sewage treatment stages from 2009 to 2019, 108 cities can be divided into four types. Moreover, the number of cities with the double-low type, where the average values of water use efficiency in the initial water use and sewage treatment stages are low, is the largest, accounting for approximately 40.74% of the total number of cities.
(2) The Dagum Gini coefficient decomposition for the spatial differences in water use efficiency of urban clusters in the Yangtze River Economic Belt and their sources reveals that the differences in water use efficiency of cities in the Yangtze River Economic Belt decreased over the study period. In addition, the differences mainly originated from super density differences, followed by intra- and inter-regional differences. The differences in water use efficiency among the six major urban agglomerations in the Yangtze River Economic Belt also narrowed, and intra- and inter-urban differences showed a decreasing development.
(3) There is σ convergence in water consumption efficiency for the entire Yangtze River Economic Belt and the six largest metropolitan agglomerations. Moreover, there is significant β convergence in the entire Yangtze River Economic Belt, Yangtze River Delta, Jianghuai, the Yangtze River’s middle reaches, Chengdu–Chongqing, and Central Guizhou urban agglomerations and insignificant absolute β convergence in the Central Guizhou urban agglomeration. After considering control factors, such as industrial structure, financial development level, environmental regulation, economic development level, and science and education development level, the water use efficiency of the six major urban agglomerations converges faster, but its influence on each urban agglomeration differs.
Author Contributions
Conceptualization, Y.X. and Z.D.; methodology, Y.X., Y.Z. and S.D.; data curation, Y.X., S.D. and W.S.; writing, Y.X., Z.D., S.D. and W.S.; supervision Z.D.; funding acquisition, Y.X. All authors have read and agreed to the published version of the manuscript.
Funding
This research was supported by funds from the National Social Science Foundation of China (22BJL124).
Data Availability Statement
Data are available in a publicly accessible repository.
Conflicts of Interest
The authors declare no conflict of interest.
References
- Cai, G.; Songkui, Y. Spatial and temporal evolution of urban water use efficiency in Northwest China and club convergence analysis. Econ. Econ. 2021, 38, 5–13. [Google Scholar]
- Xiang, Y.B.; Wang, S.Y.; Dai, Z.J. Green Development Efficiency Measurement and Influencing Factors of the Paper Industry in Yangtze River Economic Belt. Water 2021, 13, 1286. [Google Scholar] [CrossRef]
- Tian, G.L.; Li, J.J.; Li, L.L. Study on the virtual water flow pattern of Yangtze River economic zone based on multi-regional input-output model. China Popul. Resour. Environ. 2019, 29, 81–88. [Google Scholar]
- Hui, A.; Wang, Y.; An, M.; Wang, L. Spatial and temporal evolution of water resources green efficiency and water conservation and emission reduction potential in cities along the Yangtze River Economic Belt. Yangtze River Basin Resour. Environ. 2023, 32, 692–705. [Google Scholar]
- Charnes, A.; Cooper, W.W.; Rhodes, E. Measuring the efficiency of decision making units. Eur. J. Oper. Res. 1978, 6, 429–444. [Google Scholar] [CrossRef]
- Win, G. A study on green development performance and its influencing factors in eight integrated economic zones in China. Res. Quant. Econ. Technol. Econ. 2019, 36, 3–23. [Google Scholar]
- Andersen, P.; Petersen, N.C. A procedure for ranking efficient units in Data Envelopment Analysis. Manag. Sci. 1993, 39, 1261–1264. [Google Scholar] [CrossRef]
- Carvalho, P.; Marques, R.; Berg, S. A meta-regression analysis of benchmarking studies on water utilities market structure. Util. Policy 2012, 21, 40–49. [Google Scholar] [CrossRef]
- Pinto, F.S.; Simões, P.; Marques, R. Water services performance: Do operational environment and quality factors count? Urban Water J. 2017, 14, 78–781. [Google Scholar] [CrossRef]
- André, F.J.; Herrero, I.; Riesgo, L. A modified DEA model to estimate the importance of objectives with an application to agricultural A modified DEA model to estimate the importance of objectives with an application to agricultural economics. Omega 2010, 38, 371–382. [Google Scholar] [CrossRef]
- He, W.; Wang, Y. Measurement of urban water use efficiency in the Yellow River basin and analysis of influencing factors. J. Environ. Sci. 2021, 41, 4760–4770. [Google Scholar]
- Yao, T.; Liu, S. Comparison of change characteristics of multiple efficiency indicators of water resources use in Beijing, Tianjin and Hebei. Adv. Geogr. Sci. 2021, 40, 1195–1207. [Google Scholar]
- Pittman, R.W. Multilateral Productivity Comparisons with Undesirable Outputs. Econ. J. 1983, 93, 883–891. [Google Scholar] [CrossRef]
- Yang, J.; He, G.; Zhou, Q.; Bao, K. Study on the spatial spillover effect of water resources utilization efficiency in Huaihe eco-economic zone. Hydroelectricity 2020, 46, 29–33. [Google Scholar]
- Li, Y.; Ren, W.; Yao, X. Spatial and temporal variation of green water resources efficiency in cities of the Yellow River basin and its influencing factors—Based on the perspective of river ecohydrological zoning. Ind. Technol. Econ. 2021, 40, 15–22. [Google Scholar]
- Färe, R.; Groskopf, S. Productivity and intermediate products: A frontier approach. Comput. Econ. 1996, 50, 65–70. [Google Scholar] [CrossRef]
- Tone, K.; Tsutsui, M. Network DEA: A slacks-based measure approach. Eur. J. Oper. Res. 2009, 1, 243–252. [Google Scholar] [CrossRef]
- Li, Y.; Chen, Y.; Liang, L.; Xie, J. DEA models for extended two-stage networkstructures. Omega Int. J. Manag. Sci. 2012, 5, 611–618. [Google Scholar] [CrossRef]
- Bian, Y.; Yan, S.; Xu, H. Efficiency Evaluation for Regionalban Water Use and Waste water Decontamination Systems in China: A DEA Approach. Resour. Conserv. Recycl. 2014, 83, 15–23. [Google Scholar] [CrossRef]
- Morán-Valencia, M.; Flegl, M.; Güemes-Castorena, D. A state-level analysis of the water system management efficiency in Mexico: Two-stage DEA approach. Water Resour. Ind. 2023, 29, 100–200. [Google Scholar] [CrossRef]
- Zhao, L.; Sun, C.; Liu, F. Interprovincial two stage water resource utilization effificiency under environmental constraint and spatial spillover effects in China. J. Clean. Prod. 2017, 164, 715–725. [Google Scholar] [CrossRef]
- Deng, G.; Zhang, Z. Research on industrial water use efficiency of Chinese provinces based on network SBM-DEA model and GML index. J. Nat. Resour. 2019, 34, 1457–1470. [Google Scholar]
- Zhang, G.; Wu, H.; Liu, Y.; Zhou, Z. Measurement of comprehensive water resources utilization efficiency in China and its spatial interaction analysis. Quant. Econ. Tech. Econ. Res. 2020, 37, 123–139. [Google Scholar]
- Ren, J.; Li, H.; Wu, X.; Li, X. Analysis of water use efficiency of provincial capitals in Yangtze River economic belt. China Popul. Resour. Environ. 2016, 26, 101–107. [Google Scholar]
- Wang, K.; Liu, Y.; Shi, L.; Liu, L.; Meng, X.; Yang, B. Spatial and temporal divergence and influencing factors of industrial green water resources efficiency in Yangtze River Economic Zone—A two-stage analysis based on EBM-Tobit model. Resour. Sci. 2017, 39, 1522–1534. [Google Scholar]
- Yang, G.; Xie, Q. Study on the spatial and temporal variation of green water resources efficiency in Yangtze River economic zone—Based on SE-SBM and ML index method. Yangtze River Basin Resour. Environ. 2019, 28, 349–358. [Google Scholar]
- Fang, C.; Zhou, C.; Wang, Z. Strategic issues of sustainable development of urban agglomerations in the Yangtze River Economic Belt and the focus of graded gradient development. Adv. Geogr. Sci. 2015, 34, 1398–1408. [Google Scholar]
- Li, Y. Research on Regional Industrial Environmental Efficiency Evaluation and Driving Factors in China Based on Two-Stage Network DEA. Master’s Thesis, China University of Petroleum, Dongying, China, 2019. [Google Scholar] [CrossRef]
- Guo, J.; Wu, X.; Chen, Y. Construction and empirical evidence of a two-stage DEA model for haze emission efficiency assessment. China Soft Sci. 2020, 10, 184–192. [Google Scholar]
- Cook, W.D.; Liang, L.; Zhu, J. Measuring performance of two-stage network structures by DEA: A review and future perspective. Omega 2010, 38, 423–430. [Google Scholar] [CrossRef]
- Färe, R.; Grosskopf, S. Network DEA. Socio Econ. Plan. Sci. 2020, 34, 35–49. [Google Scholar] [CrossRef]
- Färe, R.; Grosskopf, S. Intertemporal Production Frontiers: With Dynamic DEA; Kluwer: Norwell, MA, USA, 1996. [Google Scholar]
- Chuanming, L.; Huitong, W.; Xiaomin, W. Research on regional difference decomposition and convergence of Internet financial development in China’s eight urban agglomerations. Quant. Econ. Tech. Econ. Res. 2017, 34, 3–20. [Google Scholar]
- Shuai, L. Regional differences and stochastic convergence of China’s economic growth quality. Res. Quant. Econ. Tech. Econ. 2019, 36, 24–41. [Google Scholar]
- Zhang, M.; Weng, A. Spatial correlation network and formation mechanism of urban water use efficiency in Yangtze River Economic Zone. J. Geogr. 2022, 77, 2353–2373. [Google Scholar]
- Zhu, B. Study on the measurement and influencing factors of water use efficiency in Yangtze River Economic Belt under environmental constraints. J. Hebei Univ. Geosci. 2018, 41, 51–57. [Google Scholar]
- Zhang, X.; Sun, F.; Wang, H. Study on green efficiency of industrial water resources in Yangtze River Economic Zone based on two-stage evaluation of “production-governance”. J. Jiangxi Univ. Financ. Econ. 2020, 2, 26–36. [Google Scholar]
- Qian, L.; Xu, S.; Qin, F. Spatial analysis of basin economy and western development strategy. Adv. Geogr. Sci. 2000, 19, 266–272. [Google Scholar]
- Zhang, K.; Guo, W. A study of watershed economy based on spatial characteristics, processes and mechanisms. Econ. Issues 2013, 10, 103–108. [Google Scholar]
- Chen, S.; Lv, W.; Wang, J. Analysis of the spatial and temporal evolution of water resource use efficiency in the Yangtze River basin. Water Resour. Conserv. 2022, 38, 80–86, 94. [Google Scholar]
- Deng, Q.; Zhang, L. Spatial and temporal evolution characteristics of water resources green efficiency in Yangtze River Economic Zone and its influencing factors. Resour. Sci. 2022, 44, 247–260. [Google Scholar]
- Chen, J.; He, W.; Chen, D. A study on performance assessment of urban wastewater management in the Yangtze River basin. Environ. Sci. Manag. 2019, 44, 1–5. [Google Scholar]
Disclaimer/Publisher’s Note: The statements, opinions and data contained in all publications are solely those of the individual author(s) and contributor(s) and not of MDPI and/or the editor(s). MDPI and/or the editor(s) disclaim responsibility for any injury to people or property resulting from any ideas, methods, instructions or products referred to in the content. |
© 2023 by the authors. Licensee MDPI, Basel, Switzerland. This article is an open access article distributed under the terms and conditions of the Creative Commons Attribution (CC BY) license (https://creativecommons.org/licenses/by/4.0/).