Article

Research on the Coupling Evaluation and Driving Factors of Water–Energy–Carbon in the Yellow River Basin

1
School of Management, Zhengzhou University, Zhengzhou 450001, China
2
Yellow River Institute for Ecological Protection & Regional Coordinated Development, Zhengzhou University, Zhengzhou 450001, China
3
Institute of Subsurface Energy Systems, Clausthal University of Technology, 38678 Clausthal-Zellerfeld, Germany
*
Authors to whom correspondence should be addressed.
Water 2023, 15(13), 2377; https://doi.org/10.3390/w15132377
Submission received: 23 May 2023 / Revised: 18 June 2023 / Accepted: 26 June 2023 / Published: 27 June 2023
(This article belongs to the Topic Carbon-Energy-Water Nexus in Global Energy Transition)

Abstract

:
Taking 57 prefecture-level cities in the Yellow River basin as a research area, this study evaluates the coupling coordination level of the water–energy–carbon (WEC) system in the Yellow River basin from 2012 to 2021 and explores the driving factors of coupling coordinated development. The study revealed that: (1) the development level of the three subsystems all showed an upward trend. The development level of the carbon system exhibited the highest level. The development index of the carbon and energy systems rose steadily, whereas the development index of the water system fluctuated considerably during the research period, although the magnitude of the fluctuation gradually slowed down. (2) The coupling coordination degree displayed a distribution characteristic of “high in the east and low in the west, high in the south and low in the north”. While the coupling coordination degree improved year by year, the spatial heterogeneity gradually increased. (3) The coupling coordination degree presented a positive correlation, and the agglomeration level was dominated by “high-high” and “low-low” agglomeration types. The “high-high” agglomeration area had a certain degree of spatial mobility, while the “low-low” agglomeration areas showed a tendency for spreading towards the middle reaches of the Yellow River basin. (4) Technological innovation, and the economic basis, had a significant positive impact on the coupling coordinated development, while the industrial structure bias showed a clear inhibitory effect. The positive role of opening up is not yet significant. Meanwhile, the indirect effect of each driving factor was greater than the direct effect.

1. Introduction

As the world’s largest energy consumer, China’s total primary energy consumption in 2021 accounted for 26.5% of the global total, amounting to 157.65 EJ [1]. Moreover, China’s per capita water-resource availability is only a quarter of the world average, and a severe water scarcity issue has hindered societal development. Simultaneously, China is currently the world’s leading CO2 emitter. In September 2020, at the 75th United Nations General Assembly, China officially committed to the goal of carbon emissions peaking by 2030, and to achieving carbon neutrality by 2060. The Chinese government has explicitly integrated this goal into the overall layout of ecological civilization construction. Therefore, water conservation, high energy efficiency, and low carbon emissions have become major challenges for China’s sustainable development. Exploring the regional coupling coordination of the water–energy–carbon (WEC) system and identifying its driving factors are of paramount importance for China to achieve the “carbon peaking and carbon neutrality” goal and sustainable development.
Coupling is a concept in systems science that describes the intrinsic connections and interactions among components within a complex system [2]. The WEC system encompasses the fundamental resources that sustain human life, the forces that drive development, and the environmental impacts, all of which form an interdependent and mutually restrictive coupled system (Figure 1). The study of the coupling relationship and the influencing factors of these three elements is one of the core research topics in the field of resource and environmental sciences.
First, water and energy systems, along with the ecosystems they support, provide the basic conditions and resources for human societal activities. The rationality of water resources and energy utilization influences the scale and level of urban development to some extent [3,4]. Water and energy are interdependent. On the one hand, the process of water-resource development and utilization involves multiple stages, including water extraction, transportation, usage, wastewater treatment, and reuse, all of which consume a significant amount of energy. Chini and Stillwell [5] conducted the first assessment of the state of the energy–water nexus in American cities and found that nonrevenue water, and its embedded energy, account for 3600 GWh of electricity loss annually. By analyzing the energy demand and cost of different water-treatment methods, Grzegorzek et al. [6] found that the use of renewable energy for water treatment can effectively reduce costs and reduce greenhouse-gas emissions. On the other hand, water is an indispensable element in energy extraction and electricity production. Water scarcity is bound to pose a significant hindrance to green development [7]. The coordinated promotion of water–energy development is an important measure to promote China’s green development and is of great significance to the sustainable development of humankind [8].
Second, the carbon system reflects the extent of the environmental impact caused by human societal activities. From a water–carbon perspective, on the one hand, the process of water-resource development and utilization consumes energy and, thus, increases carbon emissions [9]. On the other hand, strict adherence to the concept of water conservation and emission reduction, improving the reuse rate of water resources, especially the resource utilization of wastewater, will be an essential measure to achieve the “carbon peaking and carbon neutrality” goals.
Lastly, from the perspective of energy–carbon, the extraction, conversion, transportation, and consumption of energy are the primary causes of carbon emissions. Reducing the use of fossil fuels, and vigorously developing new energy power generation, energy storage technology, hydrogen energy technology, and other supportive technologies for the green and low-carbon transition of energy, will contribute to carbon reduction [10]. Adebayo et al. [11] found that the use of renewable energy can effectively reduce carbon emissions and slow down environmental deterioration. Similar to the above conclusion, Ehigiamusoe et al. [12] found that the interaction between renewable energy and real income still has a positive effect on reducing carbon emissions.
In summary, the WEC system not only reflects the level of reasonable allocation of resources by humans and the efficiency of exploitation and utilization but also mirrors the extent of human society’s impact on the ecological environment. While existing research on the WEC nexus has laid a solid foundation, there are still gaps in the literature. First, most of the current research on the WEC has focused on a single element or two of the three elements [13,14]. Although some scholars have explored WEC from the perspectives of concept and mechanism [15,16] and based on specific industrial cases [17], there are still few empirical studies that integrate the three into the same framework. Second, although some have carried out studies on national [18] and urban scales [19] from the perspective of WEC, few have explored them based on key river basins, neglecting the correlation and significance of the WEC nexus within the geographic units of river basins.
In this study, 57 cities in the Yellow River basin were selected as research areas, and the research scale was focused on the prefecture-level cities level of important river basins in China. The reasons for choosing the Yellow River basin as the research object among many river basins in China were as follows: (1) The Yellow River basin is a crucial ecological security barrier in China, sustaining 12% of the country’s population, 17% of arable land, and supplying water to over 50 large and medium-sized cities. The water-resource exploitation rate has reached 80%, far exceeding the ecological alert line of the general basin, at 40%, making water shortage the most significant conflict. (2) The Yellow River basin is an essential industrial belt for energy development in China, with key industries including steel, petrochemicals, and nonferrous metals. In recent years, the environmental externalities resulting from energy consumption in the Yellow River basin have become increasingly pronounced and the past development model, reliant on heavy energy use, urgently needs change [20,21]. Sun et al. [22,23,24] conducted an indepth analysis of the WEC emissions in the Yellow River basin. They found that carbon emissions in this area primarily originate from coal consumption, while water scarcity has significantly impacted energy production and carbon emissions. Under the dual guidance of major national strategies for ecological protection and high-quality development in the Yellow River basin and the targets of ‘carbon peak and carbon neutrality’, promoting water-resource protection in the Yellow River basin and advancing a green and low-carbon energy transition is imperative. (3) Some scholars have explored the coupled and coordinated development of the Yellow River basin; for example, Ren et al. [25] constructed a water–energy–food–carbon system optimization model, providing a significant reference for improving irrigation water productivity and reducing carbon emissions. Yin et al. [26] explored the coupling coordination degree of water, energy, and food in the Yellow River basin and performed an analysis of influencing factors through a coupling coordination model. However, there is still a lack of research on the coupling and coordination of the development of water, energy, and carbon in the Yellow River basin.
Therefore, based on the practical basis of a shortage of water resources, the energy dependence of industrial structures, and the fragile ecological environment in the Yellow River basin, this study uses the coupling coordination degree model, kernel density estimation, the spatial autocorrelation model, and the spatial metrology model to investigate the coupling coordination level of the WEC system in the Yellow River basin and its spatiotemporal evolution characteristics, and to investigate the driving factors of the coupled and coordinated development of the WEC system in the Yellow River basin, which is of great significance to promote carbon reduction and the high-quality development of the region.
The innovations of this study are as follows: (1) integrating water, energy, and carbon into the same research framework, exploring their coupling coordination relationship from both theoretical and empirical perspectives, and providing a new perspective for research on water, energy, and carbon emissions; (2) taking 57 cities in the Yellow River basin as the study area, this study evaluated the level of WEC coupling coordinated development in the Yellow River basin, and refined the study scope to a certain extent, considering the correlation of WEC development in key watershed units; (3) for exploring the driving factors of the coupling coordinated development of the WEC system in the Yellow River basin, the research conclusions of this study are of more practical significance, providing an empirical reference for the high-quality development of the Yellow River basin and providing experience references for other regions to explore the coupling-coordinated development of the WEC system.

2. Methodology

2.1. Research Area

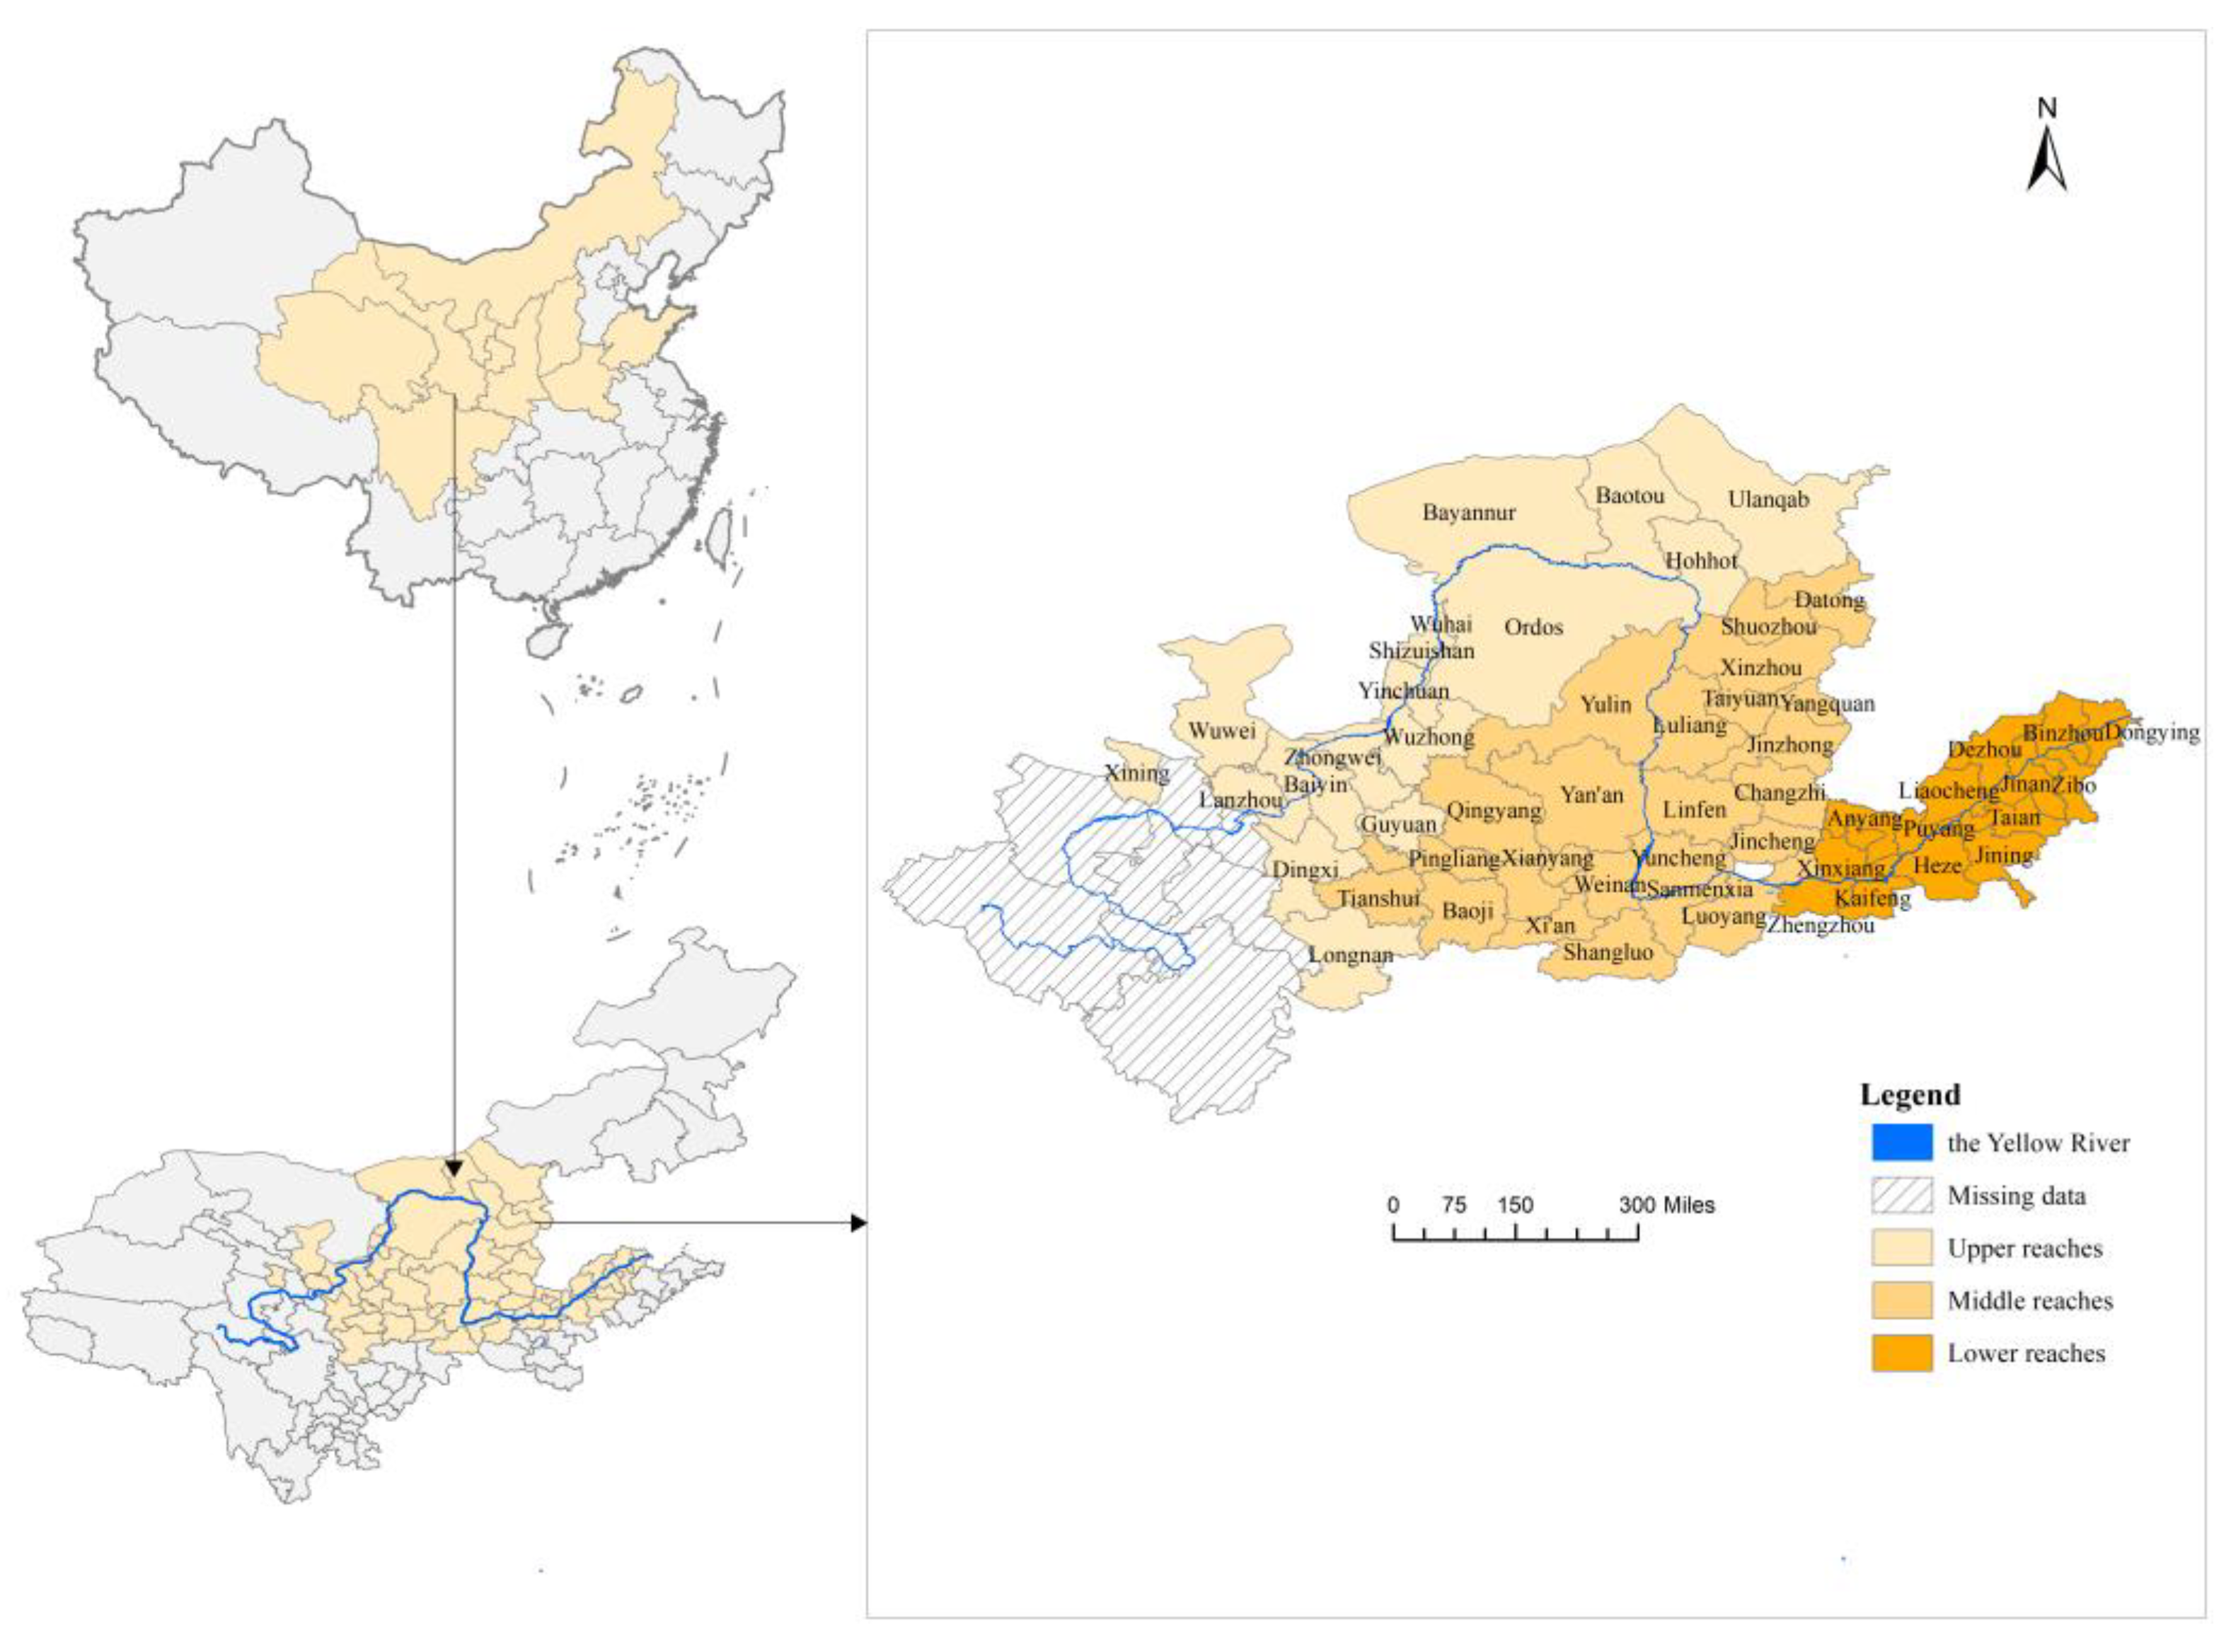
The focus of this investigation was founded on a triad of principles: treating the natural Yellow River basin as the fundamental underpinning, preserving the cohesiveness of local administrative divisions to the greatest extent feasible, and recognizing the direct correlation between regional economic advancement and the Yellow River. The investigation incorporates a holistic view of the socioeconomic conditions of the Yellow River basin and consequently chooses the 57 prefecture-level cities across eight provinces and autonomous regions—Qinghai, Gansu, Ningxia, Inner Mongolia, Henan, Shandong, Shaanxi, and Shanxi—that the Yellow River’s main current and significant tributaries traverse. These cities form the investigation’s geographical scope. Moreover, the Yellow River basin is partitioned into upper, middle, and lower segments, as delineated in Figure 2.

2.2. Construction of the Indicator System and Selection of Driving Factors

2.2.1. Construction of the Indicator System

To accurately evaluate the coupling and coordinating level of the WEC system in the Yellow River basin, this paper closely adhered to the coupling mechanism of the three factors and constructed a quantitative assessment indicator system for the coupling coordination of the WEC system in the Yellow River basin. The selection of indicators followed the policy basis, theoretical basis, and practical basis. The policy basis refers to the interpretation of relevant amounts of water resources, energy, and carbon reduction in the Yellow River basin in governmental, publicly released policy documents; the theoretical basis refers to the more mature WEC indicator system in the Yellow River basin and the coupling and coordinating development indicator system in existing academic research; and the practical basis refers to the scientific nature, obtainability, and operability of the data involved in the related indicators. Following the above indicator selection basis, the water system layer selects indicators representing the level of water-resource development and utilization in the Yellow River basin from two aspects: water-resource supply and water-resource utilization, according to the related research of Qi et al. [27]. The energy system layer mainly refers to the related research of Wang et al. [28], selecting indicators from two aspects, energy production and energy consumption, to measure the energy production and utilization situation in the Yellow River basin. The carbon-system layer selects indicators reflecting the level of carbon reduction in the Yellow River basin from two aspects, carbon emission and carbon reduction, based on previous studies [29,30]. Finally, a quantitative evaluation indicator system for the coupling coordination of the WEC system in the Yellow River basin was constructed, including 3 systems, 6 elements, and 16 indicators. The data sources and calculation methods of each indicator are shown in Table 1.

2.2.2. Selection of Driving Factors

The harmonious development of the WEC system in the Yellow River basin is driven by a multitude of factors. Guided by existing research [31,32,33,34] and theoretical analyses of the three-system coupling and coordinated development, this study selected pertinent variables from four aspects: economic basis, industrial structure, technological innovation, and openness to the outside world (see Table 2).
(1)
Economic basis (EB): acting as an internal catalyst, the economic base propels the integrative and harmonious progression of the WEC system within the Yellow River basin. The GDP per capita serves as the evaluative metric, principally examining the comprehensive economic growth across diverse municipalities in the region.
(2)
Industrial structure (IS): the organization of industries profoundly impacts regional economic growth, energy usage, and carbon output. An imbalance in the industrial structure can hamper productivity and the efficiency of resource use. Hence, the ratio of the total value generated by secondary industries to the GDP is employed as an indicative measure of the state of industrial organization within the Yellow River basin.
(3)
Technological innovation (TI): technological innovation can aid the Yellow River basin in overcoming “bottleneck” technologies in water-resource development and utilization, energy production and consumption, and carbon-emission reduction. It promotes sustainable green development across the basin. The number of invention patents granted per 10,000 people was selected as an indicator.
(4)
Openness to the outside world (OP): by facilitating the influx of talent and technology, openness to the outside world can elevate the caliber of human resources and technological competencies across the basin, fostering superior growth in the Yellow River basin. The level of reliance on international trade serves as an indicative measure in this context.

2.3. Research Methods

2.3.1. Entropy Weight Coefficient of Variation Method

To address the significant arbitrariness of subjective weighting methods, which cannot precisely gauge the importance of indicators, and to prevent issues such as result discrepancies induced by a single objective weighting method, this study employs an integrated approach. Based on the entropy weight coefficient of the variation method, as recommended by relevant studies [35,36,37], a combined weighting of indicators is conducted. This approach subsequently measures the development level of WEC systems in the Yellow River basin. The specific steps of the methodology are outlined below:
Standardization:
Positive indicators:
Y i j = X i j min ( X i j ) max ( X i j ) min ( X i j )
Negative indicators:
Y i j = max ( X i j ) X i j max ( X i j ) min ( X i j )
In these equations, X i j represents the value of the jth indicator for the ith city, Y i j is the standardized result of the indicator, max ( X i j ) is the maximum value of the indicator X i j , and min ( X i j ) is the minimum value of the indicator X i j .
① Entropy Weight Method
Calculation of the information entropy E j of the jth indicator:
E j = 1 ln n i = 1 n p i j ln p i j p i j = Y i j / i = 1 n Y i j
Calculation of the weight W 1 j of the jth indicator:
W 1 j = 1 E j j = 1 k ( 1 E j ) W 1 j [ 0 , 1 ] ; j = 1 k W 1 j = 1
② Coefficient of Variation Method
Calculation of the coefficient of variation cj of each indicator
c j = σ j x ¯ j
In Equation (5), σ j is the standard deviation of the jth indicator; x ¯ j is the average value of the jth indicator.
Calculation of the weight W 2 j of the jth indicator:
W 2 j = c j j = 1 n c j
③ Calculation of the combinatorial weight W j of each indicator
W j = λ W 1 j + ( 1 λ ) W 2 j
In this equation, λ is the preference coefficient, and λ ( 0 , 1 ) , the entropy weight method is as important as the coefficient of variation method in this study, so λ = 1 / 2 is taken.
④ Calculation of the score of each system as the development index of each system, WI, EI, and CI; a higher development index indicates a better level of development of the system:
W I o r E I o r C I = j = 1 k W j Y i j
In Equations (3)–(8), n and k, respectively, represent the number of cities and the number of indicators; WI is the development index of the water system, EI is the development index of the energy system, and CI is the development index of the carbon system.

2.3.2. Coupling Coordination Degree Model

Coupling coordination is a good interactive mechanism formed by mutual dependence, cooperation, and coordination among various elements. To explore the level of coupling coordination of the WEC system in the Yellow River basin, we referred to the research of Zhao et al. [38] and constructed a coupling coordination degree model:
C = W I E I C I W I + E I + C I 3 3 3
T = α W I + β E I + γ C I
W E C D = C × T
In this formula, C represents the degree of coupling, reflecting the degree of interaction among the three subsystems; T is the coordination index; and α , β , and γ are the undetermined weight coefficients, satisfying α + β + γ = 1 . Considering that the three systems are equally important in this study, α = β = γ = 1 / 3 ; WECD represents the coupling coordination degree of the WEC system in the Yellow River basin, reflecting the coordination level of the three subsystems. Referencing related studies [39], the interval and level of coupling coordination degree are divided, as shown in Table 3:

2.3.3. Kernel Density Estimation

Kernel density estimation is a nonparametric estimation method that can reflect the distribution and dynamic-evolution trend of random variables with a dynamic, intuitive, and continuous density curve. This study uses the Gaussian kernel function with higher precision to estimate the dynamic distribution characteristics of the coupling coordination level of the WEC system in the Yellow River basin. The formula is as follows:
f ( x ) = 1 N h i = 1 N K ( x x i h )
K ( x x i h ) = 1 2 π e ( x x i ) 2 2 h 2
In this equation, f ( x ) is the kernel density function; N is the number of observed values; h is the bandwidth and this paper adopts the optimal bandwidth expression h = 1.06   S N 1 / 5 (S is the sample standard deviation) proposed by Silverman [40]; and K is the kernel function.

2.3.4. Spatial Autocorrelation Model

Moran’s I is an important indicator measuring the spatial correlation of related variables [41,42]. This study explores the spatial correlation and spatial agglomeration characteristics of WECD in the Yellow River basin by calculating the global Moran’s I and local Moran’s I.
① Global Moran’s I:
I = i = 1 n j = 1 n W i j ( χ i χ ¯ ) ( χ j χ ¯ ) S 2 i = 1 n j = 1 n W i j
In the equation, n is the number of cities, S 2 represents the sample variance, W i j is the spatial weight, χ i and χ j represent the carbon emissions of city i and city j, and χ ¯ is the average. I [ 1 , 1 ] , and if I > 0 it indicates positive autocorrelation, i.e., the WECD in the Yellow River basin exhibits a pattern of high values adjacent to high values and low values adjacent to low values. If I < 0, it indicates negative autocorrelation, i.e., the pattern shows high values adjacent to low values. If I is close to 0, it means that the coupling coordination degree is randomly distributed in space.
② Local Moran’s I: Although the global Moran’s I can indicate whether there is spatial autocorrelation in the coupling coordination degree of the WEC system in the Yellow River basin, it cannot reveal the spatial agglomeration mode of the coupling coordination degree in each city. Therefore, further analysis is conducted using the local Moran’s I. The formula is as follows:
I i = ( χ i χ ¯ ) S 2 j = 1 n W i j ( χ j χ ¯ )
In the equation, the meanings of S 2 ,   W i j ,   χ i ,   χ j , and χ ¯ are the same as in Formula (11). If Ii > 0, it suggests that the coupling coordination degree of the three systems in the local area is similar, and the agglomeration pattern appears as “high-high” agglomeration or “low-low” agglomeration. If Ii < 0, it suggests that the coupling coordination degree of the three systems in the local area is dissimilar, and the agglomeration pattern appears as “low-high” agglomeration or “high-low” agglomeration. If Ii = 0, it suggests that the coupling coordination degree in the local area is randomly distributed.

2.3.5. Spatial Econometric Model

When examining the key determinants of the WEC system’s coupling coordination within the Yellow River basin, the significance of spatial correlation should not be overlooked. As a result, a spatial econometric model was employed as an evaluative tool to scrutinize the spatial influences of these driving factors. The spatial Durbin model (SDM), which integrates both the spatial autoregressive model (SAR) and the spatial error model (SEM), is applied in this context. The SDM is capable of assessing the effects of local explanatory factors on dependent variables and the impact of explanatory variables from adjacent areas [43]. Hence, a spatial Durbin regression model is formulated for evaluating the driving forces behind the coupling coordination relationship of the WEC system within the Yellow River basin:
D i t = c 0 + δ j = 1 n w i j D j t + β 1 X i t + α 1 j = 1 n w i j X j t + μ t + λ i + ε i t
In the equation, c 0 is the constant term; δ is the spatial spillover coefficient; i and j represent cities; X i t represents the local driving factors; X j t represents the driving factors of neighboring cities; w i j represents the spatial weight matrix; β 1 ,   α 1 represent the linear correlation coefficient and spatial spillover coefficient of the relevant variables to WECD; μ t represents the time-fixed effects; λ i represents the individual fixed effects; and ε i t represents the random disturbance term.

3. Results

3.1. Coupling Coordination Analysis

3.1.1. Analysis of the Development Index of Each System

As shown in Figure 3, during the period from 2012 to 2021 the development levels of the three subsystems in the Yellow River basin and their overall development level all showed an upward trend. The composite development index of the three subsystems increased from 0.24 in 2012 to 0.32 in 2021, showing a steady growth trend. Among them, the increase in the composite index from 2012 to 2016 was 12.03%, which was lower than the 22.15% from 2016 to 2021. This can be attributed to the adoption of the 2030 Agenda for Sustainable Development during the 70th session of the United Nations General Assembly, in 2015. As the largest developing country, China actively responded to the international call and made tremendous efforts in development concepts, institutional construction, and practical exploration, which to some extent promoted the continuous increase in the growth rate of the WEC composite index in the Yellow River basin.
Looking at each system, the water-system index fluctuated greatly from 2012 to 2016, and the water-system development index reached 0.16 in 2014 was the lowest in ten years. The reason may be that the water supply in the Yellow River basin decreased significantly in 2014–2015 due to the impact of drought and low-water years. Therefore, the calculated water-system development index was reduced. The water-system development index steadily increased from 2016 to 2019; the water-system development index rapidly increased from 2019 to 2021. This was due to the elevation of the “ecological protection and high-quality development of the Yellow River basin” to a major national strategy in 2019, the increasing efforts to protect water resources in the Yellow River basin, and more reasonable development and utilization of water resources.
The development index of the energy subsystem in the Yellow River basin increased year by year from 2012 to 2021. This is because the Yellow River basin, as an important industrial belt for energy development in China, has been continuously promoting industrial transformation and upgrading in recent years to solve the problem of dependence on energy and heavy industries, leading the energy transformation revolution with the goal of “carbon peak and carbon neutrality”, and promoting the high-quality green development of the Yellow River basin.
The carbon-system development index increased from 0.38 in 2012 to 0.47 in 2021. Although this increase was smaller compared to the other two systems, it still maintained the upward trend. This was closely related to China’s implementation of the new development concept in recent years. There was a marked elevation in the carbon-system development index for the Yellow River basin in 2021, particularly following China’s formal declaration of its objective to achieve peak carbon emissions by 2030 and carbon neutrality by 2060 during the 75th United Nations General Assembly in 2020.

3.1.2. Spatiotemporal Analysis of the Coupling Coordination Degree

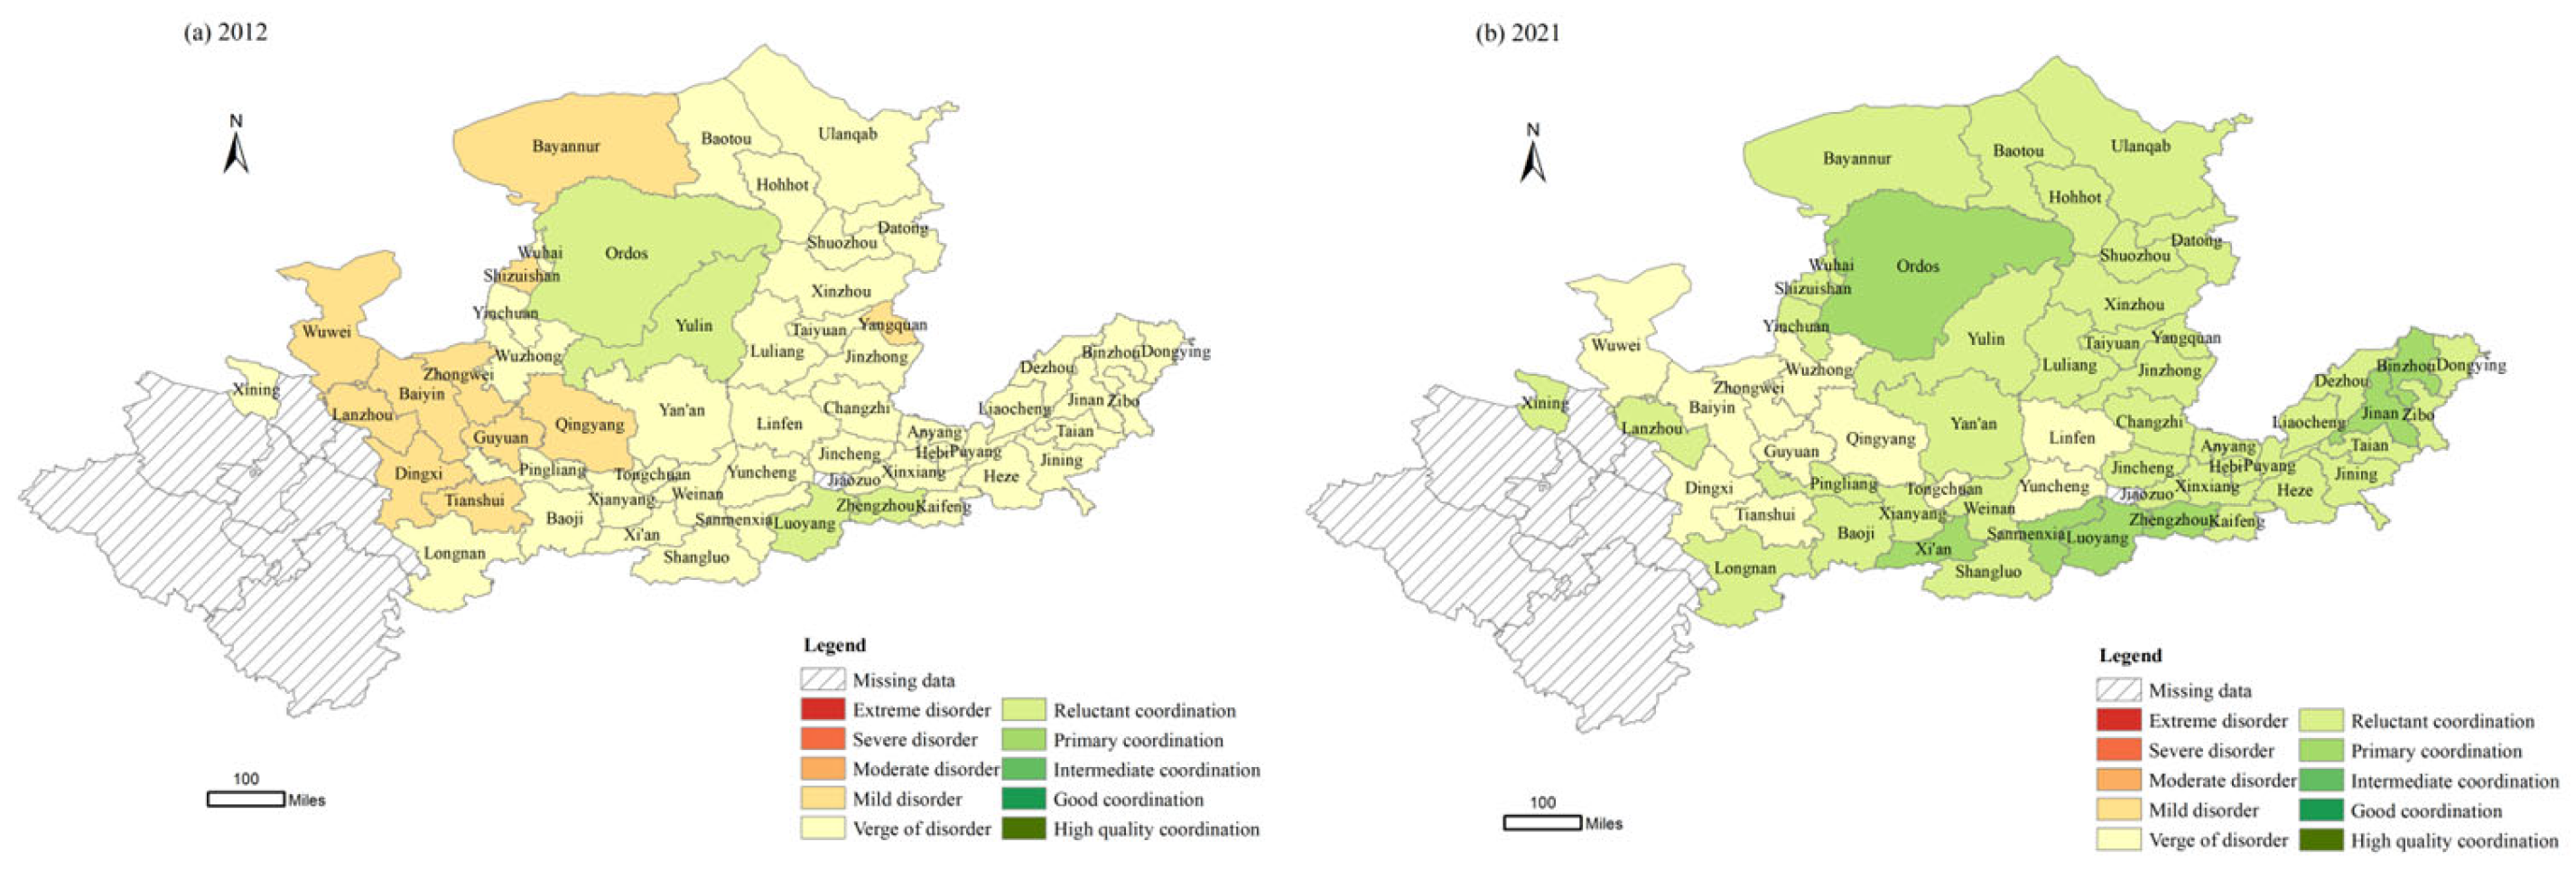
The degree of coupling coordination within the Yellow River basin’s WEC system was quantified utilizing the coupling coordination degree model. Furthermore, the spatial-distribution patterns of the WECD within the basin for the years 2012 and 2021 have been graphically represented using ArcGIS software, as depicted in Figure 4.
In general, the WECD in the Yellow River basin was markedly enhanced between 2012 and 2021. This suggests that the reciprocal dependency and interplay within the basin’s WEC systems have progressively intensified. The distribution pattern of the basin’s WECD presents a “high east, low west, high south, low north” trait, signifying the existence of notable regional disparities in the coupled and the synchronized development of the basin’s WEC systems.
From the perspective of local spatiotemporal evolution characteristics, in 2012 the coupling coordination degrees of Zhengzhou, Luoyang, Ordos, and Yulin were all greater than 0.50, taking the lead in entering the reluctant coordination level. More than 70% of the cities were on the verge of the disorder level and were concentrated in the downstream and midstream area of the Yellow River basin, indicating that the gap in the coupling coordination level of the WEC system in the midstream and downstream of the Yellow River basin was not significant in 2012. Meanwhile, cities at the mild disorder level were mainly distributed in the Gansu and Ningxia provinces.
In 2021, the coupling coordination level of the WEC system in the Yellow River basin significantly improved, the number of cities at each coordination level was approximately normally distributed, 53 cities in the region had achieved an upgrade across the coordination levels, and all cities reached the level of verge of disorder or above. Among the regions examined, Zhengzhou, Jinan, Xi’an, Luoyang, Ordos, Sanmenxia, and Binzhou had attained primary coordination status. This achievement was closely tied to their judicious exploitation and utilization of water resources, their endorsement of green and low-carbon industrial growth, and ongoing improvements to the ecological environment. Cities on the verge of disorder lay within Gansu Province and the Ningxia Hui Autonomous Region, suggesting that these two provinces need to modify their pertinent policies in a timely fashion to swiftly close the disparity in coupling coordination levels with other basin cities.
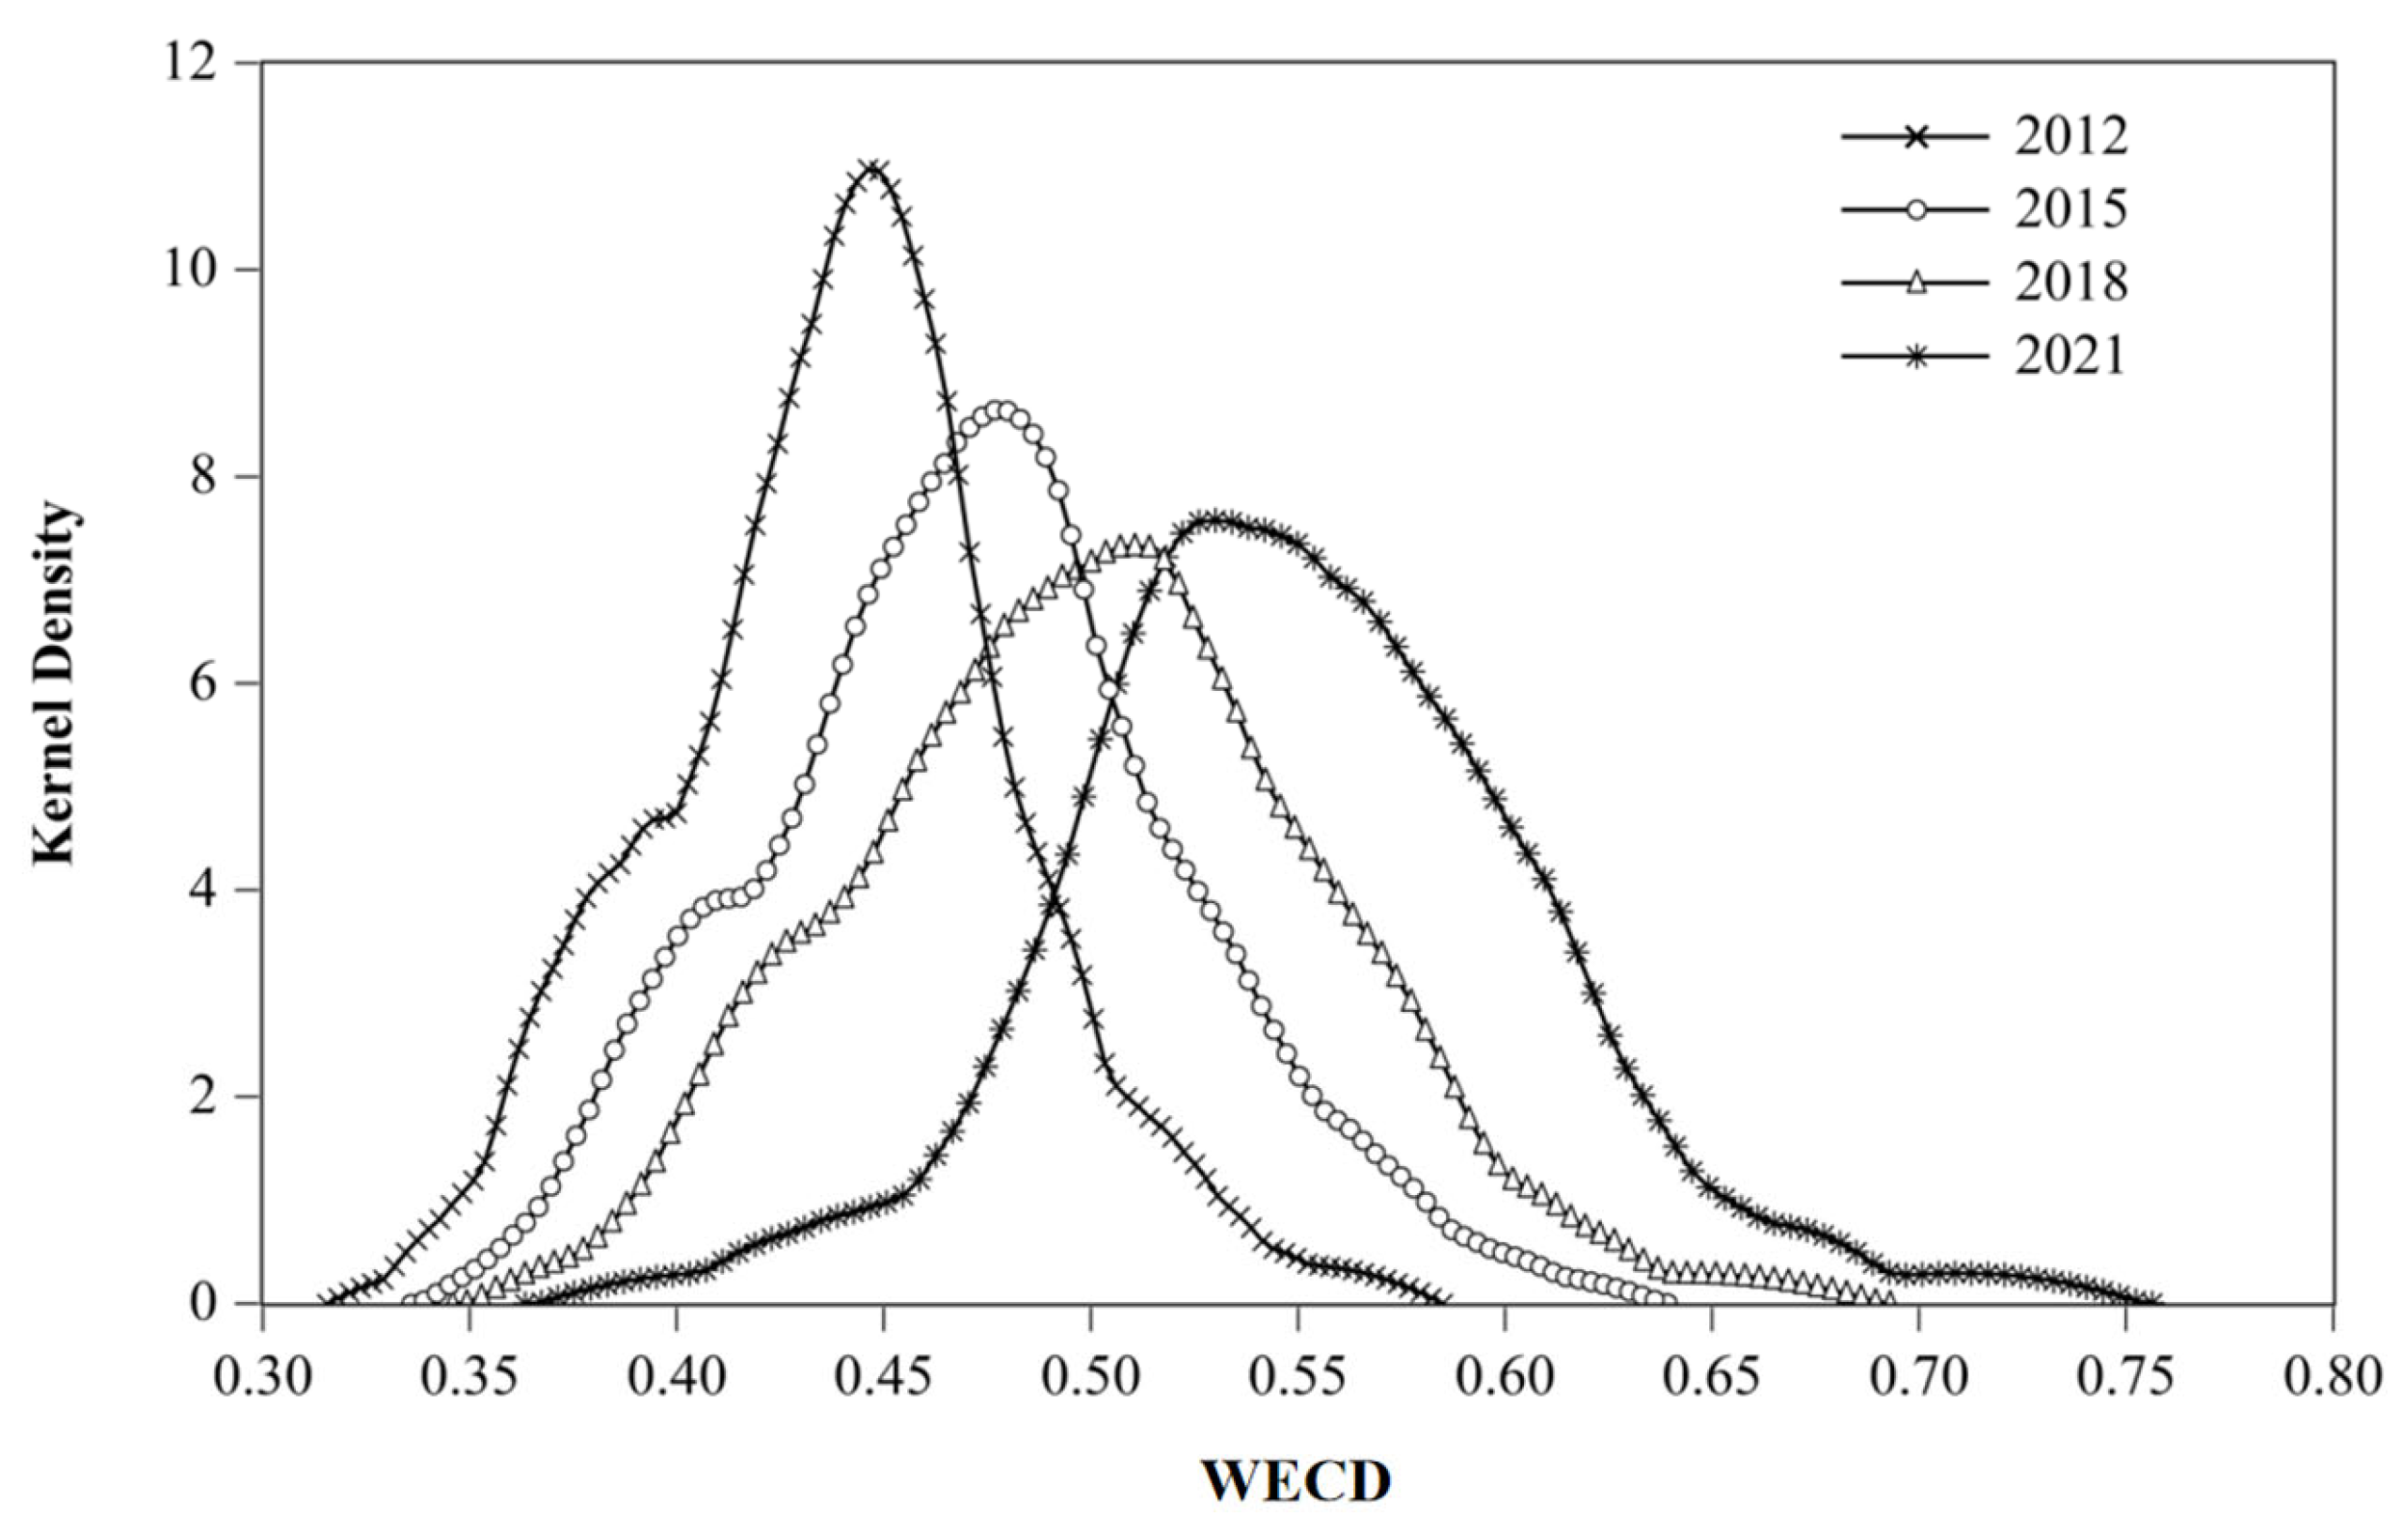
From the aforementioned analysis, it is evident that the overall status of the coupling coordination development within the Yellow River basin’s WEC system is improving, despite the disparity in coordination levels across different cities. This study, therefore, employs kernel density estimation to probe the overarching trend and evolution principles governing the coupling coordination level of the WEC system in the Yellow River basin, as depicted in Figure 5.
First, looking at the distribution location, the rightward shift of the kernel density curve implies a gradual enhancement in the coupling coordination level of the WEC system within the Yellow River basin. This indicates that the links between the WEC systems in the basin are growing stronger.
Second, in terms of the peak shape, the peak value of the kernel density curve exhibits a downward trend within the sample period, and the width of the peak broadens with obvious trailing characteristics. This suggests an increase in the overall dispersion degree of the coupling coordination level of the WEC system in the Yellow River basin, leading to a larger gap between the coupling coordination levels of different cities.
Lastly, concerning the number of peaks, the kernel density curve evolves from a mildly multipeaked to a single-peaked configuration, signifying that the development of the coupling coordination level of the WEC system in the Yellow River basin transitions from multitiered differentiation towards a monopolar flattening trend.
In summary, while the coupling coordination level of the WEC system in the Yellow River basin continually improves, the divergence in coupling coordination levels among the cities gradually expands, which supports the conclusions drawn from the previous spatial-distribution pattern analysis.

3.1.3. Spatial-Correlation Analysis

First, this study employed the global Moran’s index to evaluate the spatial impact of the coupling coordination level of the WEC system within the Yellow River basin. As shown in Table 4, the global Moran’s index of the WECD within the Yellow River basin dynamically fluctuated over time and exhibited a significantly positive value at the 1% level. This result signifies a positive correlation in the coupling coordination level of the WEC system within the Yellow River basin, implying that the coupling coordination level of the WEC system in each city is susceptible to influences from neighboring cities.
To further explore the relationship between the coupling coordination level of the WEC system in each city in the Yellow River basin and the surrounding cities, a LISA cluster map of WECD in the Yellow River basin in 2012 and 2021 was drawn based on the calculation results of the local Moran’s index. Four findings can be seen in Figure 6: (1) the clustering degree of WECD among the 57 cities in the Yellow River basin was mainly dominated by “high-high” and “low-low” clusters, with a high degree of spatial stability. This indicates that there is a certain degree of polarization in the coupling coordination level of the WEC system in the Yellow River basin. (2) The “high-high” cluster region had a certain degree of fluidity, mainly distributed in the provincial capital cities and their surrounding areas in the middle and lower reaches of the Yellow River. In 2012, the “high-high” cluster region included Jinan, Xi’an, Hohhot, and Baotou, while in 2021 it was mainly distributed in Jinan and its surrounding cities in Shandong Province, as well as Luoyang and Jiaozuo in Henan Province. (3) The “low-low” cluster area showed a trend of spreading to the middle reaches of the Yellow River basin. In 2012, it was mainly distributed in Gansu Province and the Ningxia Hui Autonomous Region. After 10 years of development, the gap in the coupling coordination level between Pingliang and its surrounding cities had narrowed, evolving from a “high-low” cluster to a “low-low” cluster, and Qingyang had evolved from an insignificant area to a “low-low” cluster area. (4) In 2012, the “low-high” cluster area only included Bayannur, and, in 2021, Shizuishan was added, and Baotou evolved from a “high-high” cluster to a “low-low” cluster, indicating that although the coupling coordination level was improved during the research period, there is still a certain gap between the WECD of these three cities and the surrounding cities.

3.2. Driving-Factor Analysis

3.2.1. Regression-Result Analysis

In order to explore the driving factors of the coupling coordination of the WEC system in the Yellow River basin, on the basis of verifying that the coupling coordination degree of the three systems has a strong positive spatial autocorrelation, the spatial econometric model was used to further analyze the influence of each driving factor on the coupling coordination degree. First, it should be confirmed that it is reasonable to select the spatial panel model for estimation. This study involved carrying out Hausman tests, LM tests, and LR tests, and the results were all significant, indicating that it was better to choose the spatial Durbin model for estimation than the spatial lag model or spatial error model. In order to avoid the influence of differences in time and prefecture-level cities on the estimation results, a general regression model with two-way fixed effects of time and space and the spatial Durbin model were selected for test analysis. Looking at the regression results from Table 5, the goodness of fit of the OLS model was only 0.3805, while the goodness of fit of the SDM model was greater than 0.8, so the SDM model could better reflect the real situation. Meanwhile, compared with the OLS model, the coefficients and sign of the influence of various driving factors in the spatial Durbin regression model changed, indicating that spatial factors cannot be ignored in determining the coupling coordination degree of the WEC system in the Yellow River basin. Considering the above two points, the SDM model was selected for the regression analysis. Further, by comparing the regression results of the spatial inverse distance weight matrix and the spatial proximity weight matrix, it can be seen that the results presented by the two matrices were similar, indicating that the spatial econometric model constructed in this paper was robust, and the results presented by the spatial inverse distance weight matrix were better, and because it can clearly reflect the situation of spatial effects declining with distance; this paper used the spatial inverse distance weight matrix for regression analysis.

3.2.2. Spatial Impact Effect Decomposition

Furthermore, the spatial impacts of each driving factor on the integrated and harmonious development of the WEC system within the Yellow River basin can be broken down into direct and indirect effects, as demonstrated in Table 6. Overall, economic foundation, industrial composition, and technological innovation exert a substantial influence on the coupling coordinated development of the WEC system in the Yellow River basin. The indirect effects overshadow the direct effects, suggesting that the spill-over influence from surrounding areas on the local region is of considerable importance and should not be overlooked.
In detail, firstly, for the coupling and coordinated development of the WEC system in the Yellow River basin, economic basis and technological innovation showed significant positive direct effects and indirect effects. The main reason is that the development and utilization of water resources, protection, the green transformation of energy, and the reduction in carbon emissions all require a large amount of financial input, and a sound economic foundation can provide a solid support for these inputs. Science and technology are seen as the primary productive forces, so technological innovation will continue to drive technological progress in the region, providing a strong impetus for the coupling and coordinated development of the WEC system in the Yellow River basin. In addition, if the surrounding areas have a good economic foundation and a high level of technological innovation, they will promote the spillover of talents and technologies, thus having a strong influence and driving effect on the coupling coordinated development of the WEC system in the Yellow River basin.
Secondly, a skewed industrial structure significantly hampered the integrated and coordinated development of the WEC system in the Yellow River basin. This is due to the fact that, as the value added of the secondary industry constitutes a larger share of the GDP, it escalates the risk of environmental contamination, reduces the energy utilization efficiency, and elevates carbon emissions. Concurrently, an irrational industrial structure in surrounding areas exerts a negative influence on the local region’s coupling and coordinated development of the WEC system.
Finally, the direct and indirect effects of opening to the outside world on the coupling and coordinated development of the WEC system in the Yellow River basin are not significant yet. This may be because the impact of opening up on the WEC system in the Yellow River basin has regional differences. It is necessary to consider the local resource endowment and development needs comprehensively. In the future, the Yellow River basin can actively explore and tap the potential of opening up for the impact on the coupling and coordinated development of the WEC system.

4. Conclusions and Recommendations

4.1. Conclusions

This study employed panel data from 57 cities within the Yellow River basin, spanning from 2012 to 2021. It computed the level of coupling and coordinated development of the Yellow River basin’s WEC system, investigated the spatial-distribution characteristics and dynamic-evolution principles of their coupling coordination, and selected pertinent indicators from four dimensions—economic basis, industrial structure, technological innovation, and opening up to the outside world—based on existing research. This was in order to further delve into the driving factors underpinning the coupling and coordinated development of the WEC system in the Yellow River basin. The following findings were deduced:
(1)
From the perspective of subsystems, the development level of the three subsystems within the WEC framework and the comprehensive development level showed an upward trend, with the carbon system performing the best and the development of the water and energy systems lagging in comparison. The development indices of the carbon and energy systems showed a slow upward trend, while the development index of the water system fluctuated greatly during the research period but the fluctuation gradually decreased;
(2)
In terms of the spatial distribution of coupling coordination, the coupling coordination of the WEC system in the Yellow River basin from 2012 to 2021 showed a “high in the east and low in the west, high in the south and low in the north” distribution characteristic, with the coupling coordination significantly improving and spatial heterogeneity gradually increasing;
(3)
From the perspective of spatial-correlation analysis, the coupling coordination of the WEC system in the Yellow River basin had a positive correlation and spatial agglomeration, with the degree of agglomeration mainly dominated by “high-high” agglomeration and “low-low” agglomeration. The “high-high” agglomeration area had a certain spatial mobility, and the “low-low” agglomeration area showed a trend of spreading to the central part of the Yellow River basin;
(4)
From the perspective of driving-factor analysis, economic basis and technological innovation had a significant positive impact on the coupling and coordinated development of the WEC system in the Yellow River basin, while industrial structural bias had an inhibitory effect on their coupling and coordinated development. The positive effect of opening up to the outside world was not significant. Meanwhile, the indirect effect of each driving factor on the coupling coordination development of the three subsystems was greater than the direct effect.

4.2. Recommendations

(1)
Improve the development level of the water and energy systems and narrow the gap between them and the carbon system. First, it is necessary to steadily advance soil and water conservation in key management areas and areas sensitive to soil and water loss, increase the water-storage capacity of the Yellow River basin from the source, and protect water resources. Second, we should promote the green and low-carbon transformation of the energy industry, continuously promote the adjustment and optimization of the energy structure through the use of renewable energy such as wind energy and light energy to reduce the carbon emissions caused by the use of primary energy in the water-treatment process and improve the development level of the water and energy systems while promoting the coordinated development of water and energy.
(2)
Accelerate the coordinated development of the Yellow River basin and create characteristic development paths for each city according to local conditions. For example, cities in Shandong Province, represented by Jinan, with a higher level of coupling coordination, should make full use of the geographical advantages of the estuary provinces and the development advantages of a high level of scientific and technological innovation to tap the huge potential of ocean energy to promote the coordinated development of local water–energy–carbon coupling and build a pioneer area for green, low-carbon, and high-quality development. Cities in Gansu and Ningxia, with lower coupling coordination levels, should adjust their local industrial structure over time, change the current situation of the overemphasis on the secondary industry, and promote the development and utilization of renewable-energy sources, such as wind power and photovoltaics;
(3)
Strengthen regional coordination and cooperation, and fully utilize the radiating and driving role of surrounding cities on the local area. It is necessary to promote the exchange and replacement of talents, technology, major projects, etc., among cities and fully utilize the spillover effects of surrounding city government input, economic development, and technological innovation on the local WEC system’s coupling and coordinated development. Strengthen the link between cities with higher and lower levels of coupling coordination, learn from the successful experience in the development and utilization of urban water resources and renewable energy, and the optimization of industrial structure at a high coupling coordinated level, and promote the coupling coordinated development of the WEC system in the whole Yellow River basin.

Author Contributions

Conceptualization, J.L.; investigation, L.P. and L.H.; methodology, L.P. and T.S.; supervision, J.L. and L.H.; data curation, L.P. and T.S.; writing—original draft, L.P. and L.H.; writing—review and editing, J.L. All authors have read and agreed to the published version of the manuscript.

Funding

The Soft Science Major Project of Henan Province (Grant No. 212400410002), the National Social Science Foundation of China (Grant No. 21FGLB092), and the Henan Institute for Chinese Development Strategy of Engineering and Technology (Grant No. 2022HENZDA02).

Data Availability Statement

Data are available in a publicly accessible repository.

Conflicts of Interest

The authors declare no conflict of interest.

References

  1. Bp Statistical Review of World Energy. Available online: https://www.bp.com/content/dam/bp/business-sites/en/global/corporate/pdfs/energy-economics/statistical-review/bp-stats-review-2022-full-report.pdf (accessed on 4 May 2023).
  2. Wang, M.; Sun, C.; Wang, X. Analysis of the Water-energy coupling efficiency in China: Based on the three-stage SBM-DEA model with undesirable outputs. Water 2019, 11, 632. [Google Scholar] [CrossRef] [Green Version]
  3. Assefa, Y.T.; Babel, M.S.; Sušnik, J.; Shinde, V.R. Development of a generic domestic water security index, and its application in Addis Ababa, Ethiopia. Water 2019, 11, 37. [Google Scholar] [CrossRef] [Green Version]
  4. Yu, C.Y.; Long, H.Y.; Zhang, X.; Tu, C.L.; Tan, Y.F.; Zhou, Y.; Zang, C.X. Regional integration and city-level energy efficiency: Evidence from China. Sustain. Cities Soc. 2023, 88, 104285. [Google Scholar] [CrossRef]
  5. Chini, C.M.; Stillwell, A.S. The state of US urban water: Data and the energy-water nexus. Water Resour. Res. 2018, 54, 1796–1811. [Google Scholar] [CrossRef]
  6. Grzegorzek, M.; Wartalska, K.; Kaźmierczak, B. Review of water treatment methods with a focus on energy consumption. Int. Commun. Heat Mass Transf. 2023, 143, 106674. [Google Scholar] [CrossRef]
  7. Wang, S.G.; Brain, F.; Chen, B. Energy-water nexus under energy mix scenarios using input-output and ecological network analyses. Appl. Energy 2019, 233, 827–839. [Google Scholar] [CrossRef]
  8. Wang, X.; Song, J.; Xing, J.; Duan, H. System nexus consolidates coupling of regional water and energy efficiencies. Energy 2022, 256, 124631. [Google Scholar] [CrossRef]
  9. Stokes, J.R.; Horvath, A. Energy and Air Emission Effects of Water Supply. Environ. Sci. Technol. 2009, 43, 2680–2687. [Google Scholar] [CrossRef] [Green Version]
  10. Huang, L.; Hou, Z.; Fang, Y.; Liu, J.; Shi, T. Evolution of CCUS Technologies Using LDA Topic Model and Derwent Patent Data. Energies 2023, 16, 2556. [Google Scholar] [CrossRef]
  11. Adebayo, T.S.; Rjoub, H.; Akinsola, G.D.; Oladipupo, S.D. The asymmetric effects of renewable energy consumption and trade openness on carbon emissions in Sweden: New evidence from quantile-on-quantile regression approach. Environ. Sci. Pollut. Res. 2022, 29, 1875–1886. [Google Scholar] [CrossRef]
  12. Ehigiamusoe, K.U.; Dogan, E. The role of interaction effect between renewable energy consumption and real income in carbon emissions: Evidence from low-income countries. Renew. Sustain. Energy Rev. 2022, 154, 111883. [Google Scholar] [CrossRef]
  13. Liu, J.; Tian, Y.; Huang, K.; Yi, T. Spatial-temporal differentiation of the coupling coordinated development of regional energy-economy-ecology system: A case study of the Yangtze River Economic Belt. Ecol. Indic. 2021, 124, 107394. [Google Scholar] [CrossRef]
  14. Lv, C.; Xu, W.; Ling, M.; Wang, S.; Hu, Y. Evaluation of synergetic development of water and land resources based on a coupling coordination degree model. Water 2023, 15, 1491. [Google Scholar] [CrossRef]
  15. Li, H.; Zhao, Y.; Lin, J. A review of the energy–carbon–water nexus: Concepts, research focuses, mechanisms, and methodologies. Wiley Interdiscip. Rev. Energy Environ. 2020, 9, e358. [Google Scholar] [CrossRef]
  16. Zhou, N.; Zhang, J.; Khanna, N.; Fridley, D.; Jiang, S.; Liu, X. Intertwined impacts of water, energy development, and carbon emissions in China. Appl. Energy 2019, 238, 78–91. [Google Scholar] [CrossRef] [Green Version]
  17. Wang, X.; Zhang, Q.; Xu, L.; Tong, Y.; Jia, X.; Tian, H. Water-energy-carbon nexus assessment of China’s iron and steel industry: Case study from plant level. J. Clean. Prod. 2020, 253, 119910. [Google Scholar] [CrossRef]
  18. Rothausen, S.G.; Conway, D. Greenhouse-gas emissions from energy use in the water sector. Nat. Clim. Chang. 2011, 1, 210–219. [Google Scholar] [CrossRef]
  19. Zhang, Z.; Sato, Y.; Dai, J.; Chui, H.K.; Daigger, G.; Van Loosdrecht, M.C.; Chen, G. Flushing toilets and cooling spaces with seawater improve water–energy securities and achieve carbon mitigations in coastal cities. Environ. Sci. Technol. 2023, 57, 5068–5078. [Google Scholar] [CrossRef]
  20. Liu, J.; Shi, T.; Huang, L. A study on the impact of industrial restructuring on carbon dioxide emissions and scenario simulation in the Yellow River Basin. Water 2022, 14, 3833. [Google Scholar] [CrossRef]
  21. Liu, J.; Zhang, Y.; Pu, L.; Huang, L.; Wang, H.; Sarfraz, M. Research on the impact of energy efficiency on green development: A case study of the Yellow River Basin in China. Energies 2023, 16, 3660. [Google Scholar] [CrossRef]
  22. Sun, X.; Zhang, H.; Ahmad, M.; Xue, C. Analysis of influencing factors of carbon emissions in resource-based cities in the Yellow River Basin under carbon neutrality target. Environ. Sci. Pollut. Res. 2022, 29, 23847–23860. [Google Scholar] [CrossRef] [PubMed]
  23. Wang, J.F.; Tian, C.M. The water-carbon constraints’ impact on the development of coal power industry in the Yellow River Basin. Environ. Res. Commun. 2022, 4, 075010. [Google Scholar] [CrossRef]
  24. Chen, X.; Meng, Q.; Shi, J.; Liu, Y.; Sun, J.; Shen, W. Regional differences and convergence of carbon emissions intensity in cities along the Yellow River Basin in China. Land 2022, 11, 1042. [Google Scholar] [CrossRef]
  25. Ren, H.; Liu, B.; Zhang, Z.; Li, F.; Pan, K.; Zhou, Z.; Xu, X. A water-energy-food-carbon nexus optimization model for sustainable agricultural development in the Yellow River Basin under uncertainty. Appl. Energy 2022, 326, 120008. [Google Scholar] [CrossRef]
  26. Yin, D.; Yu, H.; Lu, Y.; Zhang, J.; Li, G.; Li, X. A comprehensive evaluation framework of water-energy-food system coupling coordination in the Yellow River Basin, China. Chin. Geogr. Sci. 2023, 33, 333–350. [Google Scholar] [CrossRef] [PubMed]
  27. Qi, Y.Y.; Arash, F.; Lin, L.; Liu, H. Coupling coordination analysis of China’s provincial water-energy-food nexus. Environ. Sci. Pollut. Res. 2022, 29, 23303–23313. [Google Scholar] [CrossRef] [PubMed]
  28. Wang, S.S.; Yang, J.Y.; Wang, A.L.; Liu, T.F.; Du, S.B.; Liang, S.T. Coordinated analysis and evaluation of water–energy–food coupling: A case study of the Yellow River Basin in Shandong Province, China. Ecol. Indic. 2023, 148, 110138. [Google Scholar] [CrossRef]
  29. Deng, F.; Fang, Y.; Xu, L.; Li, Z. Tourism, Transportation and low-carbon city system coupling coordination degree: A case study in Chongqing Municipality, China. Int. J. Environ. Res. Public Health 2020, 17, 792. [Google Scholar] [CrossRef] [Green Version]
  30. Song, Q.J.; Zhou, N.; Liu, T.L.; Siehr, S.A.; Qi, Y. Investigation of a “coupling model” of coordination between low-carbon development and urbanization in China. Energy Policy 2018, 121, 346–354. [Google Scholar] [CrossRef] [Green Version]
  31. Liu, Y.; Chen, W.; Liu, X.; Shi, J.; Liu, N.; Ren, H.; Li, H.; Ulgiati, S. Multi-objective coordinated development paths for China’s steel industry chain based on “water-energy-economy” dependence. J. Clean. Prod. 2022, 370, 133421. [Google Scholar] [CrossRef]
  32. Liu, Y.; Bian, J.; Li, X.; Liu, S.; Lageson, D.; Yin, Y. The optimization of regional industrial structure under the water-energy constraint: A case study on Hebei Province in China. Energy Policy 2020, 143, 111558. [Google Scholar] [CrossRef]
  33. David, L.O.; Nwulu, N.I.; Aigbavboa, C.O.; Adepoju, O.O. Integrating fourth industrial revolution (4IR) technologies into the water, energy & food nexus for sustainable security: A bibliometric analysis. J. Clean. Prod. 2022, 363, 132522. [Google Scholar] [CrossRef]
  34. Alzaabi, M.S.M.A.; Mezher, T. Analyzing existing UAE national water, energy and food nexus related strategies. Renew. Sustain. Energy Rev. 2021, 144, 111031. [Google Scholar] [CrossRef]
  35. Yang, S.; He, J. Analysis of digital economy development based on AHP-entropy weight method. J. Sens. 2022, 2022, 7642682. [Google Scholar] [CrossRef]
  36. Liu, D.; Zou, Z. Water quality evaluation based on improved fuzzy matter-element method. J. Environ. Sci. 2012, 24, 1210–1216. [Google Scholar] [CrossRef] [PubMed]
  37. Li, Q.; Meng, X.; Liu, Y.; Pang, L. Risk assessment of floor water inrush using entropy weight and variation coefficient model. Geotech. Geol. Eng. 2019, 37, 1493–1501. [Google Scholar] [CrossRef]
  38. Zhao, Y.; Hou, P.; Jiang, J.; Zhai, J.; Chen, Y.; Wang, Y.; Bai, J.; Zhang, B.; Xu, H. Coordination study on ecological and economic coupling of the Yellow River Basin. Int. J. Environ. Res. Public Health 2021, 18, 10664. [Google Scholar] [CrossRef]
  39. Yan, B.; Dong, Q.; Li, Q.; Amin, F.U.; Wu, J. A study on the coupling and coordination between logistics industry and economy in the background of high-quality development. Sustainability 2021, 13, 10360. [Google Scholar] [CrossRef]
  40. Silverman, B.W. Density Estimation for Statistics and Data Analysis; Chapman and Hall: New York, NY, USA, 1986; pp. 25–39. [Google Scholar]
  41. Anselin, L. Local indicators of spatial association—LISA. Geogr. Anal. 1995, 27, 93–115. [Google Scholar] [CrossRef]
  42. Ma, X.B.; Sun, B.; Hou, G.L.; Zhong, X.; Li, L. Evaluation and spatial effects of tourism ecological security in the Yangtze River Delta. Ecol. Indic. 2021, 131, 108190. [Google Scholar] [CrossRef]
  43. Zhao, P.J.; Zeng, L.E.; Lu, H.Y.; Zhou, Y.; Hu, H.Y.; Wei, X.Y. Green economic efficiency and its influencing factors in China from 2008 to 2017: Based on the super-SBM model with undesirable outputs and spatial Dubin model. Sci. Total Environ. 2020, 741, 140026. [Google Scholar] [CrossRef] [PubMed]
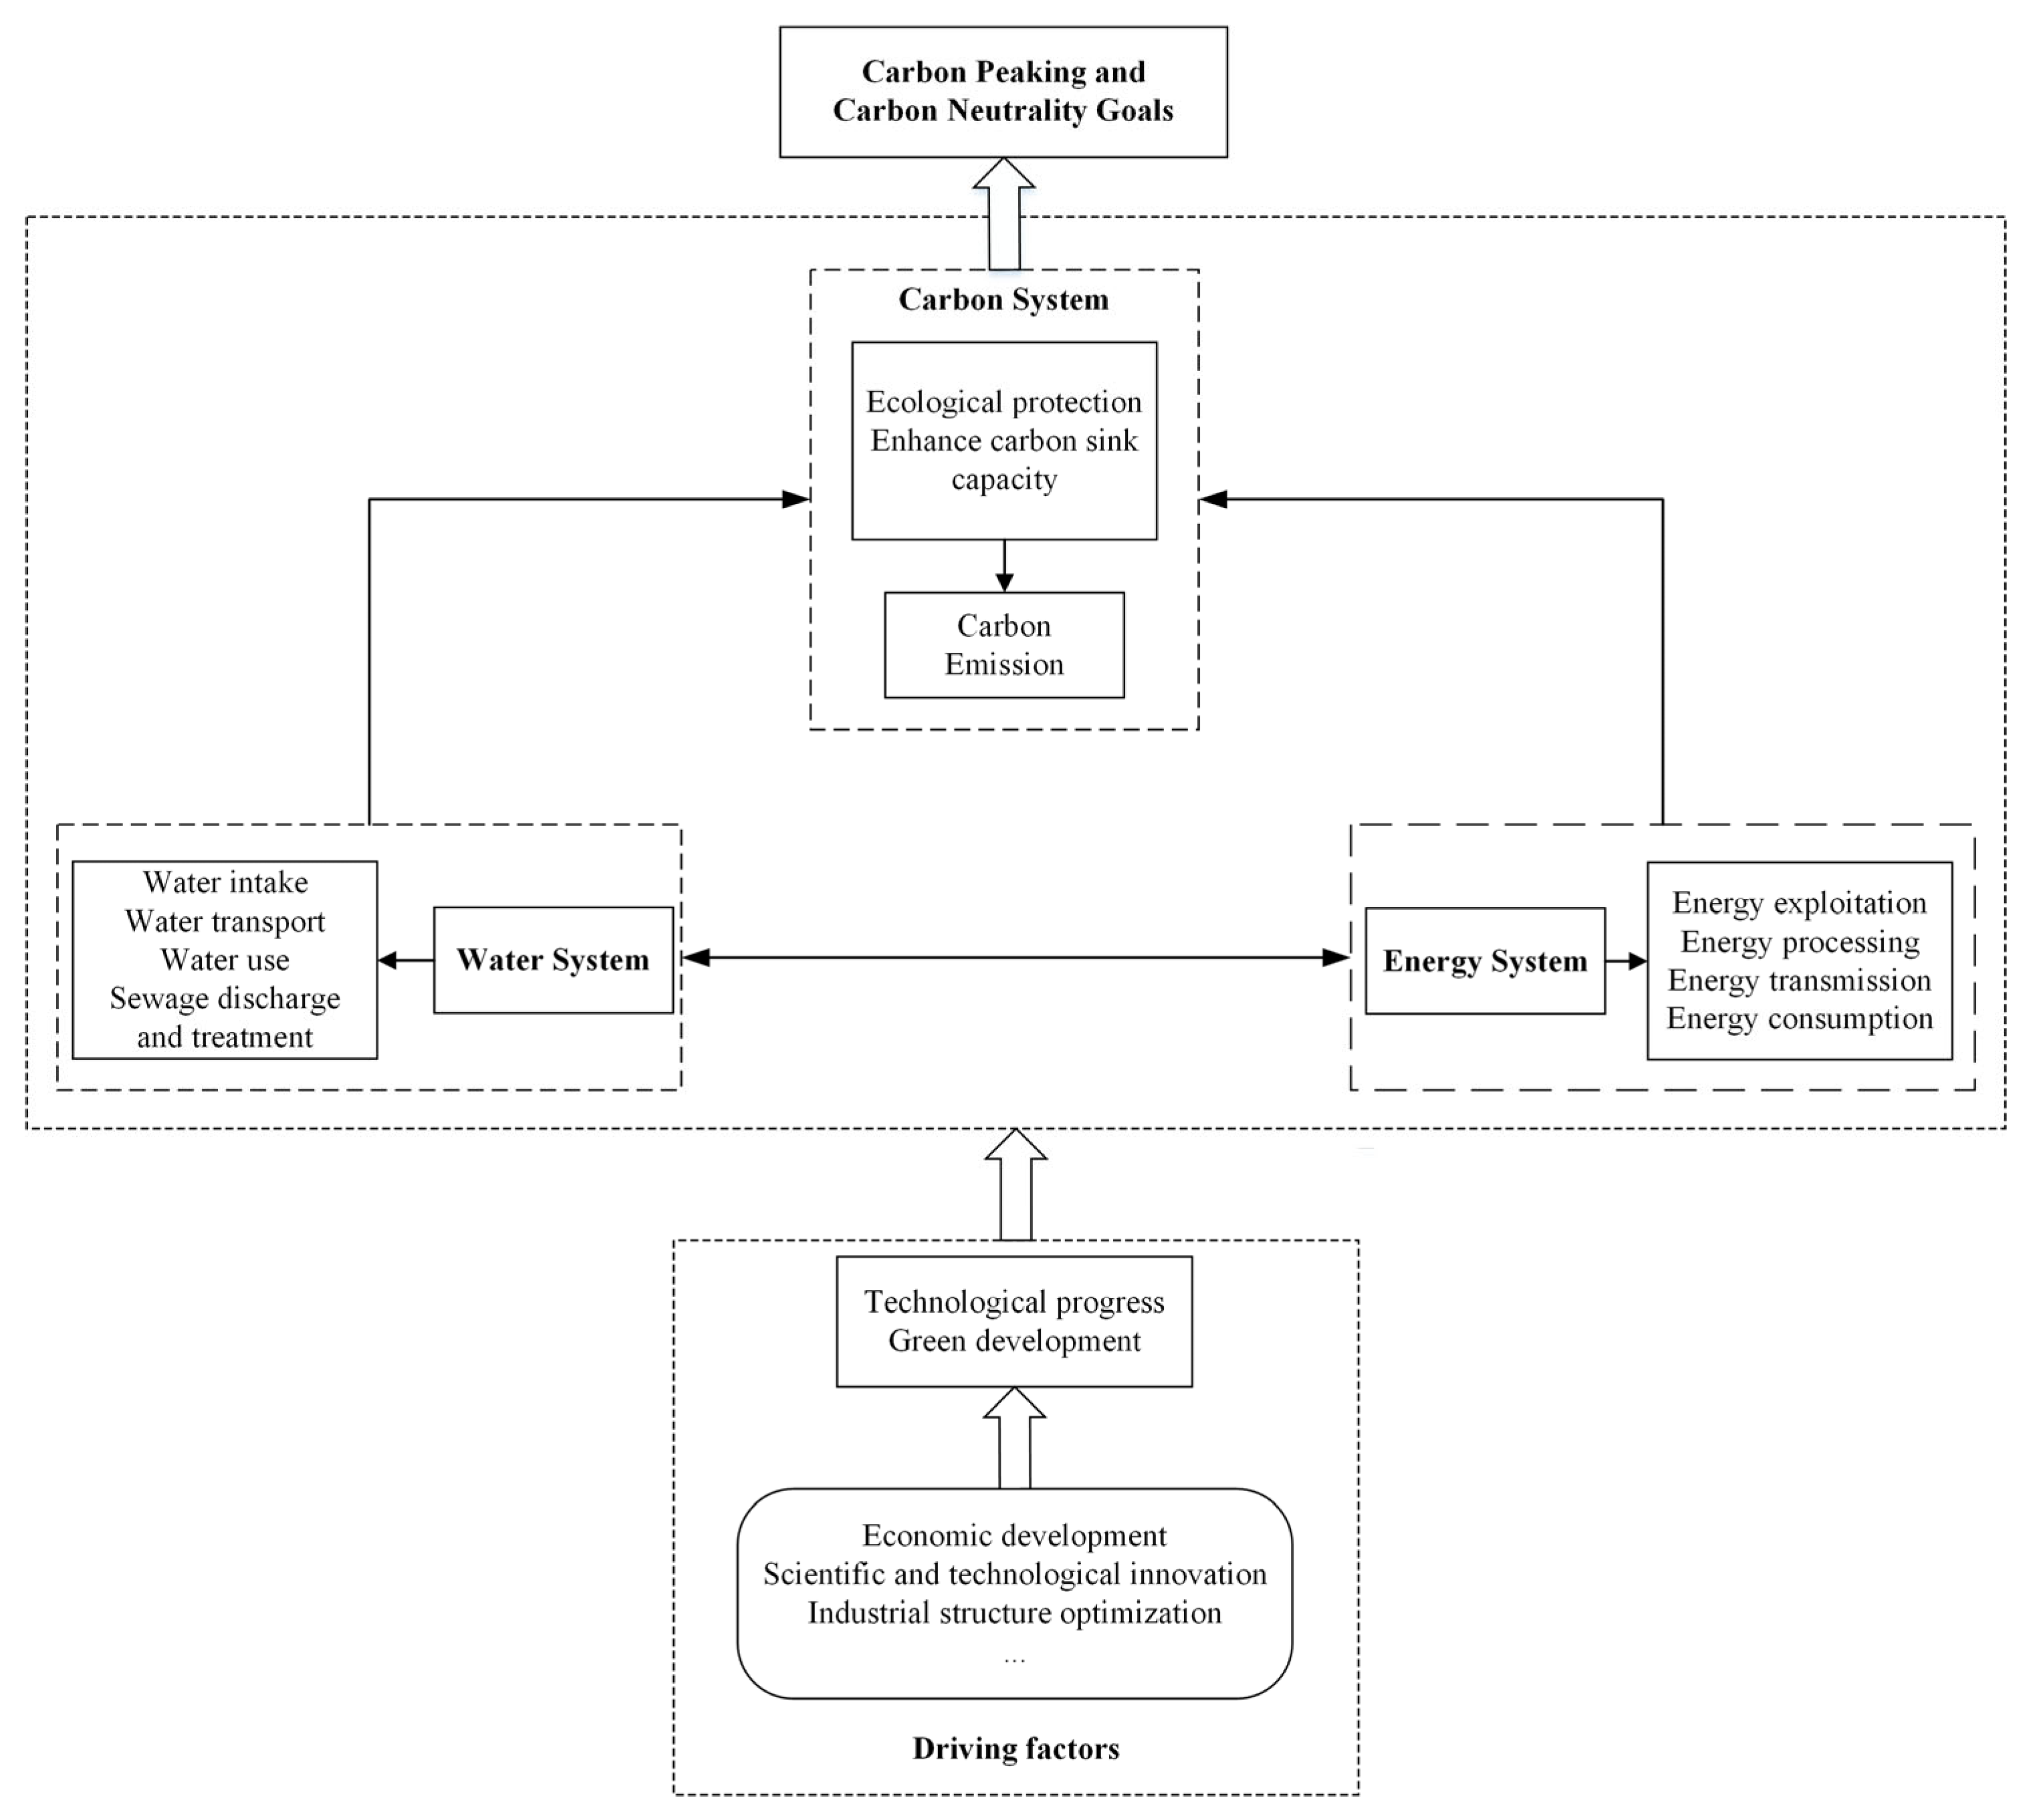
Figure 1. Coupling and Coordinating Mechanism of WEC.
Water 15 02377 g001
Figure 2. Research Area.
Water 15 02377 g002
Figure 3. Subsystem Development Index.
Water 15 02377 g003
Figure 4. Spatial-distribution pattern of WECD in the Yellow River basin in 2012 and 2021.
Water 15 02377 g004
Figure 5. Kernel density estimation of WECD in the Yellow River basin.
Water 15 02377 g005
Figure 6. LISA cluster map of WECD in the Yellow River basin in 2012 and 2021.
Water 15 02377 g006
Table 1. Quantitative Assessment Indicator System for the Coupling Coordination of WEC in the Yellow River basin.
System LayerElement LayerIndicator LayerData Source and CalculationUnitNature
Water SystemWater-Resource SupplyPer Capita Total Water ResourcesTotal Water Resources/Populationm3/person+
Water Production CoefficientTotal Water Resources/Total Precipitation+
Water-Resource UtilizationPer Capita Water ConsumptionTotal Water Use/Populationm3/person
Proportion of Domestic Water UseDomestic Water Use/Total Water Use%
Proportion of Ecological Water UseEcological Water Use/Total Water Use%+
Wastewater Discharge VolumeStatistical Data104 t
Energy SystemEnergy ProductionInvestment in Energy IndustryStatistical Data104 CNY+
Total Power GenerationStatistical Data108 kwh+
Energy ConsumptionPer Capita Energy ConsumptionTotal Energy Consumption/Populationt/person
Energy Consumption IntensityEnergy Consumption/GDPt/104 CNY
Per Capita Residential Electricity ConsumptionResidential Electricity Consumption/PopulationkWh
Carbon SystemCarbon EmissionPer Capita Carbon EmissionsCarbon Emissions/Populationt/person
Carbon Emission IntensityCarbon Emissions/GDPt/104 CNY
Carbon ReductionPer Capita Park Green AreaStatistical Datam2+
Forest Coverage RateStatistical Data%+
Urban Built-up Area Green Coverage RateStatistical Data%+
Table 2. Explanation of the indicators for the driving factors.
VariablesIndicatorsData Source and CalculationUnit
Economic Base (EB)Per Capita GDPRegional GDP/PopulationCNY
Industrial Structure (IS)The Proportion of Secondary Industry Output Value in GDPSecondary Industry’s Output Value/GDP%
Technological Innovation (TI)Number of Invention Patents Granted per 10,000 PeopleStatistical DataItems
Openness to the Outside World (OP)Dependence Degree on Foreign TradeTotal Import and Export Value/GDP%
Table 3. Criteria for the classification of coupling coordination degree.
WECD-ValueCoupling Coordination DegreeWECD-ValueCoupling Coordination Degree
[0, 0.1)Extreme disorder[0.5, 0.6)Reluctant coordination
[0.1, 0.2)Severe disorder[0.6, 0.7)Primary coordination
[0.2, 0.3)Moderate disorder[0.7, 0.8)Intermediate coordination
[0.3, 0.4)Mild disorder[0.8, 0.9)Good coordination
[0.4, 0.5)Verge of disorder[0.9, 1]High-quality coordination
Table 4. Global Moran’s Index of coupling coordination of WEC system in the Yellow River basin.
YearsMoran’s Iz Valuep Value
20120.2953.4720.001
20130.3323.8840.001
20140.3443.9940.001
20150.3253.8100.001
20160.3423.9990.001
20170.3724.3290.002
20180.3804.4260.001
20190.4084.7300.001
20200.3824.4510.001
20210.3363.9570.001
Table 5. Regression results of the WEC system coupling coordination degree model in the Yellow River basin from 2012 to 2021.
VariablesOLSThe Spatial Durbin Model
Spatial Proximity Weight MatrixSpatial Inverse Distance Weight Matrix
EB0.1257 ***0.0291 ***0.0444 ***
(0.0072)(0.0099)(0.0086)
IS−0.0895 ***−0.0758 **−0.0884 ***
(0.0151)(0.0232)(0.0182)
TI0.0075 ***0.0103 ***0.0094 ***
(0.0028)(0.0034)(0.0035)
OP0.1251 ***−0.2496−0.0379
(0.0069)(0.4104)(0.4270)
log-likelihood 1064.05581092.9885
R20.38050.80800.8234
N570570570
Note: The numbers in parentheses are standard errors, and *** and ** respectively, represent significance at the levels of 1% and 5%.
Table 6. Decomposition of impact effects in the SDM model.
VariablesDirect EffectIndirect Effect
EB0.0328 ***0.1401 ***
(0.0088)(0.0430)
IS−0.0401 ***−0.2768 ***
(0.0110)(0.0638)
TI0.0040 ***0.0336 ***
(0.0016)(0.0116)
OP−0.0906−1.0996
(0.3930)(2.5907)
Note: The numbers in parentheses are standard errors, and *** represents significance at the level of 1%.
Disclaimer/Publisher’s Note: The statements, opinions and data contained in all publications are solely those of the individual author(s) and contributor(s) and not of MDPI and/or the editor(s). MDPI and/or the editor(s) disclaim responsibility for any injury to people or property resulting from any ideas, methods, instructions or products referred to in the content.