1. Introduction
Globally, with countries transitioning from the Millennium Development Goals (MDGs) [
1] to the Sustainable Development Goals (SDGs) [
2], different challenges are fast emerging with different targets of the SDGs. This is particularly true with regard to the targets surrounding the delivery of safe drinking water services to all, as in SDG 6.1. Progress made over the course of the MDGs at a global level was substantial, with the Joint Monitoring Programme (JMP) suggesting that the targets were met in 2010, and 2.6 billion people gained access to ‘improved drinking water sources’ between 1990 and 2015 [
1]. However, significant challenges lie ahead, as SDG target 6.1 is much more stringent than earlier targets, with indicators for monitoring progress towards the targets becoming more specific. While the MDG target for ‘safe’ drinking water considered the percentage of the population using ‘improved water sources’ (those having the potential to deliver safe water by nature of their design and construction) as an indicator [
3], it characterizes water sources solely by the type of facility, without being able to address the aspect of drinking water quality [
4,
5,
6]. Not all improved water sources as considered have proven to be providing water of an acceptable quality [
6,
7,
8,
9,
10]. Several of these earlier concerns have been addressed in the SDG 6.1 target, which calls for ‘safely managed drinking water services’, defined as ‘drinking water from an improved source which is located on the premises, available when needed and free from priority contamination’ [
3]. In sum, transitioning from the MDG to the SDG is now a much bigger challenge, especially due to water quality constraints.
Groundwater remains the major element in the context of drinking water supply, and the successful implementation of the SDGs will require acknowledging the paramount role groundwater plays in the process [
11,
12,
13]. Groundwater is usually the more accessible option, in the absence of suitable alternative options [
12,
14], providing drinking water to at least 50% of the global population. About 2.5 billion people depend solely on groundwater resources to satisfy their basic daily water needs [
15,
16]. However, although groundwater-based supplies such as tube wells are considered as improved water sources, there is considerable uncertainty with groundwater in different hydrogeologic contexts, with groundwater as a safe water source compromised by the widespread presence of contaminants such as arsenic, fluoride and salinity. Arsenic and fluoride have been considered as ‘priority contaminants’ at a global level, although priority chemicals will vary by country, with the JMP carrying out water quality testing for these two parameters, along with
E. coli, in collaboration with UNICEF’s Multiple Indicator Cluster Survey (MICS) programme [
6,
17]. In the MDG era, comparatively less emphasis was given to salinity in groundwater, which makes water unpalatable and unusable and has considerable implications in many larger coastal areas, such as Bangladesh [
18,
19,
20,
21] and East and West Africa [
22,
23], as well as for inland populations, such as Haryana, Delhi, Uttar Pradesh, Karnataka, Punjab, Rajasthan, Gujarat and Tamil Nadu in India [
24,
25,
26]. Due to the high degree of heterogeneity of hydrogeologic properties, salinity is often highly variable over space, contributing to high levels of spatial inequalities of groundwater security risks.
Spatial inequalities of groundwater risks, especially in the coastal area, have substantial implications for achieving the SDG 6.1 targets in Bangladesh. The country has made substantial achievement as per the target for the MDGs, with nearly 98 percent of people having access to improved sources that meet the basic service level threshold outlined by the JMP, and between 87 and 88 percent people with access to improved sources in compliance with the Bangladesh standard for arsenic [
27,
28,
29]. However, the country faces substantial challenges going forward in terms of the SDG target of safely managed drinking water services. Much of the water that is tapped remains impacted by high levels of salinity, arsenic or bacteriological contamination, and the country thus lags behind against the more stringent SDG 6.1 criteria, with 74% of people having access to improved water sources on their premises and 53% of people having access to water from a source that meets the Bangladesh standard for arsenic and
E. Coli [
3].
The aquifers constitute the main source of potable fresh water because of surface water quality constraints, with close to 90 percent of the population using water derived from tube wells [
27]. The tube-well-based water supply started with government-led initiatives, which were later taken over by the private sector. A recent, albeit rough, estimate shows that 10 million tube wells (83.5%) have been privately installed out of a total of 12 million tube wells (1.5 million or 12.5% installed by the government; 0.5 million or 4% installed by NGOs and other local community groups) across the country, thus providing a considerable contribution to the current high levels of improved access to drinking water supplies [
30]. However, although groundwater-based supplies, such as tube wells, are considered as improved water sources, the uncertainty regarding groundwater quality and the lack of its monitoring, the non-availability of suitable aquifers, and the lowering of the water table, are substantial concerns [
20,
31,
32,
33,
34,
35], with people in many places unknowingly drinking unsafe water or being forced to drink unsafe water in the absence of good alternative options [
27,
36]. Additionally, susceptibility to damage or non-functionality because of disasters enhances the threat to the safe supply of drinking water [
37,
38,
39].
Hydrogeology in Bangladesh is considerably complex, which has meant that groundwater risk in terms of availability and quality is, spatially, highly variable. With arsenic predominantly found in shallower depths [
40,
41], the exploitation of groundwater resources in deeper aquifers via deep tube wells has been the principal arsenic mitigation measure and accounted for more than 80% of arsenic mitigation interventions across the country [
30], including the northern part of the coastal zone. However, salinity becomes the more dominant water quality parameter in the southern coastal zone, with a high degree of spatial variability in different aquifers, including both those at shallow and deeper depths. Salinity in groundwater has been a widespread problem in the coastal aquifers and is caused by both natural and human-induced reasons, such as sea level rise, storm surges and freshwater pumping [
42,
43].
The spatial variability of salinity, and availability of suitable aquifer layers, have meant that people in hard-to-reach, hydro-geologically difficult areas are deprived of access to productive and functional tube wells providing water with acceptable quality, which makes them look for alternative options, such as community tube wells at distant locations, pond sand filters (PSFs) and rainwater harvesting systems (RWHS) [
29]. Few other groundwater-based options, such as piped distribution systems, vended water supply systems and desalination plants, such as reverse osmosis and managed aquifer recharge (MAR), have been introduced but, so far, to a limited extent [
20,
31,
33,
38,
44,
45]. The usefulness, efficiency, and sustainability of these options are context-specific and have been linked to technical (i.e., the geophysical and hydrogeological conditions as well as the availability and quality of water), socioeconomic (distance to water sources or access) and institutional (monitoring and financial management system) factors [
20,
21,
31,
38,
45], which have manifested in differential impacts on different dimensions of safely managed drinking water sources, including safety, access, reliability and affordability [
29].
Against the backdrop of the above discussion, the motivation for this paper comes from several uncertainties or knowledge gaps associated with the spatial inequalities of groundwater risks in coastal Bangladesh, which are expected to pose significant challenges to the country’s priorities set around SDG 6.1, including the target of increasing rural drinking water and public water point coverage, and the introduction or expansion of appropriate, affordable technological options, with particular emphasis on water-stressed, hard-to-reach and hydro-geologically difficult areas [
46]. Firstly, the definition of ‘safe’ water, as per SDG 6.1, needs to be consistent across all policy actions. The improved access to ‘safely managed’ sources is often beset by uncertainties around affordability, reliability and most importantly, safety. Secondly, the absence of any systematic monitoring of water quality (particularly of salinity in the southern coastal zone) makes it hard to derive estimates of actual coverage of safe drinking water. The monitoring of groundwater salinity in coastal zones becomes hard with the intensive and unregulated installation of private tube wells by middle- and high-income households. Thirdly, although the census data (e.g., [
47]) map the drinking water coverage of households by different water sources, including tube wells and down to mouza (the lowest administrative unit) level, there are uncertainties around whether they capture the SDG-relevant dimensions of water security risks, as people are reported to be unknowingly drinking saline water in some areas, while being forced to do so in others, because of hydrogeologic constraints and a lack of alternative options [
27,
44].
In this paper, we first introduce the overall drinking water security status of the southernmost coastal region of Bangladesh. We discuss the drinking water stress and different options used by people in different areas in the light of the variability of regional aquifer systems and the variability of the occurrence of major contaminants, viz., salinity and arsenic. This provides the context of the deep-dive investigation we conducted using multi-disciplinary methods in our study area, Polder-29, a small geographical area located in Dumuria Upazila of the Khulna district in the southwest coastal zone. Backed by a carefully designed field survey and measurements, the investigation included an evaluation of the hydrogeology, drinking water infrastructure and the socio-economic context, with a view to understanding the spatial inequalities of groundwater risks, taking into consideration several important SDG relevant aspects, including safety, reliability and accessibility. The study provided an opportunity to investigate the status of drinking water status in an area not considered as one of the most stressed areas as per national assessments, reflected in the fact that about 80 to 100 percent of its drinking water coverage being provided by tube wells [
47]. In this paper, we emphasize the importance of delineating spatial variability hydrogeologic risks and monitoring salinity as an essential requirement for SDG 6.1 delivery. We also highlight the need for revisiting current policy and practice around different infrastructural investments to reliably deliver safe water in the coastal area.
2. Drinking Water Stress in Southwest Coastal Region
The coastal zone of Bangladesh comprises 19 districts, representing 32% of total land area and housing nearly 39 million people [
47]. Groundwater has been the major source of drinking water because of the quality constraints associated with surface water at the coast. Productive aquifers occur within the thick unconsolidated alluvial sediments deposited during the Plio-Pleistocene and Holocene age [
48,
49,
50,
51]. However, being part of the active delta, coastal hydrogeology is more complex [
52,
53,
54], as seen manifested in its wide variation and discontinuity in lithology, both in horizontal and vertical directions [
55].
Although regional aquifers in Bangladesh have been conceptualized differently in different studies (e.g., [
36,
41,
56]), a generally accepted conceptualization for the coastal aquifers [
56] represents a three-layer system: (i) the shallow or the first aquifer (the upper Holocene aquifer), below a thick upper clay and silt unit, in many places; (ii) the deep or the second aquifer (with a sedimentary sequence from the mid-Holocene) of less thickness compared to the shallow aquifer, generally underlain and overlain by a silty clay bed, with the aquifer thickness generally decreasing, and the upper clay thickness generally increasing, from the north to the south; and (iii) the deeper or the third aquifer, with a sedimentary sequence from the late Pleistocene to early Holocene, encountered to depths of 300–350 m, below a silty clay aquitard.
Arsenic and salinity are major water quality constraints in the coastal zone. The distribution of arsenic is quite strongly correlated with depth; the main depth range of high arsenic is between 10 and 80 m, almost entirely within the shallow aquifer [
40,
41]. Groundwater from a depth greater than 150 m has become the preferred alternative source, and deep tube wells have accounted for more than 80% of arsenic mitigation interventions across the country [
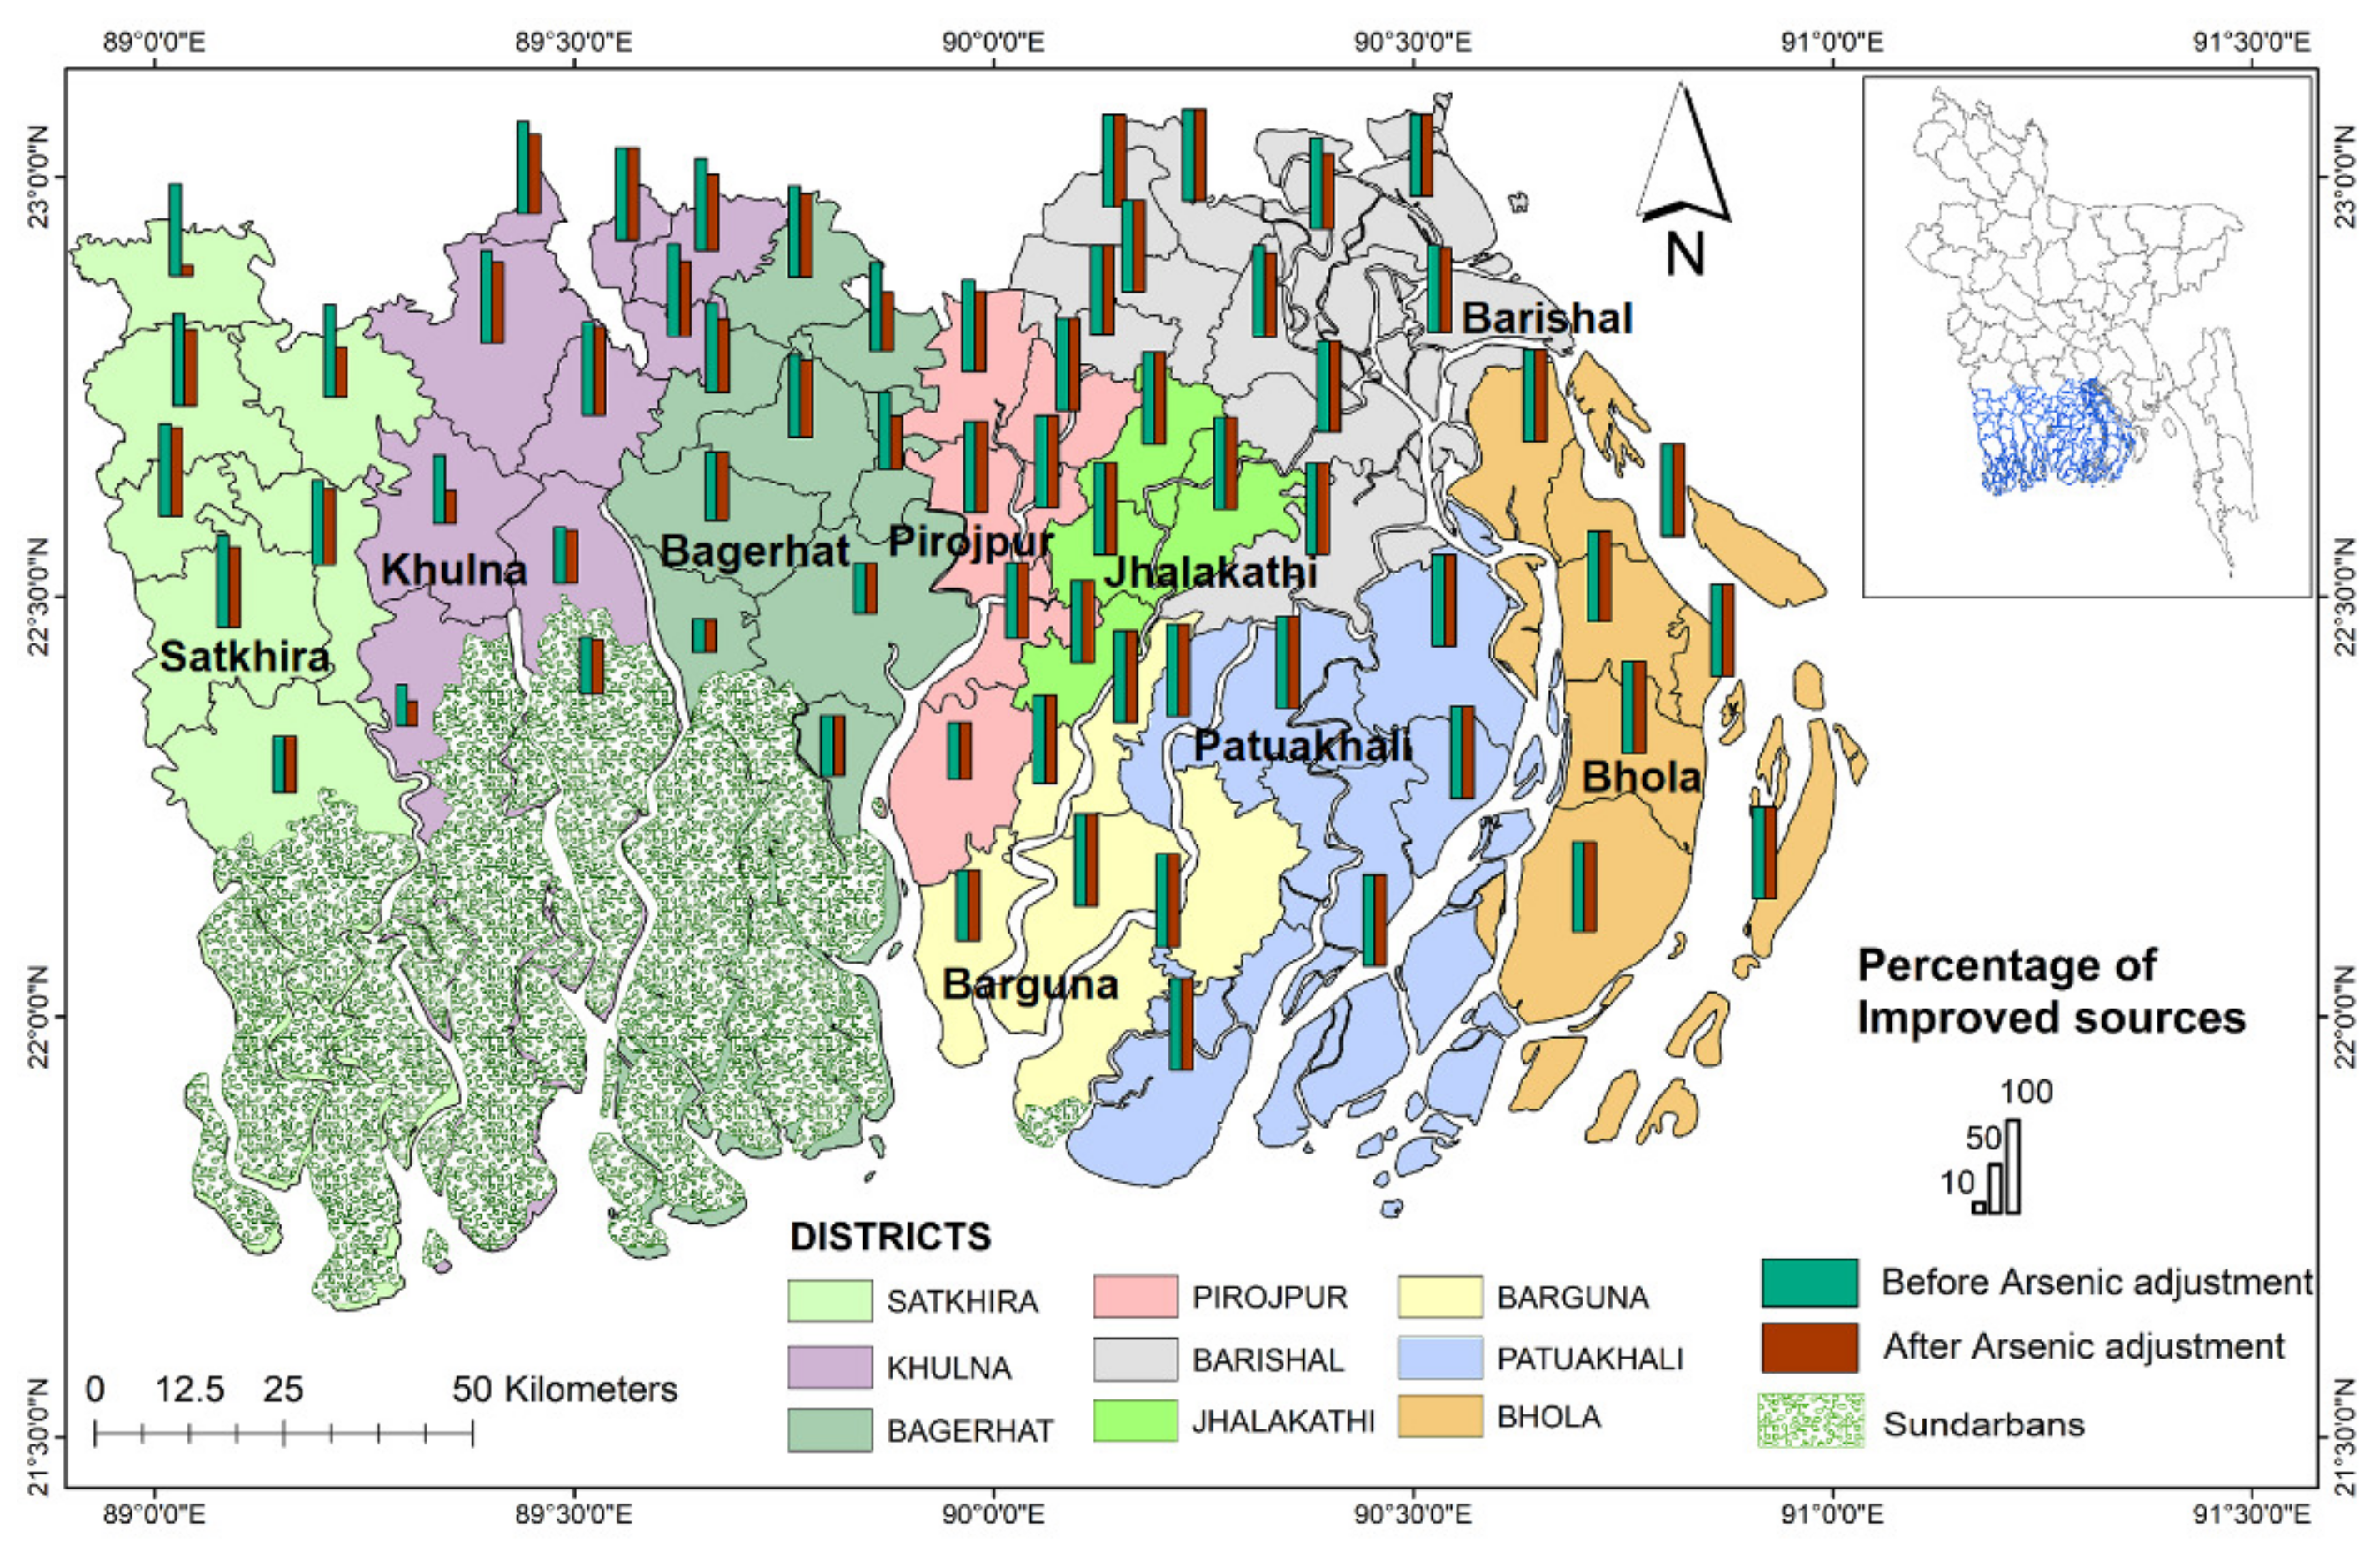
30]. In the south western and south central nine coastal districts of the exposed coast (a total of 48 upazilas of 12 districts exposed to the coast and/or the lower estuaries are termed as the exposed coast), viz., Satkhira, Khulna, Bagerhat, Pirojpur, Jhalokathi, Barguna, Patuakhali, Barisal and Bhola (
Figure 1) [
56], which are home to more than 14 million people [
47], arsenic contamination in shallow aquifer is more prevalent in the northern fringe areas, and the areas in the south are relatively free from arsenic [
41]. The coverage of improved water sources (principally tube wells) in these areas reduces after correction for arsenic as per the Bangladesh standard (
Figure 1).
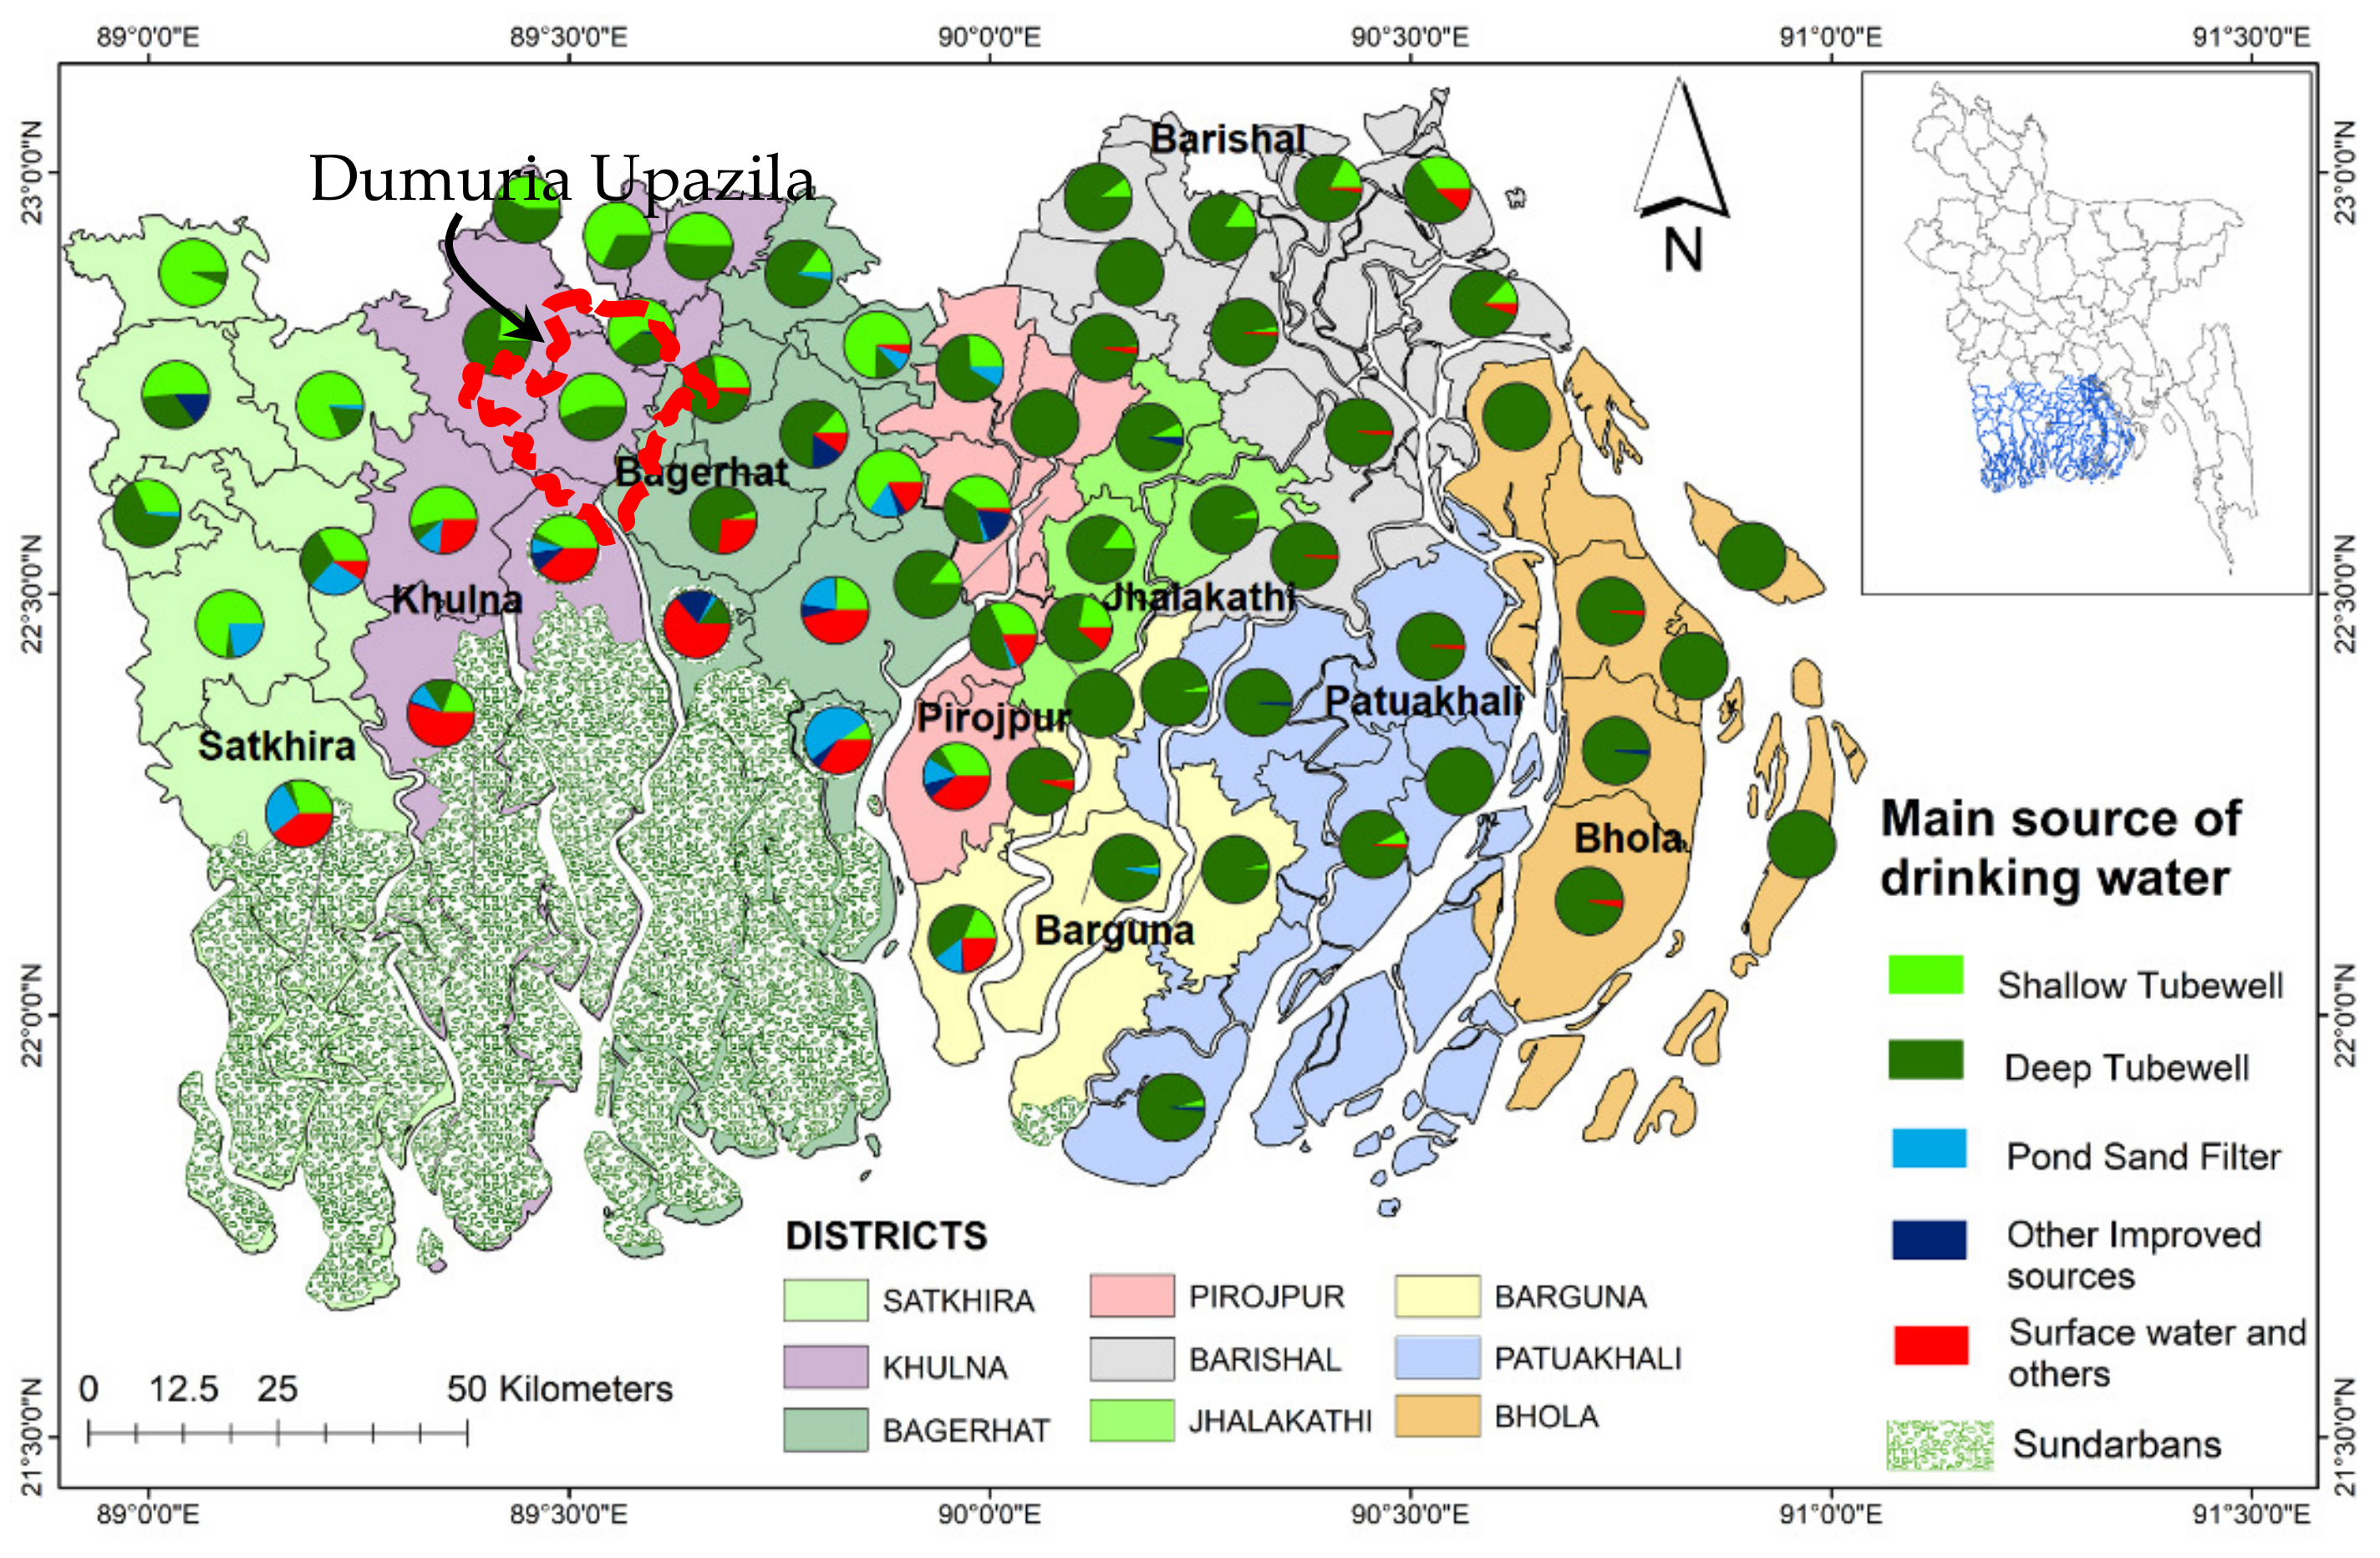
Salinity becomes the more dominant water quality parameter in general in these 9 southern coastal districts, with a high degree of spatial variability in different aquifers, including both those at shallow and deeper depths. The fact that deeper aquifers are brackish to saline in many parts renders many deep tube wells ineffective, although groundwater at these depths is free of arsenic. These water quality constraints, together with the availability of suitable aquifer layers, have influenced the use of different technologies by the people living in these districts (
Figure 1 and
Figure 2). Tube wells have been the dominant source of drinking water in these districts, as in other parts of the country (
Figure 1). Despite the presence of arsenic in the shallow aquifer in some northern upazilas of Satkhira, Khulna, Bagerhat and Pirojpur, the use of shallow tube wells (STW) has been much more widespread than the use of deep tube wells (DTW) (depth < 150 m is shallow tube well, and depth > 150 m is deep tube well [
57]) where arsenic concentration is within an acceptable limit, and freshwater lenses are available in the shallow aquifer or the water is less saline. Tube well coverage in the southern part of the same districts is much lower compared to other parts of the region (
Figure 2). This is principally because of the high levels of salinity both in the first (i.e., shallow) and the second (i.e., deep) aquifers, and due to the unavailability of suitable second aquifers in terms of thickness [
35,
58], thus limiting the use of technology to principally shallow tube wells. Thus, people in these areas have a larger share of surface water and other unimproved sources (
Figure 1). Drinking water supply is heavily constrained in the Koyra, Dacope and Paikgacha Upazilas in Khulna, and Shyamnagar and Assasuni Upazilas in Satkhira. Almost all unions of Dacope, Koyra and Shaymnagar Upazilas suffer from a lack of adequate safe water supply. Drinking water technologies in the eastern districts, viz., Barguna, Patuakhali, Jhalokathi, Barisal, and Bhola (
Figure 1), are dominated by DTWs. Although the shallow and deep aquifers in these districts are brackish to saline [
58], tube wells have been mostly sunk into the deeper aquifers at a much deeper depth (>1000 ft/300 m), where groundwater is relatively fresh.
Although areas in the northern half of the districts, shown in
Figure 1 and
Figure 2, show high coverage by tube wells (including both shallow and deep tube wells, generally considered as improved water sources), the fact that only arsenic and fecal contamination have so far been considered the priority contaminants, while salinity remains unmonitored, means that there are large uncertainties regarding the safety aspect of the water derived from tube wells. This is particularly true for the rapidly increasing private wells but may also be a concern for the community tube wells installed by different agencies.
We conducted a detailed study (presented in subsequent sections) in the Dumuria Upazila of the Khulna district (marked in
Figure 2) and demonstrated that groundwater-based technologies, such as tube wells, do not necessarily indicate the extent of safe drinking water supply in complex hydrogeologic settings with high spatial variability of groundwater salinity risks, and without any monitoring of salinity. The results have wider implications for more groundwater-stressed areas due to higher levels of salinity and greater hydrogeologic complexity.
4. Results and Discussion
4.1. Hydrogeologic Constraints for Drinking Water Supply
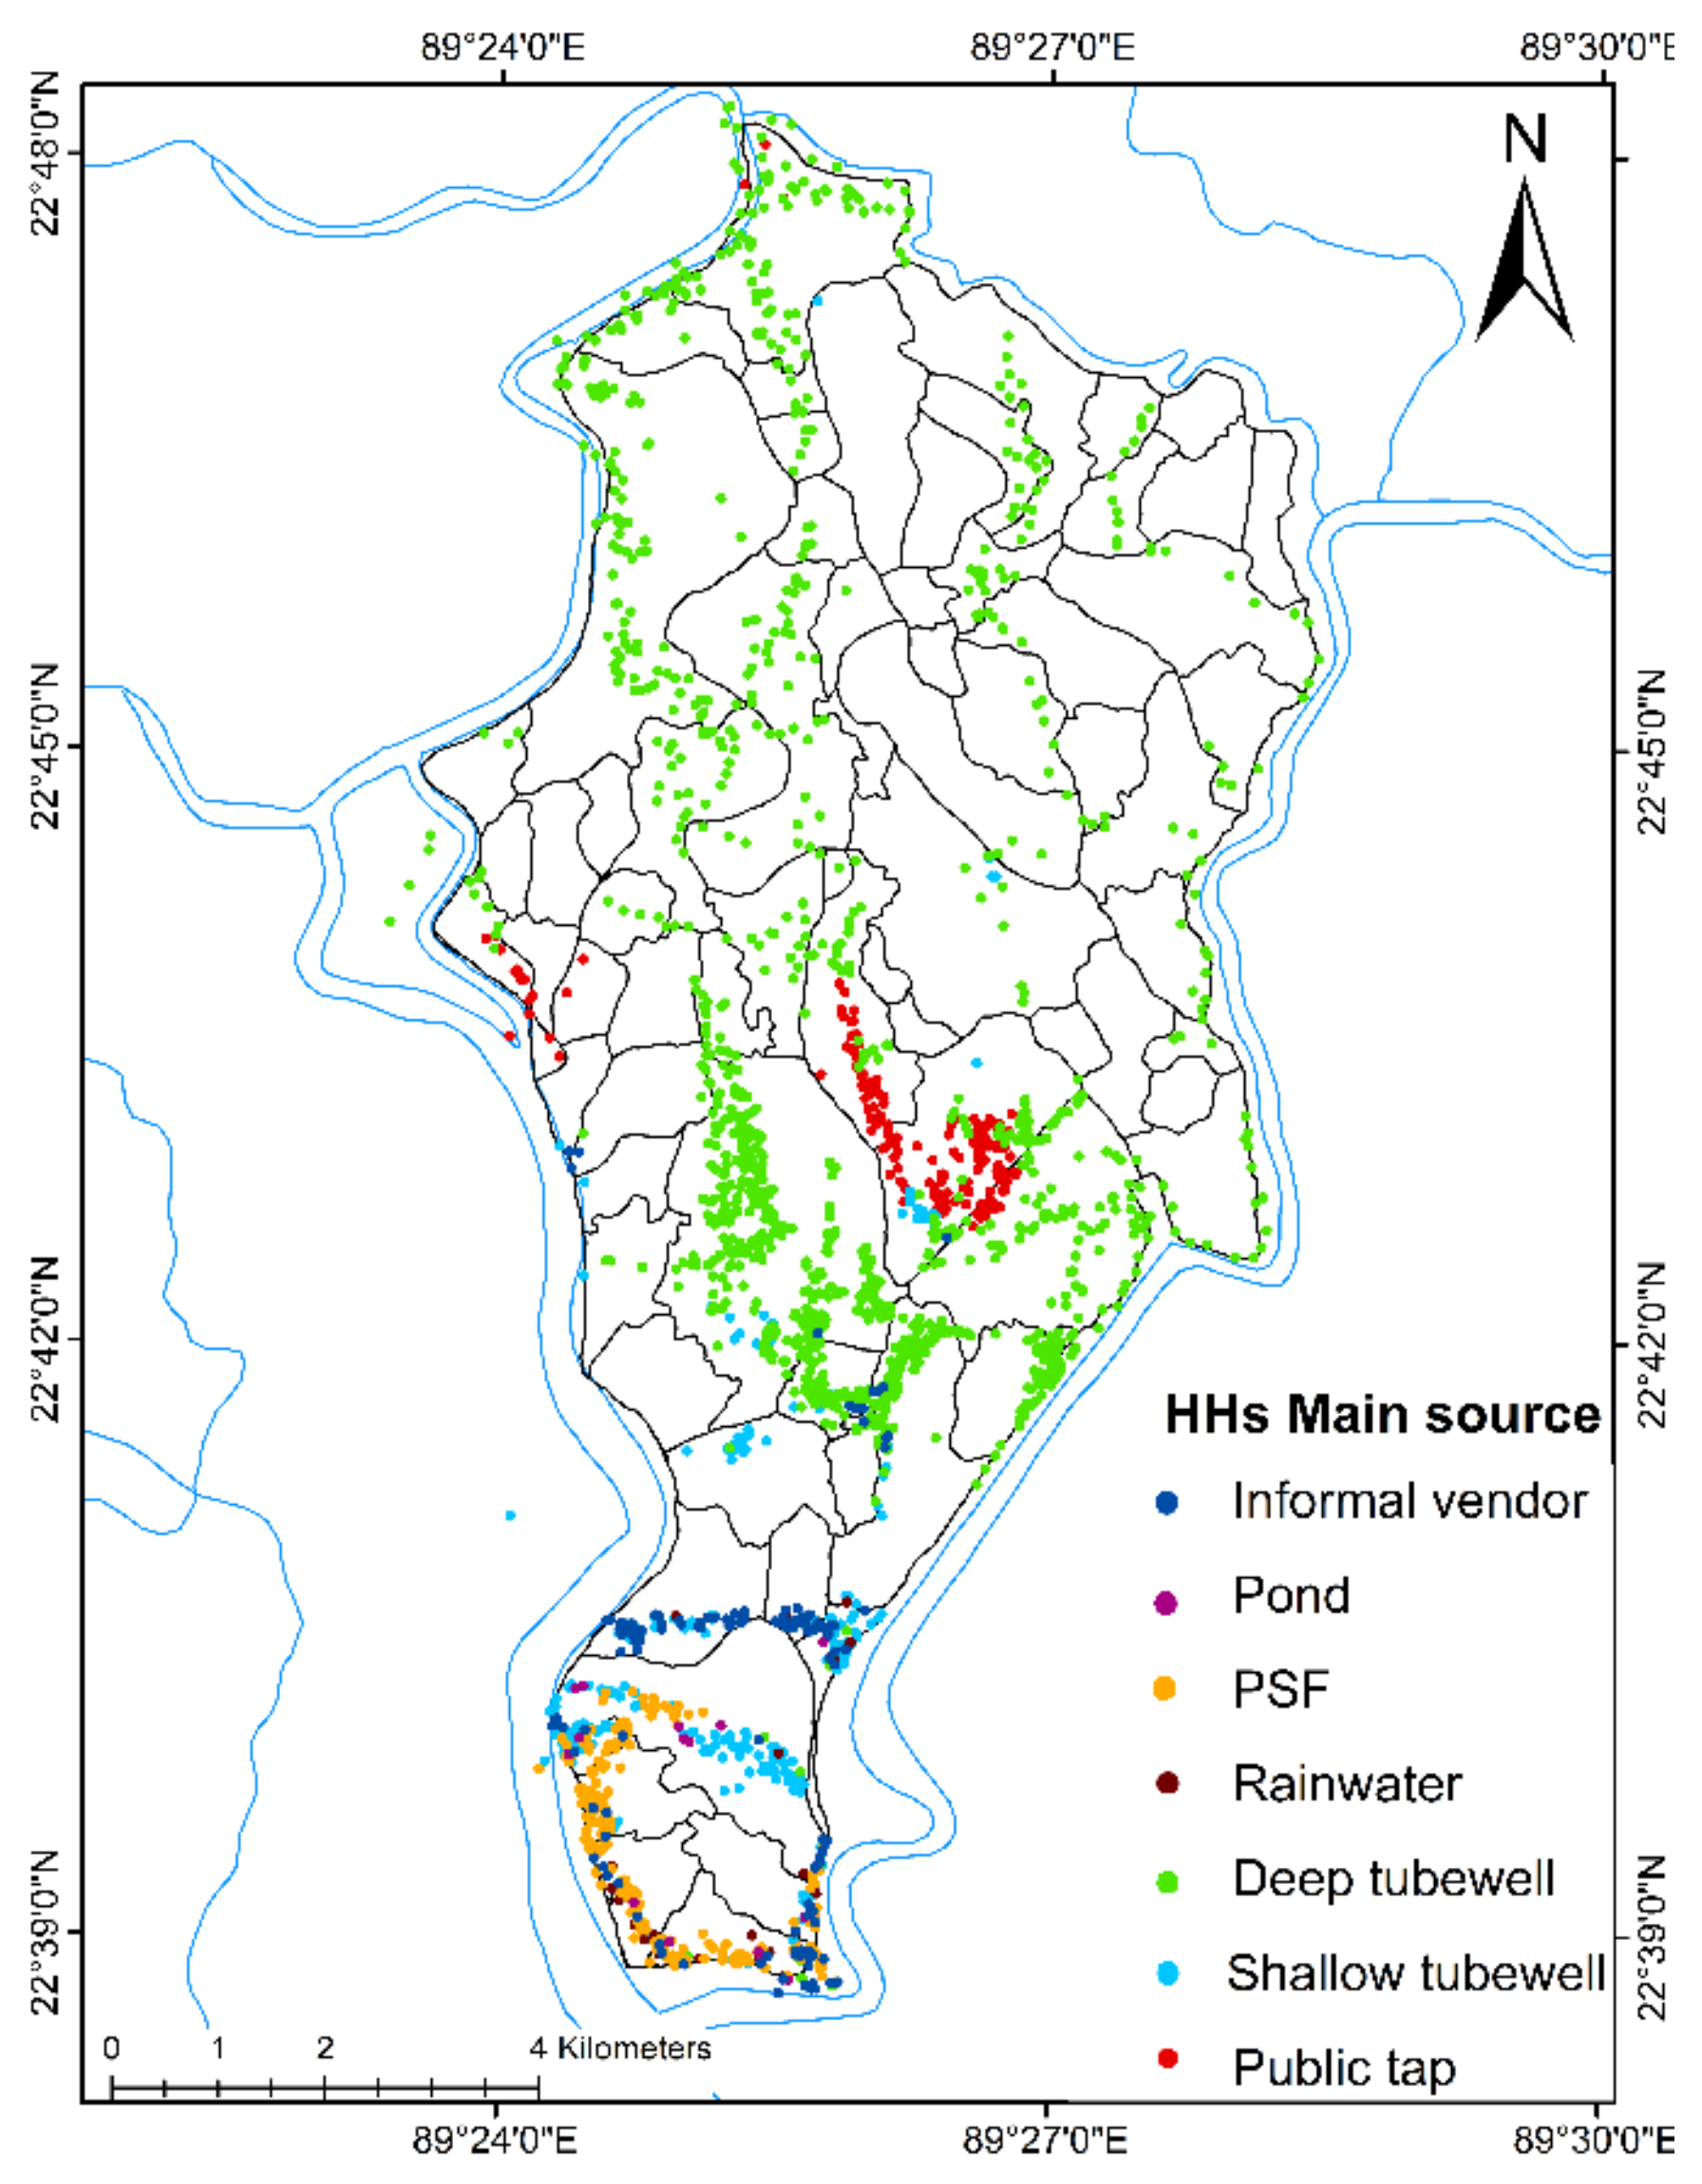
Tube wells are the dominant sources of drinking water in the study area; about 72 percent of households use tube wells as their primary source of drinking water as per the household survey (
Figure 4). However, tube wells are concentrated mostly in the northern mouzas, where concerns about drinking water services are relatively low. People have resorted to alternative options in the form of pond sand filters (PSFs), rainwater harvesting or vended water supplies in the hydro-geologically difficult areas in the south, where a suitable aquifer of acceptable quality is not available and, hence, drinking water concerns are acute.
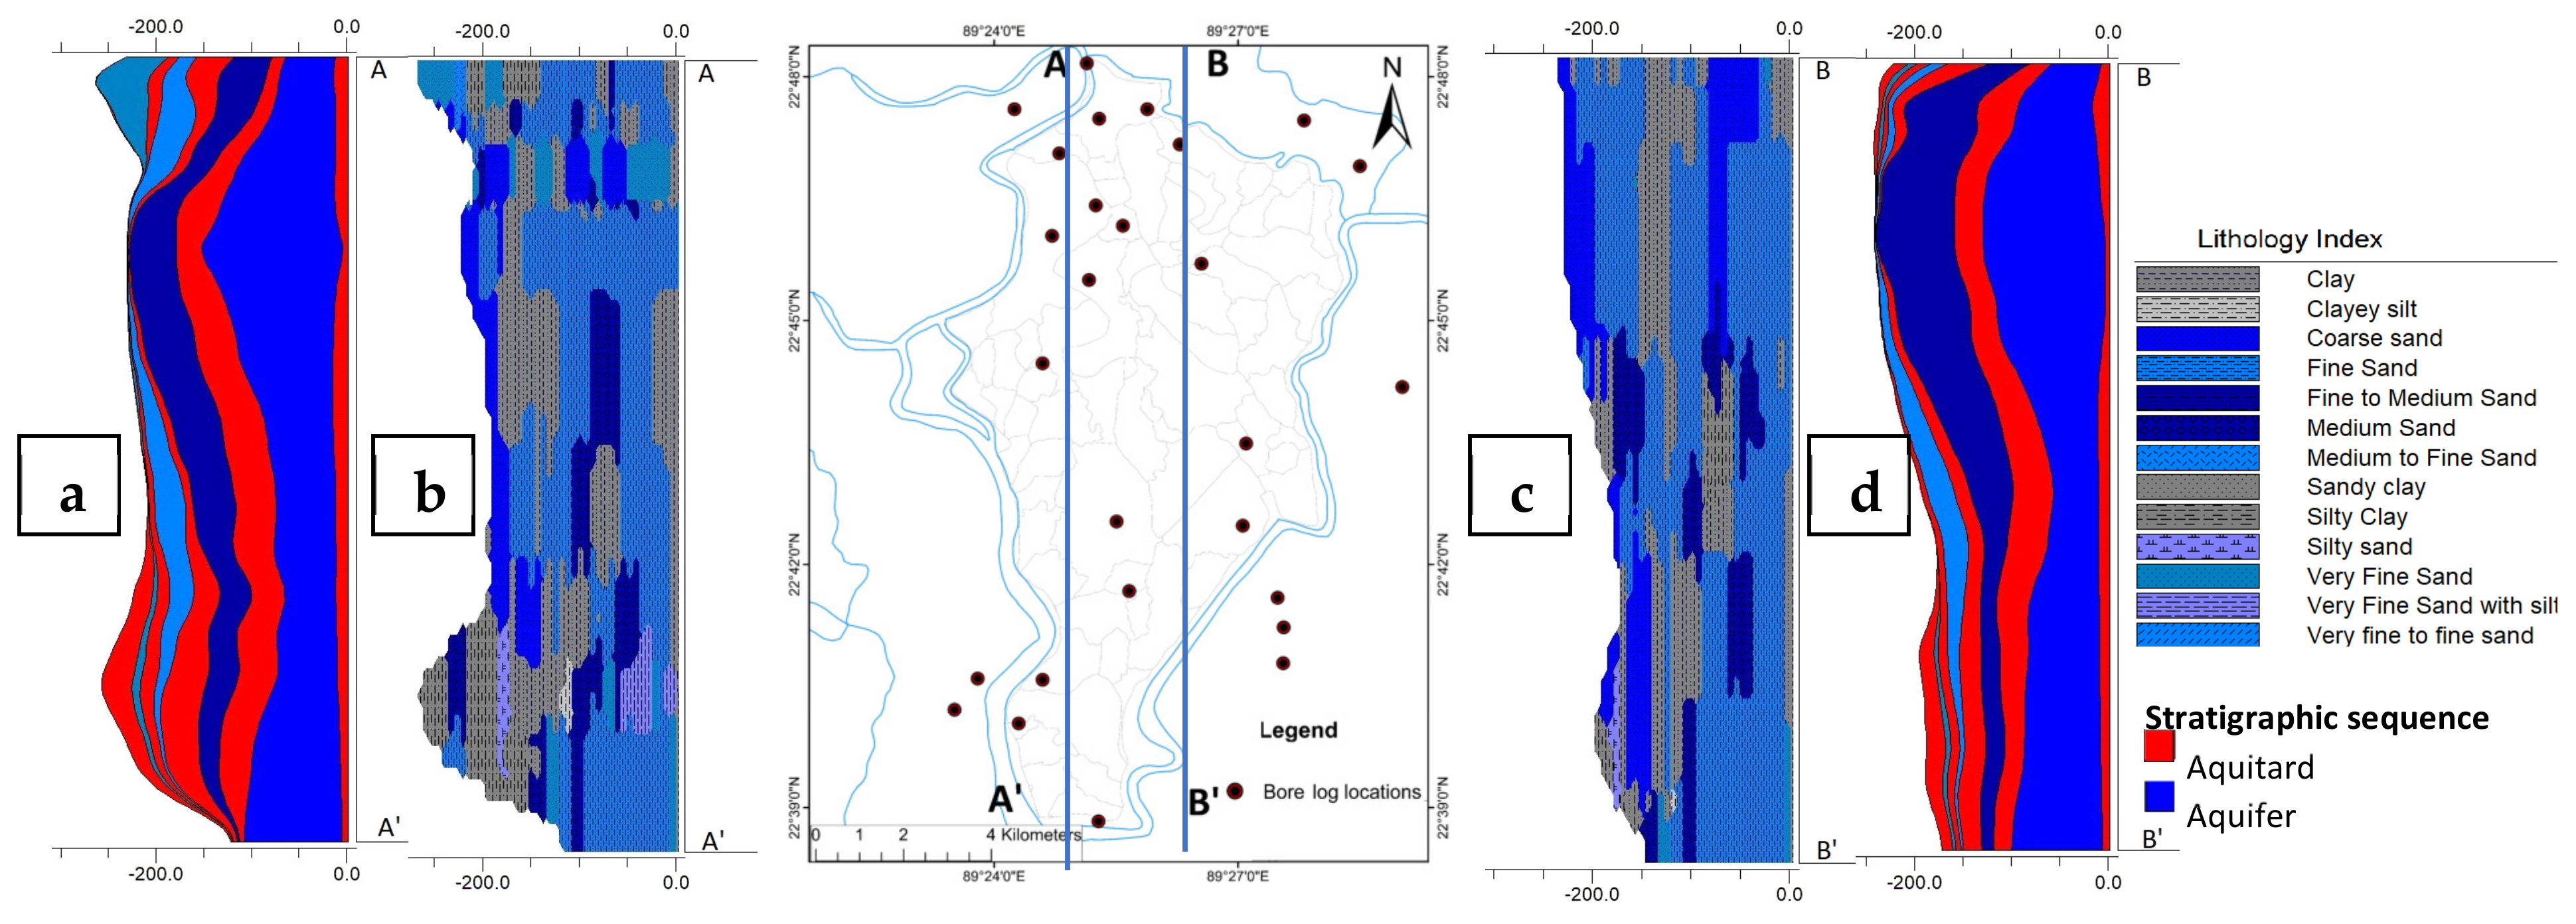
The lithologic analysis based on bore log data in and around Polder 29 exhibited a high degree of hydrogeologic complexity and aquifer heterogeneity. Following the aquifer classification used frequently for the coastal area [
64] as discussed in the previous section, the aquifer system for Polder 29 can be classified as: (i) the shallow, i.e., the first aquifer, below a clay and silt top layer, with a thickness ranging from 50 to 160 m, suggesting a good aquifer if water is of acceptable quality; (ii) the second aquifer, underlain and overlain by silty clay aquitards, with a thickness of about 30–60 m in the north of Polder 29, a thickness, however, that reduces substantially in the south, suggesting that the availability of a suitable second aquifer is severely constrained in this area; and (iii) the deep, i.e., the third aquifer, overlain by silty clay aquitard, of which the delineation is incomplete because of insufficient lithologic information at greater depths (
Figure 5).
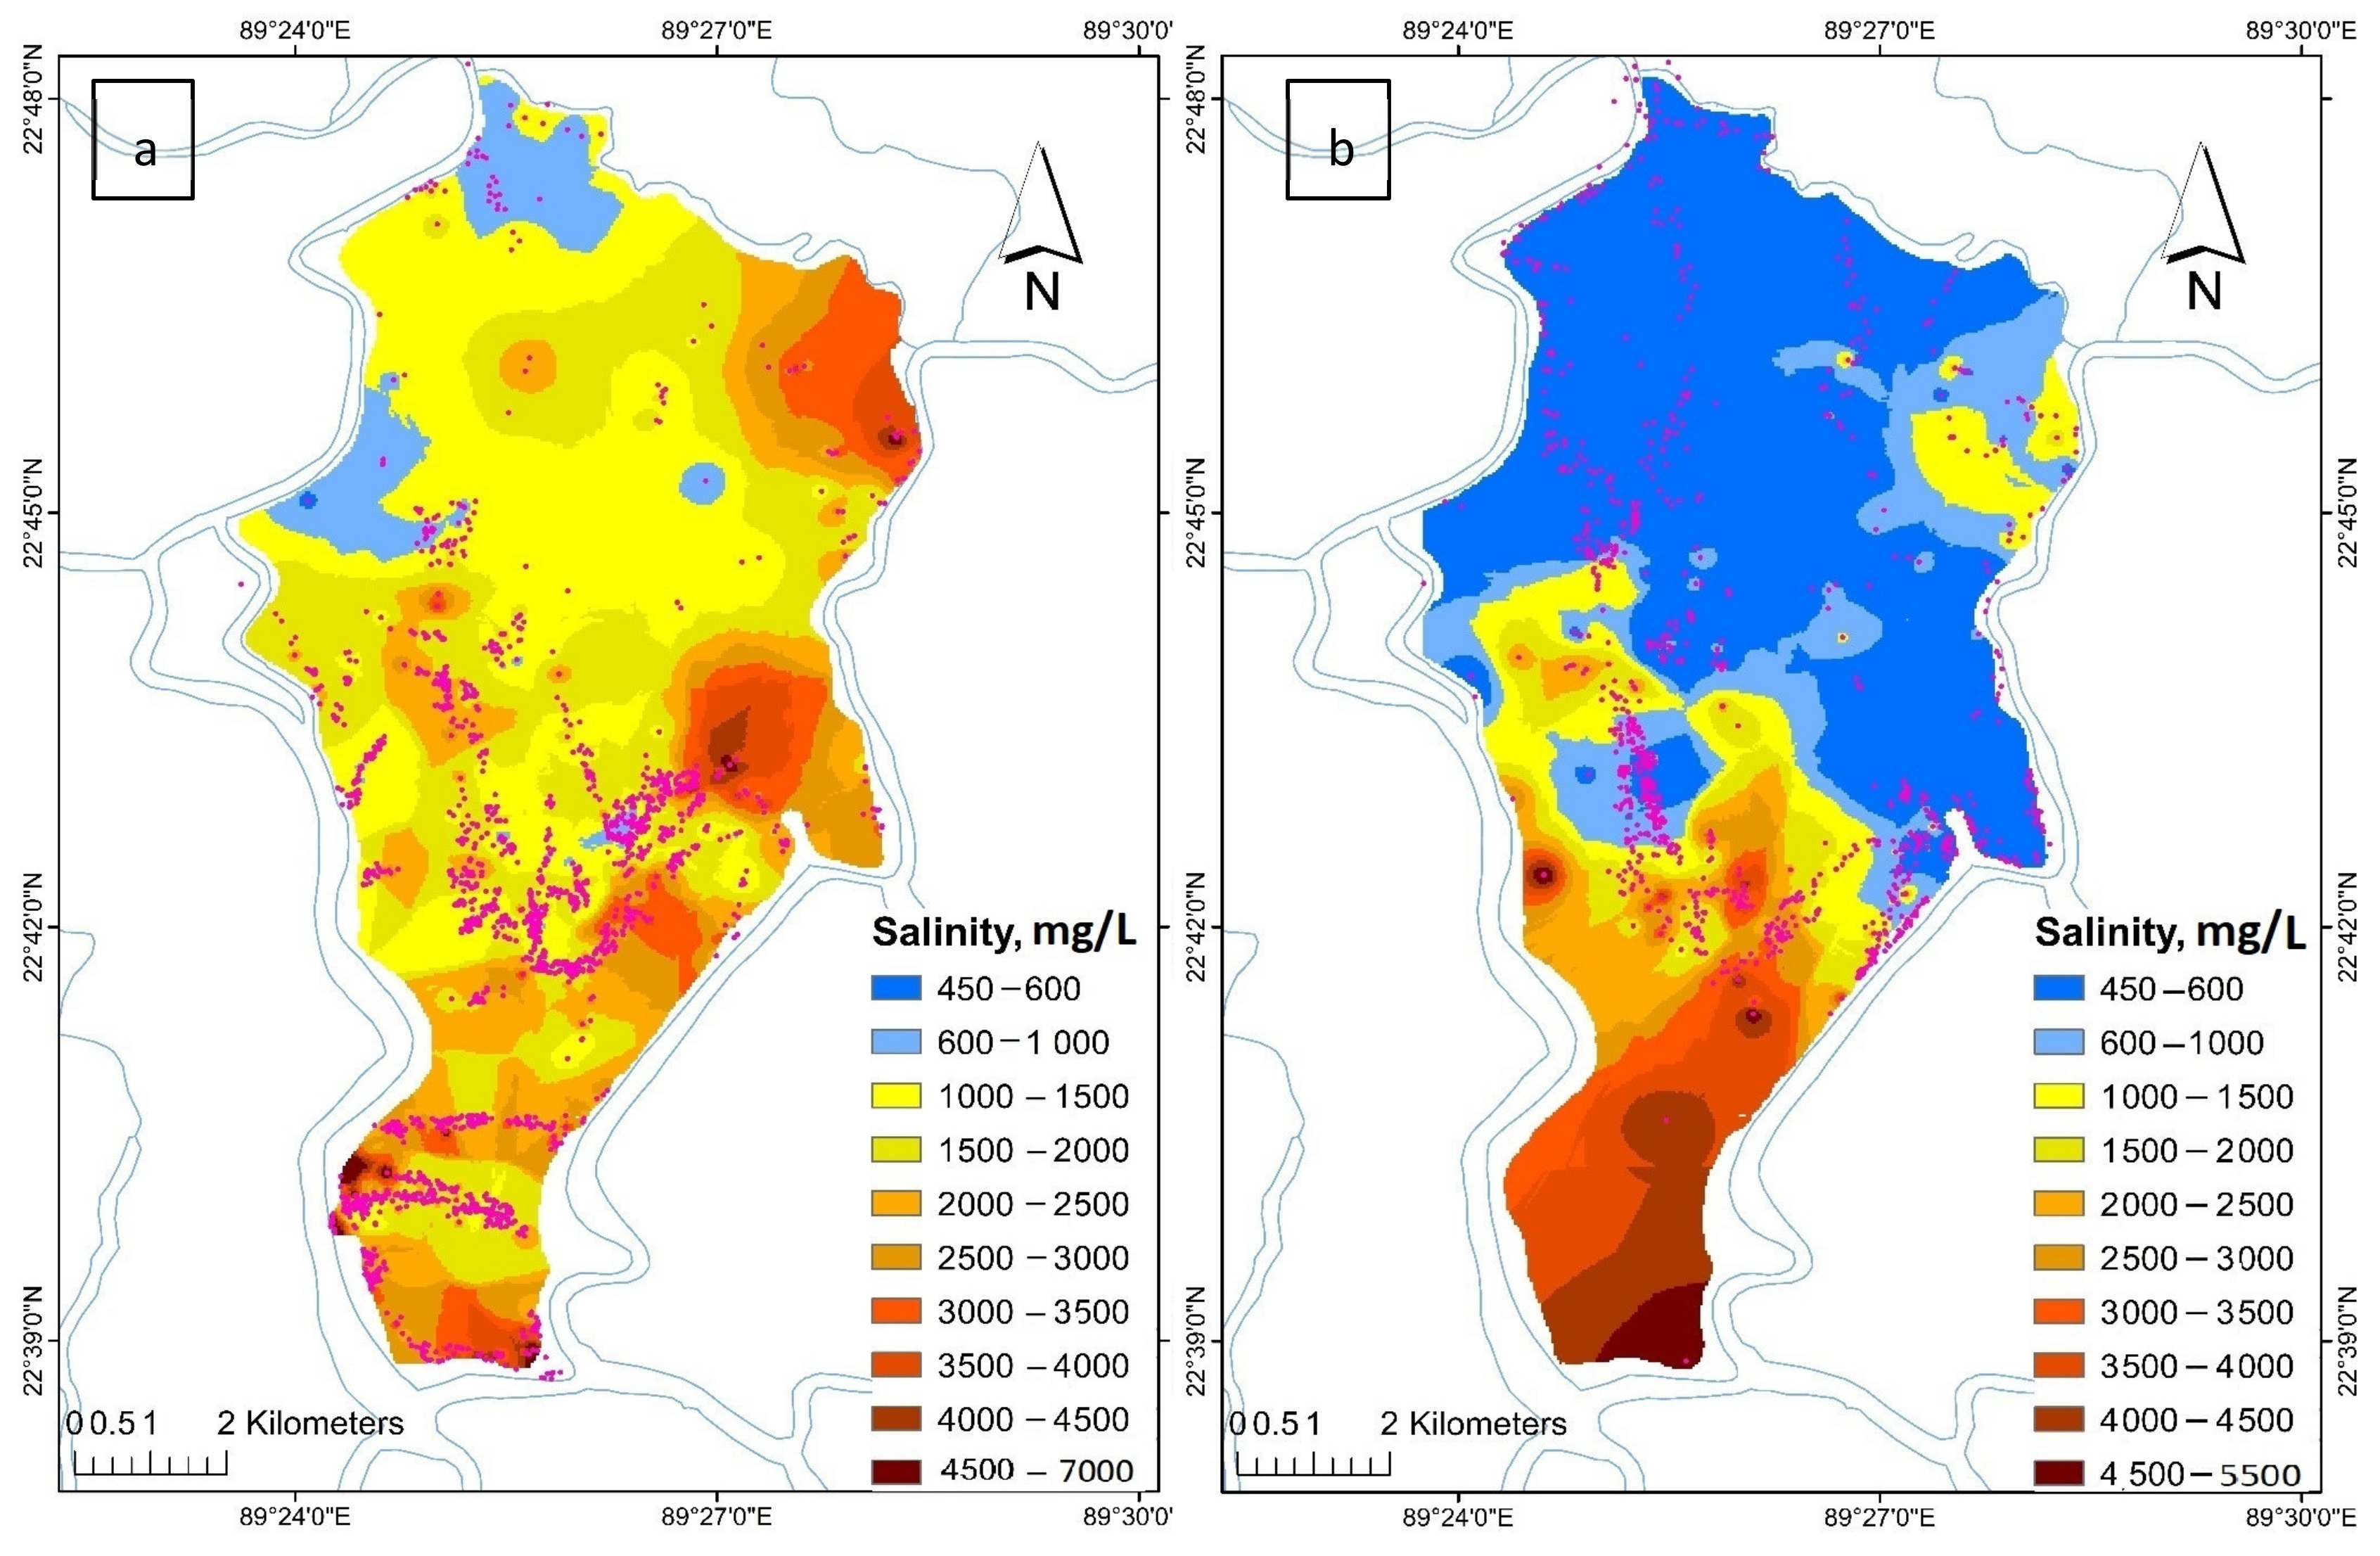
Despite the good aquifer thickness of the shallow aquifer and the deep aquifer in the northern part of the polder, water availability is severely constrained by salinity. Salinity varies widely in both horizontal and vertical directions, which is consistent with the pattern across the entire coastal area [
65]. In general, salinity is lower in the north and gradually increases in the south (
Figure 6). In Bangladesh, the acceptable level of salt (chloride) in groundwater, set by the Ministry of Environment and Forest (MoEF) in the Environment Conservation Rules (1997), for the coastal districts is 1000 mg/L, which is higher than the standard set at 600 mg/L for the rest of the country [
66] and, in particular, higher than the standard set by the World Health organization (WHO) of 250 mg/L [
67]. It can be clearly seen in
Figure 6 that salinity is above the drinking water threshold level in the range of 2000–4500 mg/L in many places, especially in the southern part, as well as in the considerable area in the northern part of the shallow aquifer. In contrast, salinity in the deep aquifer is below the permissible level (<1000 mg/L) in a considerable area in the northern part, while it starts to become substantially high towards the south. This indicates that drinking water with an acceptable salinity level is mostly available in the deep aquifer, while it is sparsely available in the shallow aquifer in the north. In sum, the drinking water supply from groundwater would be severely constrained in the south because of the high salinity level in the shallow aquifer and the absence of suitable second aquifer with adequate thickness and/or an acceptable level of salinity.
Iron content was generally found to be high and variable in both shallow and deep aquifers. The range of values found (up to 13.5 mg/L in shallow aquifer and 6 mg/L in deep aquifer) at sampled tube wells are consistent with the previous national survey conducted in the late 1990s [
41,
55] and a few other studies which focused on specific geographical areas (e.g., [
68,
69,
70]). The national assessment [
41] found iron concentrations up to 25 mg/L, with an average of 3 mg/L (median 1 mg/L) and exceeding Bangladesh standard, in 55% of the cases in the shallow aquifer and in 15% of the cases in the deep aquifer. While there is no toxic limit for iron concentration in drinking water, the WHO has established an aesthetic cutoff of 0.3 mg/L [
71], whereas the Bangladesh standard has been set at 1.0 mg/L. It was clear that some households in the study area drink water with moderate levels of iron concentration (around 5 mg/L). Although high iron in drinking water is not considered a health problem, and the presence of iron in groundwater has been shown to be useful in reducing iron deficiency, especially among rural women [
70,
72], it is usually unacceptable to users at such high concentrations due to its offensive taste, odor, color, corrosion, foaming or staining problems caused by high concentrations of iron.
4.2. Growth of Tube Wells—The Dominant Source of Drinking Water
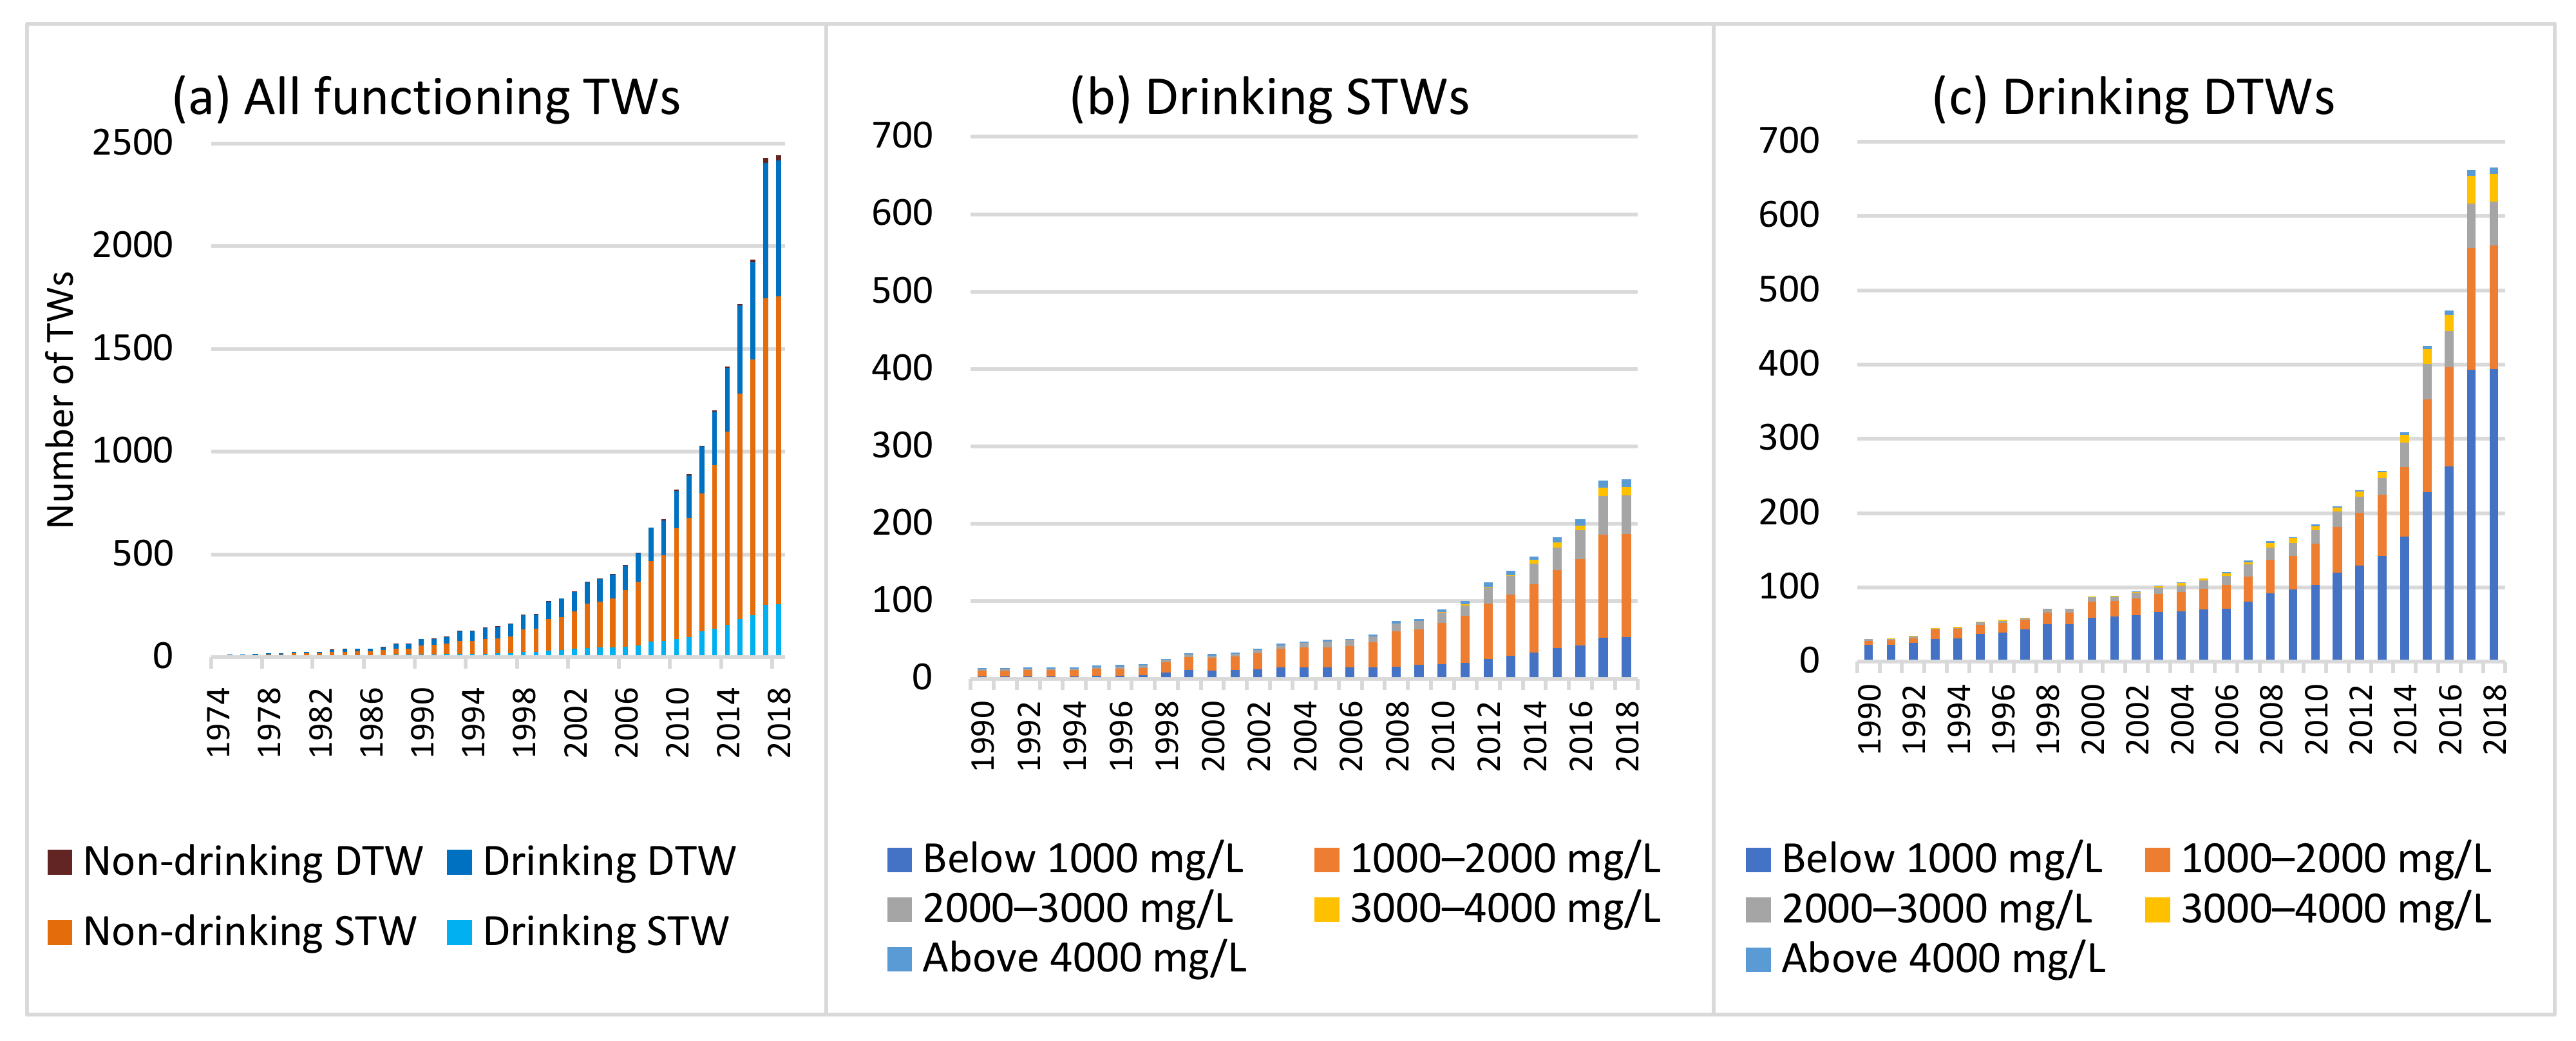
Despite the constraints with salinity (and iron) in groundwater, tube wells have grown exponentially, reflecting a fourfold increase in the last 10 years (from 2008 to 2018) (
Figure 7). Census data show that the population in the surveyed mouzas increased by about 4% from 2001 to 2011 (some mouzas experienced an increase while some experienced a decline), while tube wells increased threefold during the same period. This suggests people’s increasing preference for tube wells for drinking and other uses of water. A total of 362 tube wells, out of a total of 2805 tube wells installed in the last 50 years, became non-functional (i.e., stopped yielding water) after different time periods, for reasons that include tube wells sinking in non-suitable aquifer, maintenance problems not being addressed, as water quality was perceived of not good quality, and decline in groundwater level.
Table 1 presents a summary of the growth of tube wells in terms of distribution between shallow and deep tube wells, the proportion of their use for drinking purposes and the salinity levels associated with different groups of tube wells. The growth of tube wells has been substantially greater for STWs, comprising about 72% of the total 2443 functioning tube wells, while DTWs accounted for 28% of the tube wells. Most of the STWs are sunk between 0 and 200 ft (0–60 m), while DTWs are sunk predominantly between 400 and 600 ft (120–180 m). Only 38% of all functioning tube wells are used for drinking water purposes, of which DTWs have the major share (65% of all drinking tube wells). Out of the total 1750 STWs, only 15% are used for drinking purposes, while 85% are used for domestics uses, including cooking, washing clothes, utensils, bathing, etc. The lower proportion of STW use for drinking purpose indicates people’s negative perception about the quality of water (regarding salinity and high iron content, in particular), while an exponential increase in the number of STWs over the years, even in saline-prone areas, shows a household preference for STWs for domestic uses, even under considerable water quality constraints. In contrast, out of the 689 functioning DTWs, about 96% are used for drinking, which indicates a household preference for DTWs over STWs for drinking purpose, because of their perceived better quality of water. However, DTWs are mostly present in the northern areas with less salinity problems but absent in the hydro-geologically difficult southern areas because of the difficulty in finding suitable layers and the presence of high salinity levels.
4.3. Drinking Water Coverage within Acceptable Salinity Level
Only 38% of all functioning tube wells were used for drinking; however, salinity concentrations in about half of these drinking tube wells exceeded the recommended threshold of 1000 mg/L (
Figure 7). Although deep tube wells were generally perceived to be safe by residents, our results show that nearly two-fifths (41%) of all drinking deep tube wells exceeded the recommended salinity threshold, with the proportion being twice as high (79%) for the shallow tube wells used for drinking. The concentration of these tube wells is higher from the middle to the south of the polder, with most of the shallow drinking tube wells located mainly in the south, while a considerable number of deep drinking tube wells are located in the middle and some in the northern part of the study area. Notably, there is no deep tube well in the extreme south due to absence of a suitable aquifer layer.
The above findings suggest that estimates of coverage, in terms of people per tube well, reveal a flawed picture, as access to improved sources does not necessarily equate to consuming safe water. Although tube wells grew in big numbers, not all tube wells can be considered as a source of safe water supply, and households are at greater risks than the numbers would suggest, and this, furthermore, is in geographical areas which are considered better in national assessments in terms of drinking water supply compared to other more acutely water-stressed areas in coastal Bangladesh.
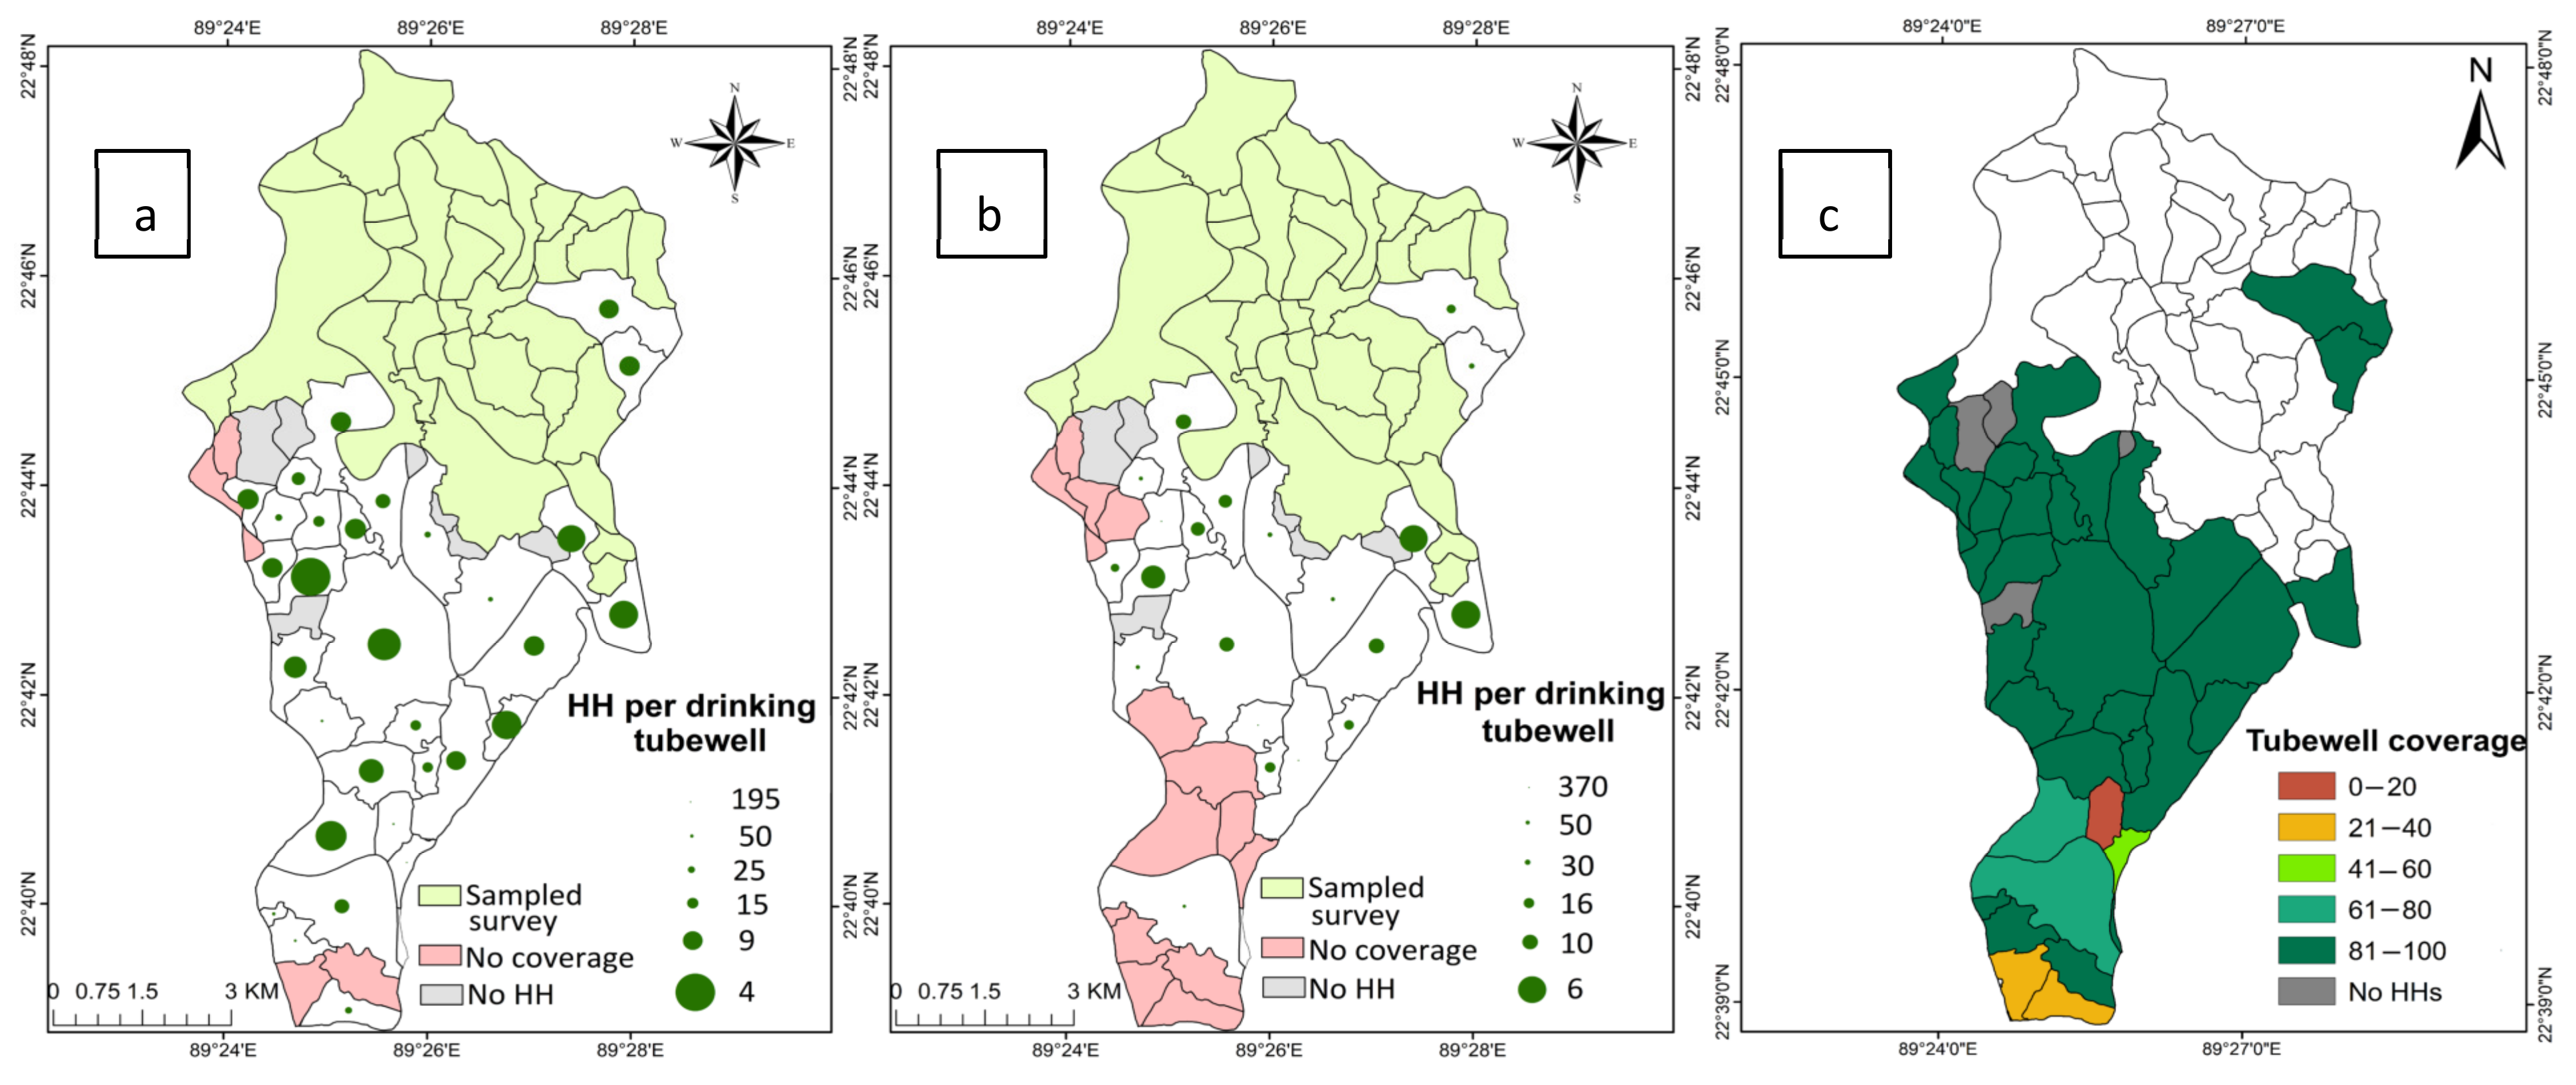
Figure 8 clearly shows that the apparent high drinking water coverage by tube wells (195-25 nos. household per drinking water tube well), without considering the salinity levels, becomes substantially low (370-30 nos. household per drinking water tube well), when salinity constraints are considered, with reduction being particularly very high in hydro-geologically difficult southern parts. This also contrasts sharply with the national assessment based on the census data [
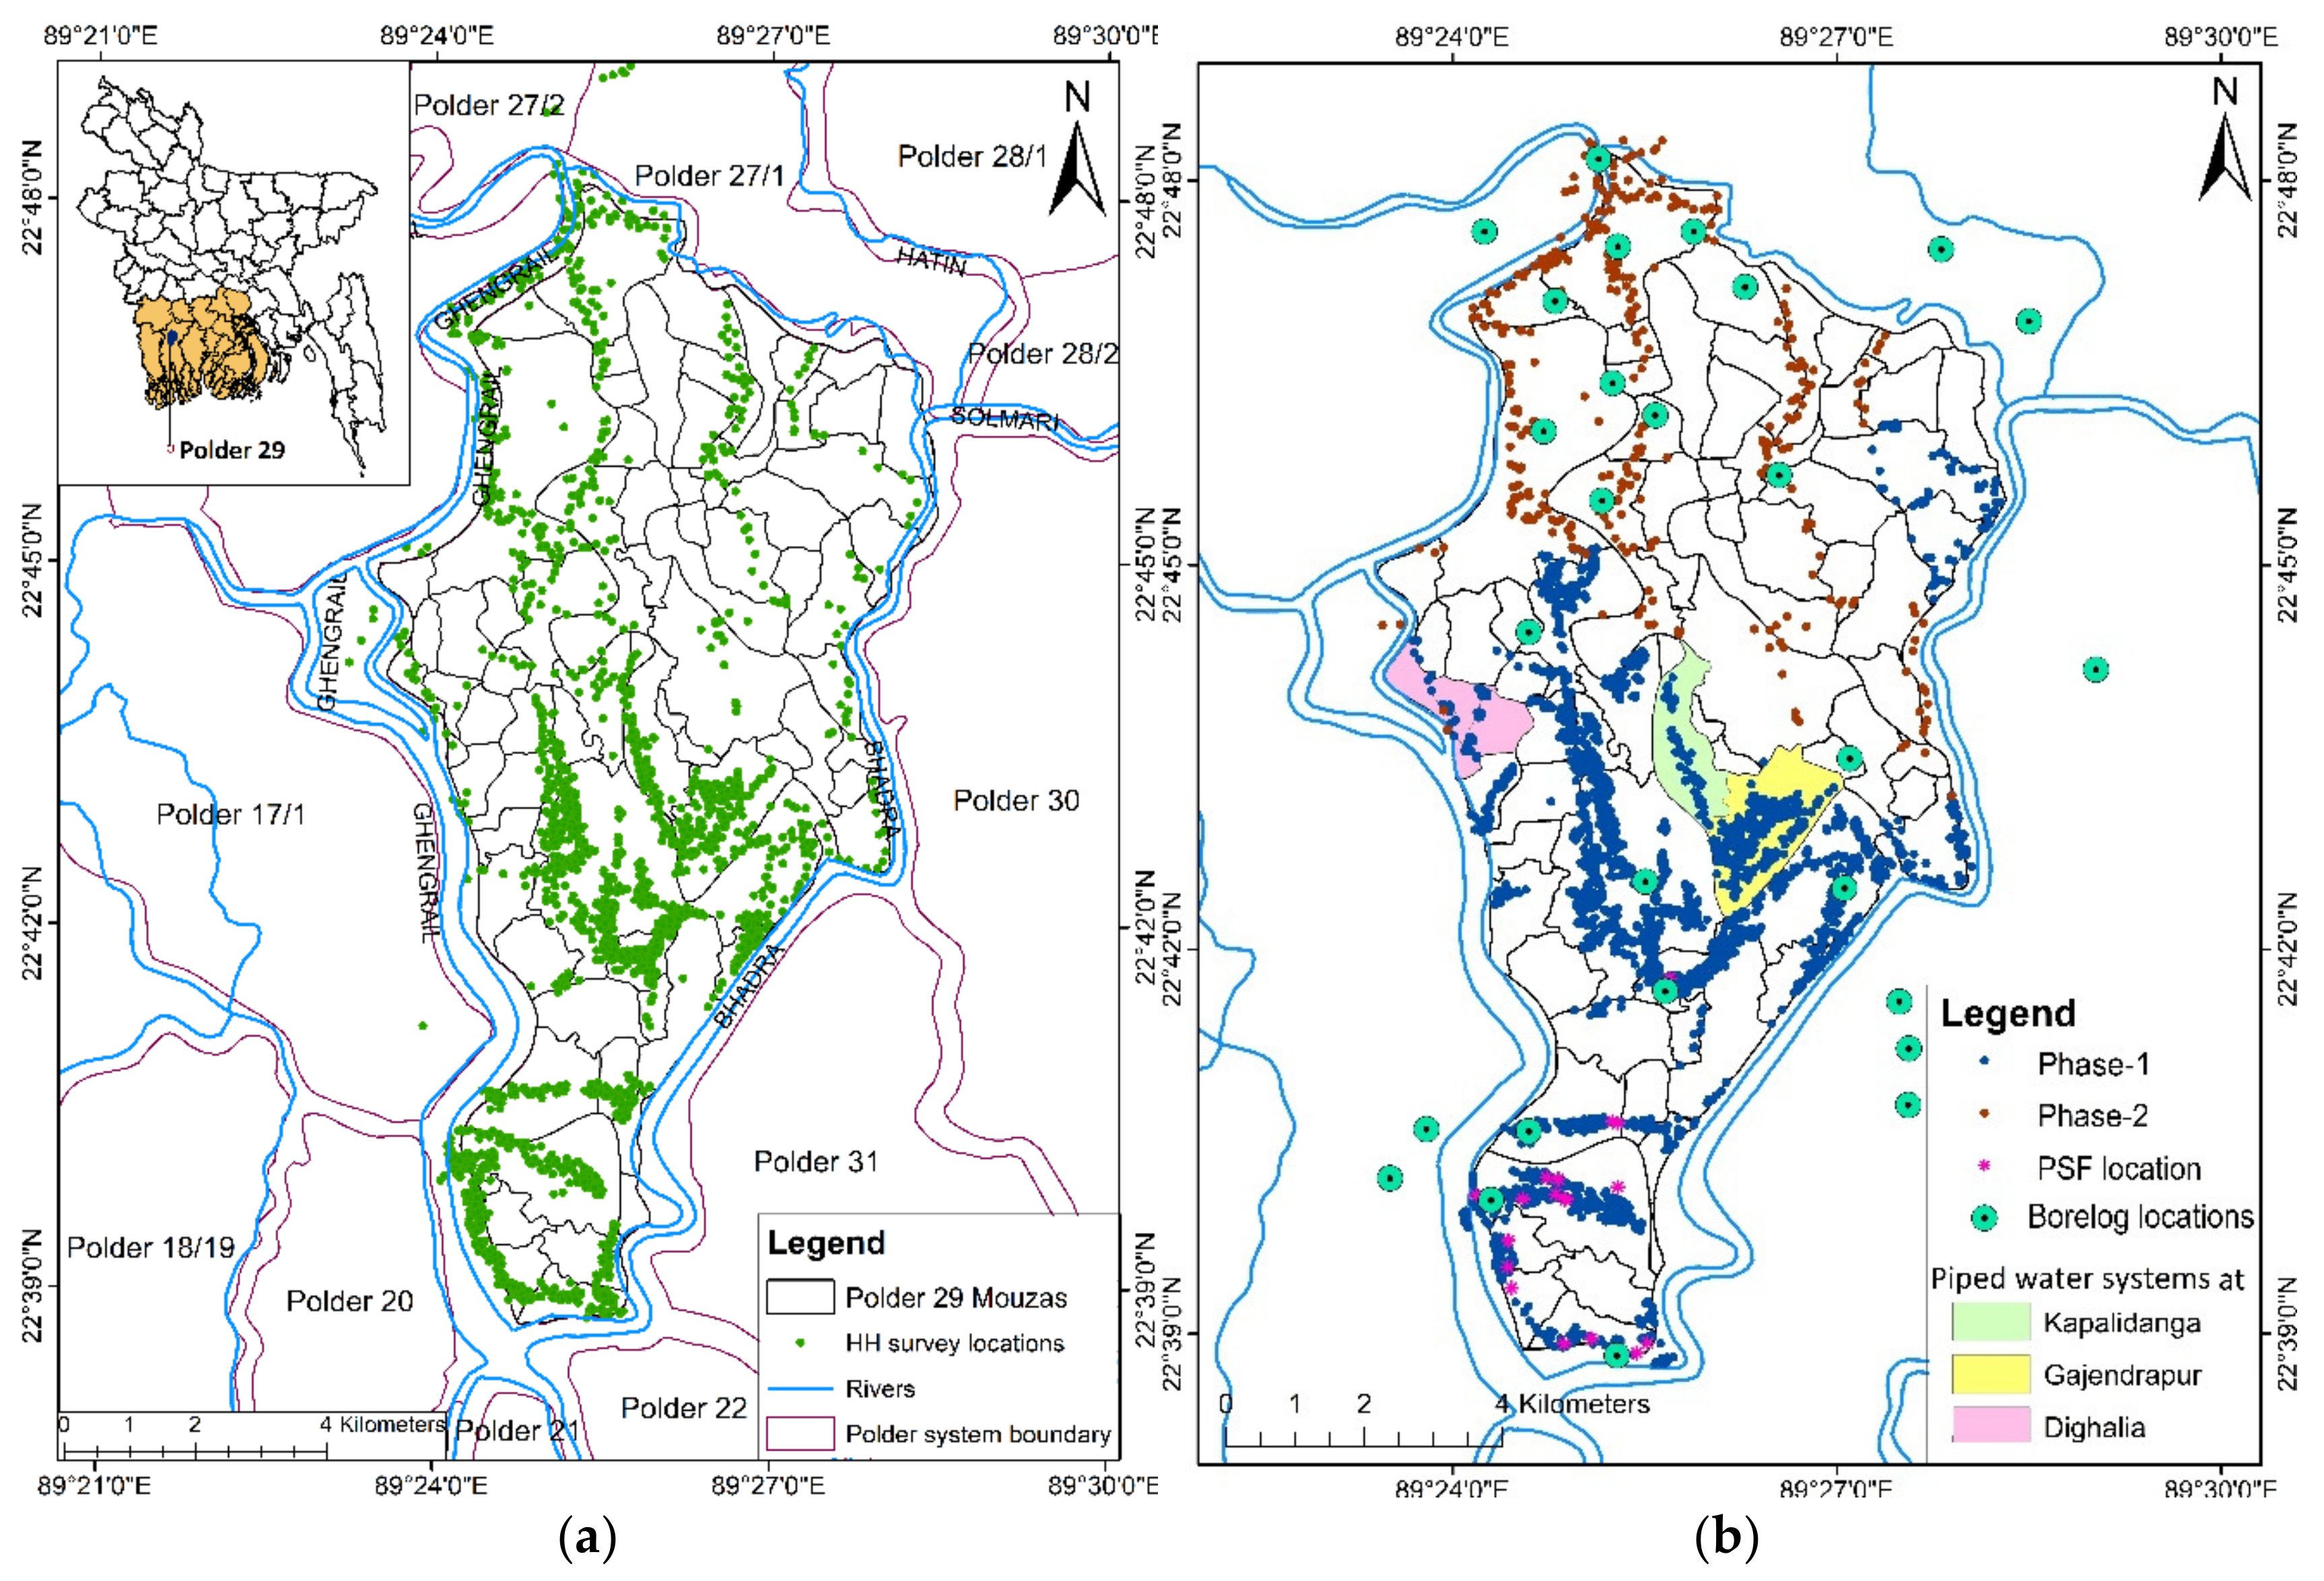
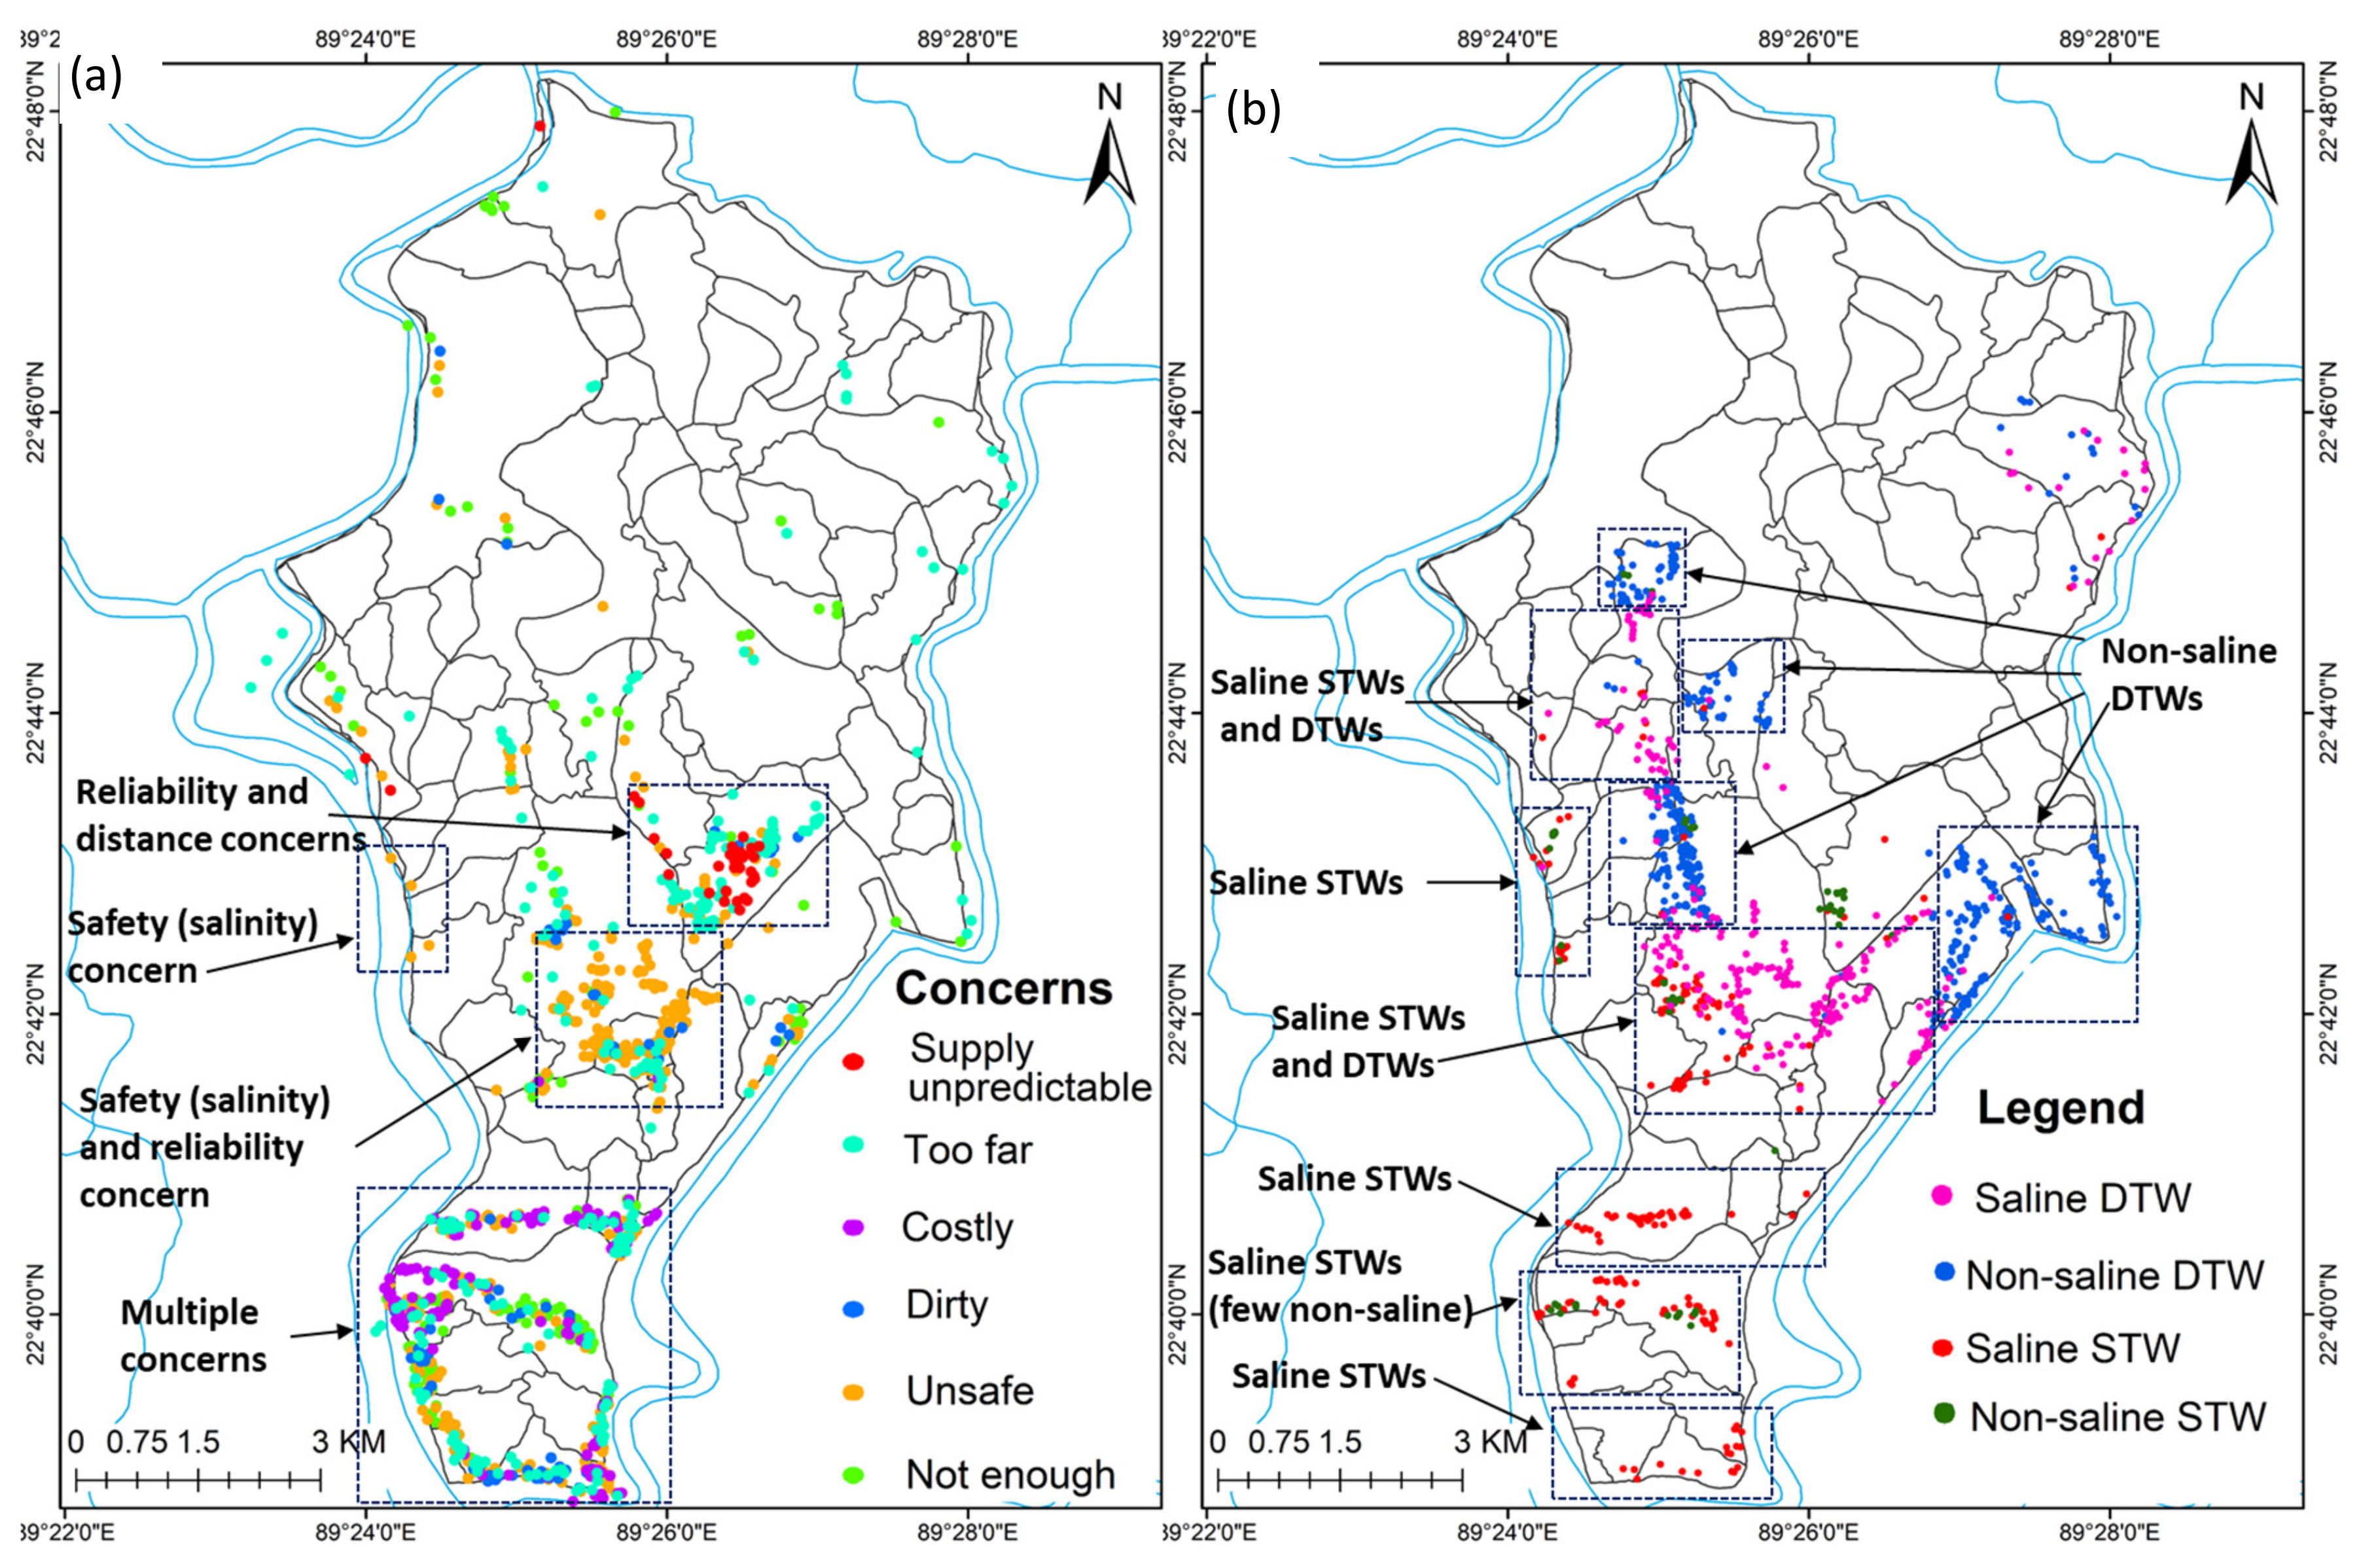
59], which show a high percentage of households under tube well coverage (about 80–100%) in most areas of Polder 29, except pockets of areas in the south, while, in reality, the effective coverage by tube wells with acceptable water quality is much lower in the southern part of the polder. In particular, safe drinking water coverage by tube wells becomes zero in the Bara Aria, Kodla, Ratankhali, Akra, Bahir Akra, Jhaltala and Chandgarh mouzas, and substantially decreases in the Sundarmahal, Kalikapur, Sarafpur and Keakhali mouzas. Three mouzas (Gajendrapur, Kapalidanga and Dighalia) in the middle of the polder are shown to have low coverage by tube wells, which have piped water distribution systems to supply water to the communities via a number of standpipes placed at selected locations (
Figure 3b). However, there are concerns with these systems as well, as discussed in the next section.
About one in five functional tube wells are community-owned and used by more than one household. These community tube wells were mainly installed by the local government (Union Parishad), with some funded by UNICEF, DPHE and non-government organizations. Not all these public tube wells conform to the tolerable limit of salinity concentration; about 50% (179 out of 358 nos.) of the public DTWs and 81% (30 out of 37 nos.) of the public STWs were found to be yielding water with salinity above 1000 mg/L. However, 18 public DTWs, which are in the Kalikapur, Sarafpur and Gajendrapur mouzas, and for which the measured salinity levels were well within the acceptable limit, attract people from outside the village to fetch water, with the maximum distance traveled by people from Bara Aria mouza reported as 20 km.
4.4. Household Concerns for Drinking Water with Different Sources
As discussed earlier, although tube wells have been the dominant sources of drinking water, the local people had to resort to alternative sources in the south because of hydrogeologic constraints (
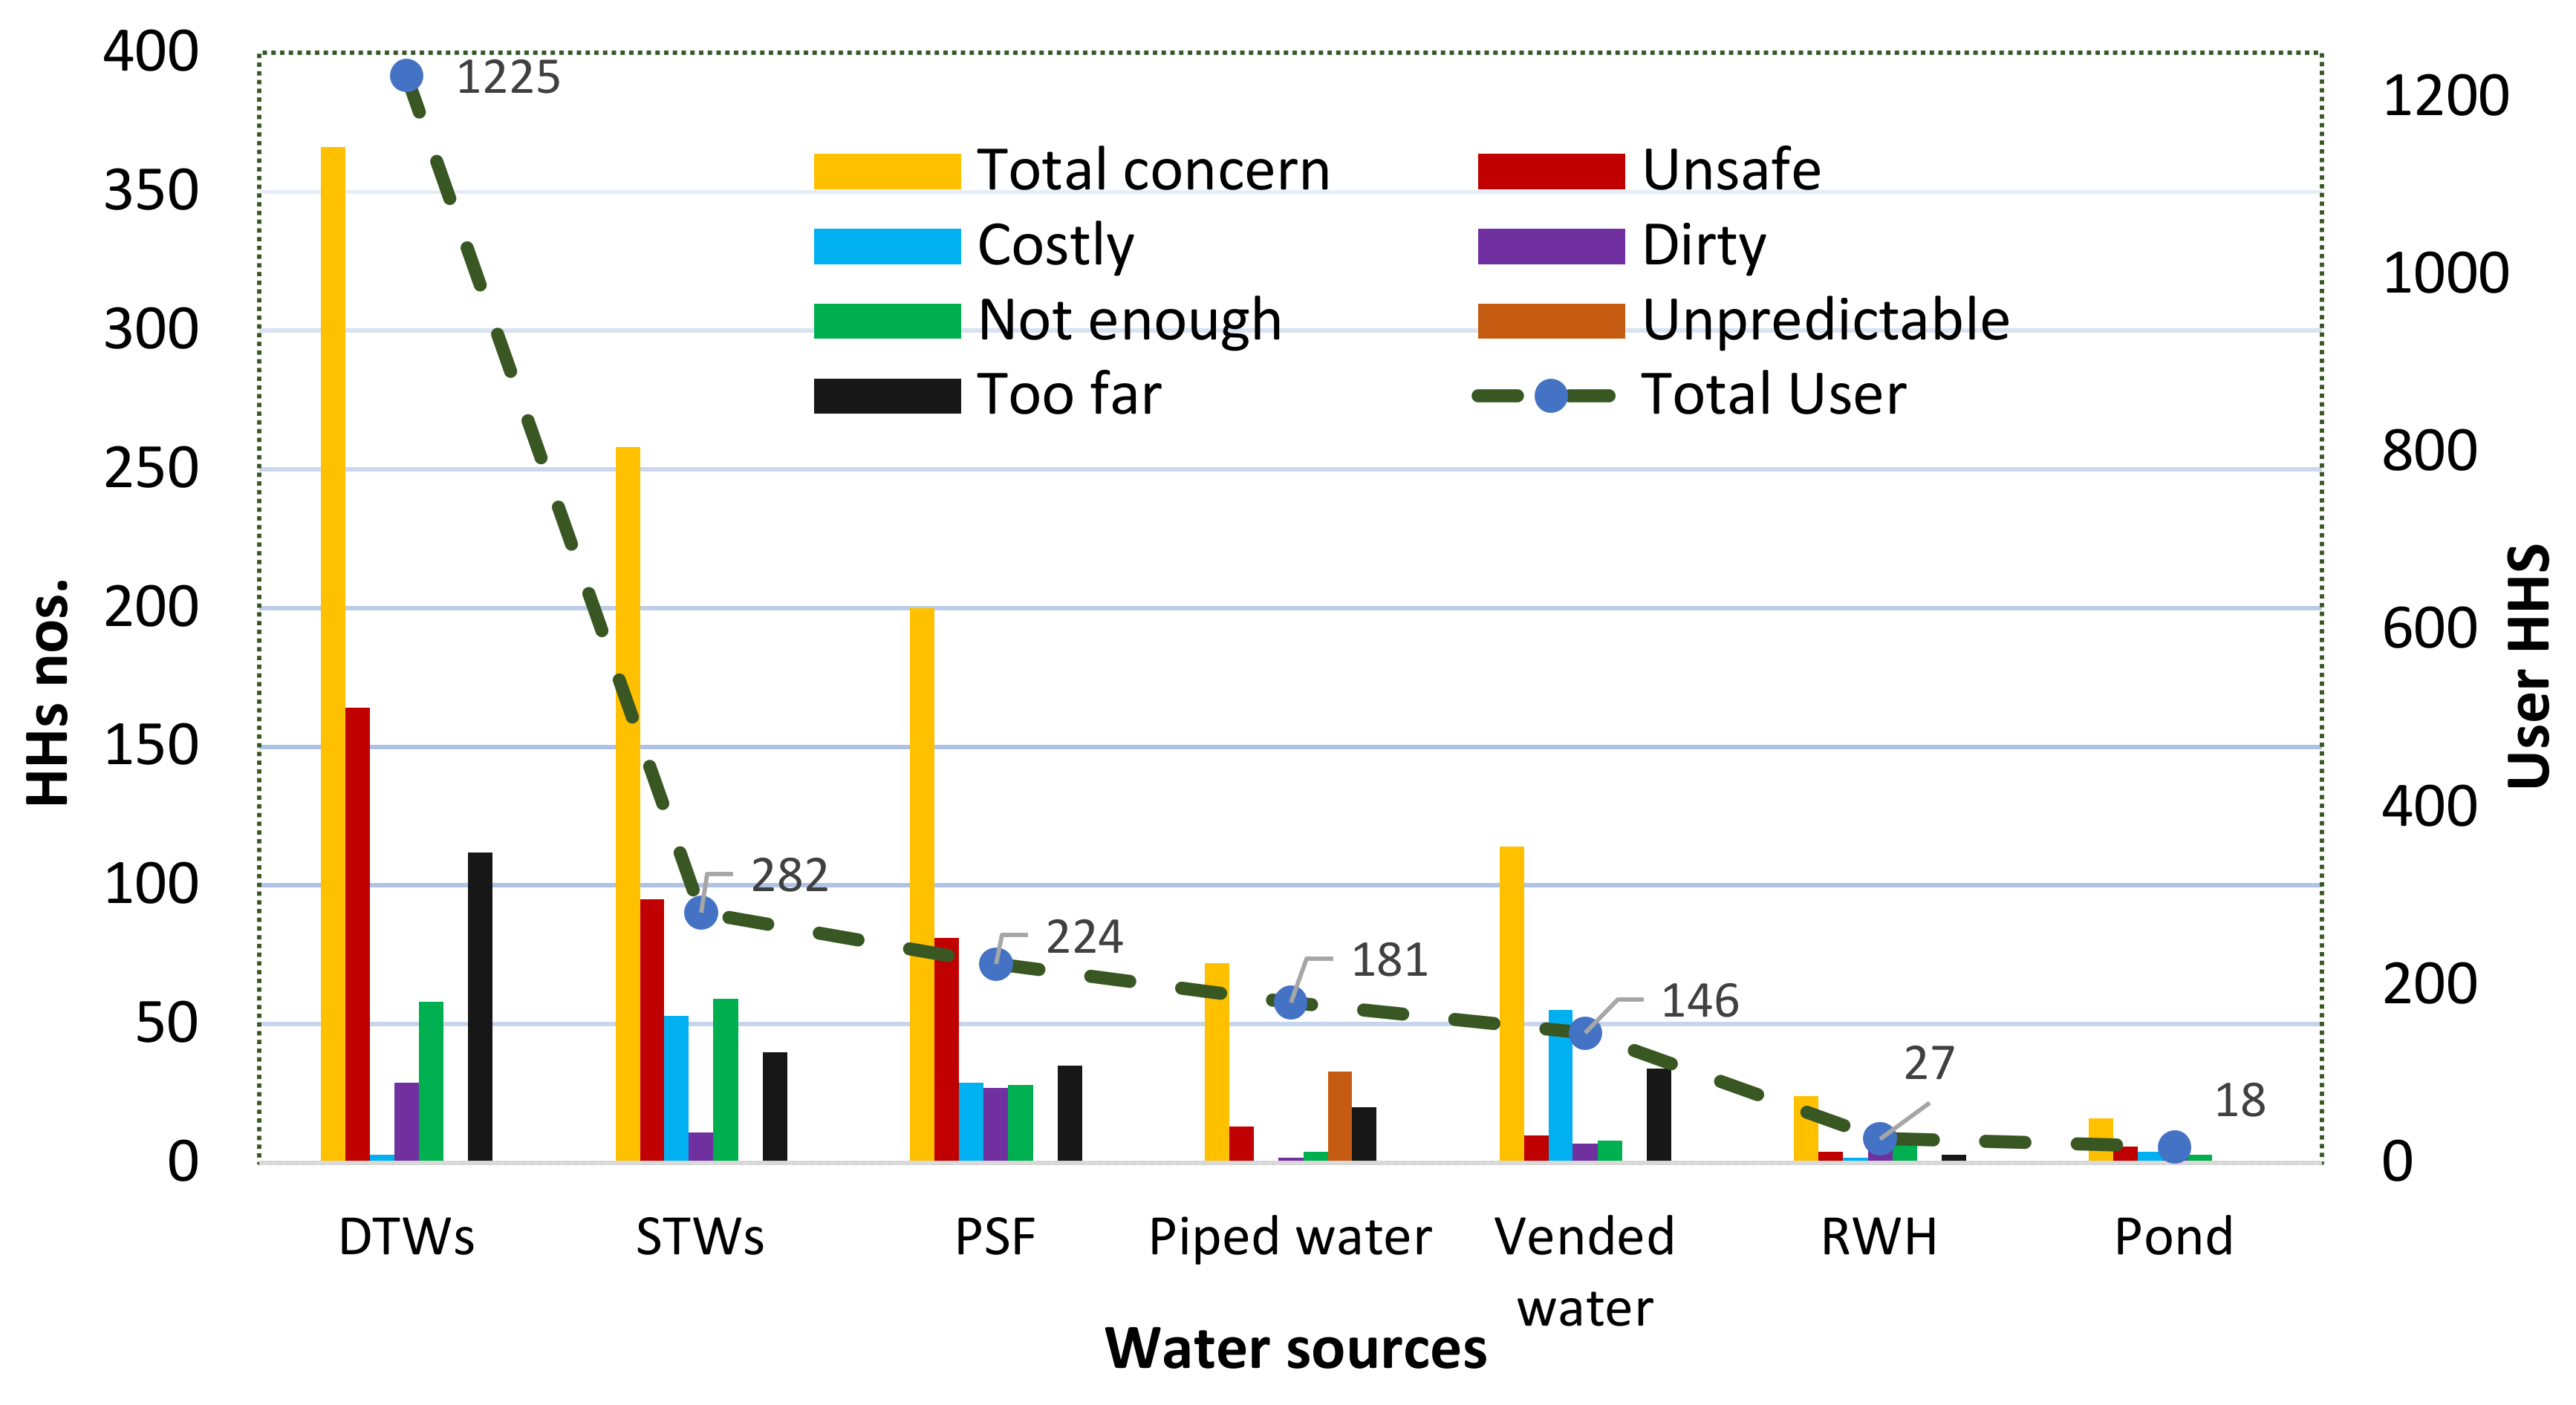
Figure 4). Three piped water distribution systems exist in Polder 29: one in the Dighalia mouza in Sahas Union, one in the Kapalidanga mouza and another in the Gajendrapur mouza in Sarafpur Union. PSF is the main water source for some households, mainly in the south (e.g., Bara Aria, Sundarmahal, Shambhunagar and Kodla mouzas). Vended water is an alternative source for some people in the southern mouzas. People buy water, by paying a certain amount of money, from informal water vendors. Rainwater harvesting is another option used by households for safe drinking water in stressed areas. However, the household survey revealed considerable concerns with different sources of drinking water, encompassing different dimensions of water insecurity, as illustrated in
Figure 9 and
Figure 10. The concerns are substantially linked with the spatial inequality of groundwater risks, resulting from the unavailability of water of acceptable quality.
People drinking water from shallow and deep tube wells expressed concerns mostly about the quality of the water, which is predominantly related to the high salinity level in the water, and partly to high iron content. Their concerns are corroborated by the field measurements of water quality, which, indeed, showed drinking water salinity levels above the acceptable limit. About 30% of the DTW users expressed concerns, the main ones being regarding the safety of water and the distance to the source. As can be seen in
Figure 6 and
Figure 10, DTWs extract saline water in the middle and the lower half of the polder, especially in the Kalikapur, Sarafpur and Gajendrapur mouzas. Distance was also mentioned as a major concern by many of the DTW users, the majority of whom travel long distances to fetch water from the 18 public DTWs located in the Kalikapur, Sarafpur and Gajendrapur mouzas. A considerable proportion of these DTW users live in the water-stressed southern mouzas, with travel distances as high as 20 km.
Reliability and distance to standpipes were reported as main concerns in areas where people are dependent upon groundwater-based piped water distribution systems (
Figure 10a). The absence of a good aquifer layer with an acceptable quality led to exploration and implementation of tube wells at convenient locations, feeding water via piped distribution systems in the Dighalia, Kapalidanga and Gajendrapur mouzas. At Gajendrapur, FGDs with local communities revealed that water is available only at a certain time of the day for a few (1–2) hours, and there is also the issue of less water supply at the tail-ends of the water network. This suggests that people do not obtain enough water, resulting in long queues for collecting water from the standpipes. Furthermore, not all people of the Gajendrapur mouza use this system, especially the households that have private water supply systems. The households near the pump house collect water from the twin tube wells (Gajendrapur ‘Jorakal’), which were the major source of water prior to the implementation of the piped distribution system. These two wells still serve as useful sources for many households, with people traveling as far as 20 km from Sundarmahal and Bara Aria Mauzas in the south. Unpredictability in the water supply and the distance to standpipes are also concerns of the Kapalidanga piped water system, resulting from a lack of maintenance and repair of the standpipes, and the reduced pressured head due to the improper alignment of pipe network. In the Dighalia piped water system, concerns related to water are lessened due to the lesser density of households, although some households reported unpredictability in the supply and an inadequate water volume.
While household concerns were generally found in the lower half of the polder, multiple concerns of a serious nature were reported in the hydro-geologically difficult southern areas of the polder, as can be clearly seen in
Figure 10a, especially in the Bara Aria, Sundarmahal and Bahir Akra mouzas. Most of the STW users who reported safety concerns are in these areas. These households are compelled to drink water above the salinity standard from STWs because of a lack of other suitable and affordable options. PSF is the main water source for some households in the same mouzas, the major concern expressed by whom was ‘safety’, i.e., quality of water. The PSF survey revealed that 11 PSFs are active out of 19 PSFs in the surveyed mouzas, with inadequate maintenance appearing to be the most important reason for non-functionality of the other PSFs. The regular maintenance and cleaning of the filter material, and well-coordinated and active committees for that matter, are of utmost importance for PSFs to function properly. Vended water users constitute a fairly high proportion of households in the same areas, with the high cost of water being their major concern. Rainwater harvesters constitute a relatively small proportion of households in the south, with volume of water being their major concern. Regarding the constraints of water reservoirs, people cannot use this option other than during monsoon season. Pond water was also reported to be used for drinking, albeit in small quantities. The contamination of pond water makes this option not very feasible for the users.
4.5. SDG Implications for Drinking Water
From the results and discussions presented above, it is clear that spatial inequalities in groundwater quality risks have had considerable impacts on the different SDG 6.1-relevant parameters, including safety, access, affordability and reliability, associated with different drinking water services in Polder 29.
As already discussed in the previous section, in almost 50% of the drinking tube wells in the 35 mouzas surveyed under Phase I, water is safe in terms of permissible salinity level (within 1000 mg/L), while about 50% of the tube wells being used for drinking purpose have salinity above the acceptable limit. About 21% of households surveyed in the same 35 mouzas expressed their concern with the safety of the water. Tube well and PSF users had the major share of safety concerns, corresponding to 14.5% and 4.5% of households. This clearly shows that, while some households drink water of unacceptable quality unknowingly, others are forced to drink unsafe water.
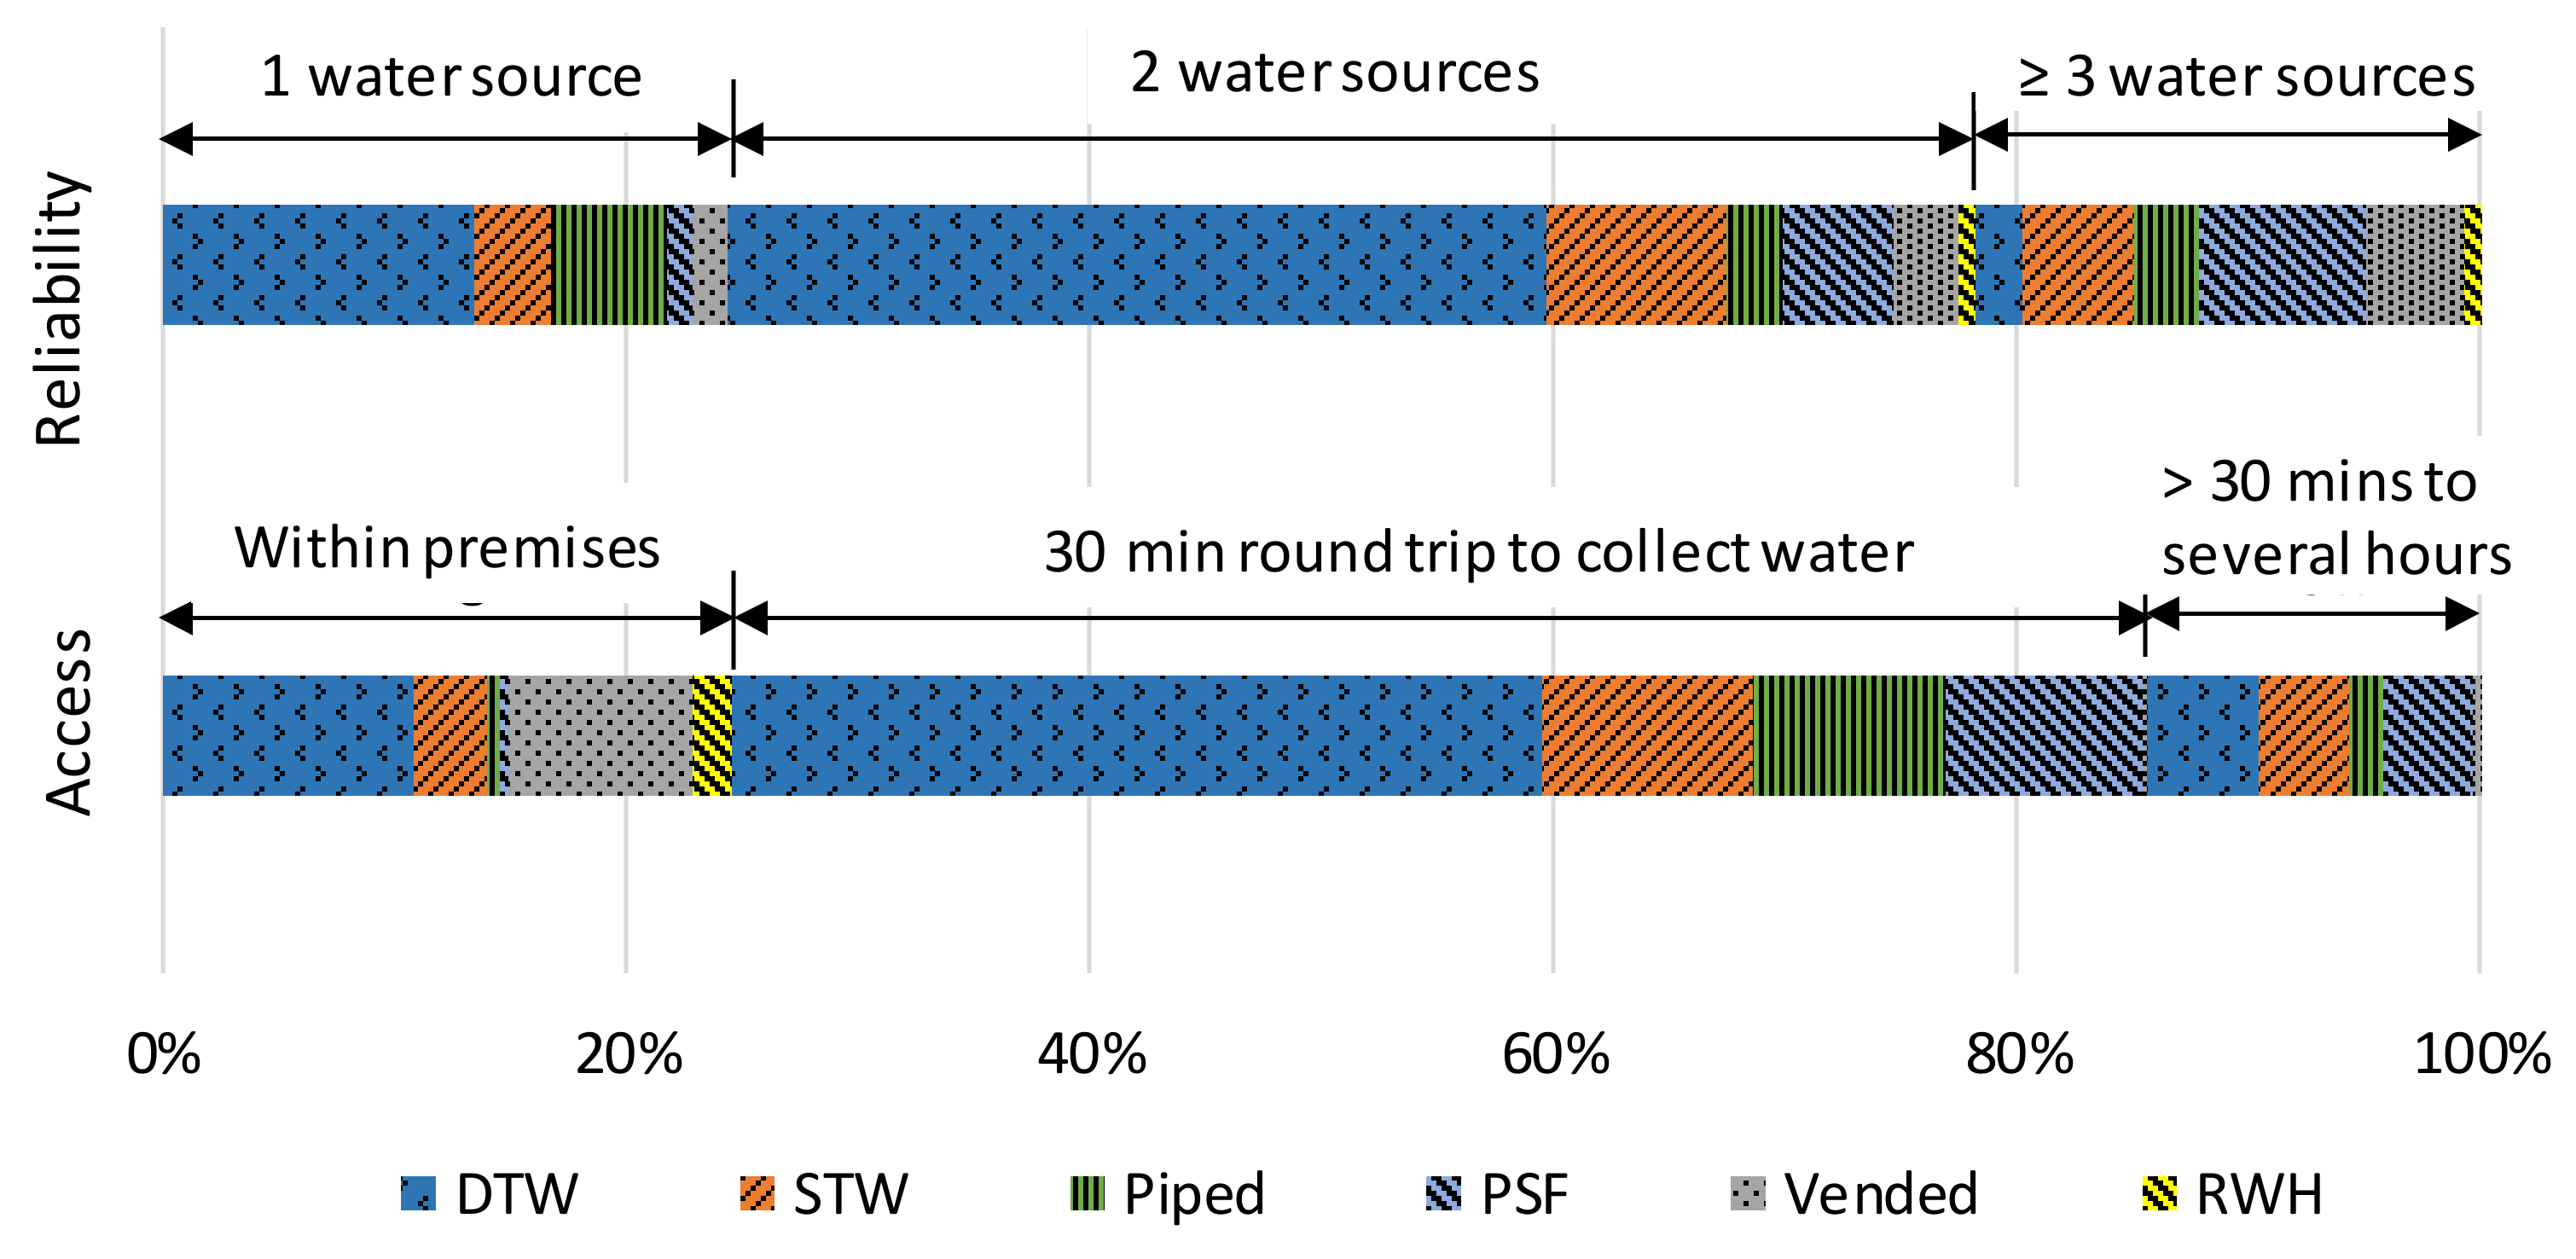
Based on the household survey data in areas coinciding with those covered in Phase I of the water audit,
Figure 11 illustrates the proportion of users with different types of technology as their first choice, having different levels of access to sources with different levels of reliability. About 25% of households have high access, i.e., water sources are within their household premises, while 60% need a collection time of 15–30 min (round trip) and 15% households need from 30 min to several hours to collect water from the source. While some DTW and STW users, and users of most vended water systems, are found to have access in alignment with the criteria (source available within their premises) of ‘safely managed water drinking water services’, the issue of ‘limited’ service (collection time of 30 min or more) is also principally associated with DTWS and STWs, together with PSFs. As far as the reliability of water availability is concerned, only 24% households use one source of drinking water throughout the year, while households who use two, three or more than three sources comprise 76% of the total surveyed households (
Figure 11). Households from the middle to the south of the polder fall in this category.
Tube wells, the predominant water source, have the greatest contribution to the medium and low categories for both accessibility and reliability issues. Households using DTWs and STWs have to spend from 30 min to several hours collecting water (round trip), while these options also represent medium to low reliability, as the user households use two, three or more than three sources in a year. Though the piped water user households have high reliability, they have medium to low access to this source. Similarly, PSF users have a greater contribution to medium and low access and reliability. Vended water and rainwater, on the other hand, contribute significantly to high access, but these sources are more in the medium to low category in terms of reliability. While the affordability aspect is not thoroughly examined in this paper, the proportion of ‘low’ affordability was found to be less. People do not need to pay beyond their means in most cases, and the money is used mostly for the maintenance of the water supply systems. Affordability concerns are mostly concentrated to the vended water supply service, which is received by many households situated in the southern, hydro-geologically difficult areas. Nevertheless, this issue may come to the forefront in the case of higher-level services, such as vended water supply and desalination plants, introduced at a larger scale in hard-to-reach areas where lower-level services, such as tube wells, are limited.
5. Conclusions
In southwest coastal Bangladesh, the heterogeneity of hydrogeologic properties and groundwater quality (salinity and arsenic) are often highly variable over space, which contributes to high levels of spatial inequalities regarding groundwater security risks. Groundwater being the principal source of drinking water in this zone, this is a major determinant in safely managed drinking water services according to SDG 6.1. Despite the physical constraints, tube wells grew exponentially, clearly exhibiting people’s increasing preference for this technology, which is cheaper and usually requires less maintenance. This tube well growth, with private tube wells having outgrown the public tube wells, suggests that private investments in tube wells have considerably contributed to the MDG achievement in Bangladesh. However, while high coverage suffices for the MDG targets, the study shows that the effective coverage, as per the definition of ‘safely managed drinking water services’, is substantially low and hence has considerable implications for the SDG 6.1 targets.
Salinity in groundwater is the more dominant water quality parameter in the southernmost districts of the southwest coastal zone but has received less emphasis as a water quality constraint than arsenic and fecal contamination, and has not, so far, been considered in UNICEF’s Multiple Indicator Cluster Survey (MICS) programme in Bangladesh and, hence, is not reflected in national assessments. Our investigation clearly reveals that, in the southwest coastal area of Bangladesh, the exponential growth of groundwater-based technologies, such as tube wells, considered as ‘improved source of water’, in complex hydrogeologic settings, with high spatial variability of groundwater salinity risks and without any monitoring of salinity, do not necessarily indicate the extent of safe drinking water supply. Drinking water coverage by ‘improved sources’, as reported in national assessments, does not capture the local variation and fails to capture the realities, as the presence of salinity in tube wells used for drinking purposes substantially lowers the effective coverage. The study clearly showed that, in many places, people are unknowingly drinking saline water, while, in other areas, they are forced to do so because of hydrogeologic constraints and a lack of alternative options. The fact that the majority of the drinking tube wells are privately owned, and that about half of the drinking tube wells, including many installed via public investments, contain higher levels of salinity, reinforces the need for improved hydrogeologic delineation and the systematic monitoring and management of groundwater salinity risks, in addition to risks due to arsenic and bacteriological contamination, in order to deliver the SDG. This is also necessitated by the fact that there are considerable concerns in relation to other SDG-relevant dimensions, such as accessibility and reliability, with different sources of water, even including tube wells. Considering salinity and developing properly designed monitoring system aligns well with the government’s plan of ‘ensuring safe water facilities in the hydro-geologically difficult and problematic areas’ and the fact that the global indicator, the ‘proportion of population using safely managed drinking water services’, has been chosen as the indicator for SDG 6.1 (GED, 2016). Hydrogeologic heterogeneity and spatial variation in the levels of groundwater quality parameters in the southernmost coastal zone will determine the nature and scale of infrastructures and investments.
While there are risks in advancing drinking water security without adequate knowledge of hydrogeologic heterogeneity, and without monitoring of salinity, the latter is difficult due to a lack of regulation and management around the installation of private tube wells. Improved hydrogeologic investigation, a priori for the government’s plan to expand the groundwater-based drinking water supply service, including increasing the number of water points and the piped water distribution systems, may allow the sinking of more tube wells and an increased safe (in terms of permissible salinity level) water coverage, and may reduce the number of multiple-source users. At the same time, given the hydrogeologic complexities and salinity constraints, as illustrated in this study, it is unlikely that a single source would solve the drinking water concerns as per the SDG targets. With no suitable aquifer layers available, or good aquifer layers rendered not usable because of high salinity constraints, a portfolio of options, specific to different sites and contexts, will be required to meet the demand of safe, accessible and affordable drinking water demand round the year.
In sum, transitioning from the MDG to the SDG will require greater attention to the SDG-relevant dimensions, with particular focus on the aspect of water quality. This will also require improved indicators and metrics around water quality, its year-round availability, sustainability of source, affordability for the poor and accessibility, which are currently not reflected by the national assessments. The spatial inequalities for people living in high saline zones, illustrated in this paper, point to the need to revisit current policy and practice around different infrastructural investments in order to reliably deliver safe water to these people.


 ,
, 


