Article

Sediment Fungal Communities of Constructed Wetlands Dominated by Zizania latifolia and Phragmites communis and Their Effect on Organic Pollutant Removal

1
College of Life Science and Technology, Central South University of Forestry and Technology, 498 South Shaoshan Road, Changsha 410004, China
2
State Key Laboratory of Utilization of Woody Oil Resource, Hunan Academy of Forestry, 658 South Shaoshan Road, Changsha 410004, China
*
Author to whom correspondence should be addressed.
Water 2023, 15(12), 2291; https://doi.org/10.3390/w15122291
Submission received: 10 May 2023 / Revised: 6 June 2023 / Accepted: 16 June 2023 / Published: 19 June 2023

Abstract

:
The purpose of the study was to investigate the relationship between wetland plants and fungal communities with a focus on their combined functions to remove organic pollutants. Two constructed wetland (CW) systems, covering a total area of 4.24 hm2, were established to treat the agricultural non-point source pollution using, respectively, Zizania latifolia (CW1) and Phragmites communis (CW2) as the dominant plant species. The obtained results showed that CW1 performed much better than CW2 in terms of promoting the abundance and diversity of the sediment fungal community identified by high-throughput sequencing technology. The enhanced fungal activity was shown to be one of the main factors that raised the pollutant removal rates and reduced the contents of the target pollutants (COD, TN, TP and NH4+-N) to levels below the stipulated national standards. Significant differences in abundant fungi were observed between the CW units and their inlet and outlet sampling sites, indicating that the plant species and pollutant concentrations were the key factors affecting the diversity and activity of the sediment fungal community. The findings of the study provided not only a better understanding of the plant–fungi symbiotic system but also useful information for the development of CW technology.

1. Introduction

As an economical and ecological water treatment technology, constructed wetland (CW) has been widely used in organic pollutant removal [1,2]. Effective removal of organic pollutants can be achieved by a number of biotic and abiotic processes in CW including plant uptake [3,4,5], microbial degradation [6,7,8], substrate adsorption, filtration and precipitation [9,10,11]. As plants and microbes are indispensable components of CW and play key roles in strengthening its water purification functions [12,13,14,15], a deeper understanding of the relationship between wetland plant species and sediment microbial community and their combined effect on water purification efficiency should be of high value for optimizing both the design and performance of CW.
Microbial composition and diversity are known to be affected by plant diversity in various ecosystems [16]. The relationship between plants and microorganisms has been extensively studied in terrestrial ecosystems. The effect of plant diversity on microbial diversity, however, was found to be either positive [17,18], negative [19] or neutral [20] due to variation not only in the physical environment but also in the physiological characteristics of plant species. There is a lack of sufficient data on the relationship between wetland plants and microbial diversity [16] and, in particular, the information concerning the fungal community in CW is less available.
According to Chen et al. [21], plants may set the environmental context for the occurrence of microbial interactions. Increasing plant richness can lead to an increase in fungal richness due to an increased resource pool and niche diversity available to fungi [22]. Other studies, however, have shown no clear relationship between plant richness and fungal richness, suggesting that specific plant characteristics may be a key factor affecting fungal diversity [23,24,25]. Relevant reports have shown that a given plant species only favors the growth of a specific microbial community; thus, an increase in plant diversity will help to harbor different groups of microorganisms which respond differently to factors such as nutrient availability and pollutant loads, and, consequently, enhance the microbial-based wastewater treatment capacity [26,27].
A number of studies have been carried out with a focus only on the removal of organic pollutants either by plants or by microorganisms. The interactions between wetland plant species and microbial communities remain unclear. There is thus a high need for conducting studies to analyze the plant–microorganism-based mechanisms in CW treatment systems. High-throughput sequencing technology has been applied by Zhang et al. [28] to demonstrate the possibility that the bacterial genera can act as early warning indicators in clogging constructed wetlands. It should also be of value to determine the function of fungal communities and to see if a specific fungal group can be used as an indicator to reflect the level and characteristics of organic pollution in CW.
The global surface areas of wetlands and wetland plant species are in steep decline. The establishment of constructed wetlands aimed at removing organic pollution can greatly contribute to the enhancement of threatened wetland ecosystems and the associated biodiversity [1,2]. The perennial plants, Zizania latifolia and Phragmites communis, are the species commonly used in CW because of their high growth and reproduction rates and, thus, relatively high water purification abilities [29,30]. The main objective of the present study was to investigate the interrelation between wetland plants and microorganisms and related mechanisms to remove organic pollutants. Two CW systems were established to treat the agricultural non-point source pollution using, respectively, Zizania latifolia and Phragmites communis as the dominant plant species. The findings of the study will be expected to provide not only a better understanding of the relationship between wetland plants and microbial communities but also useful information for the development of water treatment systems using constructed wetland technology.

2. Methods and Materials

2.1. Experimental Site and Treatment System

The experimental site was located at the area of Ningxiang Farmland Reclamation Demonstration Project (111°53′–112°46′ E, 27°55′–28°29′ N) initiated in 2018 for control of agricultural non-point source pollution in the Xiang River Basin. Before the implementation of the project, the contents of COD (chemical oxygen demand), TN (total nitrogen) and TP (total phosphorus) in the water bodies of the area far exceeded the stipulated national surface water quality standards Class III (GB3838-2002) [31].
The treatment system consisted of two constructed wetland units established by transplanting, respectively, Zizania latifolia (CW1) and Phragmites communis (CW2) as the dominant plant species. Other selected crop species were also cultivated in the two CW units with the purpose to increase their plant diversity and land use value. For the reduction of the construction cost, no specific filler absorbents had been used in CW1 and CW2.
The area sizes, plant species and relevant parameters of CW1 and CW2 are listed in Table 1. The annual average hydraulic loading rate (HLR) and pollutant loading rate (PLR) of CW1 were slightly lower than those of CW2 and the annual average hydraulic residence time (HRT) of CW1 was, thus, slightly longer than that of CW2. The average water depth and the water flow velocity were about 0.3 m and 0.02 m/s, respectively, in both units. The treatment systems had been running stably for more than three years, within which a number of other aquatic plant species were naturally germinated and grown in the CW units (Table 1). The seasonal average temperature, water and pollutant fluxes, HRT, etc., are presented in Table S1.

2.2. Water Quality Analysis

By taking into consideration the hydrological and meteorological conditions [32], the representative water samples were collected from fixed sites of the two CW systems each month in 2020 and the effect of seasonal changes was compared using the data obtained for winter (December–February), spring (March–May), summer (June–August), and autumn (September–November). The contents of COD, TN and TP were determined by spectrophotometric measurement (UV1800, Shanghai, China) following the procedure described in the detection standard (APHA, 2005). The content of NH4+-N (ammonia nitrogen) was measured by the multi-parameter water quality monitoring platform (YSI EXO, Yellow Springs, OH, USA). The detailed information concerning the methods applied for water quality analysis refers to Xiao et al. [33].
The removal rates (R%) of all examined pollutants presented in percentage are calculated by
R% = 100(CinCout)/Cin
where Cin denotes the pollutant content at the inlet and Cout stands for that at the outlet.

2.3. Plant Community Analysis

Seasonal plant surveys were conducted in the two CW systems in January, April, July and October 2020. The standard sampling plots were set by taking into consideration the plant growth conditions. The quadrants of sampling plots for herbs, shrubs and aquatic plants were 1 m × 1 m, 4 m × 4 m and 0.5 m × 0.5 m, respectively. A total of 57 fixed quadrant sampling plots were selected, of which 23 plots were located in CW1 and 34 in CW2. The location of plant distribution was marked by GPS positioning. The basic information regarding the plant species, individual number, height, abundance, coverage and canopy density in each plot was recorded. The indexes applied for describing the plant community status were calculated by
M = (S − 1)/lnN
D = 1 − ∑Pi2    Pi = ni/N
H = −∑Pi lnPi
E = H/lnS
where M, D, H and E stand for the Margalef richness index, Simpson diversity index, Shannon–Weiner diversity index and Pielou evenness index, respectively, S denotes the total number of species, N denotes the total individual number of plants and ni represents the individual number of species i.

2.4. Microbial Community Analysis

Sediment samples were collected from the two CW systems at six fixed sites (40 cm below the water surface) of their inlet and outlet, respectively, in the high microbial activity period of summer. At each sampling site, about 500 g of surface sediments were collected in triplicates. After removing the visible plant and animal debris, the sediment samples were sent to the laboratory within two hours and then stored at −80 °C before analysis.
The present study was focused on the analysis of fungal communities. The high-throughput sequencing technology was applied to identify the fungal phyla, classes and genera of the sediment samples collected from the inlet and outlet of the two CW units.
In accordance with the E.Z.N.A.® soil DNA kit (Omega Bio-tek, Norcross, GA, USA), the total DNA of the microbial community was extracted, and the quality of DNA extraction was detected by 1% agarose gel electrophoresis. The concentration and purity of DNA were measured by NanoDrop2000 (Thermo Fisher Scientific, Waltham, MA, USA). ITS1F (5′-CTTGGTCATTTAGAGGAAGTAA-3′) and ITS2R (5′-GCTGCGTTCTTCATCGATGC-3′) for ITS gene in the ITS1 region were used for PCR amplification. The PCR products from the same sample were recovered using a 2% agarose gel after mixing. The recovered products were further purified by the AxyPrep DNA Gel Extraction Kit (Axygen Biosciences, Union City, CA, USA). The 2% agarose gel Electrolysis Fluorometer and Quantus™ Fluorometer (Promega, Madison, WI, USA) were applied for the determination of the quantity of the recovered product. NEXTFLEX Rapid DNA-Seq Kit was used to build the library. The sequencing analysis was performed on Illumina’s Miseq PE300 platform.
The Fastp software and Flash software were used, respectively, for quality control of the original sequence and stitching. Cluster analysis was performed for the OTU sequences using the Uparse software (v. 7.0.1090) by setting a 97% similarity threshold to eliminate the chimeras. Based on the UNITE database of fungi (Release 8.0 http://unite.ut.ee/index.php, 28 February 2023), the OTU representative sequences were classified by the RDP classifier. The confidence threshold was set as 0.7 to obtain the species taxonomic annotation results.

2.5. Statistical Analysis

All statistical analyses were performed using the statistical program Statistical Product and Service Solutions (SPSS 20.0) software (SPSS Inc., Chicago, IL, USA). The histogram of the removal rate of organic pollutants was realized by Excel 2019 (Microsoft Office, Redmond, WA, USA). The Spearman’s correlation (p < 0.05) was applied in network analysis to visualize the correlation between the plant diversity index and the water physicochemical parameters.
Based on the same pool of OTUs, fugal community structure and composition at the phylum, genus and OTU levels were calculated by SPSS 20.0 and R vegan package (version 3.3.1). Alpha diversity analyses were calculated using Mothur (v.1.30.1) estimators including Chao, Shannon–Weiner and Coverage based on OTU threshold of ≥97% sequence similarity. A Venn diagram with common and unique OTUs was used to describe the similarities and differences of the sediment samples at different sites. Results from the principal component analysis (PCA) and redundancy analysis (RDA) were obtained by R vegan package (v.4.2.1).

3. Results and Discussions

3.1. Pollutant Removal Rates

The determined annual average water quality indexes of the established treatment systems (CW1 and CW2) were presented in Table 2. The changes in the removal rates of the examined pollutants with respect to seasonal changes were illustrated in Figure 1. The water quality data for each month were given in Table S2.
The obtained results showed that both CW1 and CW2 had satisfactory treatment efficiencies and their effects on pollutant reduction were significant. On average, all the examined water quality indexes at the outlets met the stipulated national surface water quality standards Class III (Table 2).
The annual average removal rates of the pollutants were found to be consistently higher in CW1 than in CW2. The observed annual difference between these two units should be partly accounted for by their differences in hydraulic load, pollutant load and water retention time. Both the hydraulic and pollutant loads were lower while the hydraulic residence time was longer in CW1 than in CW2 (Table 1), a higher treatment efficiency found for CW1 should thus be an expected result. In addition, as to be discussed later, the transplanted plant species associated with the microbial groups developed in their root areas also made contributions to the observed differences between CW1 and CW2.
The highest seasonal average removal rates were obtained for all examined pollutants in the summer period in CW1 and the general trend was that all R% values in both CW1 and CW2 were significantly higher in spring, summer and autumn than in winter (Figure 1). The R% values of COD (Figure 1a), TN (Figure 1b) and TP (Figure 1c) in winter in both units were extremely low, while that of NH4+-N (Figure 1d) in CW2 even went down to below 10%. Similar to that shown in Table 1, the CW1 system had significantly higher pollutant removal rates than the CW2 system in all seasons with NH4+-N in spring as an exception.
As the activities of bio-species were low in the cold season, the lowest R% values observed in winter due to the decrease in biological activities at low temperatures was an indication that the plants and microbes were the main factors that had determined the pollutant removal rates in the established CW units without using high adsorption capacity fillers. The observed seasonal pollutant reduction trends confirmed the important functions of wetland plants and microorganisms reported by previous works [34]. Since bio-species responded differently to seasonal changes, the observed seasonal differences thus reflected the differences in the effect of bio-species on pollutant removal rates between not only the seasons but also the established CW systems transplanted with different plant species.
Previous studies showed that wetland plants played an important role in reducing COD, either through root filtration [35] or by providing surface sites and oxygen for the attached microorganisms [36]. In principle, the reduction of COD should be mainly attributed to the decomposition of organic pollutants by the microbial species in the rhizosphere. This would imply that the microbial groups developed in CW1 had a stronger effect on the removal of COD than those developed in CW2.
Both nitrogen and phosphorus are essential elements required by plants and microorganisms to support their growth. Apart from the direct contribution to the removal of TN and TP by plant uptake, the decomposition of plant litters and the secretion of root exudates can provide available carbon and energy sources for the microbes in the root area, consequently enhancing the reactions of nitrification, denitrification and phosphorylation, and eventually promoting the removal of the two nutrient elements.
The pathways of NH4+-N removal in constructed wetlands can be plant uptake, substrate adsorption, nitrification and denitrification [37]. Though the transformation of nitrogen can be affected by various other factors [38,39,40,41], the removal rate of NH4+-N should be positively related to the activities of plants and microorganisms. Compared with that of TN, the content of NH4+-N was relatively low and its annual average values found in the inlets of both CW1 and CW2 were lower than the stipulated standard (Table 2). The removal rate of NH4+-N could, thus, be more sensitive to seasonal changes.
Another reason for the lowest R% values found for NH4+-N, as well as for COD, TN and TP in winter, could be accounted for by the difficulties to obtain an in-time and clean harvest in the constructed wetlands. Various studies showed that an additional COD input from decaying biomass litter associated with the release of the nutrients from the dead plant residues could lead to an increase in pollutant concentrations in the system and, thus, result in an adverse effect on pollutant removal [42,43].

3.2. Effect of Plant Community on Removal Rate

The coefficients of the correlation between seasonal plant community indexes and pollutant removal rates were given in Table 3. The plant community indexes observed for each season were presented in Table S3. The determined M (Margalef richness), D (Simpson diversity), H (Shannon–Weiner diversity) and E (Pielou evenness) were found to be positively correlated with the removal rates of all examined pollutants at high levels of significance in both CW1 and CW2. The data shown in Table 3 were in agreement with a previous study [44].
From the mathematical expressions (Equations (2)–(5)), it can be noted that both the Simpson diversity and Shannon–Weiner diversity indexes are functions of Margalef richness and Pielou evenness. The observed high levels of positive correlations between the interrelated plant community indexes and the pollutant removal rates thus confirmed the important roles of the plant communities in maintaining the treatment effects of the two CW units.
From the data listed in Table 3, it is difficult to draw a conclusion concerning the behaviors of the transplanted plant species as no consistent trend was found in the correlation coefficients obtained for CW1 and CW2. One of the logical reasons for the observed inconsistency is that the applied indexes are parameters at macro-ecology scales and they do not offer any concrete information on the physiological characteristics of either a plant species or a plant community. It is worth mentioning that the essential role of a wetland plant species with respect to organic pollutant removal is its function in maintaining microbial activity. It is thus important to compare the functional groups of the sediment microbes and to determine the difference in their involvement in and contribution to pollutant removal between the two CW systems.

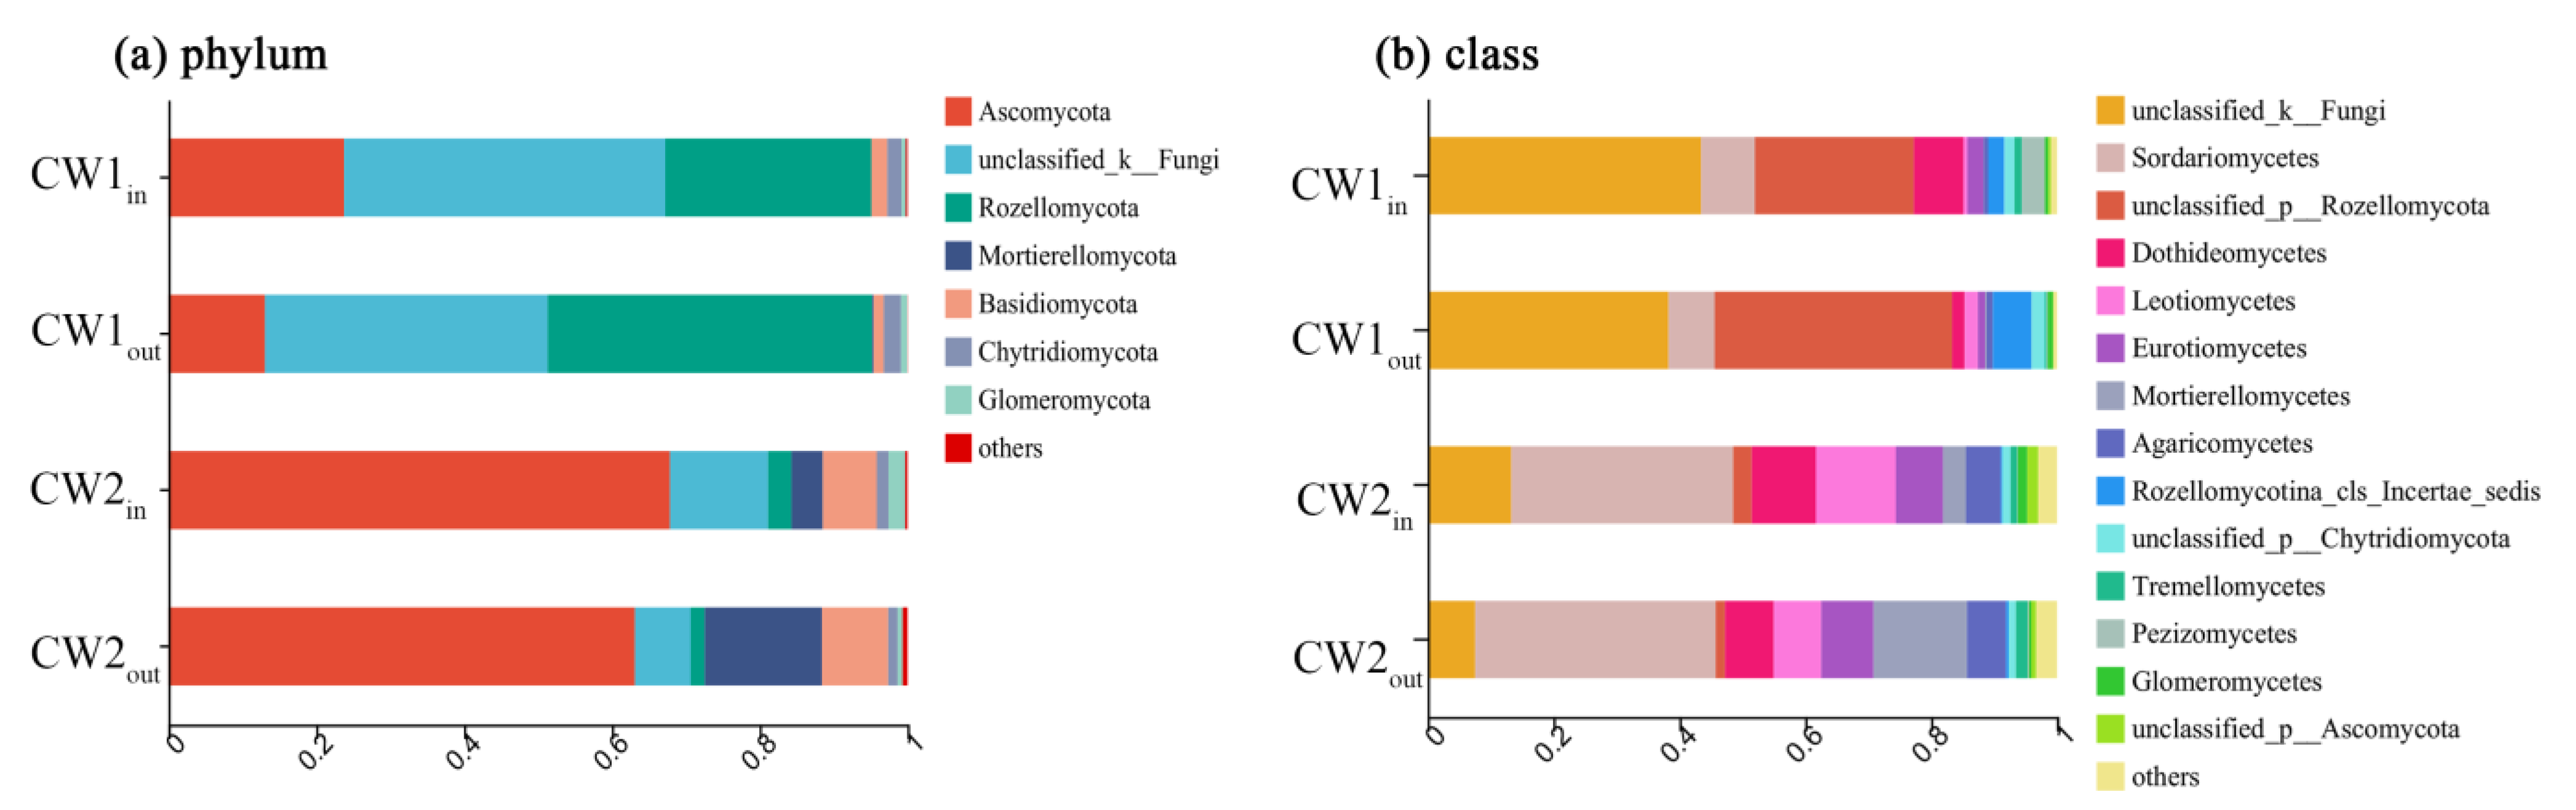
3.3. Variation in Fungal Abundance and Diversity

The total number of OTU of the fungal communities identified for the sediment samples at the 3% dissimilarity level by the high-throughput sequencing technology was significantly greater in CW1 than in CW2 (Table 4). In contrast, the OTU number at the inlet was greater, while that at the outlet was smaller in CW1 than in CW2, respectively. The same trends were also found for the Chao and Shannon–Weiner indexes. Like the number of OTU, the values of the two indexes were significantly higher at the inlets of two CW units than at their outlets. In a similar way, the values of the two indexes were higher at the inlet but lower at the outlet of CW1 than, respectively, those of CW2. The values calculated for the Good’s coverage listed in Table 4 reached more than 99% for all substrate samples, suggesting that the high-quality sequences presented for each sample could effectively cover the fungal community [29].
The richness and abundance of a fungal community could be reasonably taken as an index to reflect the function of the fungal community with respect to the removal of the target pollutants simply because its growth was essentially associated with or supported by the decomposition of the organic compounds and assimilation of the released nutrients [45]. The greater number of OTU found in CW1 than in CW2 was, thus, an indication that the plant community with Zizania latifolia as the dominant species in CW1 had performed much better than that with Phragmites communis as the dominant species in CW2 in terms of promoting the richness, abundance and diversity of the sediment fungal community.
There should be no doubt that the enhanced fungal activity was one of the main factors that had raised the level of the treatment efficiency and reduced the target pollutant concentrations to the levels below the stipulated standards Class III. The improved water quality would in turn lead to a decrease in the nutrient availability for both plants and microbes, thus resulting in a decline not only in the growth of the plants as was observed in the areas close to the outlets of the CW units but also the richness, abundance and diversity of the fungal communities at their outlets, as was shown in Table 4. Since the pollutant concentrations were lower at the outlet of CW1 than at that of CW2 (Table 2), the observed lower values of the OTU number, Chao index and Shannon–Weiner index at the outlet of CW1 than that of CW2 could be interpreted as an effect of the improved water quality. The availability of nutrient sources should be a basic factor affecting the activity of microbes. Thus, in consistent with the findings of previous studies [46,47], the obtained data showed that the plant community and pollutant concentration were two of the key factors affecting the status of the fungal community in the established CW systems.
The composition percentage of the identified fungal phyla was shown in Figure 2a. The top dominant phyla of the common OTUs found in both CW units were Ascomycota (42.82%), (25.12%) and Rozellomycota (18.70%), and the sum of their percentages amounted to more than 85% of the total OTU number.
In order to determine the difference in OTU distribution for the collected wetland sediment samples, a Venn diagram was constructed to compare both the similarities and differences among the observed fungal communities (Figure 2b). The number of OTU uniquely identified in the samples from CW1 was 1221 (26.6%) and 269 (5.86%), while that from CW2 were 949 (20.67%) and 595 (12.96%), respectively. There were also common OTUs distributed at the inlets and outlets of the two CW units. The level of similarity between CW1 and CW2 was high while the difference between them was also significant, which confirmed the existence of a close connection between the plant and fungal community in the CW systems possessing different plant species.
Principal component analysis (PCA) was further performed to compare the difference in fungal composition for samples collected at different sites. As shown in Figure 2c, most of the PCA values of the samples collected from CW1 were not located in the same circle area as those from CW2, indicating the presence of significant differences in fungal composition between the two CW systems. The PCA points were closer to each other in CW1 than those in CW2, suggesting that the level of similarity in fungal composition was higher in CW1 than that in CW2. An interesting phenomenon was also noted that, in contrast to those large distances observed at the inlet sites between CW1 and CW2, the PCA points found at the outlet sites of CW1 were very close to those of CW2. The difference in transplanted plant species was apparently the main factor that caused the difference in fungal composition and distribution between CW1 and CW2. In addition, since the effluent pollutant concentrations had been reduced to below the stipulated standards, the nutrient availability could thus become a limiting factor responsible for the reduced difference in fungal composition at the outlet sites between the two CW units.
The relative abundances of fungal phyla and classes in the substrate samples were shown in Figure 3. The Phyla and classes in the figure were distinguished by different colors, and their abundances were indicated by the length of the colored columns.
Eight fungal phyla were identified in both of the CW units, among which, unclassified_k_Fungi, Rozellomycota and Ascomycota, listed in the descending order of relative abundance, were the dominant phyla in CW1, while Ascomycota, unclassified_k_Fungi, Basidiomycota and Mortierellomycota were the dominant phyla in CW2 (Figure 3a). The sum of the relative abundance of the listed dominant phyla reached, respectively, 95.15% and 94.06% of the total value in CW1 and CW2. Due to a lack of annotation information, a number of unannotated fungal species were denoted as unclassified fungi.
The dominant phyla found in the established CW units are the common ones distributed in various kinds of wetlands [28,48,49,50]. It has been generally observed that the dominant fungal phyla in wetlands can change not only at localities but also with the types of vegetation. The noted difference in the dominant fungal phyla and their abundances thus reflected the difference in the effect of the plant communities between CW1 and CW2 established at the same site.
Significant differences were further noted in the abundance order of the dominant phyla between the inlet and outlet of the two CW units. The second abundant phylum Rozellomycota observed at the inlet of CW1 became the most abundant phylum at the unit’s outlet, followed in descending order by unclassified_k_Fungi and Ascomycota. The phylum Mortierellomycota, which had the lowest abundance level among the above-listed four dominant phyla at the inlet of CW2 changed to be the second abundant phylum at the unit’s outlet. The order of the abundance level at the outlet of CW2 then changed to Ascomycota, Mortierellomycota, Basidiomycota and unclassified_k_Fungi (Figure 3a).
The same trends were also observed at the class levels regarding the difference in the relative abundances of the classes between the CW units and their inlets and outlets (Figure 3b). The top seven dominant fungal classes found at the inlet of CW1 are unclassified_k_Fungi, unclassified_p_Rozellomycota, Rozellomycotina_cls_Incerta_cedis, Sordariomycetes, Dothideomycetes, Leotiomycetes and Mortierellomycete, of which the first class belongs to the phylum unclassified_k_Fungi, the next five classes belong to the phylum Rozellomycota and Ascomycota, and the last one belongs to the phylum Mortierellomycota. The top seven dominant fungal classes found at the inlet of CW2 are Sordariomycetes, unclassified_k_Fungi, Leotiomycetes, Dothideomycetes, Eurotiomycetes, Mortierellomycete and Agaricomycetes, of which the last one belongs to the phylum Basidiomycota. The same dominant fungal classes were also observed, respectively, at the outlets of the two CW units, but the order of their relative abundance at the outlet was obviously different from that at their inlets (Figure 3b). The relative abundance of unclassified_p_Rozellomycota, for example, was much higher, while that of unclassified _k _Fungi was much lower at the outlet of CW1 than, respectively, their values at the unit’s inlet. The same was true for Sordariomycetes and unclassified_k_Fungi in CW2. The relative abundance of Sordariomycetes increased while that of unclassified_k_Fungi decreased at the outlet of CW2 when compared to, respectively, their inlet values.
The profile of the relative abundance of the identified fungal genera was further depicted in Figure 4 using a hierarchically clustered heat map. The top 35 genera possessing a total abundance at the taxonomic level were selected to construct the hot spot map.
The same as those observed at phylum and class levels, significant differences in the relative abundance of genera were clearly noted between the two established CW units. Among the 35 genera shown in Figure 4, the genera possessing a relative abundance higher than 2 × 10⁻² (the color gradient indicating the levels of relative abundance in Figure 4) observed at the inlet of CW1 were unclassified_k_Fungi, unclassified_p_ Rozellomycota, unclassified_o_Branch02, Eleutherascus, Paraconiothyrium, Gibellulopsis, unclassified_p__Chytridiomycota and Pyrenochaetopsis. In contrast, more genera possessing higher relative abundance values were found at the inlet of CW2 than that of CW1. In addition, most of the top abundant genera in CW2 were different from those in CW1, except for unclassified_k_Fungi, unclassified_p_Rozellomycota, unclassified_p__Chytridiomycota and Pyrenochaetopsis. The genera Mortierella and Pseudeurotium, for example, were two of the top abundant genera in CW2, while their relative abundance values were very low in CW1 (Figure 4).
Significant differences in the relative abundance of the genera also existed between the inlets and outlets of the CW units. The typical genera having higher relative abundance values at the outlet of CW1 than at its inlet were Eleutherascus, Paraconiothyrium and Gibellulopsis, while those having lower relative abundance values at the outlet of CW1 than at its inlet were unclassified_f_Nectriaceae, unclassified_f_Hyaloscyphaceae and Zopfiella. The typical genera having higher relative abundance values at the outlet of CW2 than at its inlet were unclassified_p_Rozellomycota, Paraconiothyrium and Gibellulopsis, while those having lower relative abundance values at the outlet of CW2 than at its inlet were Phialoophora and Thielavia.
It is worth mentioning that unclassified_k_Fungi, unclassified_p_Rozellomycota, unclassified_p__Chytridiomycota and Pyrenochaetopsis were the common dominant genus in CW1 and CW2 and their relative abundance values remained stably at high levels at both the inlet and outlet of the two CW units. The top abundant genera Mortierella and Pseudeurotium also remained stable at the inlet and outlet of CW2, while their abundance levels changed slightly between the sampling sites in CW1.
The decrease in the relative abundance of a specific fungal genus did not necessarily mean the decrease in its absolute abundance because, as shown in Table 3, the total observed OTU number was different between not only the two CW units but also their outlets and inlets. The differences in the relative abundance levels of the fungal genera, however, could be used as an indicator for comparing their affinity with plant communities and adaptability to water pollution conditions. The identified genera possessing higher relative abundance values at the inlet of the CW unit were likely to be the ones that adapted better to polluted conditions, while the opposite could be true for the ones possessing higher relative abundance values at the unit’s outlet.
Over the last two decades, numerous studies had indicated the occurrence of various types of fungal genera in diversified environments [51,52,53,54,55] and most of them had actively participated in removing a number of pollutant compounds [56,57]. Determination of the correlation between the abundance of the identified fungal genera and pollutant concentrations should thus be of high value for comprehending the functions of fungi in the established CW treatment systems.

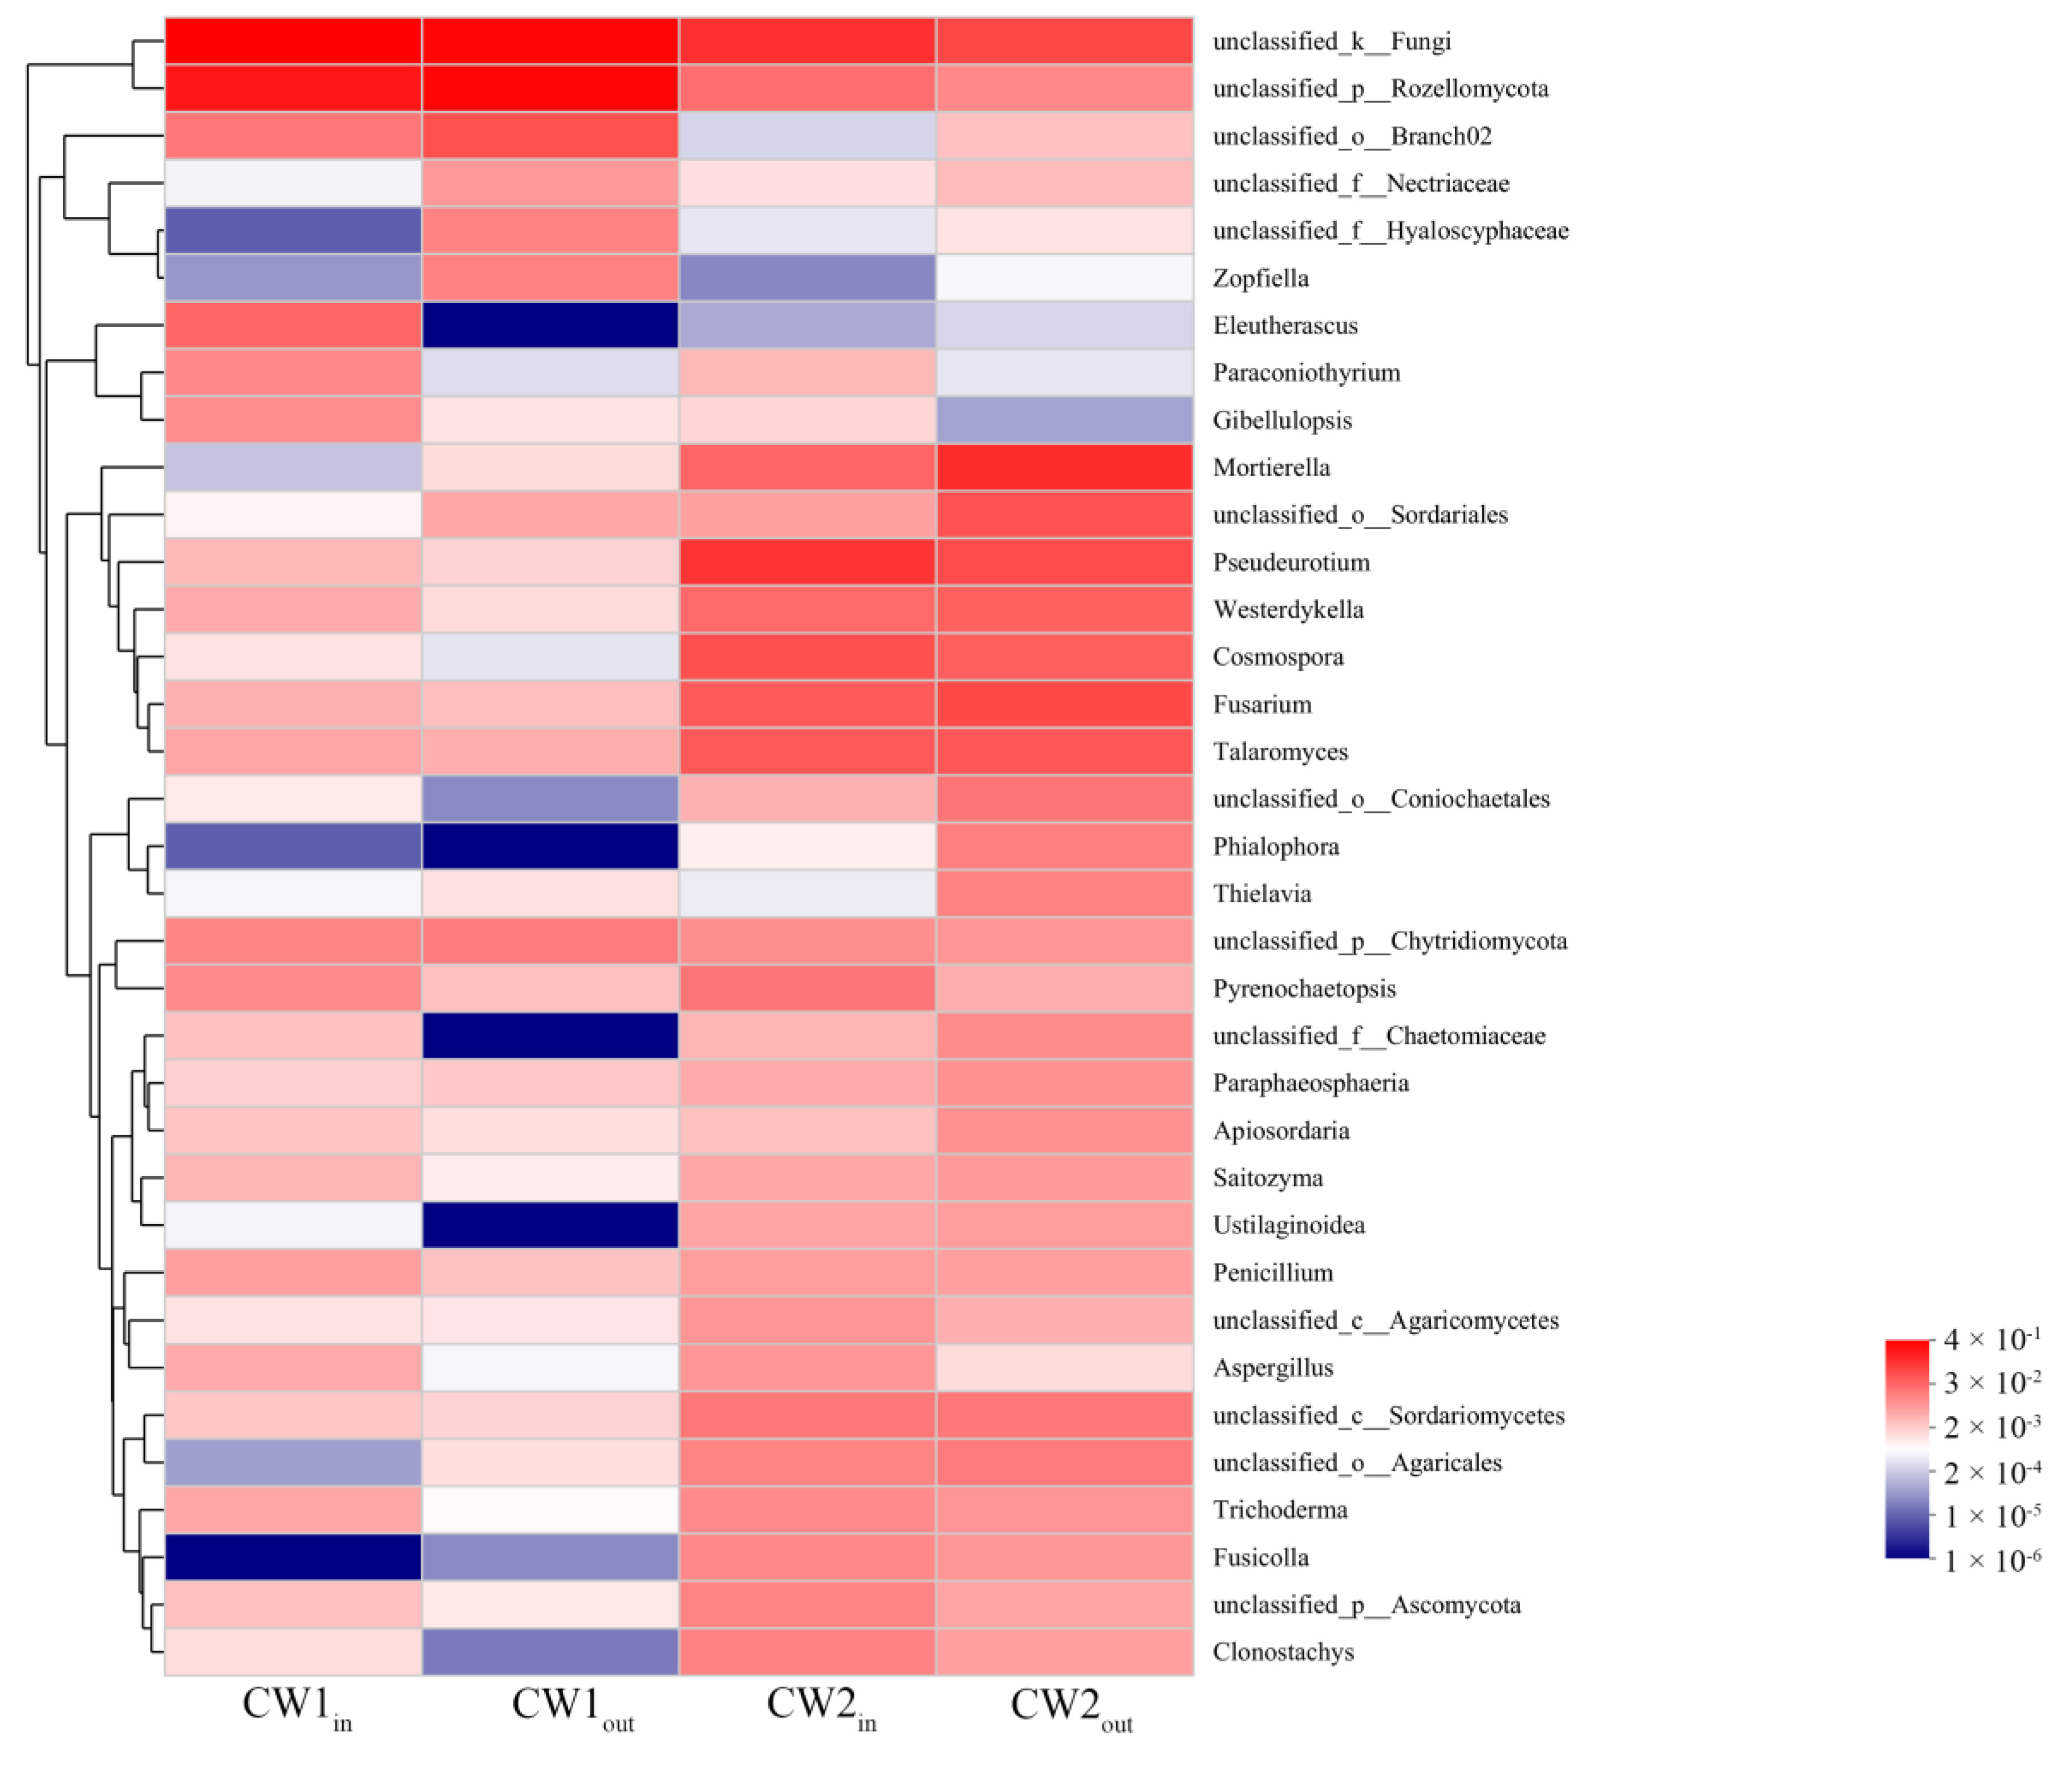
3.4. Correlation between Fugal Genera and Target Pollutants

The redundancy analysis (RDA) was performed to assess the relationship between the fugal genera identified for the sediment samples collected at different sites of the CW systems and the target pollutant concentrations of the sites. The top ten abundant genera were selected from each CW unit to form the RDA diagram (Figure 5). The length of the red arrow in Figure 5 was used to denote the correlation level between a target pollutant and a fungal genus or the effect of the target pollutant on the abundance of a fungal genus, while the angle between the red and black arrows was used to indicate the positive or negative nature of the correlation subject if the angle was lower or higher than 90°. The pollutant concentrations of the water samples obtained at the surface sediment sample collection sites were given in Table S4.
The results of the analysis indicated that RDA1 (the vertical ordinate) explained 29.10% and 33.72%, while RDA2 (the horizontal ordinate) explained 6.60% and 8.42% of the total variance for CW1 (Figure 5a) and CW2 (Figure 5b), respectively, showing that the influence of the pollutant concentration on fungal genera was greater in CW1 than in CW2.
The dominant genera, unclassified_k_Fungi, Eleutherascus, Gibellulopsis, Pyrenochaetopsis and Paraconiothyrium in CW1 (Figure 5a) were found to be positively correlated with the concentrations of all examined pollutants at different levels of significance. Negative correlations were further noted for unclassified_o_Branch02, unclassified_f_Hyaloscyphaceae and unclassified_f_Hyaloscyphaceae, showing the adverse effect of the pollutant concentrations on their living conditions.
The dominant genera possessing positive correlations with the concentrations of examined pollutants in CW2 (Figure 5b) were found to be unclassified_k_Fungi, Pseudeurotium and Cosmospora. The genera possessing negative correlations with the concentrations of all examined pollutants were shown to be Mortierella and unclassified_o_Sordariales.
A few abundant genera, such as unclassified_p_Chytridiomycota in CW1 and Fusarium and Talaromyces in CW2, were not sensitive to the changes in pollutant contents, indicating that they were less affected by the changes in water qualities in the observed range.
It is necessary to point out that, unlike the abundance level of a genus which could be regarded as an index related to its effect on pollutant removal, the presence of a positive or a negative correlation at either a higher or a lower significant level for a genus did not reflect the level of contribution of the genus to pollutant removal rates. The patterns of the dramatic differences among the wetland sediment samples depicted in Figure 5 just confirmed the fact that the pollutant concentration was one of the important factors affecting the fungal composition in the established systems.

4. Conclusions

The results obtained from the present study showed that the plant community with Zizania latifolia as the dominant species in CW1 performed much better than that with Phragmites communis as the dominant species in CW2 in terms of promoting the richness, abundance and diversity of the sediment fungal community. The enhanced fungal activity in both CW units was one of the main factors that raised the level of the treatment efficiency and reduced the concentrations of the target pollutants to levels below the stipulated national standards Class III. The improved water quality led to a decrease in the nutrient availability for both plants and microbes and resulted in a decline in the growth of the plants and the richness, abundance and diversity of the fungal communities in the outlet areas of the CW units.
Significant differences in top abundant fungi were observed at phylum, class and genus levels between the two established CW units and their sampling sites, indicating that the composition of the plant species and the concentration of the pollutants were two of the key factors affecting the diversity and activity of the sediment fungal community.
The top abundant genera found in CW1 were unclassified_k_Fungi, unclassified_p_ Rozellomycota, unclassified_o_Branch02 and Eleutherascus, while those found in CW2 were unclassified_k_ Fungi, unclassified_p_Rozellomycota, Mortierella and Pseudeurotium. Most of the top abundant genera observed in the CW units were either positively or negatively correlated with the target pollutants at different levels of significance.
The findings of the present study provided not only a better understanding of the relationship between wetland plants and fungal communities but also useful information for the development of water treatment systems using constructed wetland technologies.
In order to demonstrate the specific role of a key fungal species to remove nutrient pollutants (e.g., nitrogen or phosphorus), it is necessary to cultivate the strains in a defined medium and determine their effects. Further study should be carried out using the established CW systems in combination with strain cultivation technology with a focus on the determination of symbiotic fungi associated with Zizania latifolia and Phragmites communis and their integrated functions on pollutant removal.

Supplementary Materials

The following supporting information can be downloaded at: https://www.mdpi.com/article/10.3390/w15122291/s1, Table S1: Supplementary information of two wetland systems. Table S2: Monthly water quality index of two wetland systems. Table S3: Plant richness, diversity and evenness indexes for each season. Table S4: Pollutant concentration of the water samples collected at the sites where the sediment samples were taken.

Author Contributions

Conceptualization, methodology, investigation, writing—original draft, Y.H.; supervision and resources, Z.H.; data curation and software, H.L.; formal analysis and visualization, J.H.; software, X.Q.; conceptualization, project administration, supervision, Z.W. All authors have read and agreed to the published version of the manuscript.

Funding

This research was supported by the Science and Technology International Cooperation Project of Changsha City (kq2004103) and the Hunan Forestry Ecological Protection, Restoration and Development Special Project in 2022 (2022-0067).

Informed Consent Statement

Not applicable.

Data Availability Statement

No new data were created.

Acknowledgments

The study forms part work of the project (kq2004103) supported by the Science and Technology bureau of Changsha City, and the project (2022-0067) supported by the Hunan Forestry Ecological Restoration and Development Program. Special thanks to the Hunan Academy of Forestry for providing financial support for the experiment and sampling.

Conflicts of Interest

The authors declare no conflict of interest.

References

  1. Sithamparanathan, E.; Sutton, N.B.; Rijnaarts, H.H.; Kujawa-Roeleveld, K. Controlling nitrogen removal processes in improved vertical flow constructed wetland with hydroponic materials: Effect of influent cod/n ratios. Water 2023, 15, 1074. [Google Scholar] [CrossRef]
  2. Spieles, D.J. Wetland construction, restoration, and integration: A comparative review. Land 2022, 11, 554. [Google Scholar] [CrossRef]
  3. Kurade, M.B.; Ha, Y.; Xiong, J.; Govindwar, S.P.; Jang, M.; Jeon, B. Phytoremediation as a green biotechnology tool for emerging environmental pollution: A step forward towards sustainable rehabilitation of the environment. Chem. Eng. J. 2021, 415, 129040. [Google Scholar] [CrossRef]
  4. Fujita, K.; Inui, H. How does the Cucurbitaceae family take up organic pollutants (POPs, PAHs, and PPCPs)? Rev. Environ. Sci. Bio/Technol. 2021, 20, 751–779. [Google Scholar] [CrossRef]
  5. Peña-Guzmán, C.; Ortiz-Gutierrez, B.E. Evaluation of three natural coagulant from moringa oleifera seed for the treatment of synthetic greywater. Civ. Eng. J. 2022, 8, 3842–3853. [Google Scholar] [CrossRef]
  6. Cheng, J.; Gu, J.; Tao, W.; Wang, P.; Liu, L.; Wang, C.; Li, Y.; Feng, X.; Qiu, G.; Cao, F. Edible fungus slag derived nitrogen-doped hierarchical porous carbon as a high-performance adsorbent for rapid removal of organic pollutants from water. Bioresour. Technol. 2019, 294, 122149. [Google Scholar] [CrossRef]
  7. Giovanella, P.; Vieira, G.A.; Otero, I.V.R.; Pellizzer, E.P.; de Jesus Fontes, B.; Sette, L.D. Metal and organic pollutants bioremediation by extremophile microorganisms. J. Hazard. Mater. 2020, 382, 121024. [Google Scholar] [CrossRef]
  8. Chan, S.S.; Khoo, K.S.; Chew, K.W.; Ling, T.C.; Show, P.L. Recent advances biodegradation and biosorption of organic compounds from wastewater: Microalgae-bacteria consortium—A review. Bioresour. Technol. 2022, 344, 126159. [Google Scholar] [CrossRef]
  9. Raji, V.; Packialakshmi, S. Assessing the wastewater pollutants retaining for a soil aquifer treatment using batch column experiments. Civ. Eng. J. 2022, 8, 1482–1491. [Google Scholar] [CrossRef]
  10. Ismail, W.N.W.; Syah, M.I.A.I.; Abd Muhet, N.H.; Bakar, N.H.A.; Yusop, H.M.; Samah, N.A. Adsorption behavior of heavy metal ions by hybrid inulin-TEOS for water treatment. Civ. Eng. J. 2022, 8, 1787–1798. [Google Scholar] [CrossRef]
  11. Ekeleme, A.C.; Ekwueme, B.N.; Agunwamba, J.C. Modeling contaminant transport of nitrate in soil column. Emerg. Sci. J. 2021, 5, 471–485. [Google Scholar] [CrossRef]
  12. Akpor, O.B.; Otohinoyi, D.; Olaolu, D.; Aderiye, B. Pollutants in wastewater effluents: Impacts and remediation processes. Int. J. Environ. Res. Earth Sci. 2014, 3, 50–59. [Google Scholar]
  13. Andersson, J.; Bastviken, S.K.; Tonderski, K. Free water surface wetlands for wastewater treatment in Sweden: Nitrogen and phosphorus removal. Water Sci. Technol. 2005, 51, 39–46. [Google Scholar] [CrossRef]
  14. Ansola, G.; Arroyo, P.; de Miera, L.E.S. Characterisation of the soil bacterial community structure and composition of natural and constructed wetlands. Sci. Total Environ. 2014, 473, 63–71. [Google Scholar] [CrossRef]
  15. Arroyo, P.; Ansola, G.; de Miera, L.E.S. Effects of substrate, vegetation and flow on arsenic and zinc removal efficiency and microbial diversity in constructed wetlands. Ecol. Eng. 2013, 51, 95–103. [Google Scholar] [CrossRef]
  16. Kim, S.; Kang, H.; Megonigal, J.P.; McCormick, M. Microbial activity and diversity vary with plant diversity and biomass in wetland ecosystems. Estuaries Coasts 2021, 45, 1434–1444. [Google Scholar] [CrossRef]
  17. Zhang, Y.; Fang, Y.; Wang, B.; Zhang, H.; Ding, J. Effects of stepwise adjustment of C/N during the start-up of submerged membrane bioreactors (SMBRs) on the aerobic denitrification of wastewater. Water 2021, 13, 3251. [Google Scholar] [CrossRef]
  18. Ge, Y.; Han, W.; Huang, C.; Wang, H.; Liu, D.; Chang, S.X.; Gu, B.; Zhang, C.; Gu, B.; Fan, X.; et al. Positive effects of plant diversity on nitrogen removal in microcosms of constructed wetlands with high ammonium loading. Ecol. Eng. 2015, 82, 614–623. [Google Scholar] [CrossRef]
  19. Weragoda, S.; Tanaka, N.; Jinadasa, K.; Sasaki, Y. Impact of influent inorganic nitrogen on nitrate removal efficiency of submerged plant microcosms. Chem. Ecol. 2009, 25, 179–188. [Google Scholar] [CrossRef]
  20. Chen, C.; Chen, H.Y.; Chen, X.; Huang, Z. Meta-analysis shows positive effects of plant diversity on microbial biomass and respiration. Nat. Commun. 2019, 10, 1332. [Google Scholar] [CrossRef] [Green Version]
  21. Chen, M.; He, S.; Li, J.; Hu, W.; Ma, Y.; Wu, L.; Gang, G. Co-occurrence patterns between bacterial and fungal communities in response to a vegetation gradient in a freshwater wetland. Can. J. Microbiol. 2019, 65, 722–737. [Google Scholar] [CrossRef] [PubMed]
  22. Sugiyama, S.-I.; Zabed, H.M.; Okubo, A. Relationships between soil microbial diversity and plant community structure in seminatural grasslands. Grassl. Sci. 2008, 54, 117–124. [Google Scholar] [CrossRef]
  23. Comas, L.H.; Callahan, H.S.; Midford, P.E. Patterns in root traits of woody species hosting arbuscular and ectomycorrhizas: Implications for the evolution of belowground strategies. Ecol. Evol. 2014, 4, 2979–2990. [Google Scholar] [CrossRef] [PubMed] [Green Version]
  24. Broeckling, C.D.; Broz, A.K.; Bergelson, J.; Manter, D.K.; Vivanco, J.M. Root exudates regulate soil fungal community composition and diversity. Appl. Environ. Microbiol. 2008, 74, 738–744. [Google Scholar] [CrossRef] [Green Version]
  25. Bardgett, R.D.; Mommer, L.; De Vries, F.T. Going underground: Root traits as drivers of ecosystem processes. Trends Ecol. Evol. 2014, 29, 692–699. [Google Scholar] [CrossRef]
  26. Liang, W.; Wu, Z.; Cheng, S.; Zhou, Q.; Hu, H. Roles of substrate microorganisms and urease activities in wastewater purification in a constructed wetland system. Ecol. Eng. 2003, 21, 191–195. [Google Scholar] [CrossRef]
  27. Ligi, T.; Oopkaup, K.; Truu, M.; Preem, J.; Nõlvak, H.; Mitsch, W.J.; Mander, Ü.; Truu, J. Characterization of bacterial communities in soil and sediment of a created riverine wetland complex using high-throughput 16s rRNA amplicon sequencing. Ecol. Eng. 2014, 72, 56–66. [Google Scholar] [CrossRef]
  28. Zhang, M.; Xu, D.; Bai, G.; Cao, T.; Liu, W.; Hu, Z.; Chen, D.; Qiu, D.; Wu, Z. Changes of microbial community structure during the initial stage of biological clogging in horizontal subsurface flow constructed wetlands. Bioresour. Technol. 2021, 337, 125405. [Google Scholar] [CrossRef]
  29. Zheng, Y.; Yang, D.; Dzakpasu, M.; Yang, Q.; Liu, Y.; Zhang, H.; Zhang, L.; Wang, X.C.; Zhao, Y. Effects of plants competition on critical bacteria selection and pollutants dynamics in a long-term polyculture constructed wetland. Bioresour. Technol. 2020, 316, 123927. [Google Scholar] [CrossRef]
  30. Li, W.; Liu, Y.; Tian, K.; Liang, Q.; Liu, H. Research on purification effect of Jian lake Zizania latifolia wetland lakefront zone in northwest of Yunnan plateau on nitrogen and phosphorus of agricultural non-point source. Agric. Sci. Technol. Hunan 2010, 11, 109–150. [Google Scholar]
  31. GB3838-2002; Environmental Quality Standards for Surface Water. Ministry of Ecology and Environment: Beijing, China, 2002.
  32. Hu, Q.; He, X.; Lu, X.; Zhang, X. Trend analysis of seasonal precipitation (1960–2013) in subregions of Hunan province, central south China using discrete wavelet transforms. J. Appl. Meteorol. Climatol. 2019, 58, 2159–2175. [Google Scholar] [CrossRef]
  33. Xiao, J.; Huang, J.; Huang, M.; Chen, M.; Wang, M. Application of basalt fiber in vertical flow constructed wetland for different pollution loads wastewater: Performance, substrate enzyme activity and microorganism community. Bioresour. Technol. 2020, 318, 124229. [Google Scholar] [CrossRef]
  34. Vymazal, J. Emergent plants used in free water surface constructed wetlands: A review. Ecol. Eng. 2013, 61, 582–592. [Google Scholar] [CrossRef]
  35. Zhang, B.; Song, X.; Zhang, Y.; Han, D.; Tang, C.; Yu, Y.; Ma, Y. Hydrochemical characteristics and water quality assessment of surface water and groundwater in Songnen plain, Northeast China. Water Res. 2012, 46, 2737–2748. [Google Scholar] [CrossRef]
  36. Zhai, X.; Piwpuan, N.; Arias, C.A.; Headley, T.; Brix, H. Can root exudates from emergent wetland plants fuel denitrification in subsurface flow constructed wetland systems? Ecol. Eng. 2013, 61, 555–563. [Google Scholar] [CrossRef]
  37. Wu, H.; Fan, J.; Zhang, J.; Ngo, H.H.; Guo, W.; Hu, Z.; Liang, S. Decentralized domestic wastewater treatment using intermittently aerated vertical flow constructed wetlands: Impact of influent strengths. Bioresour. Technol. 2015, 176, 163–168. [Google Scholar] [CrossRef]
  38. Allen, C.R.; Stein, O.R.; Hook, P.B.; Burr, M.D.; Parker, A.E.; Hafla, E.C. Temperature, plant species and residence time effects on nitrogen removal in model treatment wetlands. Water Sci. Technol. 2013, 68, 2337–2343. [Google Scholar] [CrossRef] [Green Version]
  39. Nivala, J.; Wallace, S.; Headley, T.; Kassa, K.; Brix, H.; van Afferden, M.; Müller, R. Oxygen transfer and consumption in subsurface flow treatment wetlands. Ecol. Eng. 2013, 61, 544–554. [Google Scholar] [CrossRef]
  40. Zhu, H.; Yan, B.; Xu, Y.; Guan, J.; Liu, S. Removal of nitrogen and cod in horizontal subsurface flow constructed wetlands under different influent C/N ratios. Ecol. Eng. 2014, 63, 58–63. [Google Scholar] [CrossRef]
  41. Liang, Y.; Zhu, H.; Bañuelos, G.; Yan, B.; Shutes, B.; Cheng, X.; Chen, X. Removal of nutrients in saline wastewater using constructed wetlands: Plant species, influent loads and salinity levels as influencing factors. Chemosphere 2017, 187, 52–61. [Google Scholar] [CrossRef]
  42. Jabłońska, E.; Winkowska, M.; Wiśniewska, M.; Geurts, J.; Zak, D.; Kotowski, W. Impact of vegetation harvesting on nutrient removal and plant biomass quality in wetland buffer zones. Hydrobiologia 2021, 848, 3273–3289. [Google Scholar] [CrossRef]
  43. Wei, F.; Shahid, M.J.; Alnusairi, G.S.; Afzal, M.; Khan, A.; El-Esawi, M.A.; Abbas, Z.; Wei, K.; Zaheer, I.E.; Rizwan, M. Implementation of floating treatment wetlands for textile wastewater management: A review. Sustainability 2020, 12, 5801. [Google Scholar] [CrossRef]
  44. Brisson, J.; Rodriguez, M.; Martin, C.A.; Proulx, R. Plant diversity effect on water quality in wetlands: A meta-analysis based on experimental systems. Ecol. Appl. 2020, 30, e02074. [Google Scholar] [CrossRef] [PubMed]
  45. Assress, H.A.; Selvarajan, R.; Nyoni, H.; Ntushelo, K.; Mamba, B.B.; Msagati, T.A. Diversity, co-occurrence and implications of fungal communities in wastewater treatment plants. Sci. Rep. 2019, 9, 14056. [Google Scholar] [CrossRef] [Green Version]
  46. Ping, Y.; Pan, X.; Li, W.; Wang, J.; Cui, L. The soil bacterial and fungal diversity were determined by the stoichiometric ratios of litter inputs: Evidence from a constructed wetland. Sci. Rep. 2019, 9, 13813. [Google Scholar] [CrossRef] [Green Version]
  47. Zhai, J.; Yan, G.; Cong, L.; Wu, Y.; Dai, L.; Zhang, Z.; Zhang, M. Assessing the effects of salinity and inundation on halophytes litter breakdown in yellow river delta wetland. Ecol. Indic. 2020, 115, 106405. [Google Scholar] [CrossRef]
  48. Kharitonov, S.; Shchegolkova, N.; Alexandrova, A.; Saynchuk, A.; Michel, P.; Maciejewski, K.; Gautier, M.; Gourdon, R.; Semenov, M.; Krasnov, G. Taxonomic diversity of fungi and bacteria in Azoé-NP® vertical flow constructed wetlands. Water 2022, 14, 698. [Google Scholar] [CrossRef]
  49. Zhang, H.; Wang, Y.; Chen, S.; Zhao, Z.; Feng, J.; Zhang, Z.; Lu, K.; Jia, J. Water bacterial and fungal community compositions associated with urban lakes, Xi’an, China. Int. J. Environ. Res. Public Health 2018, 15, 469. [Google Scholar] [CrossRef] [Green Version]
  50. Zhang, H.; Huang, T.; Chen, S.; Yang, X.; Lv, K.; Sekar, R. Abundance and diversity of bacteria in oxygen minimum drinking water reservoir sediments studied by quantitative PCR and pyrosequencing. Microb. Ecol. 2015, 69, 618–629. [Google Scholar] [CrossRef]
  51. Held, B.W.; Salomon, C.E.; Blanchette, R.A. Diverse subterranean fungi of an underground iron ore mine. PLoS ONE 2020, 15, e0234208. [Google Scholar] [CrossRef]
  52. Matei, G.; Matei, S.; Mocanu, V. Assessing the role of soil microbial communities of natural forest ecosystem. EuroBiotech J. 2020, 4, 1–7. [Google Scholar] [CrossRef] [Green Version]
  53. Martino, E.; Prandi, L.; Fenoglio, I.; Bonfante, P.; Perotto, S.; Fubini, B. Soil fungal hyphae bind and attack asbestos fibers. Angew. Chem. 2003, 115, 229–232. [Google Scholar] [CrossRef]
  54. Nguyen, T.T.; Park, S.W.; Pangging, M.; Lee, H.B. Molecular and morphological confirmation of three undescribed species of Mortierella from Korea. Mycobiology 2019, 47, 31–39. [Google Scholar] [CrossRef] [Green Version]
  55. Ozimek, E.; Jaroszuk-Ściseł, J.; Bohacz, J.; Korniłłowicz-Kowalska, T.; Tyśkiewicz, R.; Słomka, A.; Nowak, A.; Hanaka, A. Synthesis of indoleacetic acid, gibberellic acid and acc-deaminase by Mortierella strains promote winter wheat seedlings growth under different conditions. Int. J. Mol. Sci. 2018, 19, 3218. [Google Scholar] [CrossRef] [Green Version]
  56. Li, X.; Li, Y.; Zhao, X.; Zhang, X.; Zhao, Q.; Wang, X.; Li, Y. Restructured fungal community diversity and biological interactions promote metolachlor biodegradation in soil microbial fuel cells. Chemosphere 2019, 221, 735–749. [Google Scholar] [CrossRef]
  57. Li, F.; Chen, L.; Redmile-Gordon, M.; Zhang, J.; Zhang, C.; Ning, Q.; Li, W. Mortierella elongata’s roles in organic agriculture and crop growth promotion in a mineral soil. Land Degrad. Dev. 2018, 29, 1642–1651. [Google Scholar] [CrossRef]
Figure 1. Removal rates of the examined pollutants in different seasons. (Note: error bars denote the standard deviations of triplicate measurements. CW1 and CW2 refer to the treatment systems defined in Table 1).
Water 15 02291 g001
Figure 2. Distribution of the observed fungal communities. (a) Composition at phylum level. (b) The Venn diagram showing the distribution of the identified OTU. (c) Analysis of principal component (PC). (Note: The coordinate axes PC1 and PC2 show the differences in fungal composition. CW1 and CW2 refer to the treatment systems defined in Table 1 and their subscripts “in” and “out” denote, respectively, inlet and outlet of the two CW systems).
Water 15 02291 g002
Figure 3. Relative abundances of the identified fungal phyla and classes. (Note: phyla and classes are distinguished by colors, and their abundances are indicated by the length of the colored columns. CW1 and CW2 refer to the CW units defined in Table 1. CW1in and CW2in denote the inlet of CW1 and CW2, while CW1out and CW2out denote the outlet of CW1 and CW2.).
Water 15 02291 g003
Figure 4. Heatmap of the identified fungal genera. (Note: the legend color gradient shows the level of abundance. CW1 and CW2 refer to the CW units defined in Table 1. CW1in and CW2in denote the inlet of CW1 and CW2, while CW1out and CW2out denote the outlet of CW1 and CW2, respectively).
Water 15 02291 g004
Figure 5. Redundancy analysis (RDA) of fungal genera in CW1 (a) and CW2 (b). (Note: the dot indicates the sampling site. The length of the arrow denotes the correlation level. The angle between the red and black arrows lower or higher than 90o denotes the presence of a positive or a negative correlation. CW1 and CW2 refer to the treatment systems defined in Table 1.).
Water 15 02291 g005
Table 1. Parameter information of two wetland systems.
UnitArea (hm2)Dominant SpeciesDensity
(Plants/m2)
Other SpeciesHRTHLRPLR
CW12.10Zizania latifolia5Trapa natansa, Canna indicaa, Acorus calamusa
Oenanthe javanicab, Ipomoea trilobab, etc.
420.00740.21
CW22.14Phragmites communis5Myriophyllum verticillatuma, Hydrilla verticillateaErigeron canadensisb, Setaria viridisb, etc. 380.00930.25
Note: CW1: constructed wetland system with Zizania latifolia as the dominant species. CW2: constructed wetland system with Phragmites communis as the dominant species. HRT: annual average hydraulic retention time (day). HLR: annual average hydraulic loading rate based on surface area (m3/m2/d). PLR: annual average COD loading rate based on surface area (g/m2/d). a: cultivated plants, b: naturally germinated plants.
Table 2. Average annual water quality indexes and pollutant removal rates of the treatment systems (data obtained in 2020).
UnitSitepHCOD
(mg/L)
TN
(mg/L)
TP
(mg/L)
NH4+-N
(mg/L)
CW1Inlet8.0028.44 ± 7.861.42 ± 0.350.24 ± 0.040.51 ± 0.09
Outlet7.6718.38 ± 7.430.93 ± 0.320.16 ± 0.030.34 ± 0.12
Removal rateR%-35.9 ±13.135.2 ± 11.831.5 ± 13.633.9 ± 17.7
CW2Inlet7.9827.15 ± 2.751.30 ± 0.110.24 ± 0.020.45 ± 0.08
Outlet7.7019.56 ± 3.390.93 ± 0.200.19 ± 0.020.36 ± 0.11
Removal rateR%-27.6 ± 11.829.0 ± 11.923.0 ± 10.221.3 ± 13.3
Class III 6~920.01.00.21.0
Note: treatment units CW1 and CW2 refer to the constructed wetlands defined in Table 1. Class III: stipulated national surface water quality standards. COD: chemical oxygen demand; TN: total nitrogen; TP: total phosphorus; NH4+-N: ammonia nitrogen.
Table 3. Coefficient of the correlation between plant community index and pollutant removal rate.
R (%)CODTNTPNH4+-N
IndexCW1CW2CW1CW2CW1CW2CW1CW2
Margalef (richness)0.9380.9460.9890.9570.9610.8270.9640.923
Simpson (diversity)0.9940.9700.9650.9840.9570.8870.9070.911
Shannon–Weiner (diversity)0.9780.8810.8520.8970.8210.7270.7490.940
Pielou (evenness)0.9760.9280.9570.9340.9210.7840.8990.913
Note: CW1 and CW2 refer to the treatment systems defined in Table 1.
Table 4. The total number of OTU and the α diversity index of the sediment fungal communities.
UnitSiteOTUChaoShannon–WeinerGood’s Coverage
Inlet2337920.05 ± 197.35 a4.97 ± 0.11 a0.9988
CW1Outlet1017350.13 ± 70.21 c3.95 ± 0.52 c0.9996
Total3354
Inlet1881627.41 ± 137.75 b4.49 ± 0.33 b0.9994
CW2Outlet1551464.66 ± 95.55 bc4.08 ± 0.26 bc0.9996
Total2432
Note: the values of the Chao, Shannon–Weiner and Good’s coverage indexes were provided by the Illumina’s Miseq PE300 platform. The superscripts a, b, c indicate the levels of significance for the difference between listed values (p ≤ 0.05). CW1 and CW2 refer to the treatment units defined in Table 1.
Disclaimer/Publisher’s Note: The statements, opinions and data contained in all publications are solely those of the individual author(s) and contributor(s) and not of MDPI and/or the editor(s). MDPI and/or the editor(s) disclaim responsibility for any injury to people or property resulting from any ideas, methods, instructions or products referred to in the content.

