
Water Cycle Health Assessment Using the Combined Weights and Relative Preference Relationship VIKOR Model: A Case Study in the Zheng-Bian-Luo Region, Henan Province

Abstract
:1. Introduction
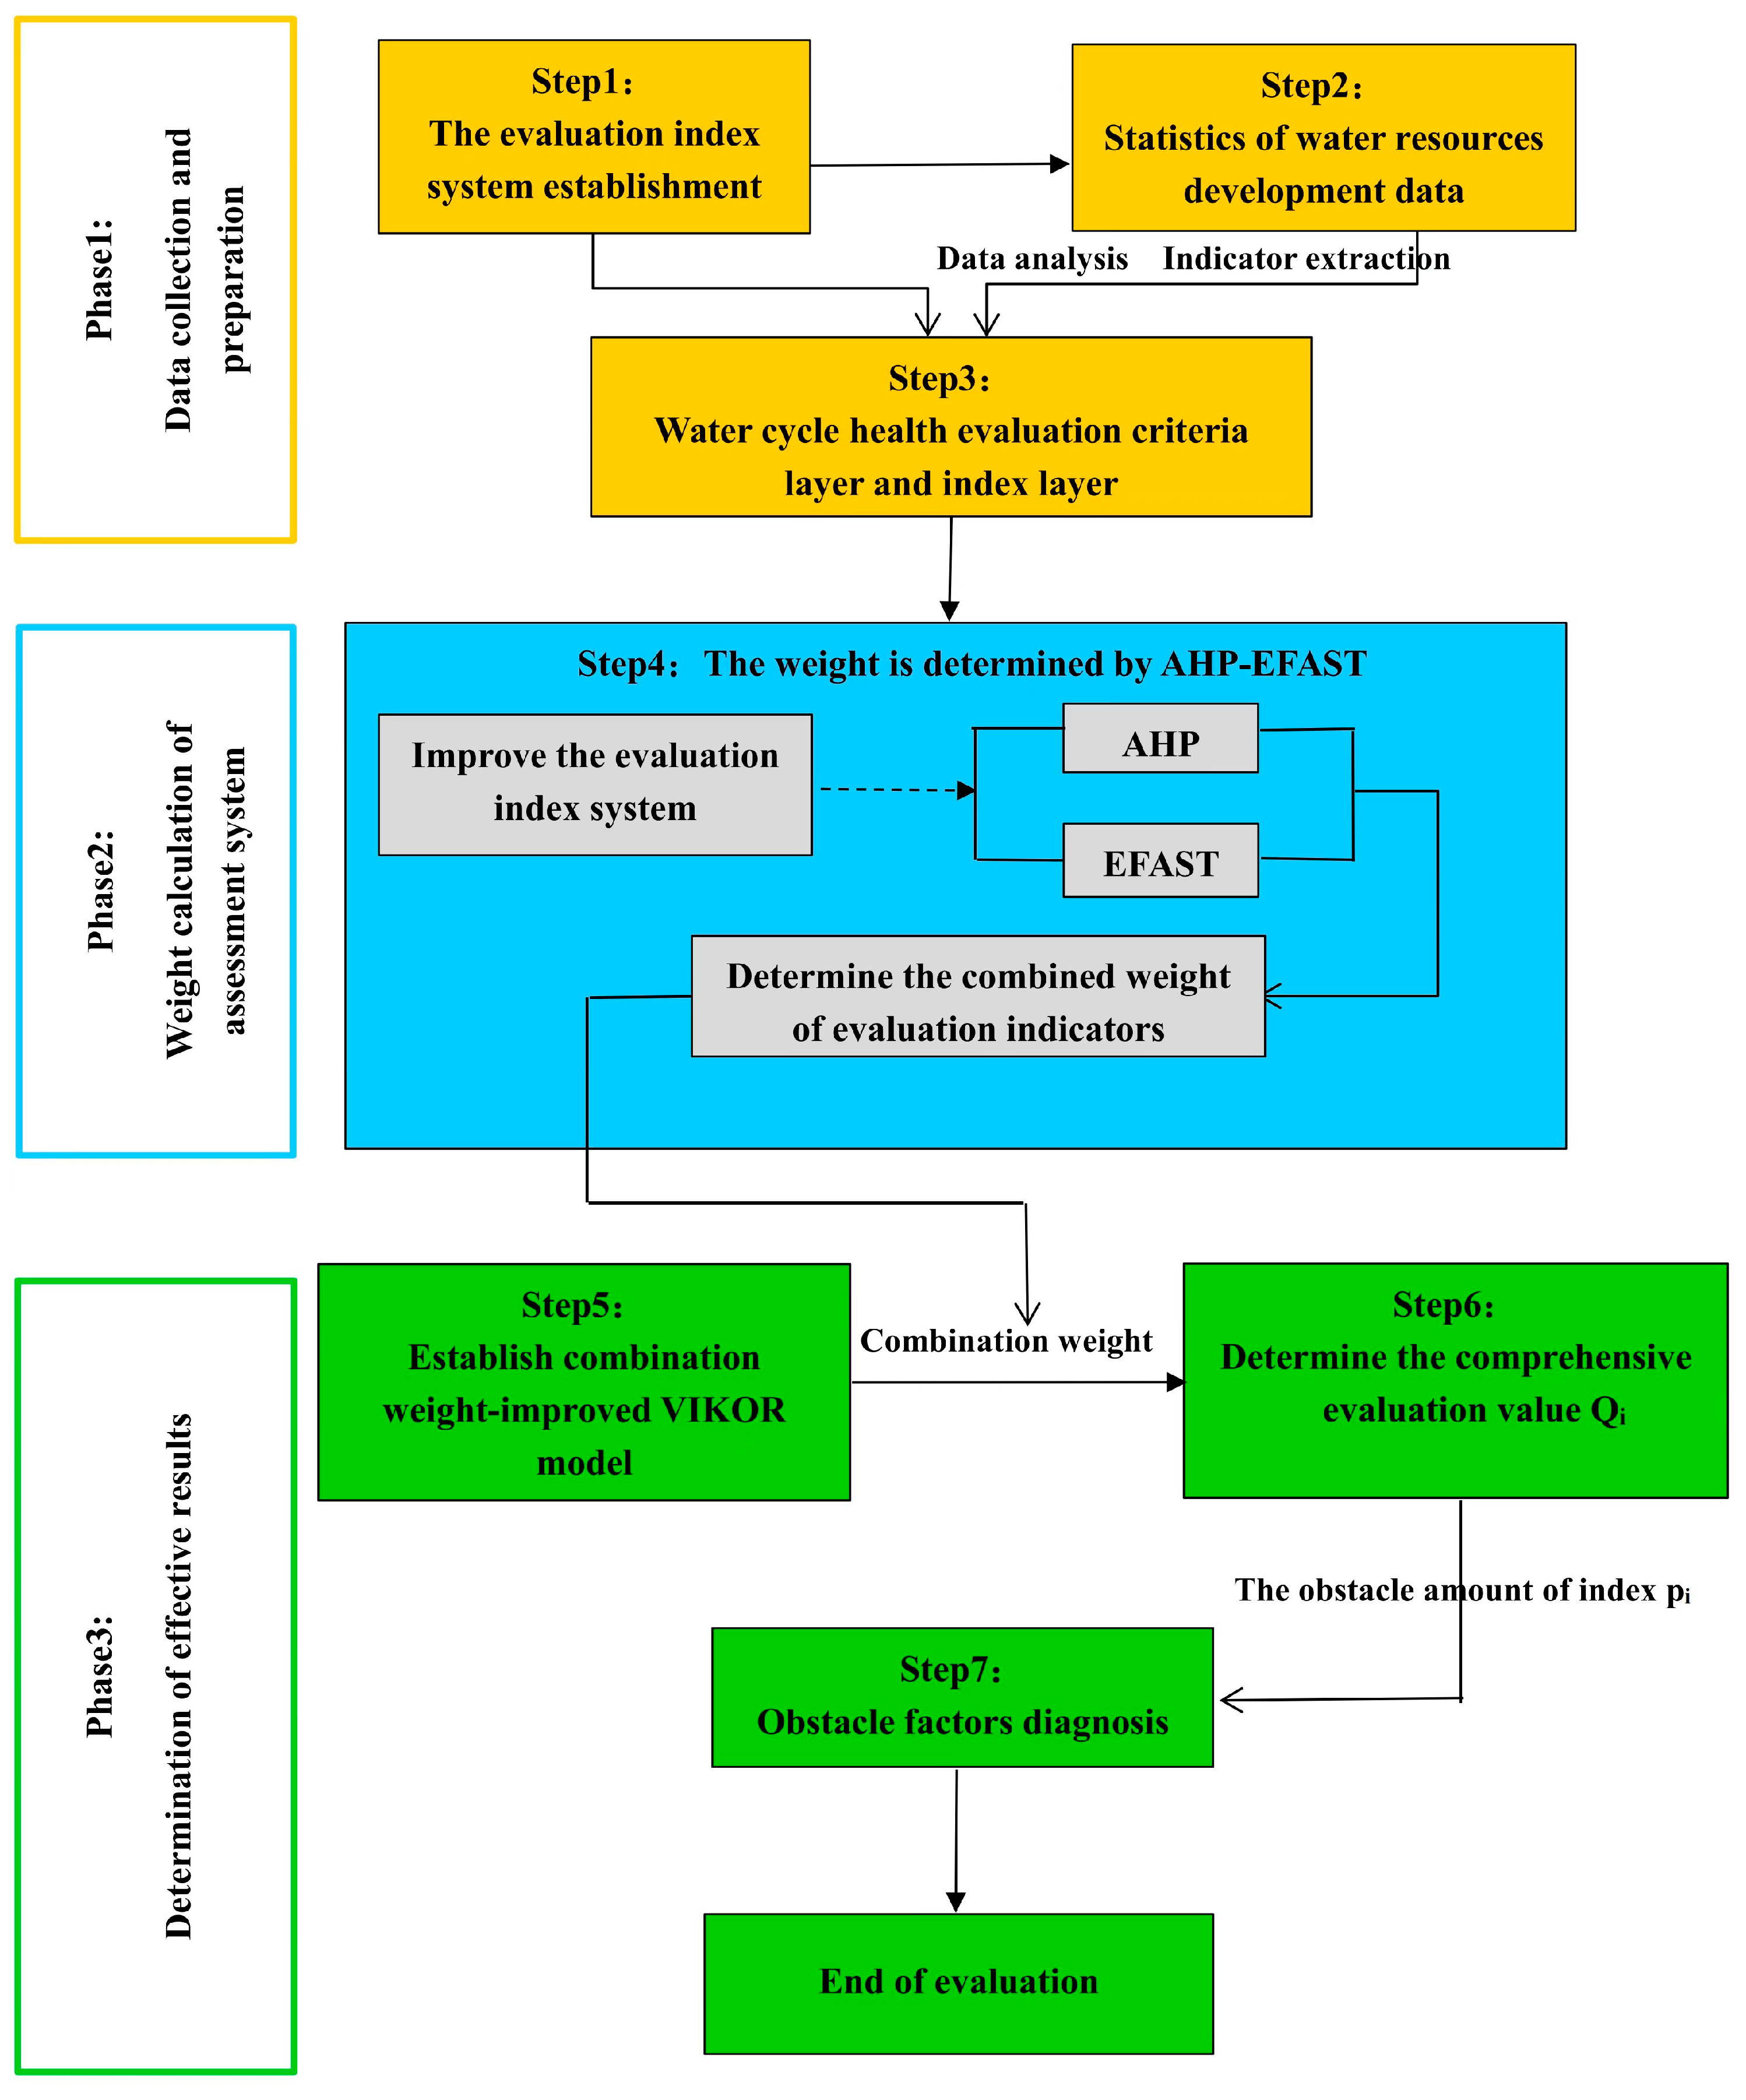
2. Materials and Methods
2.1. Study Area
2.2. Data Source
2.3. Establishment of the Evaluation Index System
Evaluation Indicator Threshold Standard
2.4. Research Methods
2.4.1. AHP-EFAST Algorithm
2.4.2. Upgraded VIKOR Technique
2.4.3. Obstacle Factor Analysis
3. Results and Discussion
3.1. Weight Calculation Results
3.2. Evaluation of Index Layer
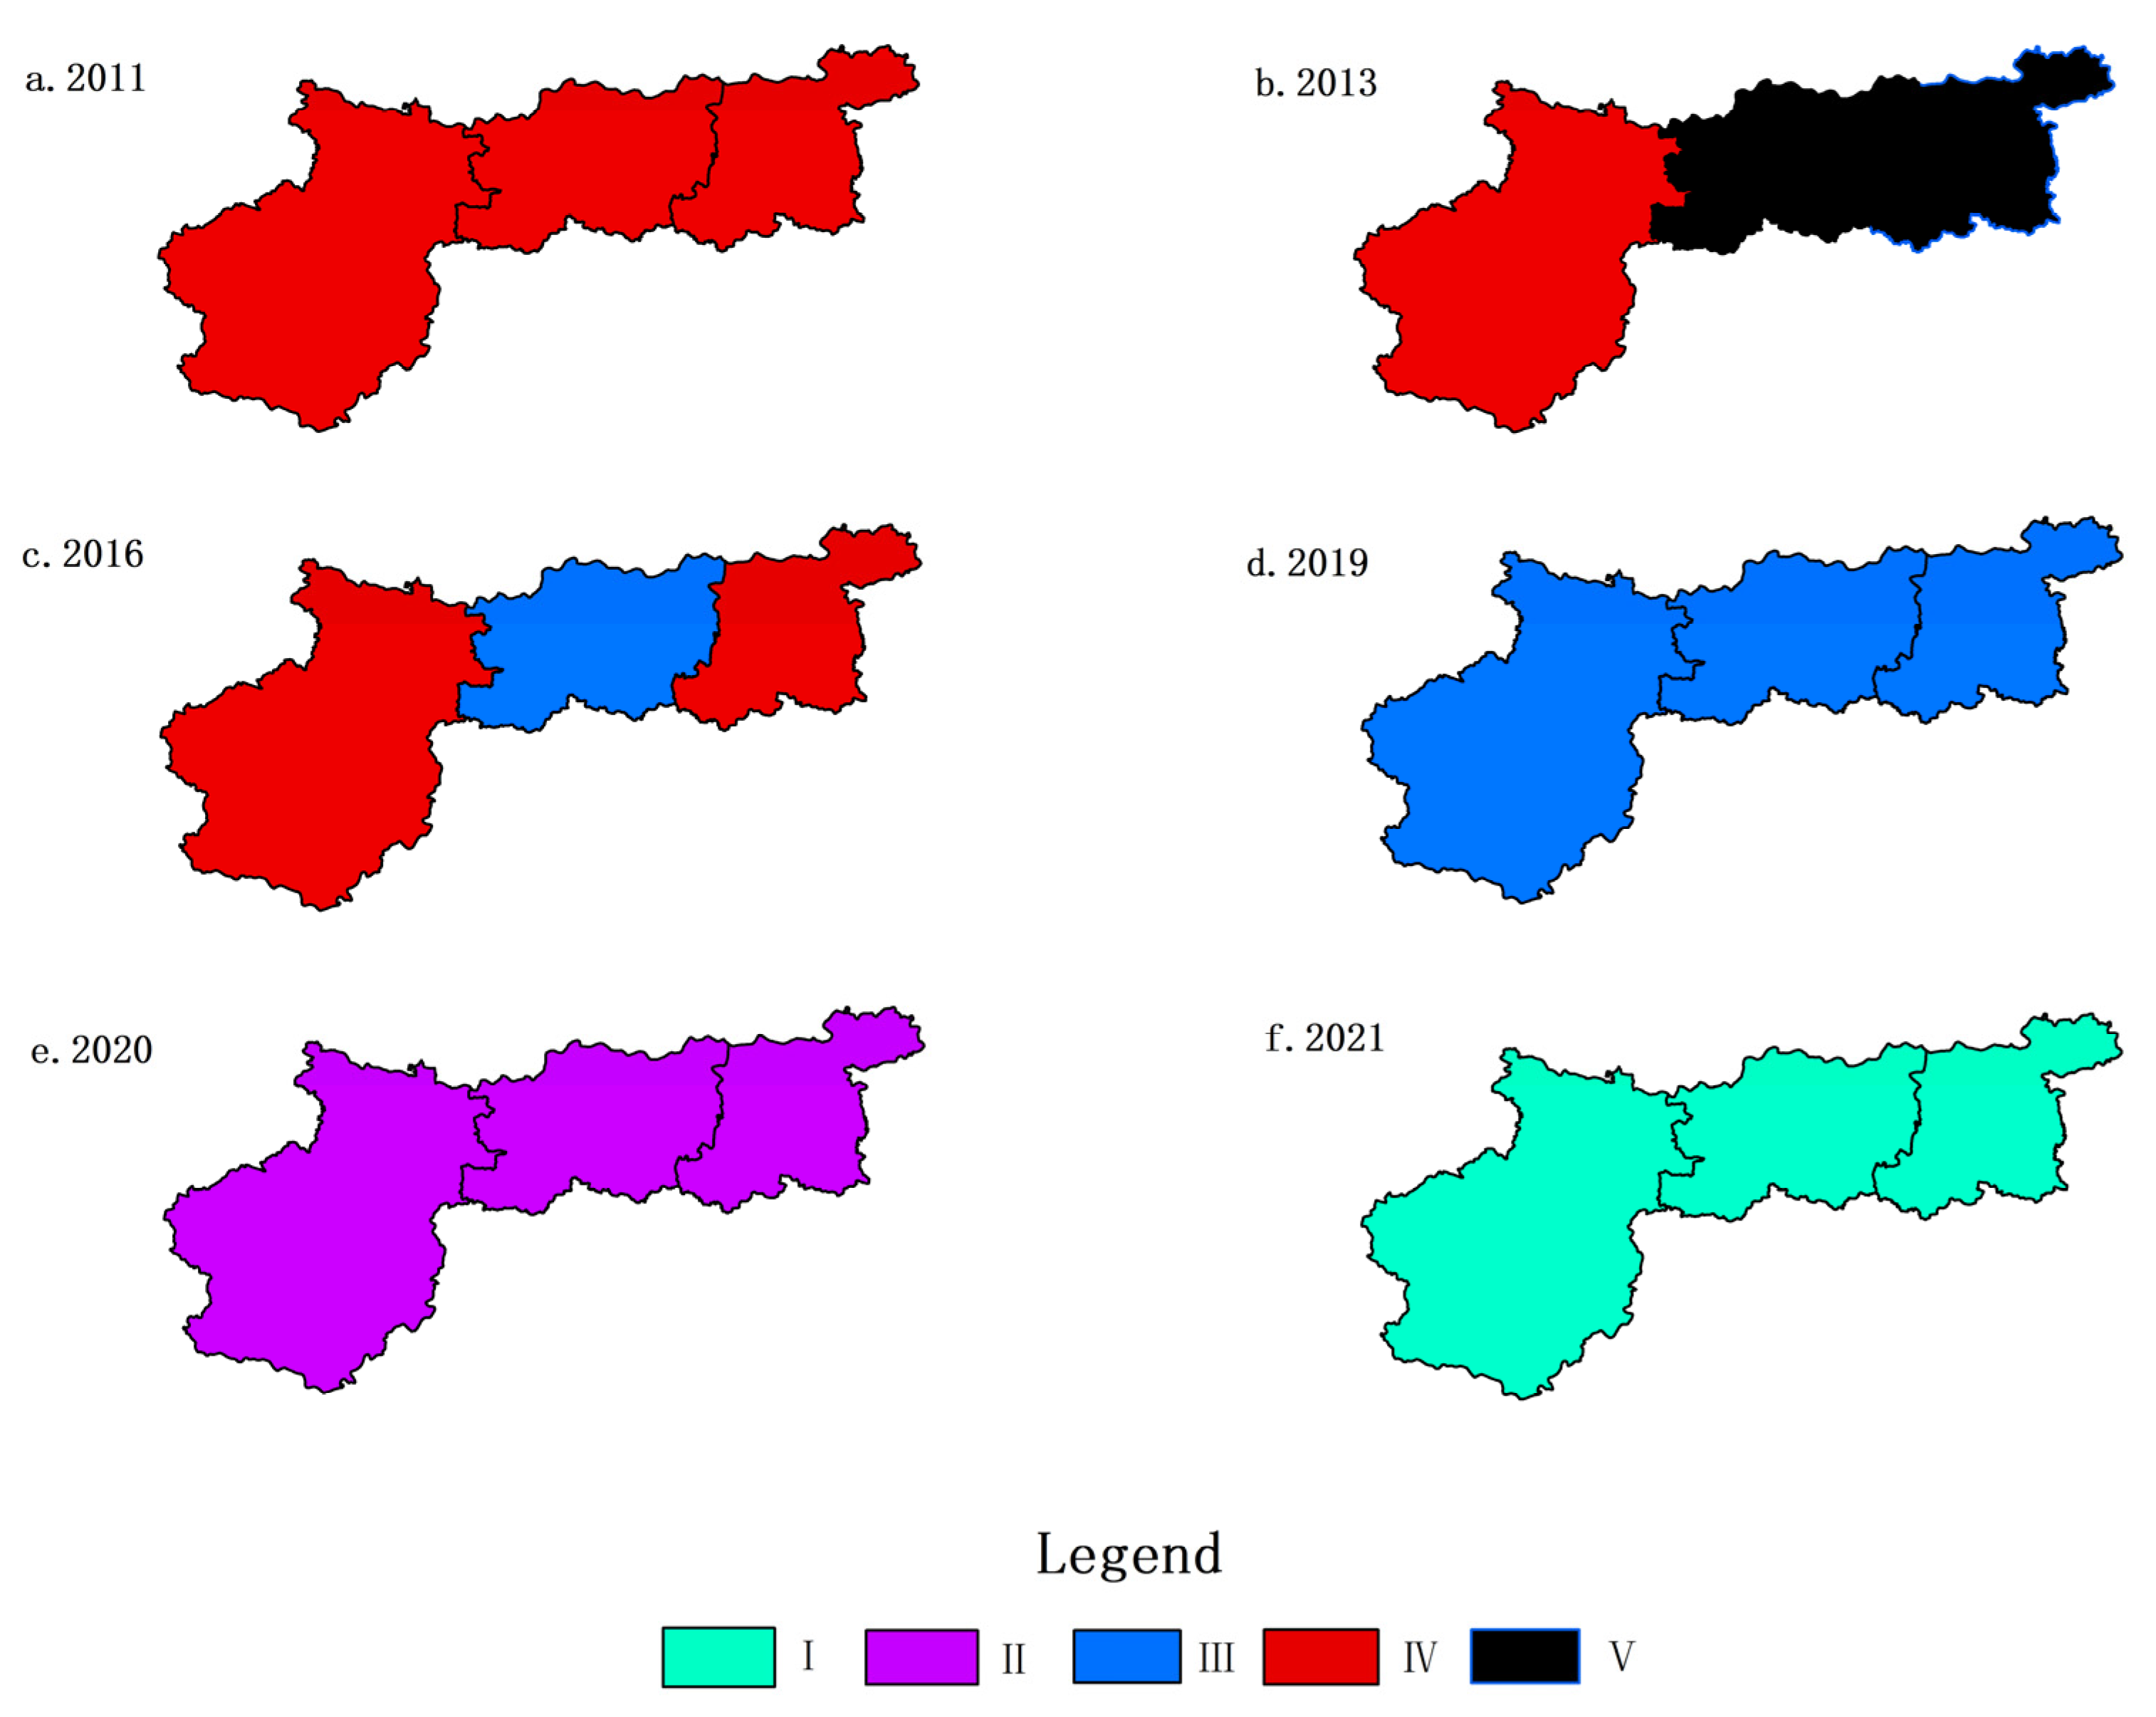
3.3. Evaluation of Target Layer
3.3.1. The Calculation Result of the Comprehensive Evaluation Value
3.3.2. Analysis of the Findings of the Water Cycle Health Assessment
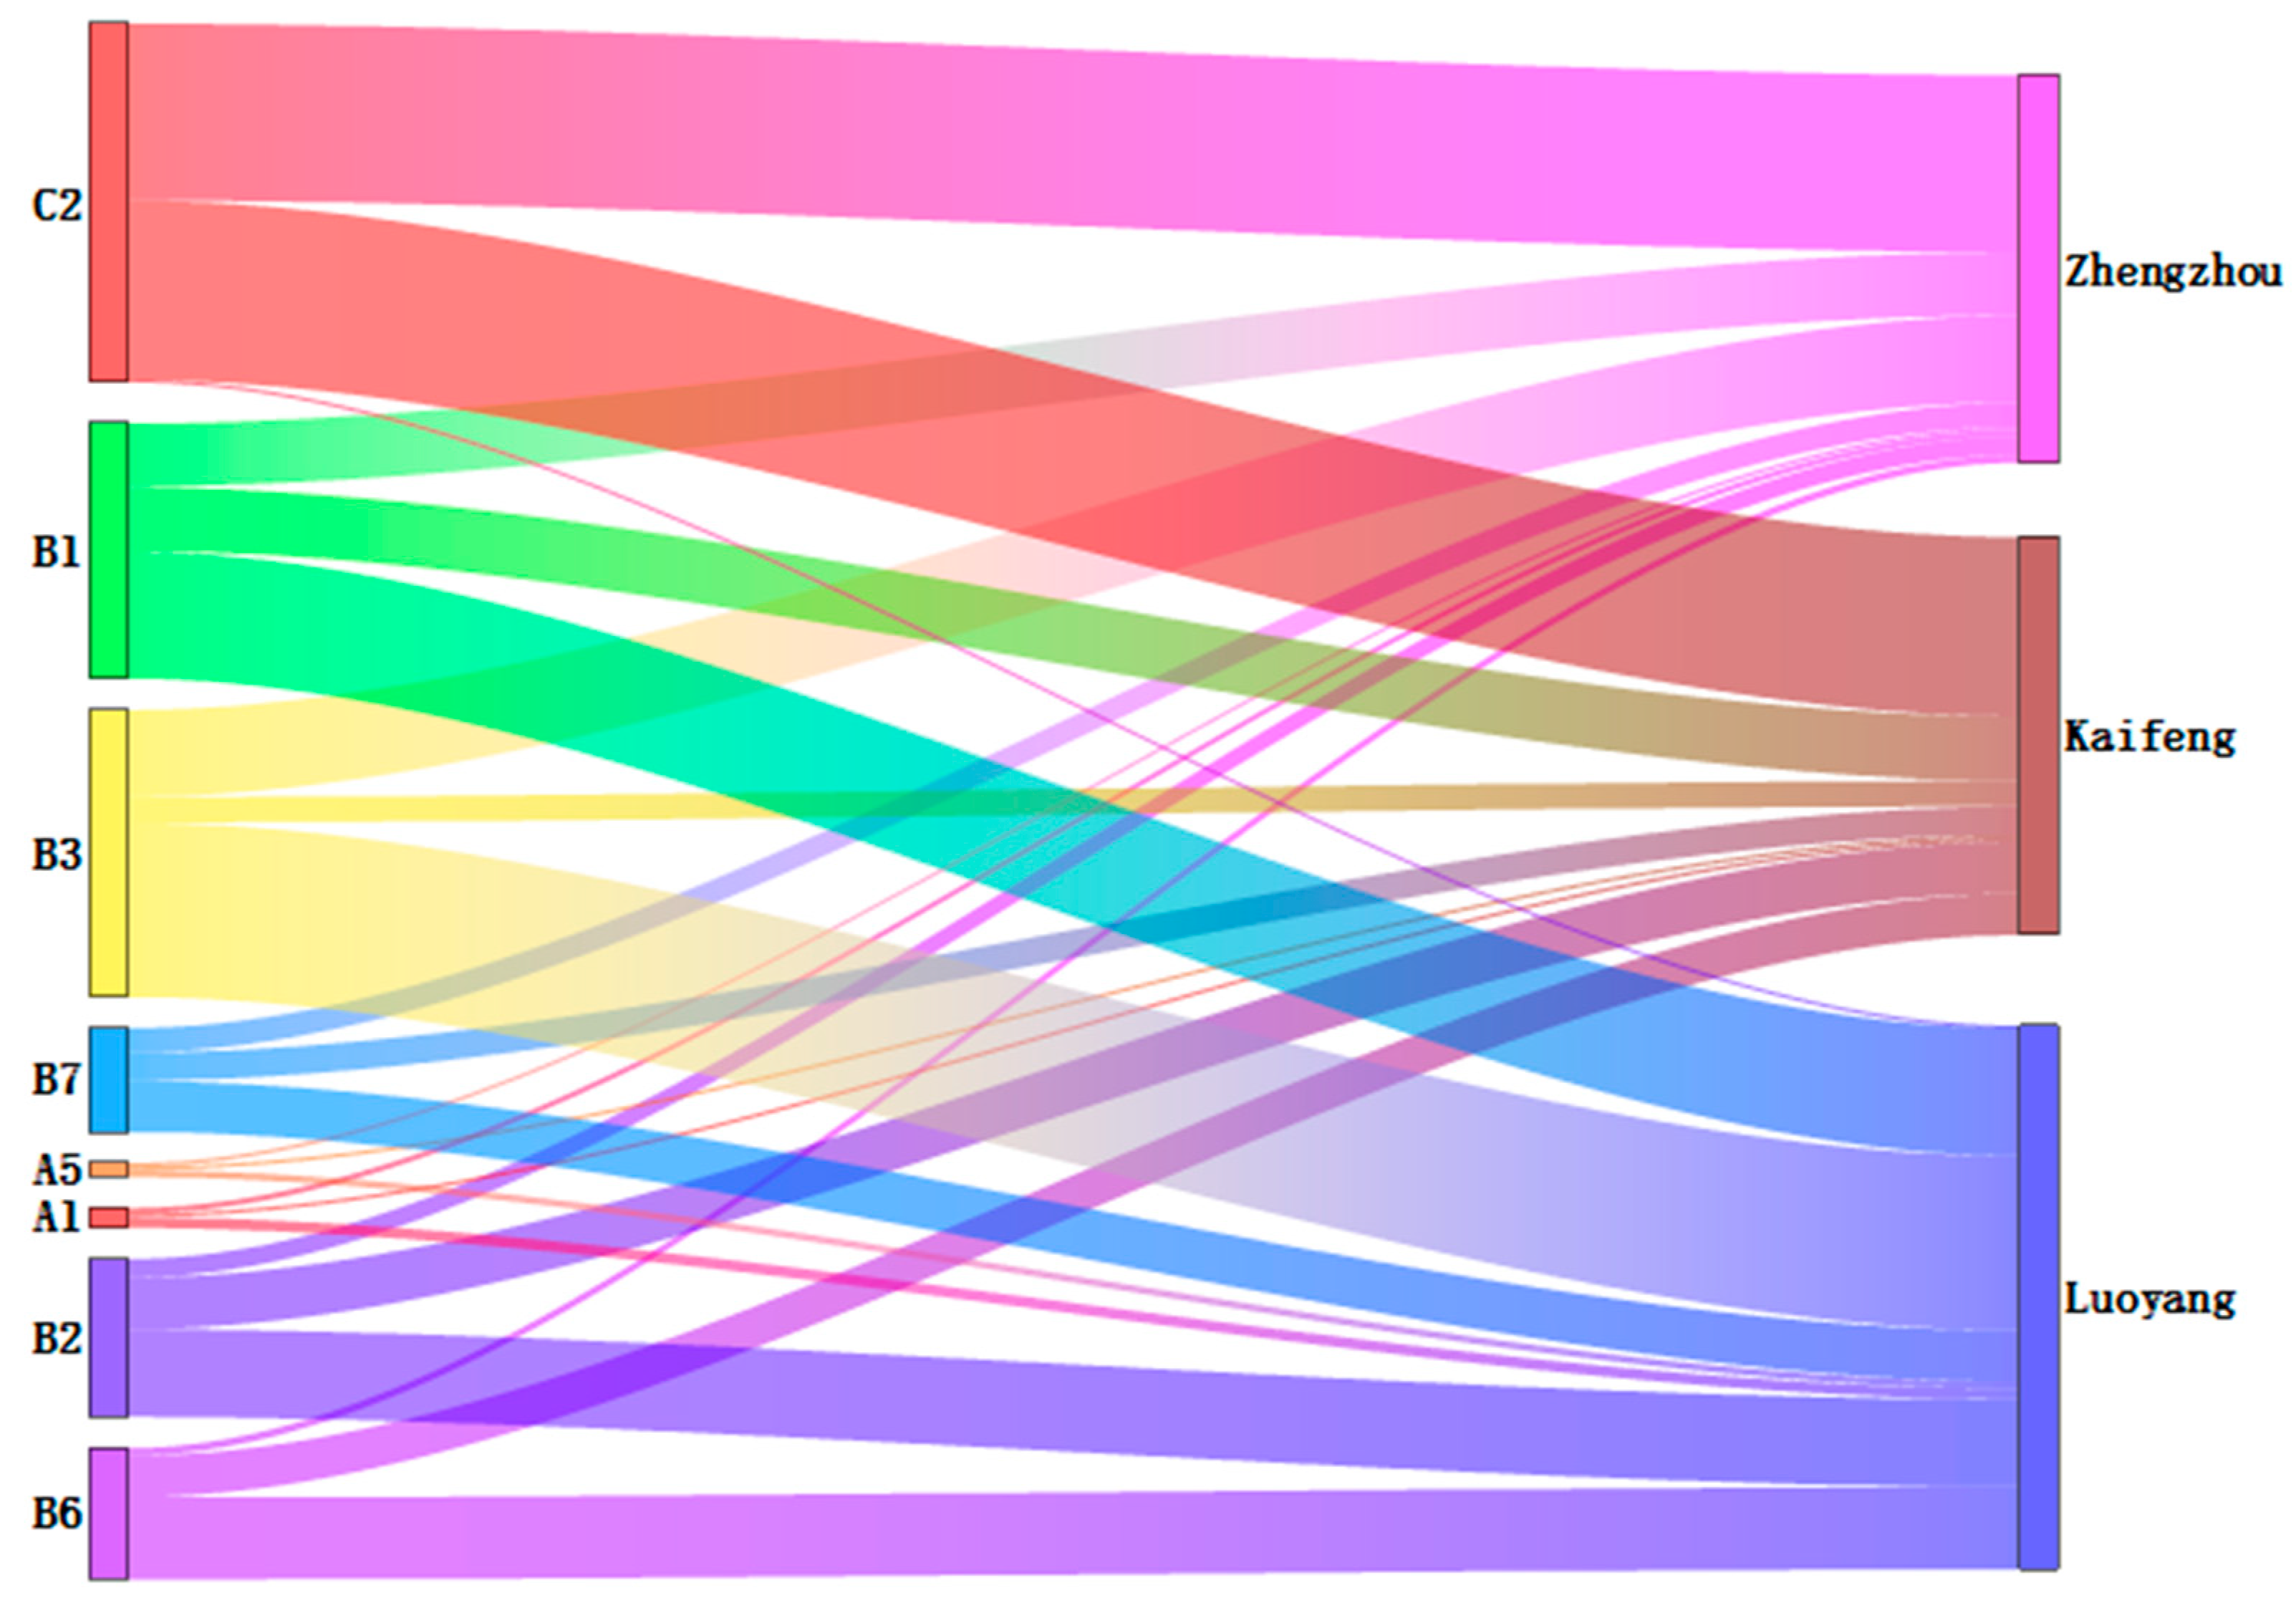
3.4. Factor Analysis of Water Circulation Health Disorders
- (1)
- The main influencing factor of Zhengzhou and Kaifeng is the compliance rate of drinking water (C4), which also confirms that the two cities are currently using the water source provided by the “South-to-North Water Diversion” project. Therefore, the key to improving the health of the Zhengzhou and Kaifeng water cycle is to increase the protection of the ecological environment, increase the restoration of the wetlands, and block the various river sewage outlets to reduce water pollution. Comprehensive water use per person (B3) and the water use of CNY 10,000 industrial-added value (B1) are the two primary variables affecting Luoyang. As a result, enhancing the development and usage of water resources and distributing water sensibly is essential in improving the health of the water cycle in Luoyang.
- (2)
- For cities with rapid economic development, we should strengthen the ecological protection of such cities, continue to promote water-saving equipment and enhance citizens’ awareness of water-saving. Cities with good water resource conditions should give full play to their natural advantages and develop and utilize water resources scientifically and rationally according to the actual local situation so as to achieve the purpose of sustainable development. In the process of economic development, underdeveloped areas should pay attention to the protection of the ecological environment and achieve harmony between man and nature.
- (3)
- All localities should strengthen communication and exchanges. Cities with good water cycles should actively promote their own experience, while cities with poor water cycles should combine their own reality, improve, accordingly, on this basis, and adjust the industrial structure appropriately so as to improve their water cycle and promote sustainable development in the region.
3.5. Method Validity Test
4. Conclusions
- (1)
- Between 2011 and 2021, the Zheng-Bian-Luo region’s water cycle health status was expected to increase significantly. In the Zheng-Bian-Luo region, the average comprehensive evaluation value, (distance from ideal solution), decreased from 0.447 in 2011 to 0.00 in 2021 (distance from the perfect solution is 0, which is the ideal solution). There are some differences in the health level and improvement rate of the water cycle between different regions, but the overall comprehensive evaluation value has been improved after 2014, indicating that all regions have adopted a series of measures suitable for local development according to their own actual situation, reflecting the observation of the trend of indicators. It is useful for the choice of future planning actions and also reflects the importance of human beings to the healthy development of the water cycle.
- (2)
- The evaluation results of the health of the water cycle in the Zheng-Bian-Luo region show high consistency across the three techniques. However, each year’s health status varies a little bit. The aggregation function was replaced by a relative preference relationship in the improved VIKOR model, and the distance between the positive and negative ideal solutions was taken into account. As a result, the traditional VIKOR model’s use of only the positive ideal solution, which results in falsely high actual evaluation values, cannot objectively and steadily evaluate the data of each index; this was avoided by using the improved VIKOR model.
- (3)
- The compliance rate of drinking water sources, the per capita comprehensive water consumption, the water consumption per CNY 10,000 of industrial-added value, the water consumption per CNY 10,000 of GDP, the average water consumption per mu of farmland irrigation, the domestic water consumption rate, the proportion of groundwater supply, and the proportion of agricultural water are the main factors obstructing the improvement of water cycle health in the Zheng-Bian-Luo area. The key to raising the water cycle’s health level in the Zheng-Bian-Luo region will be to handle this set of indications with science and reason.
Author Contributions
Funding
Data Availability Statement
Conflicts of Interest
References
- Zhao, M.; Li, J.; Zhang, J.; Han, Y.; Cao, R. Research on Evaluation Method for Urban Water Circulation Health and Related Applications: A Case Study of Zhengzhou City, Henan Province. Int. J. Environ. Res. Public Health 2022, 19, 10552. [Google Scholar] [CrossRef] [PubMed]
- Zhao, M.; Li, J.; Zhang, Y.; Han, Y.; Wei, J. Water cycle health assessment based on combined weight and hook trapezoid fuzzy TOPSIS model: A case study of nine provinces in the Yellow River basin, China. Ecol. Indic. 2023, 147, 109977. [Google Scholar] [CrossRef]
- Al Juaidi Ahmed, E.M.; Al Shotairy Ahmed, S. Evaluation of municipal water supply system options using water evaluation and planning system (WEAP): Jeddah case study. Desalin. Water Treat. 2020, 176, 317–323. [Google Scholar] [CrossRef]
- Zhang, J.; Xiong, B.Y. Implementation strategy of healthy circulation of urban water system. J. Beijing Univ. Technol. 2004, 185–189. [Google Scholar]
- Xu, X.J.; Wang, Z.H.; Liu, Z.F.; Tan, H.O. Research on the establishment of urban water health cycle. J. Shandong Agric. Univ. (Nat. Sci.) 2006, 4, 609–614. [Google Scholar]
- Tang, J.Z.; Xia, W.; Zhou, W.B.; Luo, H.; Yang, A.M. Xi’an water cycle health evaluation based on key performance indicators. South—North Water Transf. Water Sci. Technol. 2019, 17, 39–45+60. [Google Scholar]
- Wang, Q. Health Assessment of Farmland Water Cycle in irrigation area of North China Plain. Mater’s Thesis, Hebei University of Engineering, Handan, China, 2021. [Google Scholar] [CrossRef]
- Chen, J.L. Preliminary Study on Regional Water Cycle Health Assessment. Mater’s Thesis, Ningxia University, Ningxia, China, 2020. [Google Scholar]
- Ma, J.; Duan, N.; Lu, R.L.; Luan, Q.H.; Wang, Q. Health evaluation methods of water-cycle and related applications: A case study on Handan City. Sci. Technol. Eng. 2021, 21, 14372–14378. [Google Scholar]
- Ma, J.; Duan, N.; Lu, R.L.; Luan, Q.H.; Wang, Q. Comprehensive evaluation of water resources carrying capacity in Weifang based on the VIKOR method. Acta Sci. Circumstantiae 2020, 40, 716–723. [Google Scholar]
- Li, Y.J.; Li, Q.H.; Jiao, S.L. River health evaluation based on improved analytic hierarchy process, CRITIC method and compound fuzzy matter-element VIKOR model. Chin. J. Ecol. 2022, 41, 822–832. [Google Scholar]
- Li, N.; Xue, M.G.; Yang, G.W. Sustainability Evaluation and Optimization of Packaging Scheme Based on Entropy Weight-VIKOR. Digit. Print. 2022, 6, 85–91. [Google Scholar]
- He, G.; Hou, X.Y.; Wang, X.D.; Zhao, S.H. Evaluation of Soil and Water Ecological Security for Mining Cities in Anhui Province Based on VIKOR Model. Bull. Soil Water Conserv. 2022, 42, 161–171. [Google Scholar] [CrossRef]
- Wang, L.Y.; Huang, X.; Li, H.M. Evaluation of Water Resource Carrying Capacity in Nine Provinces in the Yellow River Basin Based on CW-FSPA. China Rural. Water Hydropower 2021, 9, 67–75. [Google Scholar]
- Bai, F.F.; Qi, X.B.; Qiao, D.M.; Han, Y.; Zhao, Y.L.; Lu, H.F. Evaluation of Agricultural Water Resource Utilization Efficiency and Obstacle Factor Diagnoses in Nine Provinces of the Yellow River Basin. J. Soil Water Conserv. 2022, 36, 146–152. [Google Scholar]
- Gani, A.; Scrimgeour, F. Modeling governance and water pollution using the institutional ecological economic framework. Econ. Model. 2014, 42, 363–372. [Google Scholar] [CrossRef]
- Deng, X.; Xu, Y.; Han, L.; Yu, Z.; Yang, M.; Pan, G. Assessment of river health based on an improved entropy-based fuzzy matter-element model in the Taihu Plain, China. Ecol. Indic. 2015, 57, 85–95. [Google Scholar] [CrossRef]
- Meneses, M.; Pasqualino, J.C.; Castells, F. Environmental assessment of urban wastewater reuse: Treatment alternatives and applications. Chemosphere 2010, 81, 266–272. [Google Scholar] [CrossRef] [PubMed]
- Pinto, U.; Maheshwari, B.L. River health assessment in peri-urban landscapes: An application of multivariate analysis to identify the key variables. Water Res. 2011, 45, 3915–3924. [Google Scholar] [CrossRef] [PubMed]
- Deng, Y.X.; Lv, H.X. Research on the Evolution Trend of Zheng-Bian-Luo’s Tourism Economic Differences and Its Influencing factors. J. Anyang Norm. Univ. 2022, 5, 71–76. [Google Scholar] [CrossRef]
- Zhao, R.; Meng, Y.W.; Liu, Z.L.; Song, Y.P. Spatial Pattern and its influencing factors of A-level tourist attractions in Zhengzhou-Kaifeng-Luoyang Based on Network Attention Level. J. Henan Univ. (Nat. Sci.) 2021, 51, 268–279. [Google Scholar]
- Chen, H.; Cui, G. (Eds.) ‘Henan Statistical Yearbook-2021’ Editorial Committee and Editorial Department Staff List. In Henan Statistical Yearbook; China Statistical Publishing House: Beijing, China, 2021; pp. 5–6. [Google Scholar]
- Li, J.; Gong, D.X.; Mo, L.; Ma, X.H. Reflection on the Construction of Sponge City According to Local Conditions from the Perspective of the Urban Healthy Water Cycle. China Water Wastewater 2022, 38, 94–99. [Google Scholar]
- Pan, Y.; Rong, S.L. Study of Water resources Allocation of HaidongBased on Healthy Hydrological Cycle Theory. China Acad. J. Electron. Publ. House 2018, 37 (Suppl. S1), 38–43. [Google Scholar]
- Zhang, S.; Fan, W.; Yi, Y.; Zhao, Y.; Liu, J. Evaluation method for regional water cycle health based on nature-society water cycle theory. J. Hydrol. 2017, 551, 352–364. [Google Scholar] [CrossRef]
- Vilasan, R.T.; Kapse, V.S. Evaluation of the prediction capability of AHP and F-AHP methods in flood susceptibility mapping of Ernakulam district (India). Nat. Hazards prepublish. 2022. [Google Scholar] [CrossRef]
- Yu, S.; Ding, H.; Zeng, Y. Evaluating water-yield property of karst aquifer based on the AHP and CV. Sci. Rep. 2022, 12, 3308. [Google Scholar] [CrossRef]
- Ma, Z.; Zhao, H.R.; Huo, H.J.; Lu, H. Comprehensive Evaluation of User Energy Storage System Configuration Schemes Based on the Improved Triangular Fuzzy VIKOR Method. Electr. Power 2022, 55, 185–191. [Google Scholar]
- Xu, S.D.; Geng, X.L. Remanufacturing Scheme Selection Approach of Mechanical Product Based on Fuzzy VIKOR. Mach. Des. Res. 2016, 32, 120–124. [Google Scholar]
- Xu, X.H.; Ye, L.; Pei, Y.; Zhao, L.; Wang, J.J. Research on the Comprehensive Evaluation of the Higher Education System Based on FCE and ARMA Models. Complexity 2022, 2022, 3142579. [Google Scholar] [CrossRef]
- Xu, S.; Sun, Y. Research on Evaluation of Green Smart Building Based on Improved AHP-FCE Method. Comput. Intell. Neurosci. 2021, 2021, 5485671. [Google Scholar] [CrossRef]


| Criterion Layer | Index Layer | I | II | III | IV | V | Attribute |
|---|---|---|---|---|---|---|---|
| 5 | (5,4] | (4,3] | (3,2] | (2,1] | |||
| Water abundance A | A1/% | [10,25) | [25,40) | [40,55) | [55,70) | [70,100) | Negative |
| A2/108 × m3 | >10 | [10,8) | [8,6) | [6,4) | ≤4 | Positive | |
| A3/mm | [650,600) | [600,550) | [550,500) | [500,450) | ≤450 | Positive | |
| A4 | [0.5,0.4) | [0.4,0.3) | [0.3,0.2) | [0.2,0.1) | ≤0.1 | Positive | |
| A5/% | [10,25) | [25,40) | [40,55) | [55,70) | [70,100) | Negative | |
| Water utility B | B1/m3 | [10,25) | [25,50) | [50,100) | [100,150) | ≥150 | Negative |
| B2/m3 | ≥150 | (150,100] | (100,80] | (80,50] | ≤5 | Positive | |
| B3/m3 | >200 | [200,150) | [150,90) | [90,50) | ≤50 | Positive | |
| B4 | [0.85,0.75) | [0.75,0.65) | [0.65,0.55) | [0.55,0.45) | [0.45,0) | Positive | |
| B5/% | [100,95) | [95,90) | [90,85) | [85,80) | ≤80 | Positive | |
| B6/% | ≤10 | (10,20] | (20,30] | (30,50] | >50 | Negative | |
| B7/(m3/CNY 10,000) | [10,25) | [25,50) | [50,100) | [100,150) | ≥150 | Negative | |
| Water quality C | C1/108 × m3 | 5 | (5,4] | (4,3] | (3,2] | (2,1] | Negative |
| C2/% | 100 | (100,95] | (95,90] | (90,80] | <80 | Positive | |
| C3/% | [100,90) | [95,60) | [60,40) | [40,20) | [20,0) | Positive | |
| C4/% | [100,60) | [60,50) | [50,30) | [30,20) | [20,0) | Positive | |
| C5/% | [100,95) | [95,90) | [90,85) | [85,80) | ≤80 | Positive | |
| Water ecology D | D1/% | [100,50) | [50,40) | [40,30) | [30,20) | [20,10) | Positive |
| D2/108 × m3 | [10,5) | [5,4) | [4,3) | [3,2) | [2,0) | Positive | |
| D3 | Strong | Stronger | Fair | Weaker | Weak | Positive | |
| D4/km km−2 | >15 | [15,12) | [12,9) | [9,6) | ≤6 | Positive | |
| D5/m | ≤−2 | (−2,−1] | (−1,0] | (0,1] | >1 | Positive |
| Order | 1 or 2 | 3 | 4 | 5 | 6 | 7 | 8 | 9 |
|---|---|---|---|---|---|---|---|---|
| 0 | 0.52 | 0.89 | 1.12 | 1.26 | 1.36 | 1.41 | 1.46 |
| Variable | Interpretation | Variable | Interpretation |
|---|---|---|---|
| xij | the evaluation index’s initial value | rij | the index’s value |
| j | the jth index’s mean value | Sj | its standard deviation. |
| V | the overall variance of the model’s output | the variance of the indicator | |
| the variance of the interaction between the indicators and | the variance of the interaction between the indicators , , and | ||
| the variance of the interaction of the indicator through the remaining n−1 indicators. | the first-order sensitivity index | ||
| the coupling effect of indicator , along with other indicators | the weight value for the indicator combination | ||
| he subjective weight result produced from AHP | the objective weight result derived from the EFAST algorithm. | ||
| the jth evaluation index’s standardized data from the ith program | denotes the index’s original data from the same program | ||
| the collection of data based on benefits | the collection of indicators based on costs. | ||
| the group benefit value | the individual regret value | ||
| the index distance | the standard distance | ||
| the coefficient of the maximum group utility decision strategy | the categorization indication’s weight for the ith indicator. | ||
| The combined indicator’s weight of it. | the relative preference relation operator | ||
| stands for water cycle health | the indicator’s barrier degree |
| City/Years | 2011 | 2012 | 2013 | 2014 | 2015 | 2016 | 2017 | 2018 | 2019 | 2020 | 2021 |
|---|---|---|---|---|---|---|---|---|---|---|---|
| Zhengzhou | 0.464 | 0.871 | 0.863 | 0.697 | 0.689 | 0.389 | 0.474 | 0.340 | 0.289 | 0.284 | 0.000 |
| Kaifeng | 0.449 | 0.821 | 0.965 | 0.874 | 0.753 | 0.673 | 0.514 | 0.534 | 0.373 | 0.227 | 0.000 |
| Luoyang | 0.428 | 1.000 | 0.674 | 0.444 | 0.627 | 0.609 | 0.390 | 0.263 | 0.312 | 0.270 | 0.000 |
| Average | 0.447 | 0.897 | 0.834 | 0.672 | 0.690 | 0.557 | 0.459 | 0.379 | 0.325 | 0.260 | 0.000 |
| Level I Critical value | 0.18 | 0.17 | 0.18 | 0.17 | 0.16 | 0.16 | 0.19 | 0.15 | 0.15 | 0.14 | 0.14 |
| Level II Critical value | 0.26 | 0.27 | 0.25 | 0.29 | 0.28 | 0.29 | 0.29 | 0.28 | 0.28 | 0.29 | 0.29 |
| Level III Critical value | 0.42 | 0.43 | 0.42 | 0.41 | 0.44 | 0.45 | 0.44 | 0.42 | 0.45 | 0.44 | 0.44 |
| Level IV Critical value | 0.85 | 0.83 | 0.84 | 0.85 | 0.79 | 0.78 | 0.79 | 0.81 | 0.77 | 0.78 | 0.78 |
| City/Years | 2011 | 2012 | 2013 | 2014 | 2015 | 2016 | 2017 | 2018 | 2019 | 2020 | 2021 |
|---|---|---|---|---|---|---|---|---|---|---|---|
| Zhengzhou | IV | V | V | IV | IV | III | IV | III | III | II | I |
| Kaifeng | IV | IV | V | V | IV | IV | IV | IV | III | II | I |
| Luoyang | IV | V | IV | IV | IV | IV | III | II | III | II | I |
| City/Indicator | C2 | B3 | B1 | B7 | B2 | B6 | A1 | A5 |
|---|---|---|---|---|---|---|---|---|
| Zhengzhou | 32.38 | 15.94 | 11.65 | 4.48 | 3.42 | 1.43 | 1.05 | 0.67 |
| Kaifeng | 32.83 | 4.69 | 11.81 | 5.19 | 9.47 | 7.62 | 0.64 | 0.62 |
| Luoyang | 0.42 | 31.96 | 23.35 | 9.36 | 16.05 | 15.07 | 1.97 | 1.29 |
| Evaluation results of three cities of Zheng, Bian, and Luo in 2020. | |||
| City | FCE | VIKOR | Improved VIKOR |
| Zhengzhou | II | III | II |
| Kaifeng | II | II | II |
| Luoyang | II | III | II |
| Evaluation results of three cities of Zheng, Bian, and Luo in 2021. | |||
| City | FCE | VIKOR | Improved VIKOR |
| Zhengzhou | I | I | I |
| Kaifeng | II | I | I |
| Luoyang | I | I | I |
Disclaimer/Publisher’s Note: The statements, opinions and data contained in all publications are solely those of the individual author(s) and contributor(s) and not of MDPI and/or the editor(s). MDPI and/or the editor(s) disclaim responsibility for any injury to people or property resulting from any ideas, methods, instructions or products referred to in the content. |
© 2023 by the authors. Licensee MDPI, Basel, Switzerland. This article is an open access article distributed under the terms and conditions of the Creative Commons Attribution (CC BY) license (https://creativecommons.org/licenses/by/4.0/).
Share and Cite
Zhao, M.; Wei, J.; Han, Y.; Li, J. Water Cycle Health Assessment Using the Combined Weights and Relative Preference Relationship VIKOR Model: A Case Study in the Zheng-Bian-Luo Region, Henan Province. Water 2023, 15, 2266. https://doi.org/10.3390/w15122266
Zhao M, Wei J, Han Y, Li J. Water Cycle Health Assessment Using the Combined Weights and Relative Preference Relationship VIKOR Model: A Case Study in the Zheng-Bian-Luo Region, Henan Province. Water. 2023; 15(12):2266. https://doi.org/10.3390/w15122266
Chicago/Turabian StyleZhao, Mengdie, Jinhai Wei, Yuping Han, and Jinhang Li. 2023. "Water Cycle Health Assessment Using the Combined Weights and Relative Preference Relationship VIKOR Model: A Case Study in the Zheng-Bian-Luo Region, Henan Province" Water 15, no. 12: 2266. https://doi.org/10.3390/w15122266
APA StyleZhao, M., Wei, J., Han, Y., & Li, J. (2023). Water Cycle Health Assessment Using the Combined Weights and Relative Preference Relationship VIKOR Model: A Case Study in the Zheng-Bian-Luo Region, Henan Province. Water, 15(12), 2266. https://doi.org/10.3390/w15122266