Article

Evolution Characteristics of Meteorological Drought under Future Climate Change in the Middle Reaches of the Yellow River Basin Based on the Copula Function

1
Henan Yellow River Hydrological Survey and Design Institute, Zhengzhou 450002, China
2
College of Water Resources and Civil Engineering, Zhengzhou University, Zhengzhou 450001, China
*
Author to whom correspondence should be addressed.
Water 2023, 15(12), 2265; https://doi.org/10.3390/w15122265
Submission received: 12 May 2023 / Revised: 9 June 2023 / Accepted: 15 June 2023 / Published: 16 June 2023
(This article belongs to the Section Water and Climate Change)

Abstract

:
Against the background of global warming and frequent extreme precipitation events, the changes in drought characteristics in the middle reaches of the Yellow River Basin (YRMB) have been particularly pronounced in recent years. Under the new situation, it is necessary to further our understanding of drought risk in the basin and its response mechanisms to climate change. In this study, YRMB was utilized as the research area. Based on the precipitation (P) and potential evapotranspiration (PET) data under four emission scenarios (historical and future), five timescales (SPEI-1, SPEI-3, SPEI-6, SPEI-9, and SPEI-12) of SPEI drought indices were estimated in this study. Drought events were identified using the run-length theory, and the spatial distribution values of drought frequency, duration, intensity, and severity were also examined. Based on the preferred copula function, the two-dimensional joint distribution of drought variables was established, and the two-dimensional return period of drought indices in the historical (1901–2014) and future (2022–2100 under SSP245 and SSP585 emission scenarios) periods were calculated. The results show that the SPEI index in the middle reaches of the YRMB is increasing in the future period and the basin tends to be more humid. Under the SSP245 and SSP585 scenarios, the frequency of long drought durations, high drought intensities, or severe drought events in the basin may be higher. The univariate return period is always higher than the joint return period, but lower than the co-occurrence return period, and both types of return periods can be used to assess range estimations in the future. The research results can provide support for understanding the spatiotemporal distribution characteristics of drought in the YRMB and improving the accuracy of drought decision making.

1. Introduction

Drought is one of the most serious natural disasters in the world, presenting characteristics such as wide impact, long durations, and complex causes, which can cause considerable losses to human society [1,2,3]. Droughts occur frequently in China, and the regional differences in the occurrence of droughts are particularly pronounced. The middle reaches of the Yellow River (YRMB) are the areas most severely affected by drought. Most of the YRMB is located in a semi-arid region and is extremely sensitive to climate change [4]. In recent years, the climate in the YRMB has significantly changed as a result global warming. With the occurrence of rapid socio-economic development, the YRMB has transformed into an area with extremely scarce water resources in China [4]. As climate change intensifies, the degree of drought in the YRMB is increasing and its response to the global warming trend is becoming increasingly more evident [5]. At present, this basin is facing a serious risk of drought disasters. The high-quality development of the YRMB has risen to the national strategic level. Under the background of climate change, the climate type in the YRMB is complex and diverse, and the distribution of precipitation presents uneven characteristics [6]. In recent years, with the continuous change in climate and increase in population, the utilization of water resources in the YRMB has considerably increased, especially presenting a decrease in water quantity, leading to the expansion of the scale, frequency, and duration of drought disasters [7]. In the research, the impact of drought disasters on the ecological environment and socio-economic development of the basin is becoming increasingly severe [8]. Drought disasters have become the main constraint factor limiting the high-quality development of the YRMB [9,10]. Therefore, a thorough understanding of the characteristics of drought disaster risks and their impact mechanisms in the YRMB is of considerable significance for China’s socio-economic development and ecological civilization construction.
According to the physical and socio-economic factors, the American Meteorological Society classifies drought into four categories: meteorological, hydrological, agricultural, and socio-economic [11]. Meteorological drought mainly considers the balance between precipitation and evapotranspiration; agricultural drought mainly focuses on crop growth and soil moisture conditions; hydrological drought uses surface runoff and groundwater levels as the main indicators; and socio-economic drought mainly uses natural water supply conditions and human water demand as the main indicators [12]. Due to the influence of surface water and groundwater supply, the occurrence of agricultural, hydrological, and socio-economic droughts is less frequent than that of meteorological droughts [13]. Additionally, it is only when meteorological droughts persist for a certain period of time that agricultural, hydrological, and socio-economic droughts can occur and produce corresponding consequences. Therefore, meteorological drought is the determinant of whether the other three types of droughts will occur, and a timely assessment of meteorological drought is crucial in the literature for alerting us to critical water resource levels and agricultural production outcomes [14].
At present, meteorological drought indices commonly used in the research to monitor drought can be roughly divided into two categories: one category considers only single factors, such as precipitation anomaly percentage (Pa), standardized precipitation index (SPI), Z-index, generalized extreme value index (GEVI), and standardized antecedent precipitation index (SAPI); the other category considers multiple factors, including standardized precipitation–evapotranspiration index (SPEI), Palmer drought severity index (PDSI), surface humidity index (Hi), and compound index (CI). Among these parameters, the SPEI is based on SPI and was developed by Vicente-Serrano et al. (2010) [15]. The SPEI characterizes water deficit levels by interpolating precipitation and potential evapotranspiration levels at a given timescale and replaces precipitation in the SPI calculation. It thus combines the advantages of the PDSI and avoids the limitations of using only a single factor in the SPI. In addition, the SPEI inherits the simple calculation process and flexible timescale of SPI, as well as the advantage of low data requirements [16]. Therefore, it is more advantageous than the PDSI method, which relies on empirical parameters in drought research. With the expansion of drought-prone areas due to the consequences of climate change, the SPEI is particularly suitable for drought research under the global warming background at present, as it takes into account the influence of temperature variability. In their study, Engström and Keellings (2018) [17] used the SPEI index to predict the occurrence of future droughts in Canada, and observed significant regional differences in drought conditions. Ma et al. (2022) [18] evaluated the spatiotemporal pattern of droughts occurring in China from 1961 to 2099, based on the SPEI index calculated from CMIP6 precipitation and temperature data, and the results show that drought events in China will occur more frequently in the future. In particular, the trend of summer droughts in the Hai and Huai River Basins will be more severe.
The YRBM is selected as the research region for this study. A copula function-based drought identification method for future multi-discharge scenarios is also established. Based on the run-length theory, drought events were identified and drought duration and intensity factors were also obtained. Furthermore, the optimal distribution function was selected as the marginal distribution of drought characteristic variables. Based on the optimized copula function, the joint and co-occurrence return periods of drought duration and intensity, duration and intensity, and intensity in the middle reaches of the Yellow River Basin were deduced. The identification of future drought occurrence in the Yellow River Basin under SSP245 and SSP585 discharge scenarios was also realized.
Based on the CMIP6 multi-model output of precipitation (P) and potential evapotranspiration (PET) values, the present study introduces the SPEI drought index and uses the run-length theory to identify the duration, intensity, and severity of droughts. The study also uses copula functions to investigate the changes in the return period of drought variables under SSP245 and SSP585 emission scenarios for key historical (1901–2014) and future (2022–2100) periods in the YRBM. Through these analyses, this study aims to investigate the spatiotemporal evolution of droughts in the YRBM during past and future events.

2. Materials and Methods

2.1. Study Area

The YRBM is located between the Huayuankou and Toudaoguai hydrological stations (Figure 1) and covers an area of approximately 361,600 km2, which is approximately 45% of the total Yellow River Basin. Most of the basin is located in the Loess Plateau, which is the main sediment-producing area of the Yellow River. Over 88% of the sediment in the Yellow River Basin is produced in the middle reaches of the studied area. The climate in the YRBM is mainly semi-humid to semi-arid, with an extremely uneven spatial distribution of precipitation levels. The minimum and maximum average annual precipitation levels are 300 and 800 mm, respectively, and the average annual temperature ranges from 6 to 12 °C. The habitats within the basin are diverse and complex, including deciduous broadleaf forests, grasslands, deserts, and the vegetation belt of the Qinghai–Tibet Plateau. The soil types present in this location are mainly meadow, brown, calcareous chestnut, calcareous brown, calcareous gray, black loess, yellow loam, and sandy soils. Overall, water resources in the YRBM are scarce, and most of the region is composed of arid and semi-arid areas, which are vulnerable to the impacts of climate and human activities. The ecological environment is fragile and the overall landscape pattern tends to be complex, fragmented, and dispersed.

2.2. Datasets

2.2.1. Hydrological Data

The hydrological data used in this study included the following: (1) Observed data collected from 46 hydrological stations in the YRBM from 1991 to 2014 were obtained from the National Meteorological Science Data Center (http://data.cma.cn/, accessed on 26 October 2021), including daily precipitation, daily average temperature, daily maximum temperature, daily minimum temperature, and potential evapotranspiration data. Some missing data were reasonably interpolated using a hydrological analogy and linear interpolation methods. (2) A 1 km resolution dataset of 30-year cumulative average precipitation, average temperature, average maximum temperature, and average minimum temperature levels collected from 1971 to 2000 was also used as a regional high-resolution reference dataset to construct the delta statistical downscaling model in this study. This dataset was obtained from the National Science and Technology Infrastructure of China-National Ecosystem Science Data Center (NESDC) (http://www.nesdc.org.cn/, accessed on 25 November 2022).

2.2.2. CMIP 6 Climate Model

The climate model data used in this study were obtained from the Earth System Grid Federation (ESGF) (https://esgf-node.llnl.gov/projects/cmip6/, accessed on 15 September 2021), including four different shared socio-economic pathways (SSPs) for four future time periods (2021–2040, 2041–2060, 2061–2080, and 2081–2100), namely, the low emissions scenario SSP126, the medium emissions scenario SSP245, the relatively high emissions scenario SSP370, and the highest emissions scenario SSP585. A total of 39 climate models were collected to assess monthly precipitation levels (Table S1) and seven climate models were collected to assess monthly potential evapotranspiration levels (Table S2).

2.3. Methodology

2.3.1. Delta Downscaling

Delta downscaling is a statistical downscaling method used in the research [19]. Based on the measured sequence of a variable in the reference period and the characteristic value of the corresponding variable observation sequence (such as the absolute increase in temperature, the relative change rate of precipitation), high-resolution GCMs data can be obtained. This method is relatively simple and requires fewer calculations to be performed. It can reduce the simulated values of GCM data to specific observation stations. For the downscaling of temperature values, we used the difference method. For the downscaling of precipitation values, we used the ratio method. Better results can be obtained when using different scaling methods to assess temperature and precipitation levels. The formulae used are as follows:
T e m f = T e m o b s _ r e f + ( T e m G C M s _ f T e m G C M s _ r e f )
P r e f = P r e o b s _ r e f × P r e G C M s _ f P r e G C M s _ r e f
where Temf (Pref) represents temperature (precipitation) following the downscaling method, Temobs_ref (Preobs_ref) represents the measured data for temperature (precipitation) in the reference period, TemGCMs_f (PreGCMs_f) represents the GCM data for the temperature (precipitation) in the prediction period, and TemGCMs_ref (PreGCMs_ref) represents GCM data for the temperature (precipitation) in the reference period.
Although the delta downscaling method is simple and easy to use, it requires high-spatial-resolution measured data as the basis, which limits the use of this method to some extent.

2.3.2. Climate Model Optimization

The ability of different climate models to model climate change outcomes in a watershed can vary widely, and the use of different interpolation methods in the downscaling process can also affect the overall results. In this study, we used five interpolation methods, namely, spline, kriging, inverse distance-weighted, natural neighbor interpolation, and bilinear interpolation, in the downscaling processes of each climate model. To select suitable models and reduce model uncertainty outcomes, we evaluated the modeling capabilities of high-resolution climate models obtained with different interpolation methods for precipitation and potential evapotranspiration levels in the Yellow River Basin using four evaluation criteria: mean absolute error (MAE) [20], temporal skill score (TS) [21], evaluation based on Taylor plots (S) [22], and spatial skill score (SS) [23]. We then ranked the errors obtained for each criterion and combined the rankings equally to select models and interpolation methods, thereby reducing the uncertainties introduced by the models and interpolation methods. Lower values obtained for MAE and TS indicated a better modeling ability, while a value closer to 1 for S and SS indicated better modeling ability.
Based on the 1971–2000 monthly mean precipitation (potential evapotranspiration) data, the delta statistical downscaling method was applied to downscale the climate model outputs to the regional scale. The period of 1995–2014 was used as the validation period to assess the validity of the monthly precipitation (potential evapotranspiration) levels simulated by the model.

2.3.3. SPEI

We calculated the difference between monthly precipitation and potential evapotranspiration (Di) levels, fit the Di data sequence using a three-parameter log-logistic probability distribution function, and standardized the cumulative probability density value. The probability of exceeding a certain Di value was P = 1 − F(x), and the probability-weighted moment was calculated using the normalized values.
SPEI = ω c 0 + c 1 ω + c 2 ω 2 1 + d 1 ω + d 2 ω 2 + d 3 ω 3 P 0.5 SPEI = { ω c 0 + c 1 ω + c 2 ω 2 1 + d 1 ω + d 2 ω 2 + d 3 ω 3 } P > 0.5
Here, ω is the probabilistic weighted moment; d1 = 1.432788; d2 = 0.189269; d3 = 0.001308; c0 = 2.515517; c1 = 0.802853; and c2 = 0.010328. According to the national meteorological drought rating standards, the SPEI values are classified into five levels (Table 1).
Based on the historical (1901–2014) and future (2022–2100) monthly precipitation and potential evapotranspiration data obtained for the Yellow River Basin under SSP126, SSP245, SSP370, and SSP585 emission scenarios, the SPEI drought index was calculated for timescales of 1, 3, 6, 9, and 12 months, namely, SPEI-1, SPEI-3, SPEI-6, SPEI-9, and SPEI-12, to analyze the temporal evolution patterns of drought occurrence in the middle reaches of the Yellow River Basin.

2.3.4. Run-Length Theory

When using the run-length theory to identify the occurrence of drought events in the selected region, firstly, a cut-off level k (the drought grade corresponding to k = SPEI index) was presented, and then a discrete sequence Xt (t = 1, 2, …, n). When the random variable was continuously greater than the interception level for one or more times, a positive run appeared; otherwise, a negative run appeared. The drought threshold R0 = −0.5 was set and an SPEI value less than −0.5 during a certain period was regarded as the beginning of a drought event; an SPEI value greater than or equal to −0.5 during this period was regarded as the end of the event. Drought duration refers to the duration of a drought event from the beginning to the end. If the drought occurrence in the study area started from time period i and continued to time period i + D, the duration of the drought event was D. Drought intensity is the sum of SPEI values in a drought event. The drought intensity value can be obtained by dividing the drought intensity by drought duration.
After we obtained the drought duration (D), drought severity (S, sum of SPEI values in drought events), and drought intensity (I, ratio of drought intensity to drought duration) levels in the middle reaches of the Yellow River Basin using the run-length theory, in order to successfully meet the modeling conditions of the copula model, it was first necessary to obtain the marginal distribution of each variable. In this study, the exponential, gamma, lognormal, Weibull, generalized extreme value, and generalized Pareto distributions were fitted to the appropriate drought indicators using the maximum likelihood estimation method, and the model with the highest p-value was selected as the optimal marginal distribution model through the Kolmogorov–Smirnov test. Meanwhile, the commonly used Pearson’s, Kendall rank, and Spearman’s rank correlation coefficients were used to measure the correlation between the two drought characteristic variables.

2.3.5. Copula Function

Suppose F is an n-dimensional distribution function, and the marginal distributions of the variables are F1(x1), F2(x2), …, Fn(xn). Then, an n-dimensional copula function C exists, and, for any xRn, its distribution function is given by:
F ( x 1 , x 2 , , x n ) = P { X 1 x 1 , X 2 x 2 , , X x n } = C [ F 1 ( x 1 ) , F 2 ( x 2 ) , , F n ( x n ) ]
where x1, x2, …, xn are the observed samples; F1(x1), F2(x2), …, Fn(xn) are marginal distribution functions.
This study selected five copula functions from two commonly used categories [24]: Gumbel, Clayton, and Frank from the Archimedean copulas, and Gaussian and t- from the Meta-elliptical copulas. The optimization fit method was used in this study to obtain the parameters corresponding to the frequency curve with the best fit to the empirical and theoretical frequencies based on the minimum sum of the squared residuals (OLS) criterion. The goodness-of-fit test of copula is a prerequisite in the research for selecting the optimal copula function as the joint distribution. In this study, Akaike information criterion (AIC) and Bayesian information criterion (BIC) were used to evaluate the goodness-of-fit values.
After determining the marginal distribution types of the three drought characteristic variables, D, S, and I, using univariate marginal distribution models, denoted as FD(d), FS(s), and FI(i), with expressions u, v, and w, respectively, and selecting the optimal bivariate copula function C(u,v), where N is the length/years of the drought series and n is the number of drought events occurring within the series, taking the joint distribution model of drought duration D and drought severity S as an example, the joint distribution function can be expressed as:
F ( d , s ) = P ( D d , S s ) = C ( F D ( d ) , F S ( s ) ) = C ( u , v )
The joint transcendence probability is:
P ( D d , S s ) = 1 F D ( d ) F S ( s ) + C ( F D ( d ) , F S ( s ) ) = 1 u v + C ( u , v )
The combined return period of two-dimensional drought variables includes joint and coincident return periods. Taking the joint distribution of drought duration D and drought severity S as an example, the formulas for calculating the two-dimensional joint (To) and coincident (Ta) return periods are as follows:
T o = N n P ( D d S s ) = N n ( 1 c ( u , v ) )
T a = N n P ( D d S s ) = N n ( 1 u v + C ( u , v ) )
Similarly, the calculation formulas for the combined return periods of drought duration and intensity, as well as drought severity and intensity, could be obtained but were not elaborated upon in this study.

3. Results

3.1. Climate Model Optimization

According to the evaluation of 39 climate models when simulating rainfall levels, the Kriging interpolation method can significantly reduce the interpolation error produced by climate models. Under this interpolation method, several climate models, including CanESM5, NESM3, CESM2-WACCM, FIO-ESM-2-0, INM-CM5-0, CESM2-WACCM, NorESM2-LM, ACCESS-CM2, ACCESS-ESM1-5, and IPSL-CM6A-LR, presented high comprehensive rankings based on four different evaluation indicators (Figure S1). Considering that some individual climate models did not contain future climate scenario data, we elected ACCESS-ESM1-5, CESM2-WACCM, and IPSL-CM6A-LR as the models for the subsequent analysis of precipitation level changes (Figure S2).
According to the ranking of evaluation indicators for simulated evapotranspiration events based on seven climate models, the IDW interpolation method presented the lowest average error among the seven models, while EC-Earth3-Veg-LR ranked first for all evaluation indicators (Figure S3). Since the number of climate models was low, other simulated datasets were not averaged; however, this climate model was selected for the subsequent analysis of potential evapotranspiration level changes. The fitting errors of the seven climate models for monthly potential evapotranspiration levels in the Yellow River Basin showed that the MAE values of these models were between 21 and 28 mm and the SS was greater than 0.5, with EC-Earth3-Veg-LR reaching 0.7033, a result higher than the other models. In addition, the values of S and TS were 1.0000 and 0.0009, respectively, and their simulation performances were good (Table S3). Based on the scatter plot of measured and simulated monthly potential evapotranspiration levels from 2001 to 2011, it can be observed that the R2 value of the measured and simulated potential evapotranspiration levels is 0.734, indicating a high consistency between the simulated and actual potential evapotranspiration levels, passing the 5% significance test, with a regression coefficient of 0.87. Overall, the potential evapotranspiration data of the climate models were less than those for ground observations (Figure S4).

3.2. Variations in the SPEI Meteorological Drought Index

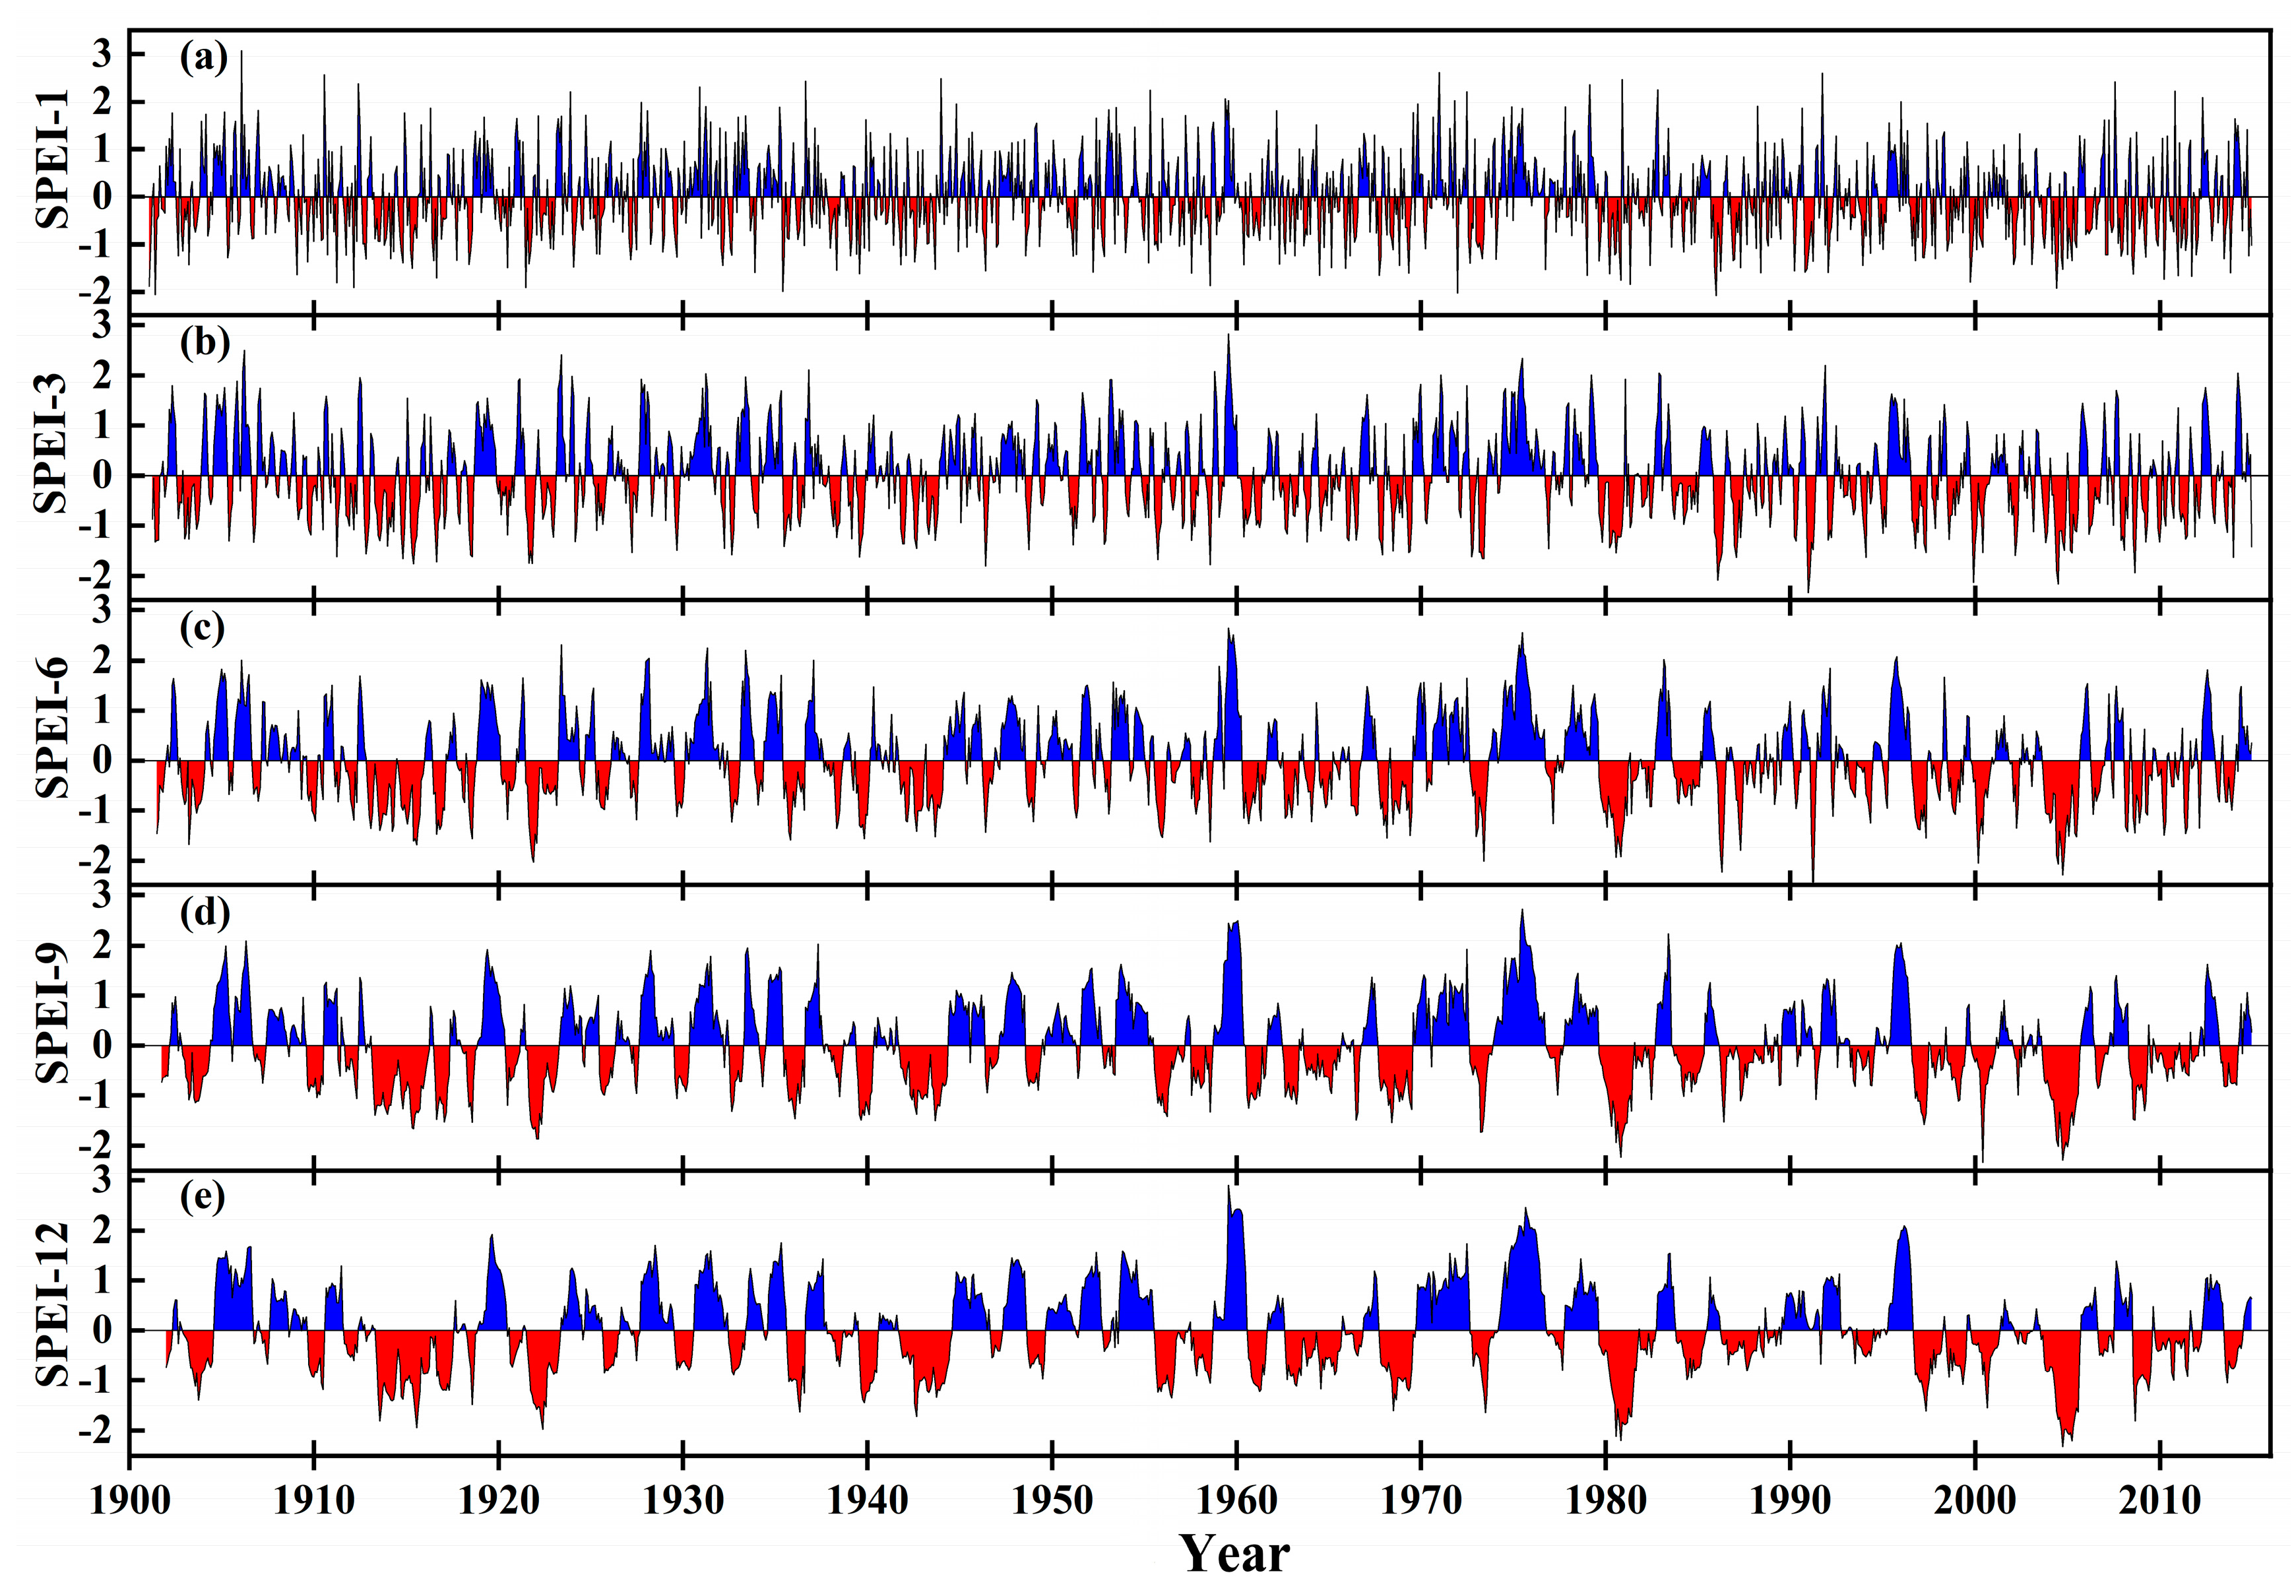
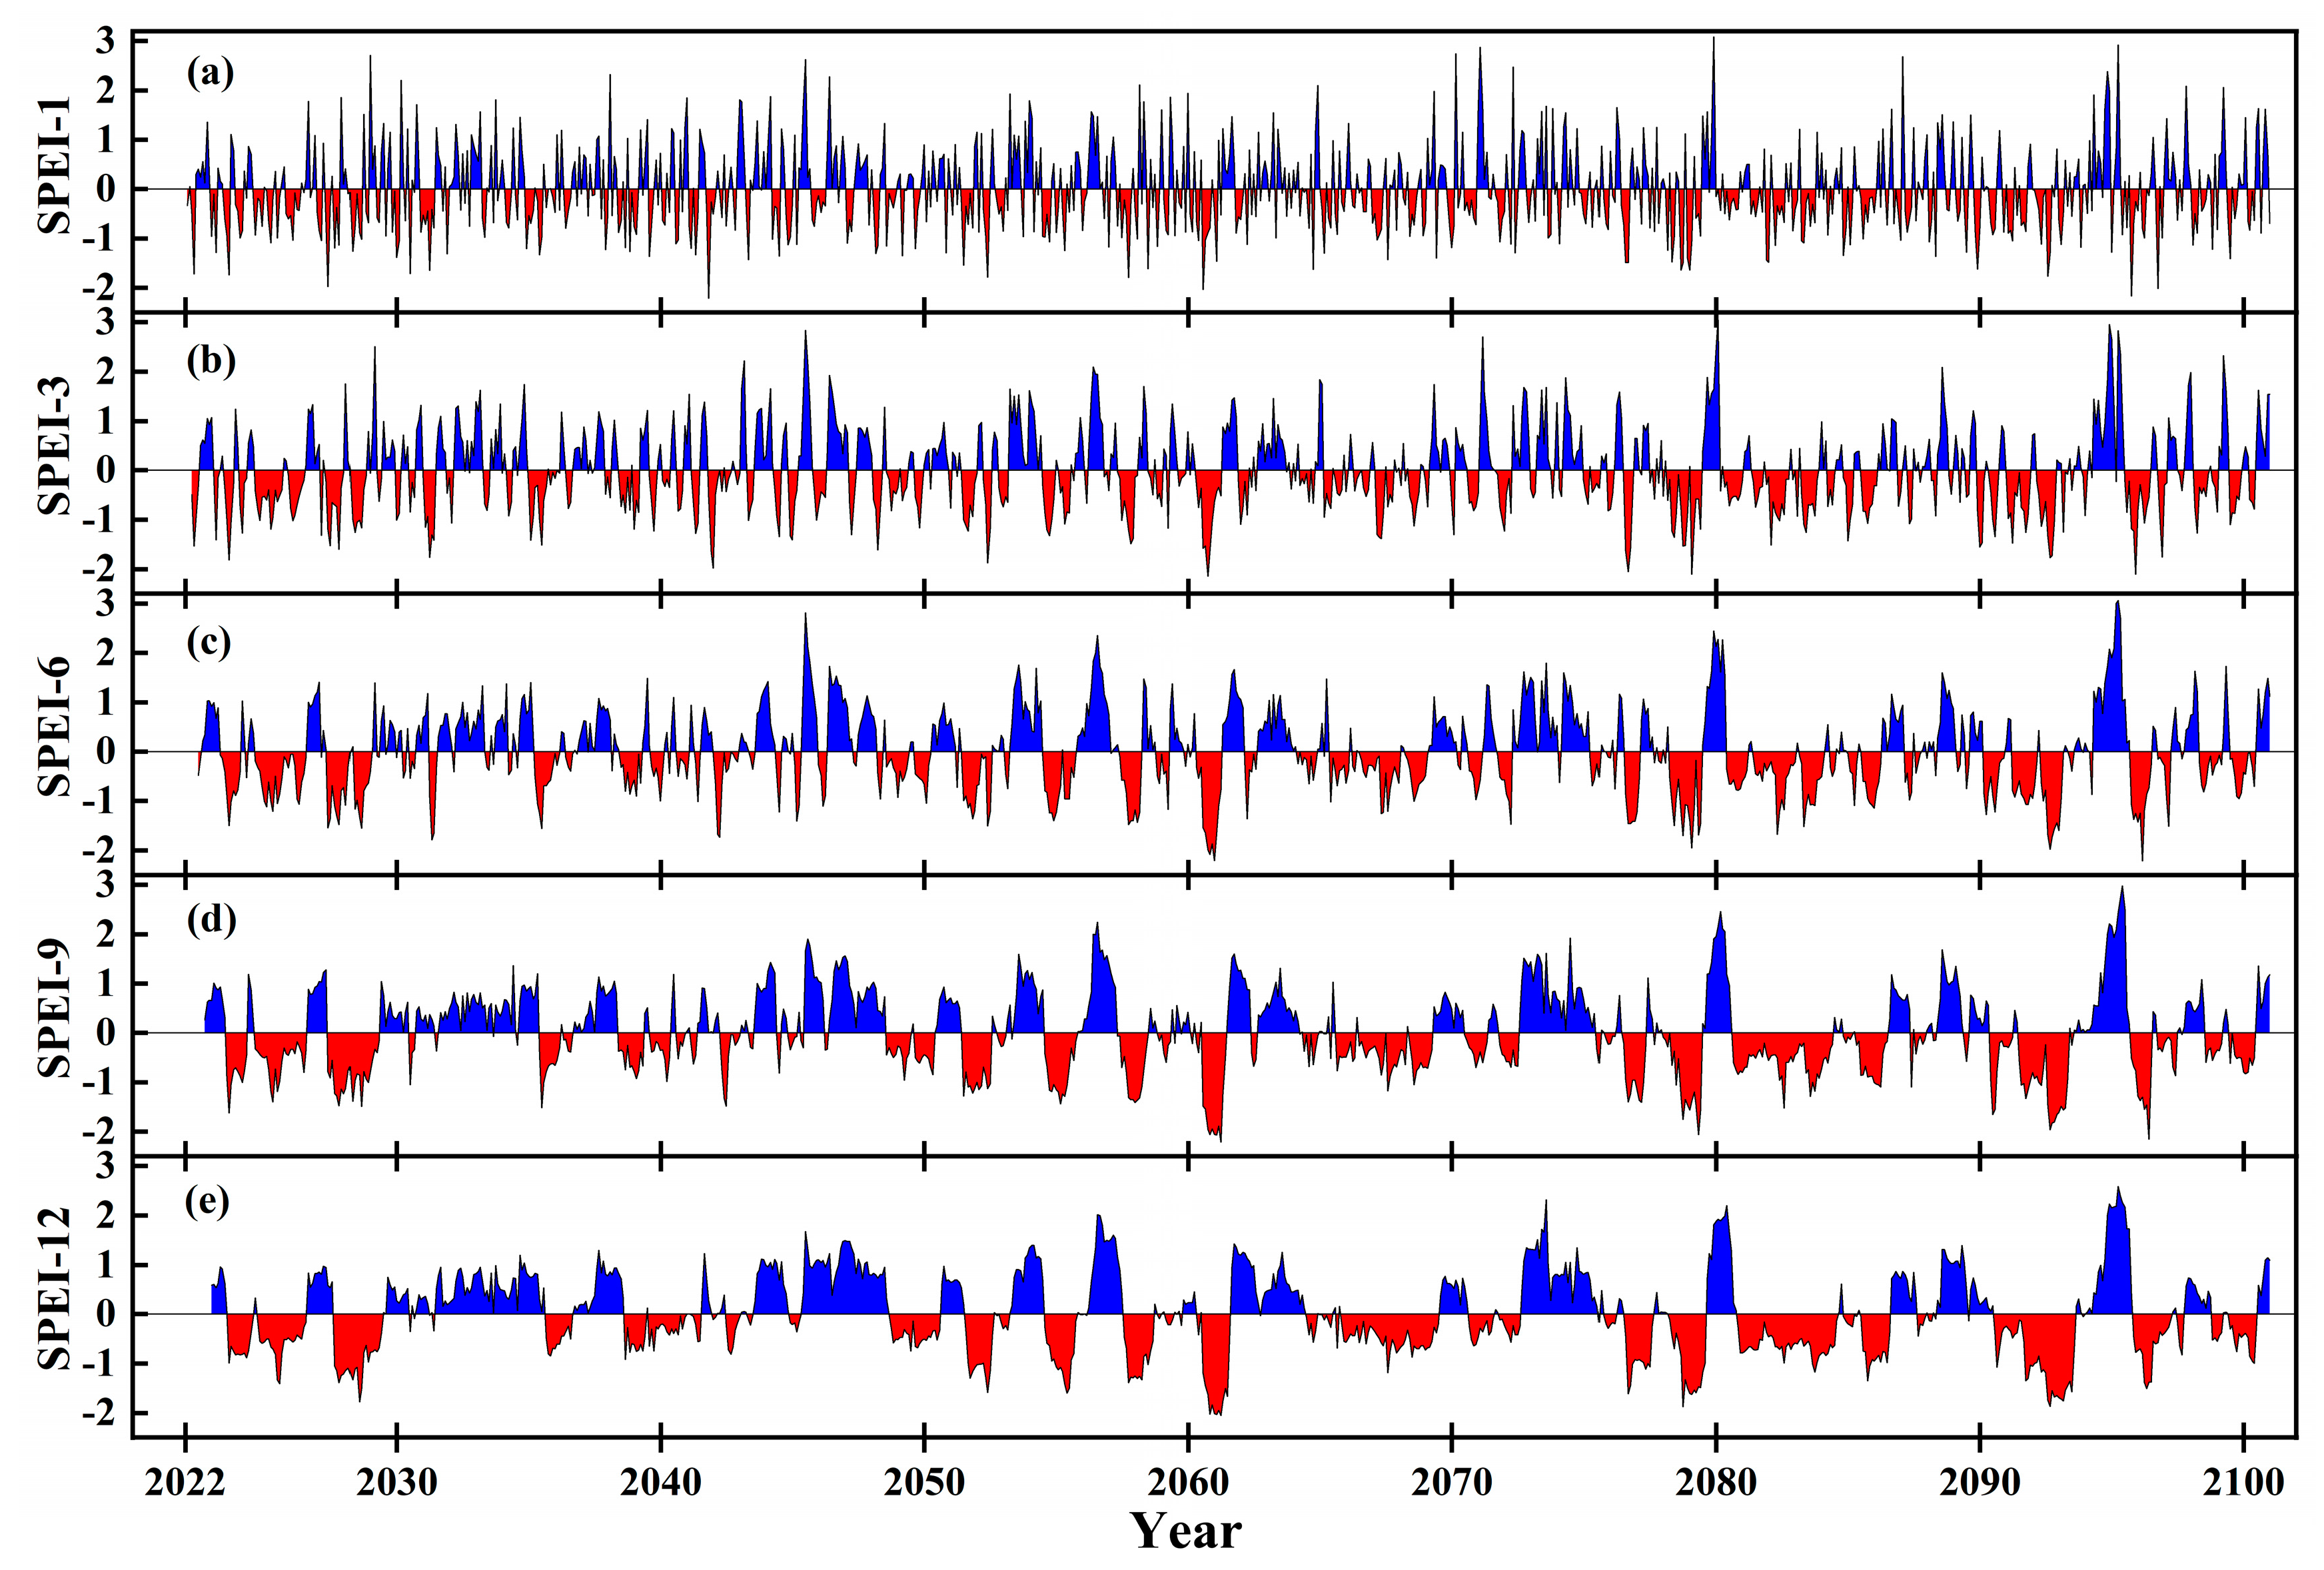
During the historical period, the SPEI values for five timescales fluctuated in the range [−2.7, 3.1], with negative linear trend rates indicating a decreasing trend in the SPEI index and a worsening drought trend in the basin. The severity of the drought was most severe around 1991 (Figure 2). Under the SSP126 scenario, the SPEI values at five timescales fluctuated in the range [−2.2, 3.1] (Figure 3); under the SSP245 scenario, the SPEI values fluctuated in the range [−2.8, 2.9] (Figure 4); under the SSP370 scenario, the SPEI values fluctuated in the range [−2.7, 2.9] (Figure S5); under the SSP585 scenario, the SPEI values fluctuated in the range [−2.3, 2.9]; and, except for the negative linear trend rates of some of the SPEI timescales under the SSP126 emission scenario, the linear trend rates of the SPEI under other emission scenarios were positive, indicating an upward trend of SPEI values in the future, a decrease in drought severity levels in the basin, and a tendency toward wetter conditions. Among them, under the SSP126 scenario, the drought severity was most severe in the 2060s; under the SSP245 scenario, the drought severity was most severe around 2087; under the SSP370 scenario, the drought severity was most severe around 2023 and the drought duration was longer (Figure S5); and under the SSP585 scenario, the drought severity was most severe in the 2040s, 2064, and 2080s (Figure S6).
Based on the fluctuations of the SPEI values at different timescales and periods, it can be observed that the short-term SPEI index of the Yellow River Basin in the middle reaches frequently alternates between dry and wet periods, especially for SPEI-1, which shows a frequent alternation between drought and flood conditions. For longer timescales, the changes in the SPEI index are more stable and can better highlight the actual drought situation in the basin. The shorter the timescale, the more sensitive the SPEI index is to short-term changes in precipitation and temperature levels, and the greater the fluctuation amplitude of the index, indicating more significant changes in the wet and dry conditions of the basin. As the timescale increases, the frequency of the SPEI fluctuations becomes relatively stable and the transition between wet and dry periods becomes smoother, only occurring under conditions of repeated precipitation and high temperature.

3.3. Identification of Drought Characteristic Variables Using Run-Length Theory

For the historical period (Figure 5), the range of drought occurrence in the Yellow River Basin was 34–57 times, with an average of 42 times. Areas such as Shizuishan, northern Shaanxi, western Pingdingshan, and northern Kaifeng presented a higher frequency of drought occurrence, with an average of 52 times. The spatial distribution of drought duration and intensity was generally similar, with drought duration ranging from 7.18 to 13.17 months, and an average duration of 9.76 months for the basin as a whole. Drought intensity ranged from 7.64 to 13.17, with an average intensity of 10.26. The spatial characteristics of the two parameters increased from west to east directions, then decreased, and increased again. The intensity value of drought occurrence in the basin fluctuated between 0.86 and 1.06, with an average intensity of 0.93.
The spatial variations in drought frequency in the middle reaches of the Yellow River Basin under four emission scenarios in the future (Figure 6) were 9–43, 9–42, 12–46, and 7–44 times, with the average frequency occurring in the order SSP585 (32 times) > SSP126 (31 times) > SSP370 (30 times) > SSP245 (28 times). The spatial distribution of drought duration and intensity was basically the same, with the average duration occurring in the order SSP245 (8.92 months) > SSP370 (7.65 months) > SSP585 (6.58 months) > SSP126 (6.53 months), and the average intensity occurring in the order SSP245 (10.07) > SSP370 (8.53) > SSP126 (8.38) > SSP585 (8.27). For drought severity, under the four emission scenarios, the spatial variations were 0.66–1.11, 0.67–1.12, 0.69–1.11, and 0.65–1.13.

3.4. Drought Analysis Conducted in the YRBM Based on the Copula Function

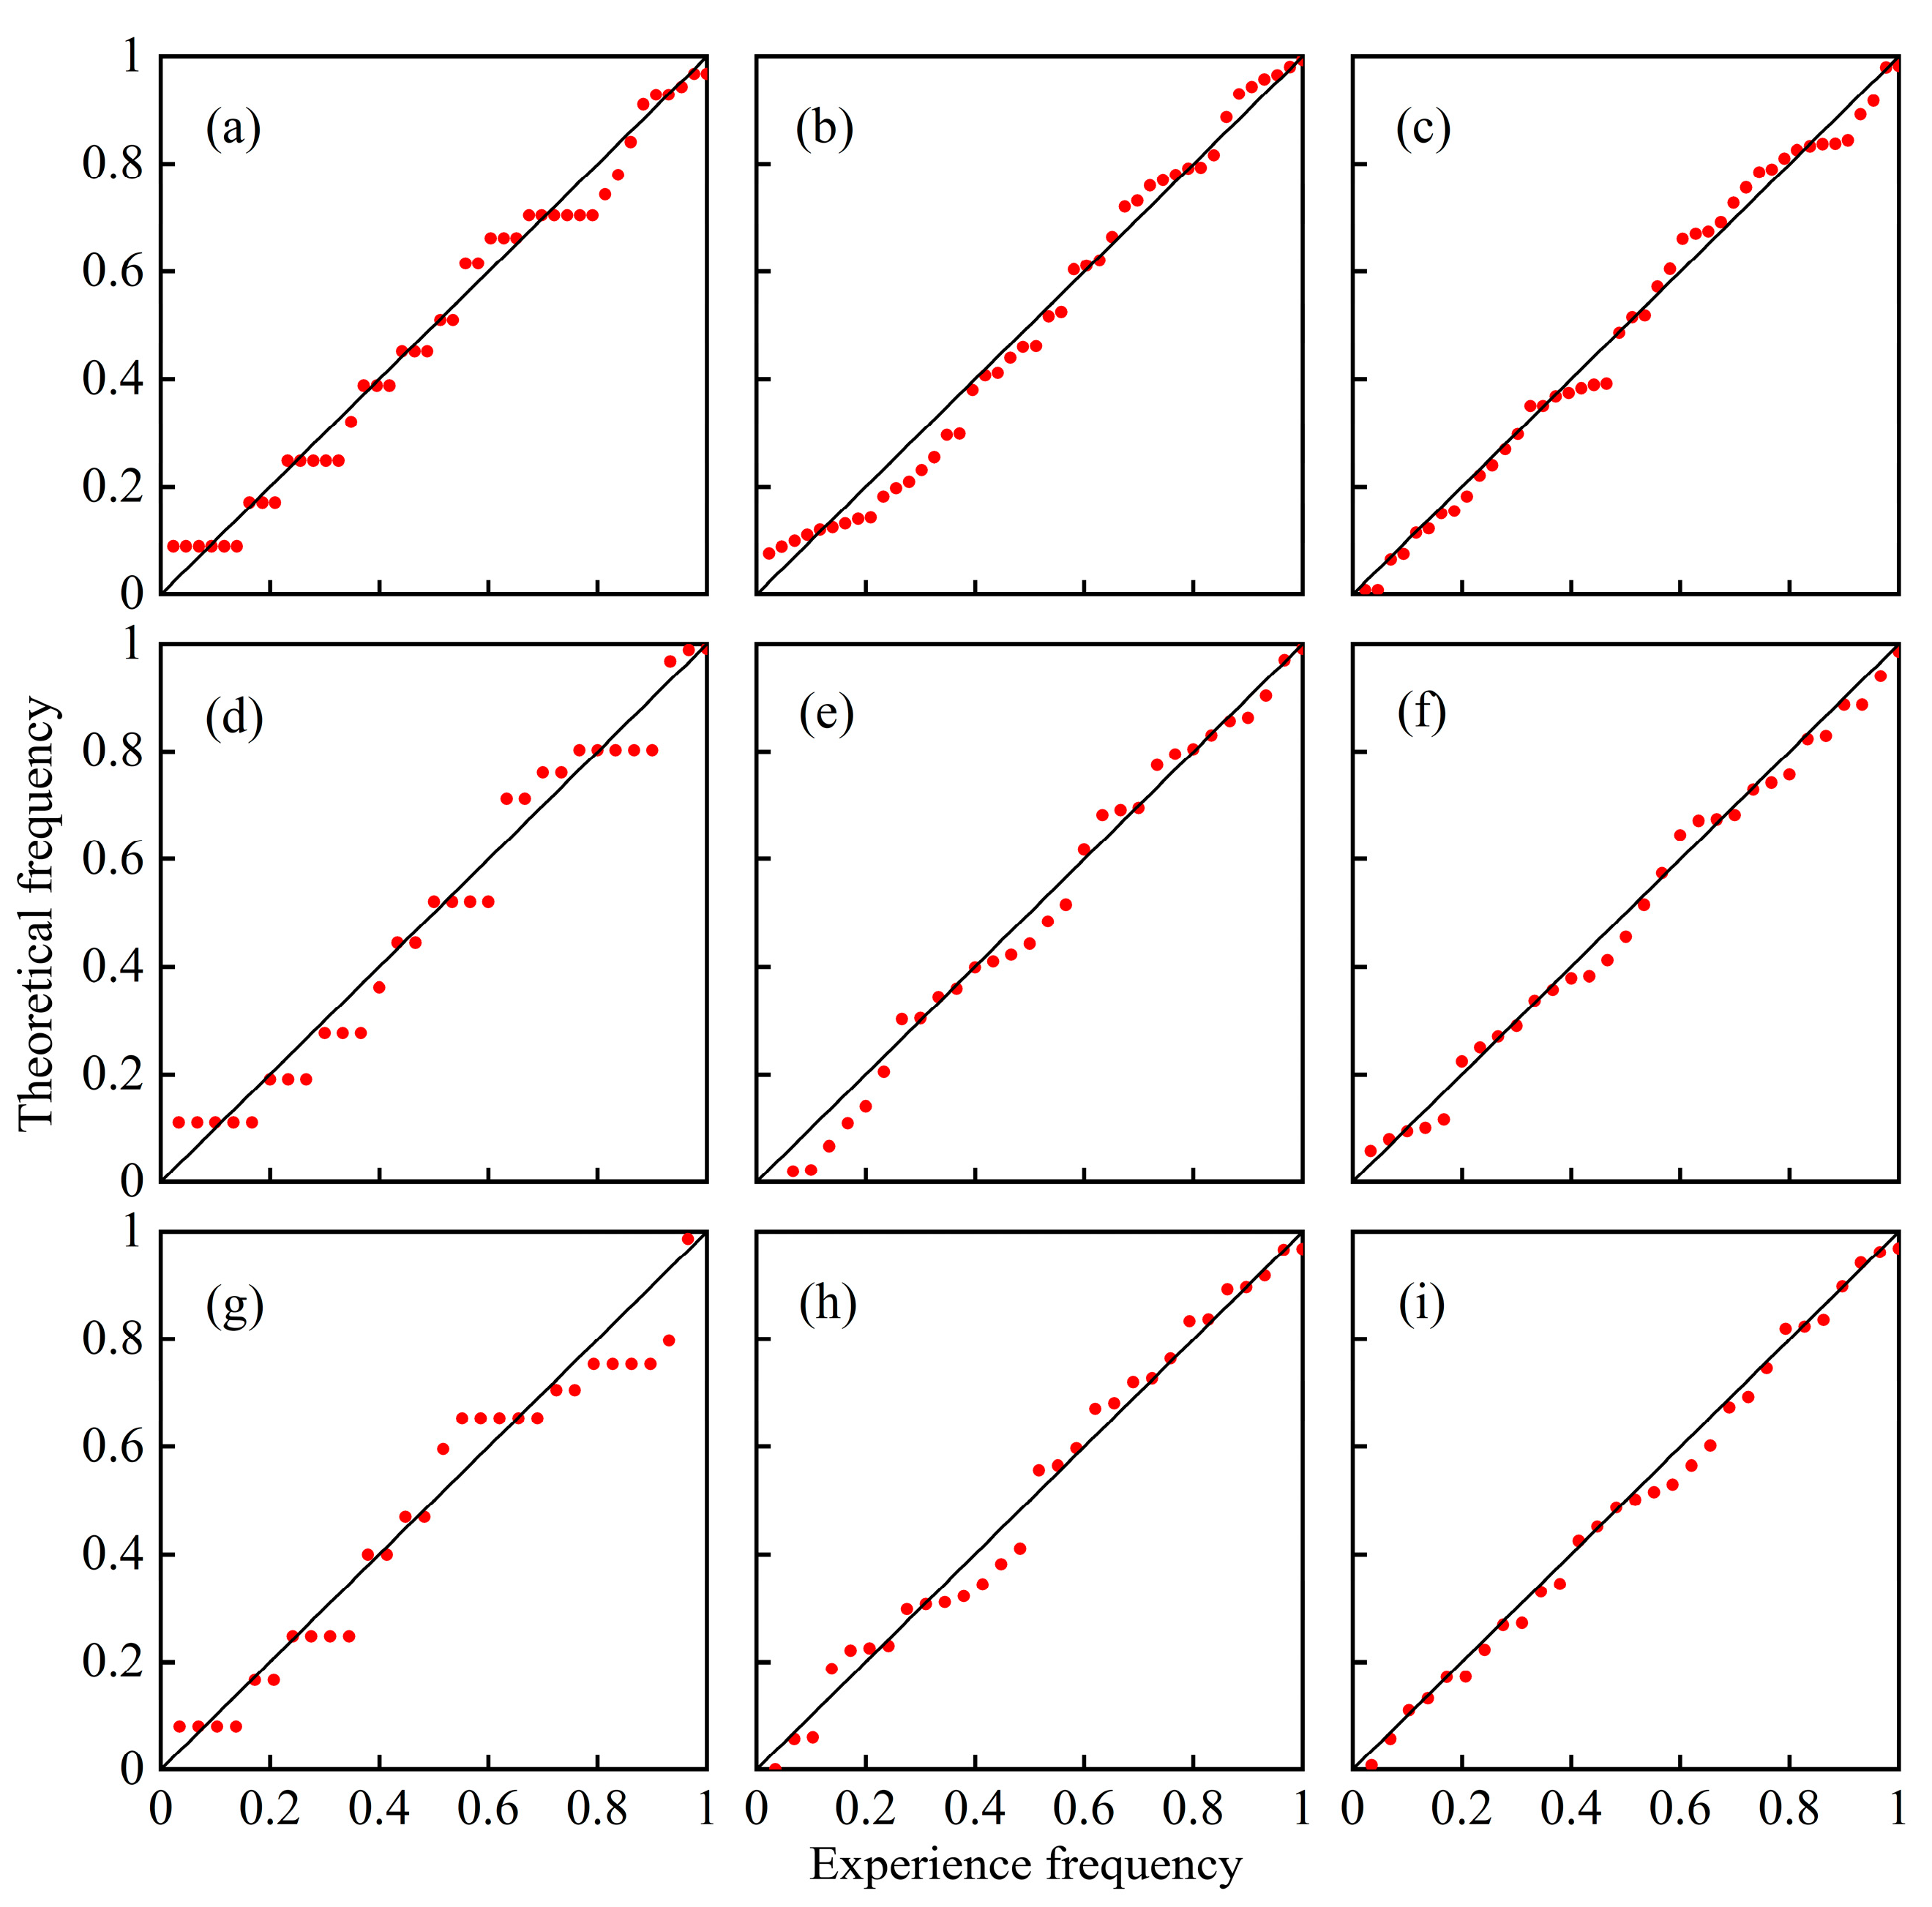
Due to the fact that the SSP245 emission scenario is closer to the actual future development outcome and the SSP585 emission scenario serves as a warning for future developments, the subsequent research conducted on future drought occurrence in the Yellow River Basin only considered these two scenarios due to space limitations. The results of the preferred univariate marginal distributions of meteorological drought indices in the middle reaches of the Yellow River Basin under historical, SSP245, and SSP585 scenarios are presented in Table 2. Based on the preferred marginal distribution functions mentioned above, empirical frequency and theoretical frequency fitting graphs of the univariate marginal distributions of drought characteristics in the middle reaches of the Yellow River Basin under historical, SSP245, and SSP585 scenarios are plotted in Figure 7. The data points are uniformly distributed on both sides of the diagonal line, indicating that the empirical and theoretical frequency values of the marginal distributions in regions D, S, and I in the Yellow River Basin are close during different periods, and the preferred marginal distribution functions present a good fitting effect on drought characteristic variables under each condition.
The correlation between the duration and severity of drought occurrence was the strongest, followed by the correlation between drought severity and intensity, while the correlation between drought duration and intensity was weaker. In all scenarios, the three correlation coefficients between the various drought characteristics passed the significance test at 0.05, indicating a high degree of dependence. Therefore, a joint distribution model of the two drought variables could be established through the copula function in subsequent analyses (Table 3).
In the historical scenarios, the joint distribution value of D&S and D&I showed the best performance with the Gumbel function, while the joint distribution value of S&I showed the best performance with the Clayton function. In the SSP245 scenario, the joint distribution value of D&S showed the best performance with the Gumbel function, while the joint distribution values of D&I and S&I showed the best performance with the Clayton function. In the SSP585 scenario, the joint distribution values of D&S, D&I, and S&I showed the best performance with the Clayton function (Table 4).
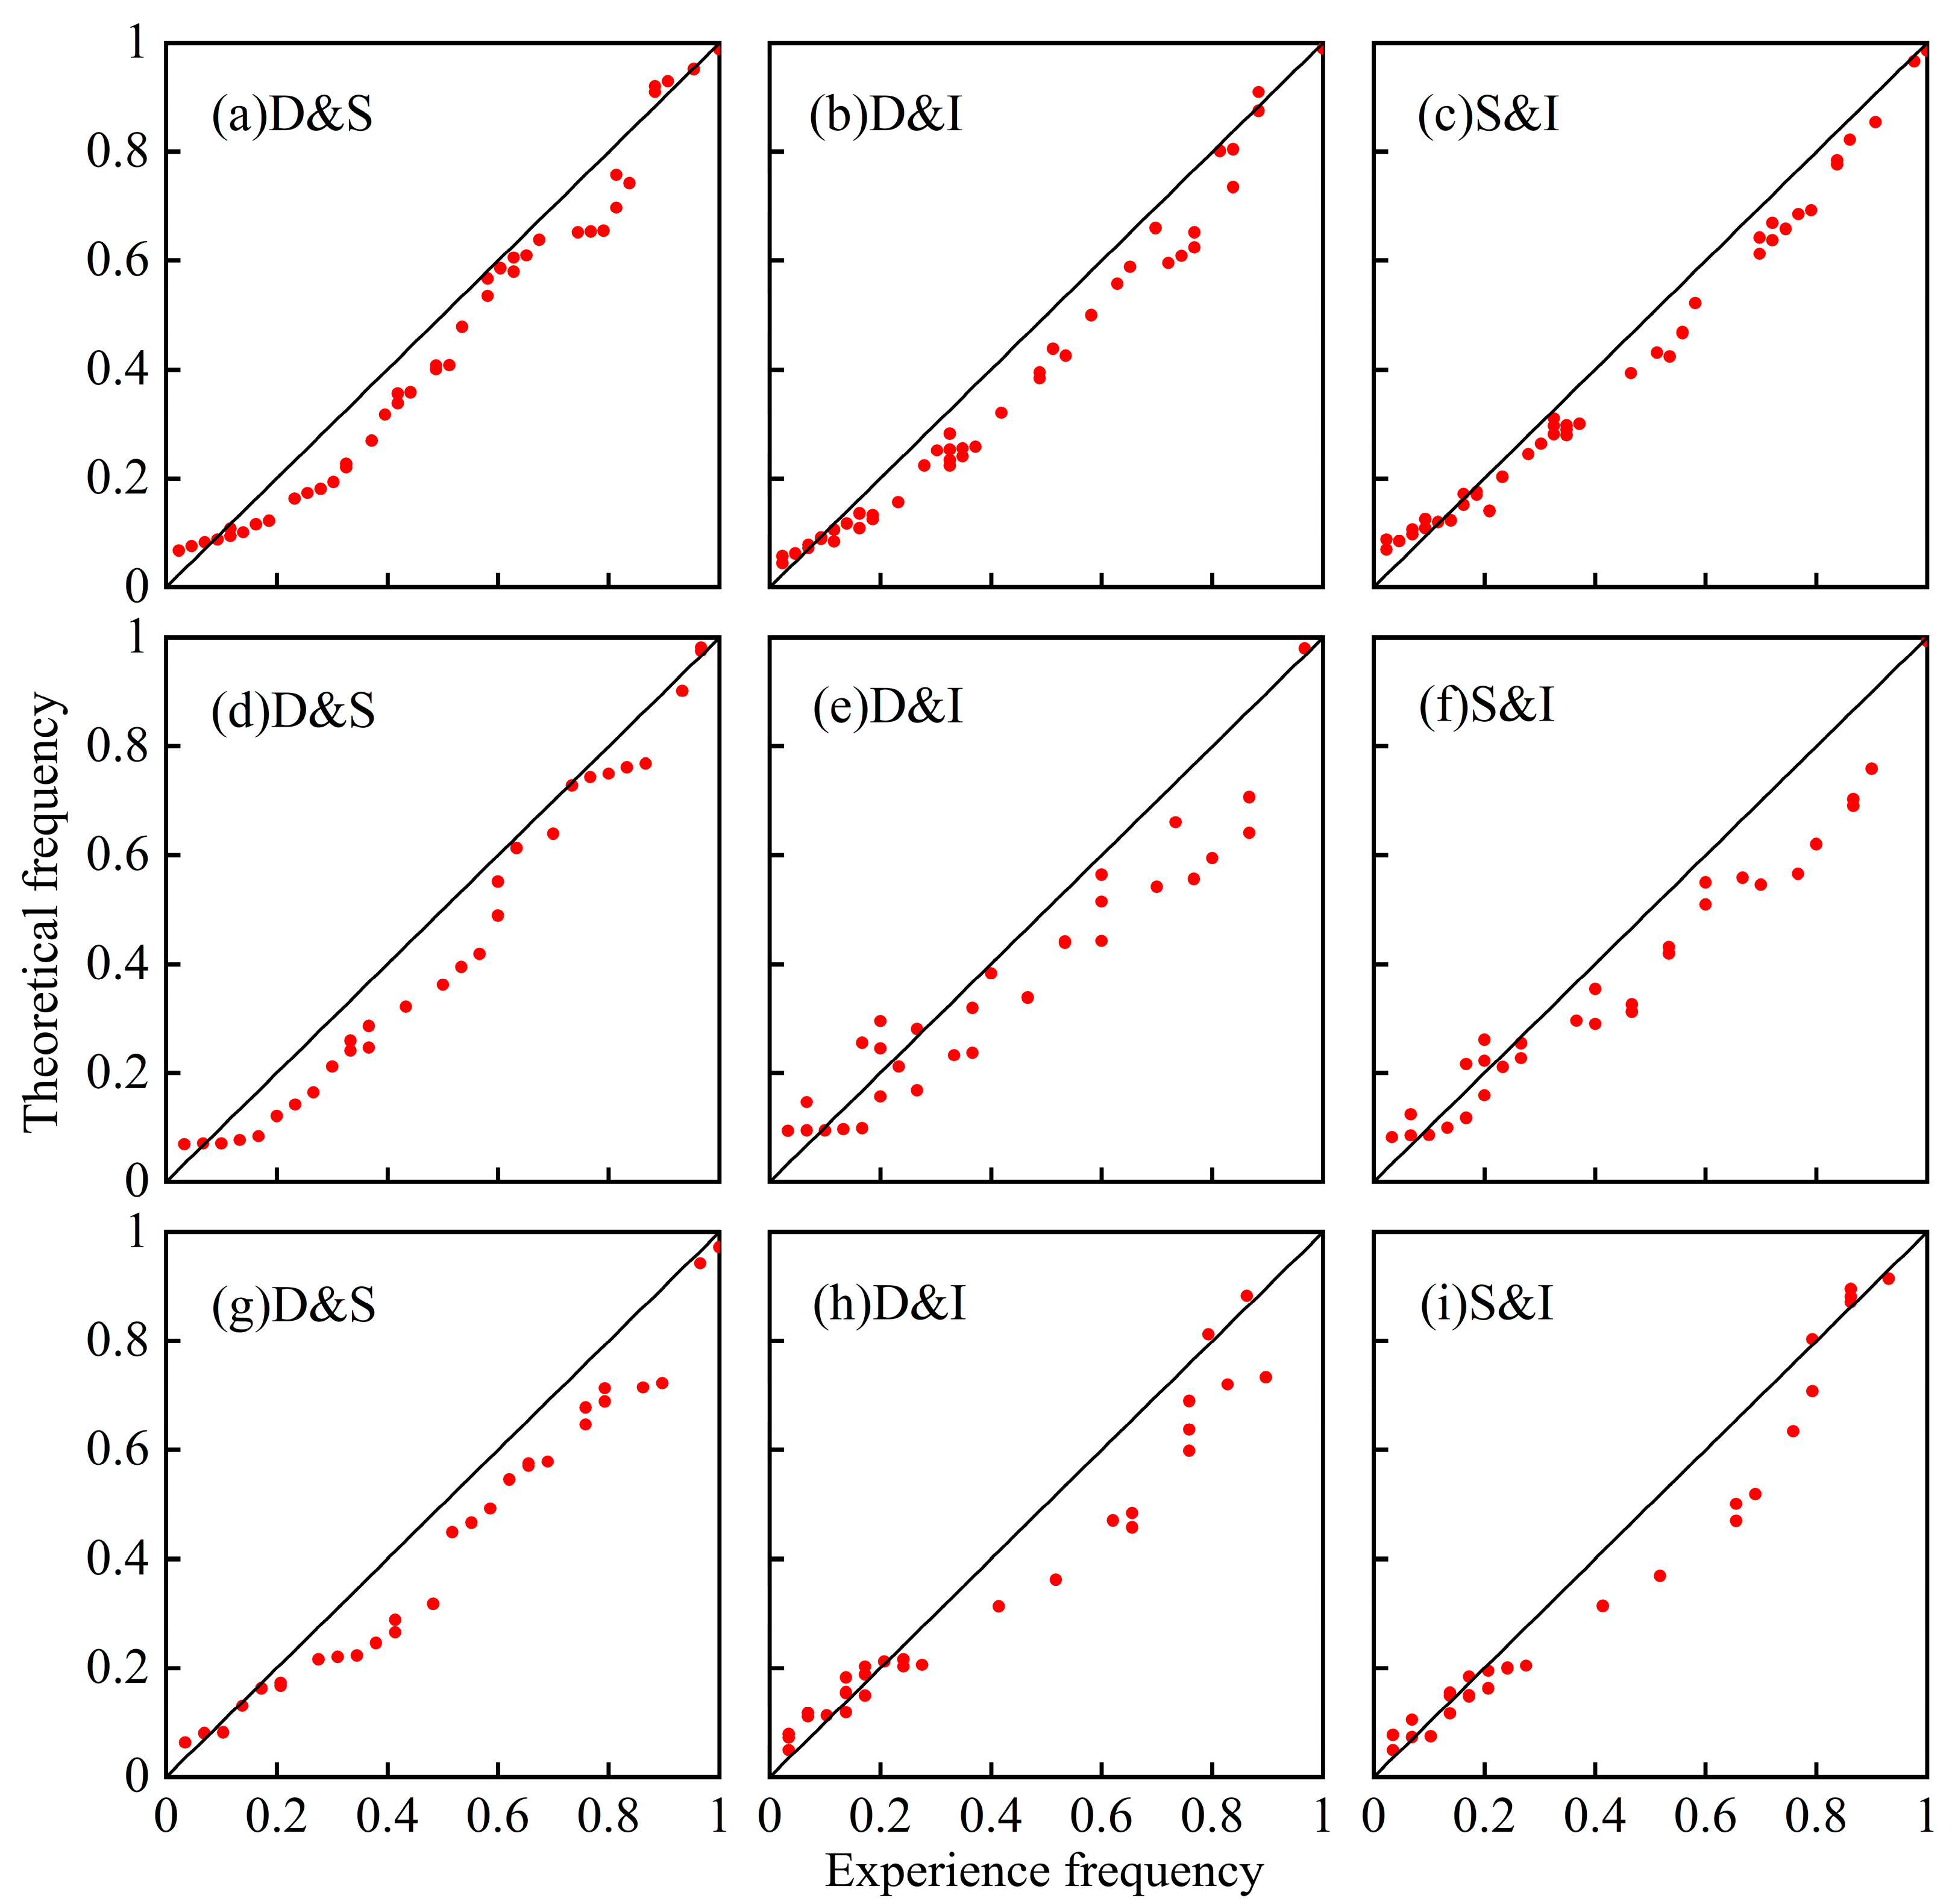
Based on the selected two-dimensional copula functions, the fitting graphs of the empirical and theoretical frequencies of two-dimensional drought characteristic variables in the middle reaches of the Yellow River Basin under historical, SSP245, and SSP585 scenarios were plotted (Figure 8). The data points were evenly distributed on both sides of the diagonal line, and the selected copula functions could fit the joint distribution of drought characteristics in the middle reaches of the Yellow River Basin well. The joint distribution value of D&S showed the best fitting effect, followed by the joint distribution values of D&I and S&I. Therefore, based on the selected copula functions, the two-dimensional joint probability and recurrence period of various sub-regions in the Yellow River Basin can be calculated for different periods.

3.5. Joint Distribution and Recurrence Period of Two-Dimensional Drought Characteristic Variables

3.5.1. Historical Joint Probability Distribution and Return Period

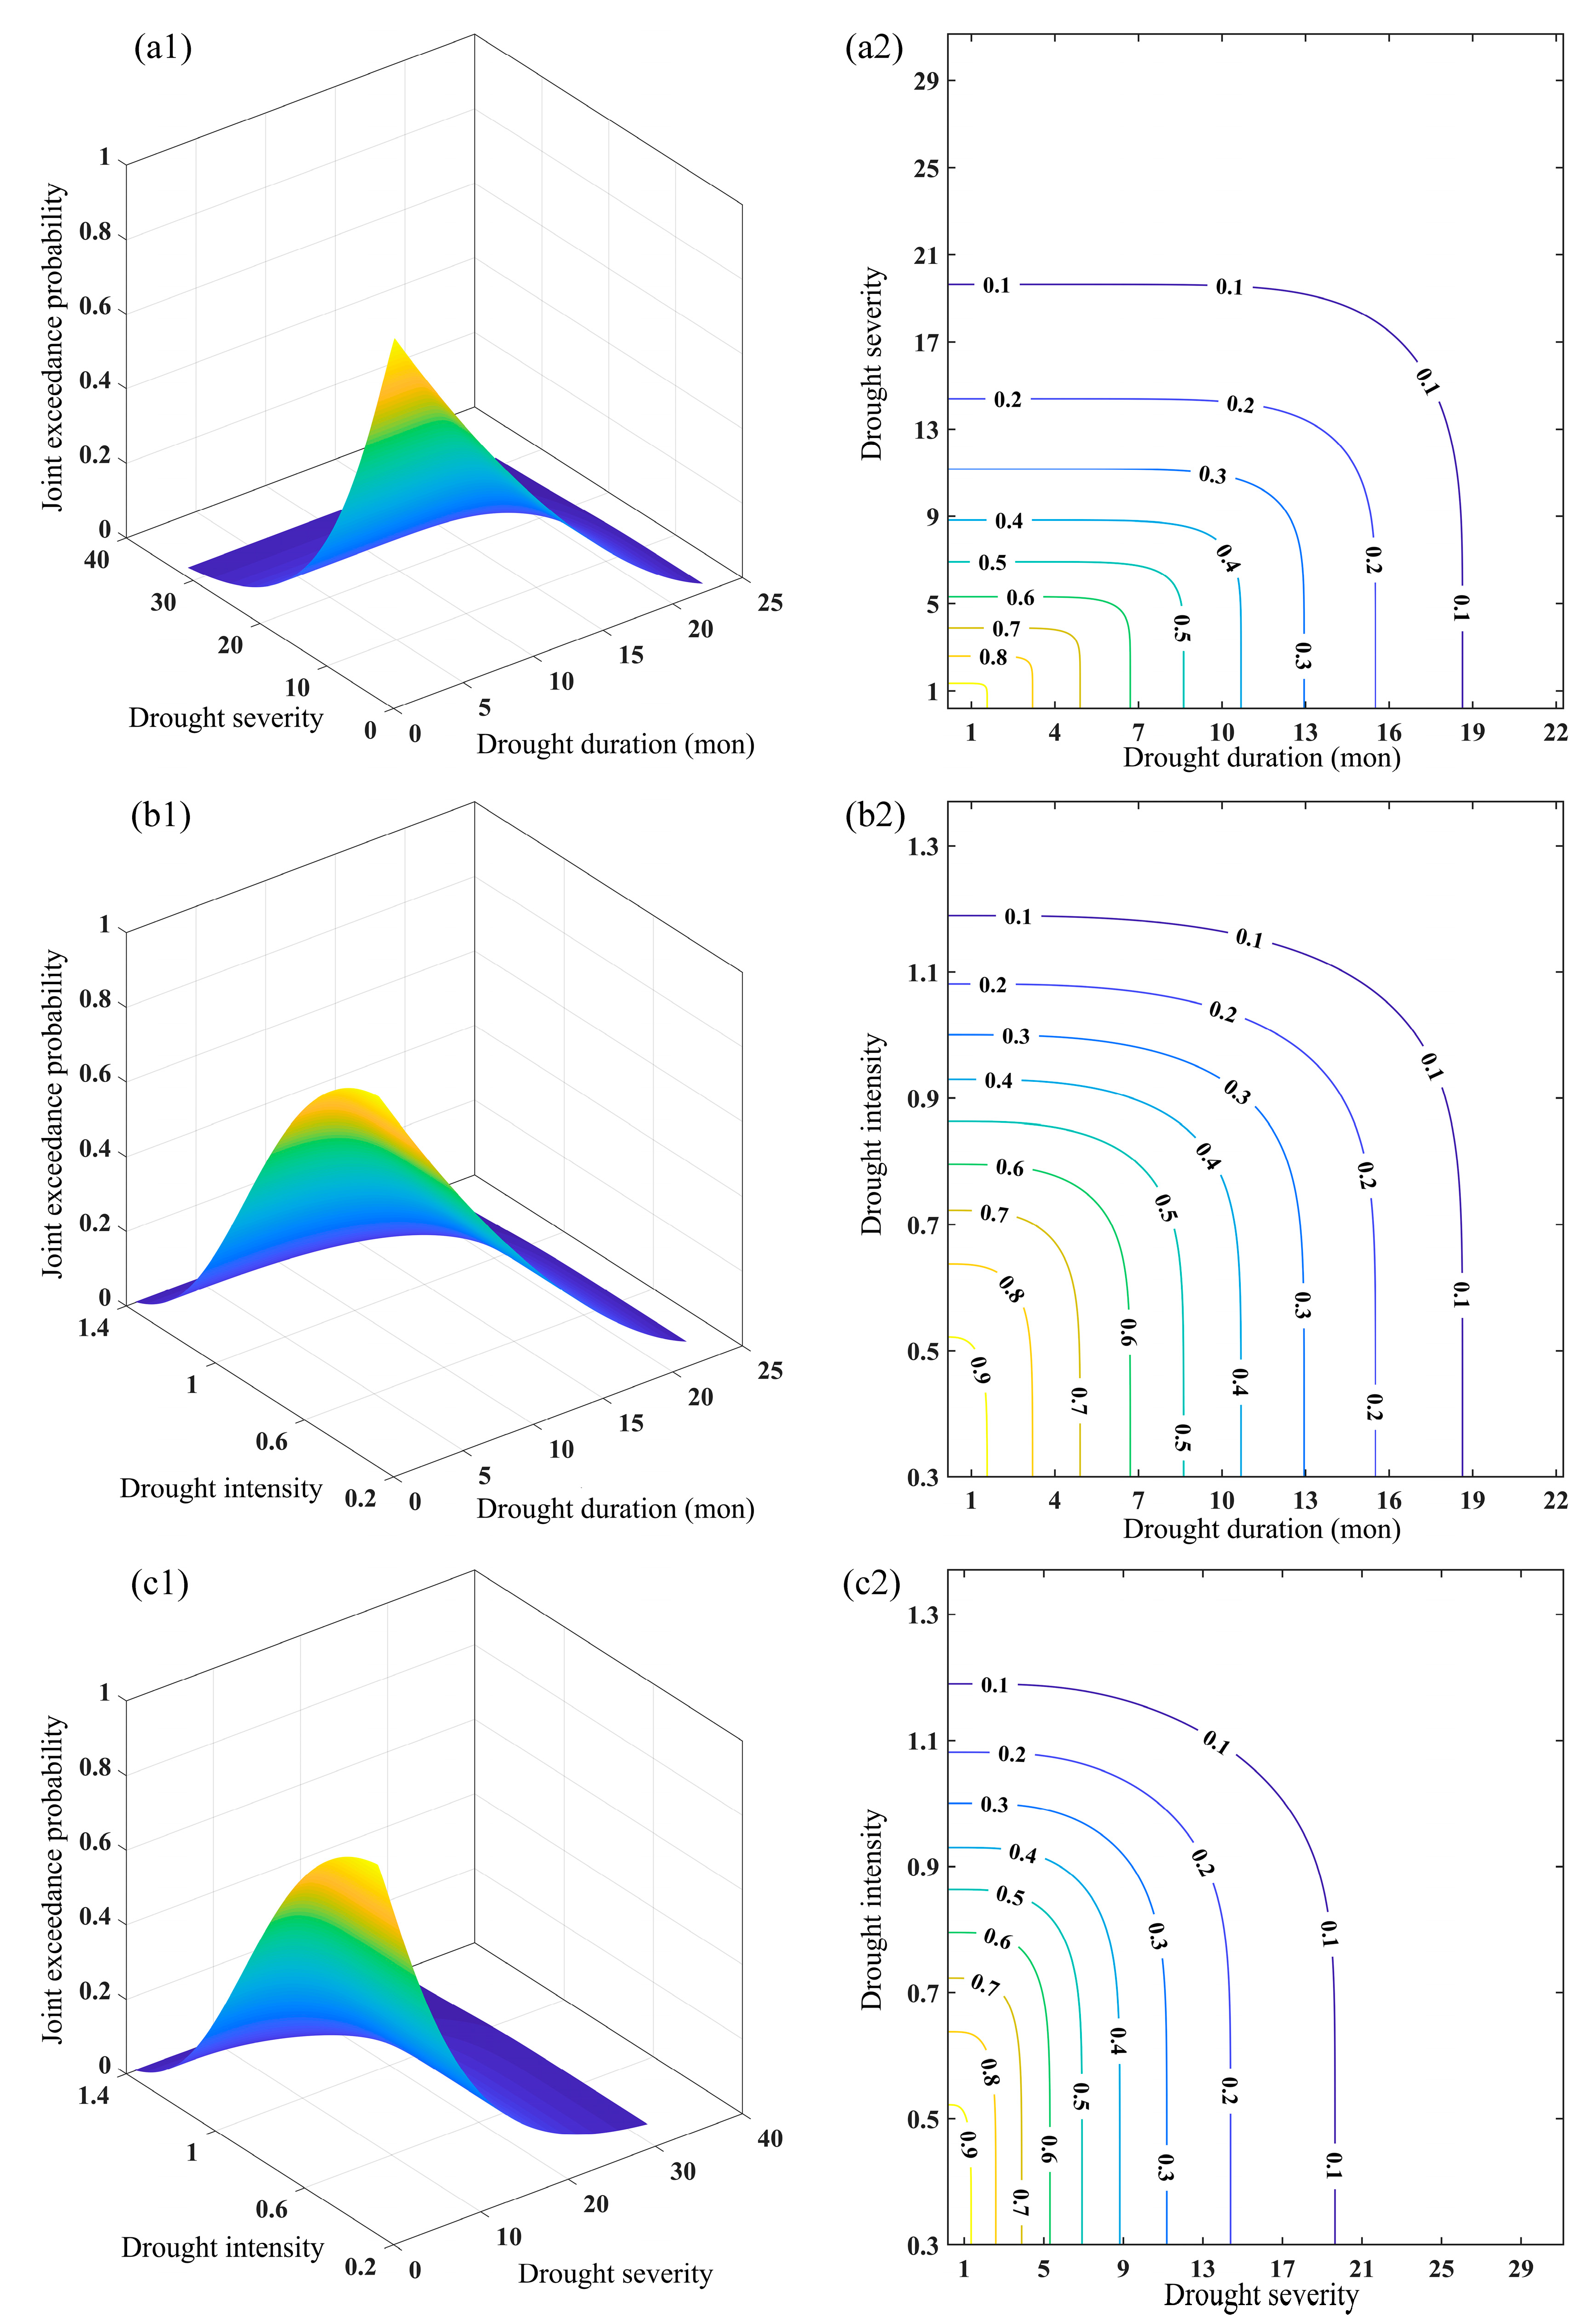
Based on the selected Gumbel copula function, the joint distribution values of D&S and D&I in the middle reaches of the Yellow River Basin during the historical period were established, and the joint distribution value of S&I was established using the Clayton copula function. The two-dimensional joint probability P(D ≤ d, S ≤ s) and joint exceedance probability P(D ≥ d, S ≥ s) values were then calculated (Figure 9 and Figure 10). When D ≤ 7 months and S ≤ 7, the contour lines of their joint probability values were densely distributed, and the joint cumulative probability rapidly increased with an increase in D or S. When D > 7 months, and S increased, the joint cumulative probability of the two variables still increased; however, the growth rate slowed down. Similarly, as D&I, or S&I increased, the joint cumulative probability also increased; however, the growth rate gradually slowed down. In general, as D, S, and I decreased, the joint probability values of any two variables also decreased, and the probability values reduced and the contour lines became denser. The joint exceedance probability values of any two variables also increased, indicating that drought events with short-duration, low-intensity, and low-severity outcomes were more likely to occur in the historical period in the middle reaches of the Yellow River Basin.
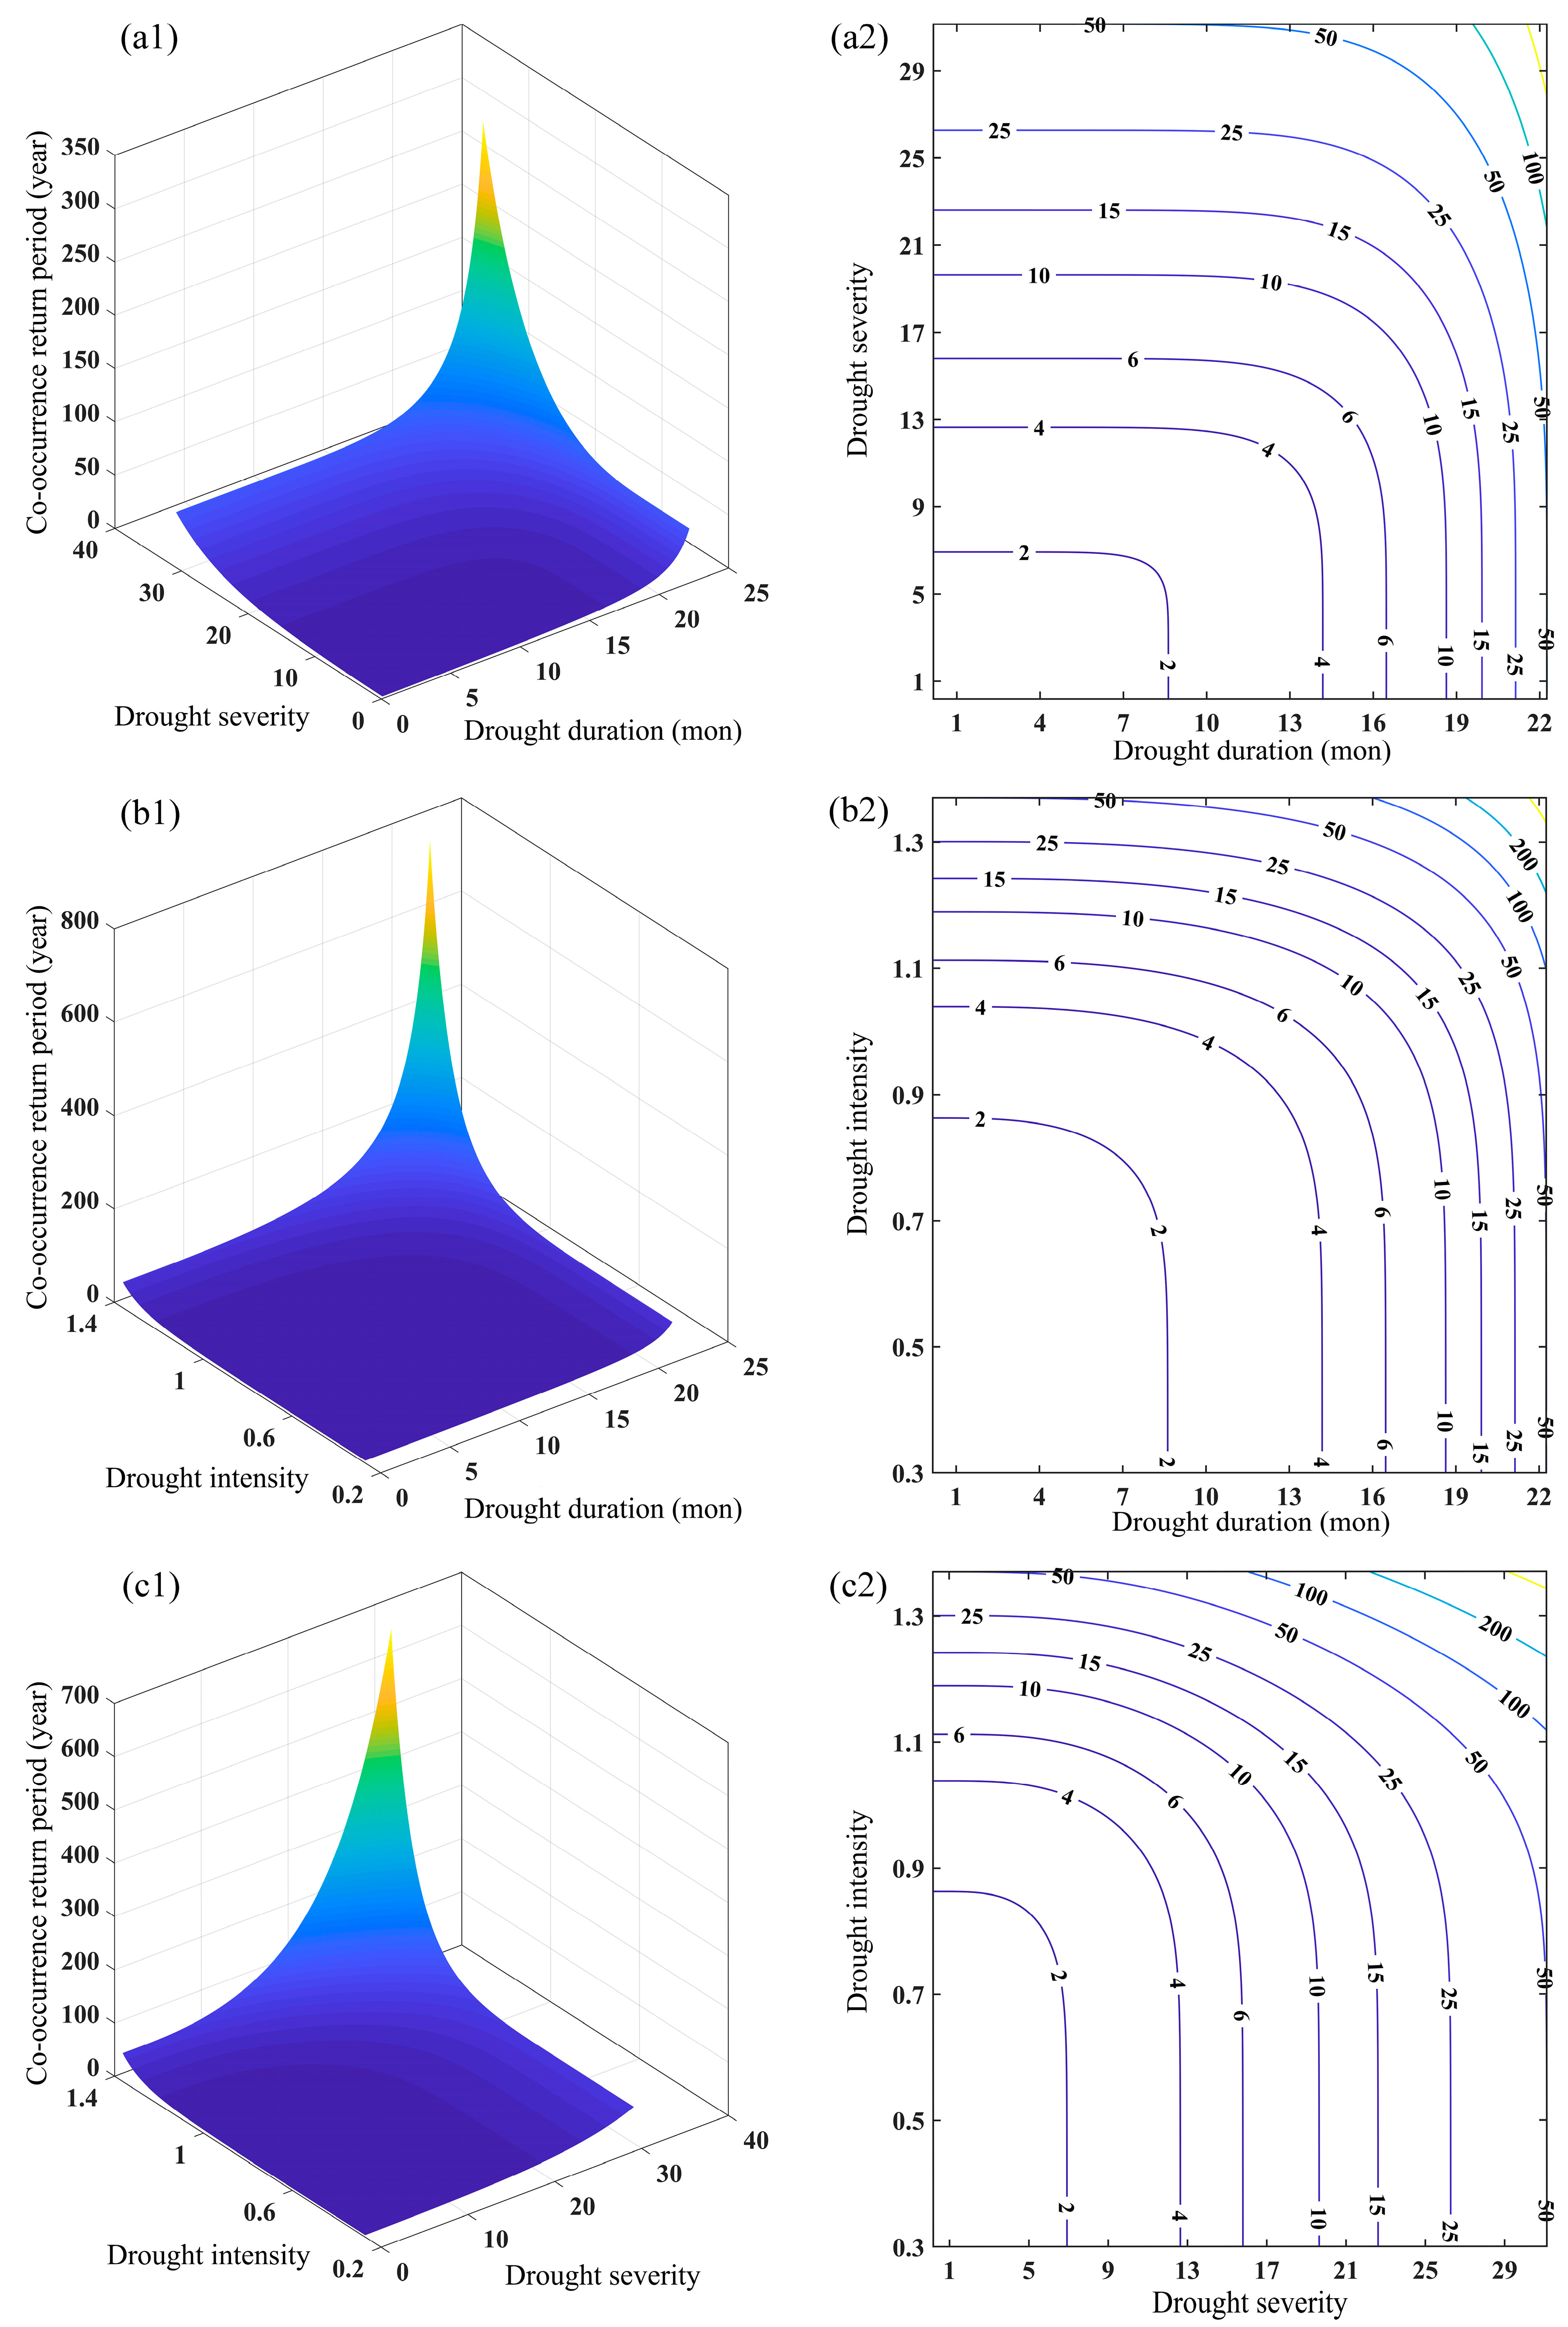
When we calculating the joint return period (To) and the coincident return period (Ta) of D&S, D&I, and S&I in the historical period of the Yellow River midstream (Figure 11 and Figure 12), we observed that the contour lines of To and Ta were concave and convex, respectively. As D, S, and I increased, the To and Ta values of drought events in the historical period of the Yellow River midstream also increased, with Ta increasing more significantly. Specifically, when D&S achieved the maximum values under the same conditions, the joint return period of this drought event was the longest, with a result of approximately 40 years and the coincident return period was approximately 270 years. When D&I achieved the maximum values under the same conditions, the joint return period of this drought event was approximately 35 years and the coincident return period was approximately 750 years. When S&I achieved the maximum values under the same conditions, the joint return period of this drought event was approximately 25 years and the coincident return period was approximately 650 years.

3.5.2. SSP245 Joint Probability Distribution and Return Period

Based on the selected Gumbel copula function, a joint distribution of D&S in the SSP245 scenario in the middle reaches of the Yellow River Basin was established, and the Clayton copula function was used to establish joint distribution values of D&I and S&I in the SSP245 scenario in the middle reaches of the Yellow River Basin. When D ≤ 9 months and S ≤ 8, the joint probability contour lines of the two were denser, and the joint cumulative probability rapidly increased with the increase in D or S. When D was 9 months, S continued to increase, or S > 8 and D continued to increase, the growth trend of the joint cumulative probability slowed down. Similarly, under the SSP245 emission scenario, the larger D&I or S&I, the greater the joint cumulative probability, and there was also a feature of a slowing growth trend. In general, drought events with short-duration, low-intensity, and low-severity outcomes are more likely to occur in the future in the middle reaches of the Yellow River Basin under the SSP245 emission scenario (Figures S7 and S8).
From the joint recurrence periods of D&S, D&I, and S&I in the middle reaches of the Yellow River Basin under the SSP245 emission scenario, it can be observed that, with the continuous increases in D, S, and I, the joint recurrence periods of drought events in the middle reaches of the Yellow River Basin under the SSP245 emission scenario presented a greater increase in the same recurrence period. When D&S achieved the maximum value under the same conditions, the joint recurrence period of this drought event was approximately 40 years and the same recurrence period was approximately 300 years. When D&I achieved the maximum value under the same conditions, the joint recurrence period of this drought event was approximately 24 years and the same recurrence period was approximately 1050 years. When S&I achieved the maximum values under the same conditions, the joint recurrence period of this drought event was approximately 25 years and the same recurrence period was approximately 1050 years (Figures S9 and S10).

3.5.3. SSP585 Joint Probability Distribution and Return Period

The joint distribution values of D&S, D&I, and S&I in the middle reaches of the Yellow River Basin under the SSP585 emission scenario were established using the preferred Clayton copula method. When S ≤ 9 and I ≤0.9, the contour lines of their joint probability values were dense, and the joint cumulative probability value rapidly increased with the increase in S or I. When S > 9, I continued to increase, or S continued to increase; the increasing trend of the joint cumulative probability value gradually slowed down. Similarly, as D&S or D&I increased under the SSP585 emission scenario, the joint cumulative probability also increased and exhibited a trend of slowing growth. Overall, short-duration, low-intensity, and low-severity drought events occurring in the middle reaches of the Yellow River Basin are more likely to occur in the future under the SSP585 emission scenario (Figures S11 and S12).
Based on the recurrence periods of D&S, D&I, and S&I in the middle reaches of the Yellow River Basin under the SSP585 emission scenario, it can be observed that, with the continuous increase in D, S, and I, the co-occurrence return period of drought events occurring in the middle reaches of the Yellow River Basin under the SSP585 emission scenario increased more significantly. When D and S were both at their maximum values under the same conditions, the joint recurrence period of this drought event was approximately 24 years and the co-occurrence return period was approximately 500 years. When D and I were both at their maximum values under the same conditions, the joint recurrence period of this drought event was approximately 25 years and the co-occurrence return period was approximately 1300 years. When S and I were both at their maximum values under the same conditions, the joint recurrence period of this drought event was approximately 25 years and the co-occurrence return period was approximately 1100 years (Figures S13 and S14).

3.5.4. Comparative Analysis of Univariate and Multivariate Recurrence Periods

The marginal distribution functions of drought duration, severity, and intensity indicators were used in this study to inverse calculate the corresponding drought characteristic variables and then derive the bivariate joint and coincidence recurrence periods, based on the provided single variable recurrence periods of 10, 20, 50, and 100 years (Table 5). The recurrence periods of each subregion in the Yellow River Basin under historical, SSP245, and SSP585 emission scenarios exhibited similar distribution patterns, mainly characterized by Ta (D&I) > Ta (S&I) > Ta (D&S) for coincidence recurrence periods and To (D&I) < To (S&I) < To (D&S) for joint recurrence periods. This result was related to the strength of the correlation between drought characteristic variables, among which the correlation between drought duration and severity was the highest. When one of the drought characteristic variables occurred, the probability of the occurrence of the other variable increased, indicating a greater drought risk. Under the given single-variable recurrence periods of 10, 20, 50, and 100 years, the single-variable characteristic values were the largest under the SSP585 emission scenario, followed by SSP245 and the historical period, indicating that the impact of drought occurrence in the future period under increasing emission concentrations would be more severe. The single-variable recurrence period in the Yellow River Basin was always higher than the joint recurrence period and lower than the coincidence recurrence period under historical and SSP245 and SSP585 emission scenarios. For example, under the SSP245 scenario, when the theoretical single-variable recurrence period of the drought indicator was 20 years, the joint recurrence period of D&I was 11.48 years, and the coincidence recurrence period was 77.64 years. Thus, the actual single-variable recurrence period of drought occurrence can be bounded by these two recurrence periods. When the increase in the single-variable recurrence period was constant, the increase in the coincidence recurrence period of bivariate variables was always much higher than the increase in the joint recurrence period. Drought events with joint recurrence periods presented a higher likelihood of occurrence than those with coincidence recurrence periods.

4. Discussion

Global climate models are effective tools to conduct human prediction studies and research on future climate change activity, which have been widely recognized in the academic community. Although global climate models cannot simulate future climate change outcomes with complete accuracy due to corresponding structural issues, parameter settings, and the spatial resolution of data, this is an unavoidable limitation of the methods at present. Studies conducted in this field of research have shown that, although the uncertainty of climate model data for predicting future precipitation and temperature levels exist in the literature, the trends in simulating climate change events and the average regional conditions are still credible [25,26,27,28,29,30]. Therefore, based on the global climate model data, the estimation of changes occurring in meteorological drought conditions in the Yellow River Basin in the future is credible, despite the existence of some uncertainties. In recent years, scholars have used global climate model data to predict the spatiotemporal characteristics of meteorological drought occurrence in the Pearl River Basin, Huanghuaihai region, and Inner Mongolia in the future [31,32,33]. Yang et al. (2018) [34] estimated the meteorological drought situation in the Yellow River Basin in the future under the three scenarios of RCP2.6, RCP4.5, and RCP8.5, using the SPI index, and observed that the meteorological drought situation in the Yellow River Basin in the future will improve. However, this conclusion is controversial as the SPI index does not consider the impact of temperature increase on drought conditions. Therefore, this study used two indices of the standardized precipitation–evapotranspiration index to jointly evaluate and predict the meteorological drought situation in the future in the Yellow River Basin.
The Yellow River Basin is often regarded in the literature as one of the regions most vulnerable to climate change and extreme weather events, primarily due to its fragile arid and semi-arid ecosystems [35]. Similar to the study conducted by Wang et al. (2022) [36] on drought occurrence in the Yellow River Basin, we also chose to use the SPEI index alone to investigate the reasons for drought conditions in the historical and future scenarios of the middle reaches of the Yellow River Basin for two reasons: first, the SPEI index can explain the impact of precipitation and potential evapotranspiration levels on drought occurrence, which is more reasonable in the case of climate warming; second, the SPEI index can estimate the water balance levels under multiple timescales and can also be used to analyze drought impacts with different time lags [37]. Numerous results indicate that the main cause of increased drought is the increase in evapotranspiration levels resulting from high temperatures [38]. This study determined that the middle reaches of the Yellow River Basin will experience a warming trend in the future; therefore, under four emission scenarios, the relative increase in drought severity in some years compared to the historical period can be explained by the abovementioned theory (Figure 3 and Figure 4). Li et al. (2022) [39] divided the period from 2021 to 2100 in the Yellow River Basin into three stages and observed that the severity of drought will increase in the near-future (2021–2040) and ease in the middle- (2041–2060) and distant-future (2081–2100) periods. Although the present study focused on the overall trend, ranging from 2022 to 2100, the same changing pattern is well reflected in Figure 3 and Figure 4. Overall, the future drought pattern observable in the middle reaches of the Yellow River Basin varied significantly; however, relatively severe droughts will still be experienced. The reason for this is that the central and western parts of the Yellow River experience arid and semi-arid regions, with relatively low average annual precipitation levels, far from the ocean, and surrounded by mountains [40]. Under the background of rapid global warming effects, the El Niño–Southern Oscillation (ENSO) phenomenon leads to increased temperature and uneven precipitation levels in the surrounding areas of Inner Mongolia [41], which increases the likelihood of drought events in the abovementioned regions. The combination of the run-length theory and copula function appropriately characterizes the meteorological drought characteristics of the middle reaches of the Yellow River Basin. The quantitative evaluation we performed of the recurrence period of drought events assessed the probability level of specific drought events [42], which is consistent with the results achieved by Wang et al. (2022) in their [36] study. As the duration, intensity, and severity outcomes of meteorological drought occurrence increase, the corresponding recurrence period of meteorological droughts will also increase, and the in-depth research on drought occurrence and the related risks will need to be conducted in the future. Finally, it should be noted that, in addition to climate and meteorological drivers, drought occurrence in the Yellow River Basin may also be affected by human factors, such as afforestation, dam and reservoir water control, etc. [43]. Due to the complex impact of human activities on hydro-meteorological processes, further research is required to understand their role in drought formation and propagation processes.

5. Conclusions

This study was based on the run-length theory and combined copula functions to establish an effective method for identifying future multi-emission drought scenarios in a watershed area. Drought events occurring in the watershed area were identified, and drought duration, severity, and intensity outcomes under current and future climate scenarios were identified. The current drought trend in the middle reaches of the Yellow River Basin is worsening, and drought severity presented a decreasing trend under four future climate scenarios. Based on the copula function, drought events with short-duration, low-drought-severity, and weak-drought-intensity outcomes were more likely to occur in different zones of the Yellow River Basin under historical and SSP245/SSP585 emission scenarios. The order of occurrence was generally Ta(D&I) > Ta(S&I) > Ta(D&S), and the joint return period followed the order To(D&I) < To(S&I) < To(D&S). Compared with the historical period, the frequency of a long drought duration, high drought severity, or intense drought events may increase in the future under the SSP245 and SSP585 emission scenarios in the middle reaches of the Yellow River Basin. The univariate return period was higher than the joint return period and lower than the concurrent return period, which can be used to estimate the univariate return period of actual drought occurring in the area using these two return periods.
This study was based on the delta statistical downscaling approach, which performs well for trend feedback issues; however, it still presents discrepancies when simulating the numerical values of the basin’s annual and monthly data compared to the actual values. Future studies should combine different downscaling techniques, nesting regional climate models within global climate models, and using a combination of equally and non-equally weighted average ensemble methods to further reduce climate model uncertainty and improve simulation accuracy results. In addition, this study only selected the SPEI as the drought index, and future research should use multiple indicators to collectively assess drought occurrence and reduce the uncertainty associated with a single indicator. Furthermore, based on the existing two-dimensional drought research, the further analysis of the joint distribution and return periods of the three-dimensional drought characteristic variables (D&S&I) would be of great importance for a more thorough understanding of the impact of climate change on drought occurrence in the Yellow River Basin.

Supplementary Materials

The following supporting information can be downloaded at: https://www.mdpi.com/article/10.3390/w15122265/s1.

Author Contributions

Conceptualization, G.Z.; methodology, Z.Z.; software, X.L.; validation, X.Z.; formal analysis, B.Z.; investigation, B.Z.; resources, X.Z.; data curation, G.Z.; writing—original draft preparation, G.Z.; writing—review and editing, Z.Z.; supervision, X.Z.; project administration, G.Z.; funding acquisition, G.Z. All authors have read and agreed to the published version of the manuscript.

Funding

Huang Committee Outstanding Young Talents Science and Technology Project (HQK-202305); Qian Kehe Zhicheng (2023) Yiban 206.

Data Availability Statement

Not applicable.

Conflicts of Interest

The authors declare no conflict of interest.

References

  1. Nooni, I.K.; Hagan, D.F.T.; Wang, G.; Ullah, W.; Lu, J.; Li, S.; Dzakpasu, M.; Prempeh, N.A.; Sian, K.T.C.L.K. Future changes in simulated evapotranspiration across continental Africa based on CMIP6 CNRM-CM6. Int. J. Environ. Res. Public Health 2021, 18, 6760. [Google Scholar] [CrossRef] [PubMed]
  2. Ukkola, A.M.; De Kauwe, M.G.; Roderick, M.L.; Abramowitz, G.; Pitman, A.J. Robust future changes in meteorological drought in CMIP6 projections despite uncertainty in precipitation. Geophys. Res. Lett. 2020, 47, e2020GL087820. [Google Scholar] [CrossRef]
  3. IPCC. Climate Change 2022: Mitigation of Climate Change Contribution of Working Group Ⅲ to the Sixth Assessment Report of the Intergovernmental Panel on Climate Change; Cambridge University Press: Cambridge, UK; New York, NY, USA, 2022. [Google Scholar]
  4. Tian, C.; Yue, X.; Zhou, H.; Lei, Y.; Ma, Y.; Cao, Y. Projections of changes in ecosystem productivity under 1.5 °C and 2 °C global warming. Glob. Planet. Chang. 2021, 205, 103588. [Google Scholar] [CrossRef]
  5. Xu, J. Reconstructing the suspended sediment load of the Yellow River since 1470 CE using the Drought and Flood Index. Geomorphology 2017, 299, 131–141. [Google Scholar] [CrossRef]
  6. Hong, J.; Javan, K.; Shin, Y.; Park, J.-S. Future projections and uncertainty assessment of precipitation extremes in Iran from the CMIP6 ensemble. Atmosphere 2021, 12, 1052. [Google Scholar] [CrossRef]
  7. Song, Y.H.; Shahid, S.; Chung, E. Differences in multi-model ensembles of CMIP5 and CMIP6 projections for future droughts in South Korea. Int. J. Climatol. 2022, 42, 2688–2716. [Google Scholar] [CrossRef]
  8. Wu, J.; Miao, C.; Wang, Y.; Duan, Q.; Zhang, X. Contribution analysis of the long-term changes in seasonal runoff on the Loess Plateau, China, using eight Budyko-based methods. J. Hydrol. 2017, 545, 263–275. [Google Scholar] [CrossRef]
  9. Douglas, E.M.; Jacobs, J.M.; Sumner, D.M.; Ray, R.L. A comparison of models for estimating potential evapotranspiration for Florida land cover types. J. Hydrol. 2009, 373, 366–376. [Google Scholar] [CrossRef]
  10. Yan, X.; Mohammadian, A. Estimating future daily pan evaporation for Qatar using the Hargreaves model and statistically downscaled global climate model projections under RCP climate change scenarios. Arab. J. Geosci. 2020, 13, 938. [Google Scholar] [CrossRef]
  11. Manabe, S.; Smagorinsky, J.; Strickler, R.F. Simulated climatology of a general circulation model with a hydrologic cycle 1. Mon. Weather Rev. 1965, 93, 769–798. [Google Scholar] [CrossRef]
  12. Iqbal, Z.; Shahid, S.; Ahmed, K.; Ismail, T.; Khan, N.; Virk, Z.T.; Johar, W. Evaluation of global climate models for precipitation projection in sub-Himalaya region of Pakistan. Atmos. Res. 2020, 245, 105061. [Google Scholar] [CrossRef]
  13. Gellens, D.; Roulin, E. Streamflow response of Belgian catchments to IPCC climate change scenarios. J. Hydrol. 1998, 210, 242–258. [Google Scholar] [CrossRef]
  14. Torres, R.R.; Marengo, J.A. Climate change hotspots over South America: From CMIP3 to CMIP5 multi-model datasets. Theor. Appl. Climatol. 2014, 117, 579–587. [Google Scholar] [CrossRef]
  15. Vicente-Serrano, S.M.; Beguería, S.; López-Moreno, J.I. A multiscalar drought index sensitive to global warming: The standardized precipitation evapotranspiration index. J. Clim. 2010, 23, 1696–1718. [Google Scholar] [CrossRef] [Green Version]
  16. Harding, K.J.; Snyder, P.K. Examining future changes in the character of Central U.S. warm-season precipitation using dynamical downscaling. J. Geophys. Res. Atmos. 2014, 119, 13116–13136. [Google Scholar] [CrossRef] [Green Version]
  17. Engström, J.; Keellings, D. Drought in the Southeastern USA: An assessment of downscaled CMIP5 models. Clim. Res. 2018, 74, 251–262. [Google Scholar] [CrossRef]
  18. Ma, Z.; Sun, P.; Zhang, Q.; Zou, Y.; Lv, Y.; Li, H.; Chen, D. The characteristics and evaluation of future droughts across China through the CMIP6 multi-model ensemble. Remote Sens. 2022, 14, 1097. [Google Scholar] [CrossRef]
  19. Fu, Y.; Lin, Z.; Wang, T. Simulated Relationship between Wintertime ENSO and East Asian Summer Rainfall: From CMIP3 to CMIP6. Adv. Atmos. Sci. 2021, 38, 221–236. [Google Scholar] [CrossRef]
  20. Wang, L.; Chen, W. A CMIP5 multimodel projection of future temperature, precipitation, and climatological drought in China. Int. J. Climatol. 2014, 34, 2059–2078. [Google Scholar] [CrossRef]
  21. Zhu, X.; Ji, Z.; Wen, X.; Lee, S.; Wei, Z.; Zheng, Z.; Dong, W. Historical and projected climate change over three major river basins in China from Fifth and Sixth Coupled Model Intercomparison Project models. Int. J. Climtol. 2021, 41, 6455–6473. [Google Scholar] [CrossRef]
  22. Zhu, H.; Jiang, Z.; Li, L. Projection of climate extremes in China, an incremental exercise from CMIP5 to CMIP6. Sci. Bull. 2021, 66, 2528–2537. [Google Scholar] [CrossRef] [PubMed]
  23. Yu, T.; Chen, W.; Gong, H.; Feng, J.; Chen, S. Comparisons between CMIP5 and CMIP6 models in simulations of the climatology and interannual variability of the east Asian summer Monsoon. Clim. Dynam. 2022, 60, 2183–2198. [Google Scholar] [CrossRef]
  24. Qian, L.; Wang, X.; Wang, Z. Modeling the dependence pattern between two precipitation variables using a coupled copula. Environ. Earth Sci. 2020, 79, 486. [Google Scholar] [CrossRef]
  25. Xu, J.; Gao, Y.; Chen, D.; Xiao, L.; Ou, T. Evaluation of global climate models for downscaling applications centred over the Tibetan Plateau. Int. J. Climatol. 2017, 37, 657–671. [Google Scholar] [CrossRef]
  26. Storch, H.V. Inconsistencies at the interface of climate impact studies and global climate research. Meteorol. Z. 1992, 4, 72–80. [Google Scholar]
  27. Chen, J.; Brissette, F.P.; Leconte, R. Coupling statistical and dynamical methods for spatial downscaling of precipitation. Clim. Chang. 2012, 114, 509–526. [Google Scholar] [CrossRef]
  28. Zhang, Z.; Deng, S.; Zhao, Q.; Zhang, S.; Zhang, X. Projected glacier meltwater and river run-off changes in the Upper Reach of the Shule River Basin, north-eastern edge of the Tibetan Plateau. Hydrol. Process. 2019, 33, 1059–1074. [Google Scholar] [CrossRef]
  29. Ding, Y.; Peng, S. Spatiotemporal change and attribution of potential evapotranspiration over China from 1901 to 2100. Theor. Appl. Climatol. 2021, 145, 79–94. [Google Scholar] [CrossRef]
  30. Hay, L.E.; Wilby, R.; Leavesley, G.H. A comparison of delta change and downscaled GCM scenarios for three mountainous basins in the United States. J. Am. Water Resour. Assoc. 2000, 36, 387–397. [Google Scholar] [CrossRef]
  31. Salahi, B.; Poudineh, E. An evaluation of Delta and SDSM Downscaling Models for simulating and forecasting of average wind velocity in Sistan, Iran. Model. Earth Syst. Environ. 2022, 8, 4441–4453. [Google Scholar] [CrossRef]
  32. Jian, S.; Wang, A.; Hu, C.; Yan, D. Effect of landscape restoration on evapotranspiration and water use in the Yellow River Basin, China. Acta Geophys. 2023, 175, 106504. [Google Scholar] [CrossRef]
  33. Thornthwaite, C.W. An approach toward a rational classification of climate. Geogr. Rev. 1948, 38, 55–94. [Google Scholar] [CrossRef]
  34. Yang, C.; Wang, N.; Wang, S.; Zhou, L. Performance comparison of three predictor selection methods for statistical downscaling of daily precipitation. Theor. Appl. Climatol. 2018, 131, 43–54. [Google Scholar] [CrossRef]
  35. Zhao, F.; Ma, S.; Wu, Y.; Qiu, L.; Wang, W.; Lian, Y.; Chen, J.; Sivakumar, B. The role of climate change and vegetation greening on evapotranspiration variation in the Yellow River Basin, China. Agric. For. Meteorol. 2022, 316, 108842. [Google Scholar] [CrossRef]
  36. Wang, Y.; Wang, S.; Zhao, W.; Liu, Y. The increasing contribution of potential evapotranspiration to severe droughts in the Yellow River basin. J. Hydrol. 2022, 605, 127310. [Google Scholar] [CrossRef]
  37. Jian, S.; Wang, A.; Su, C.; Wang, K. Prediction of future spatial and temporal evolution trends of reference evapotranspiration in the Yellow River Basin, China. Remote Sens. 2022, 14, 5674. [Google Scholar] [CrossRef]
  38. Dai, A. Drought under global warming: A review. WIREs Clim. Chang. 2011, 2, 45–65. [Google Scholar] [CrossRef] [Green Version]
  39. Li, C.; Kattel, G.; Zhang, J.; Shang, Y.; Gnyawali, K.R.; Zhang, F.; Miao, L. Slightly enhanced drought in the Yellow River Basin under future warming scenarios. Atmos. Res. 2022, 280, 106423. [Google Scholar] [CrossRef]
  40. John, R.; Chen, J.Q.; Giannico, V.; Park, H.; Xiao, J.; Shirkey, G.; Ouyang, Z.; Shao, C.; Lafortezza, R.; Qi, J. Grassland canopy cover and aboveground biomass in Mongolia and Inner Mongolia: Spatiotemporal estimates and controlling factors. Remote Sens. Environ. 2018, 213, 34–48. [Google Scholar] [CrossRef]
  41. Ault, T.R. On the essentials of drought in a changing climate. Science Am. Assoc. Adv. Sci. 2020, 368, 256–260. [Google Scholar] [CrossRef]
  42. Peng, S.; Gang, C.; Cao, Y.; Chen, Y. Assessment of climate change trends over the Loess Plateau in China from 1901 to 2100. Int. J. Climatol. 2018, 38, 2250–2264. [Google Scholar] [CrossRef]
  43. AghaKouchak, A.; Mirchi, A.; Madani, K.; Di Baldassarre, G.; Nazemi, A.; Alborzi, A.; Anjileli, H.; Azarderakhsh, M.; Chiang, F.; Hassanzadeh, E.; et al. Anthropogenic drought: Definition, challenges, and opportunities. Rev. Geophys. 2021, 59, e2019RG000683. [Google Scholar] [CrossRef]
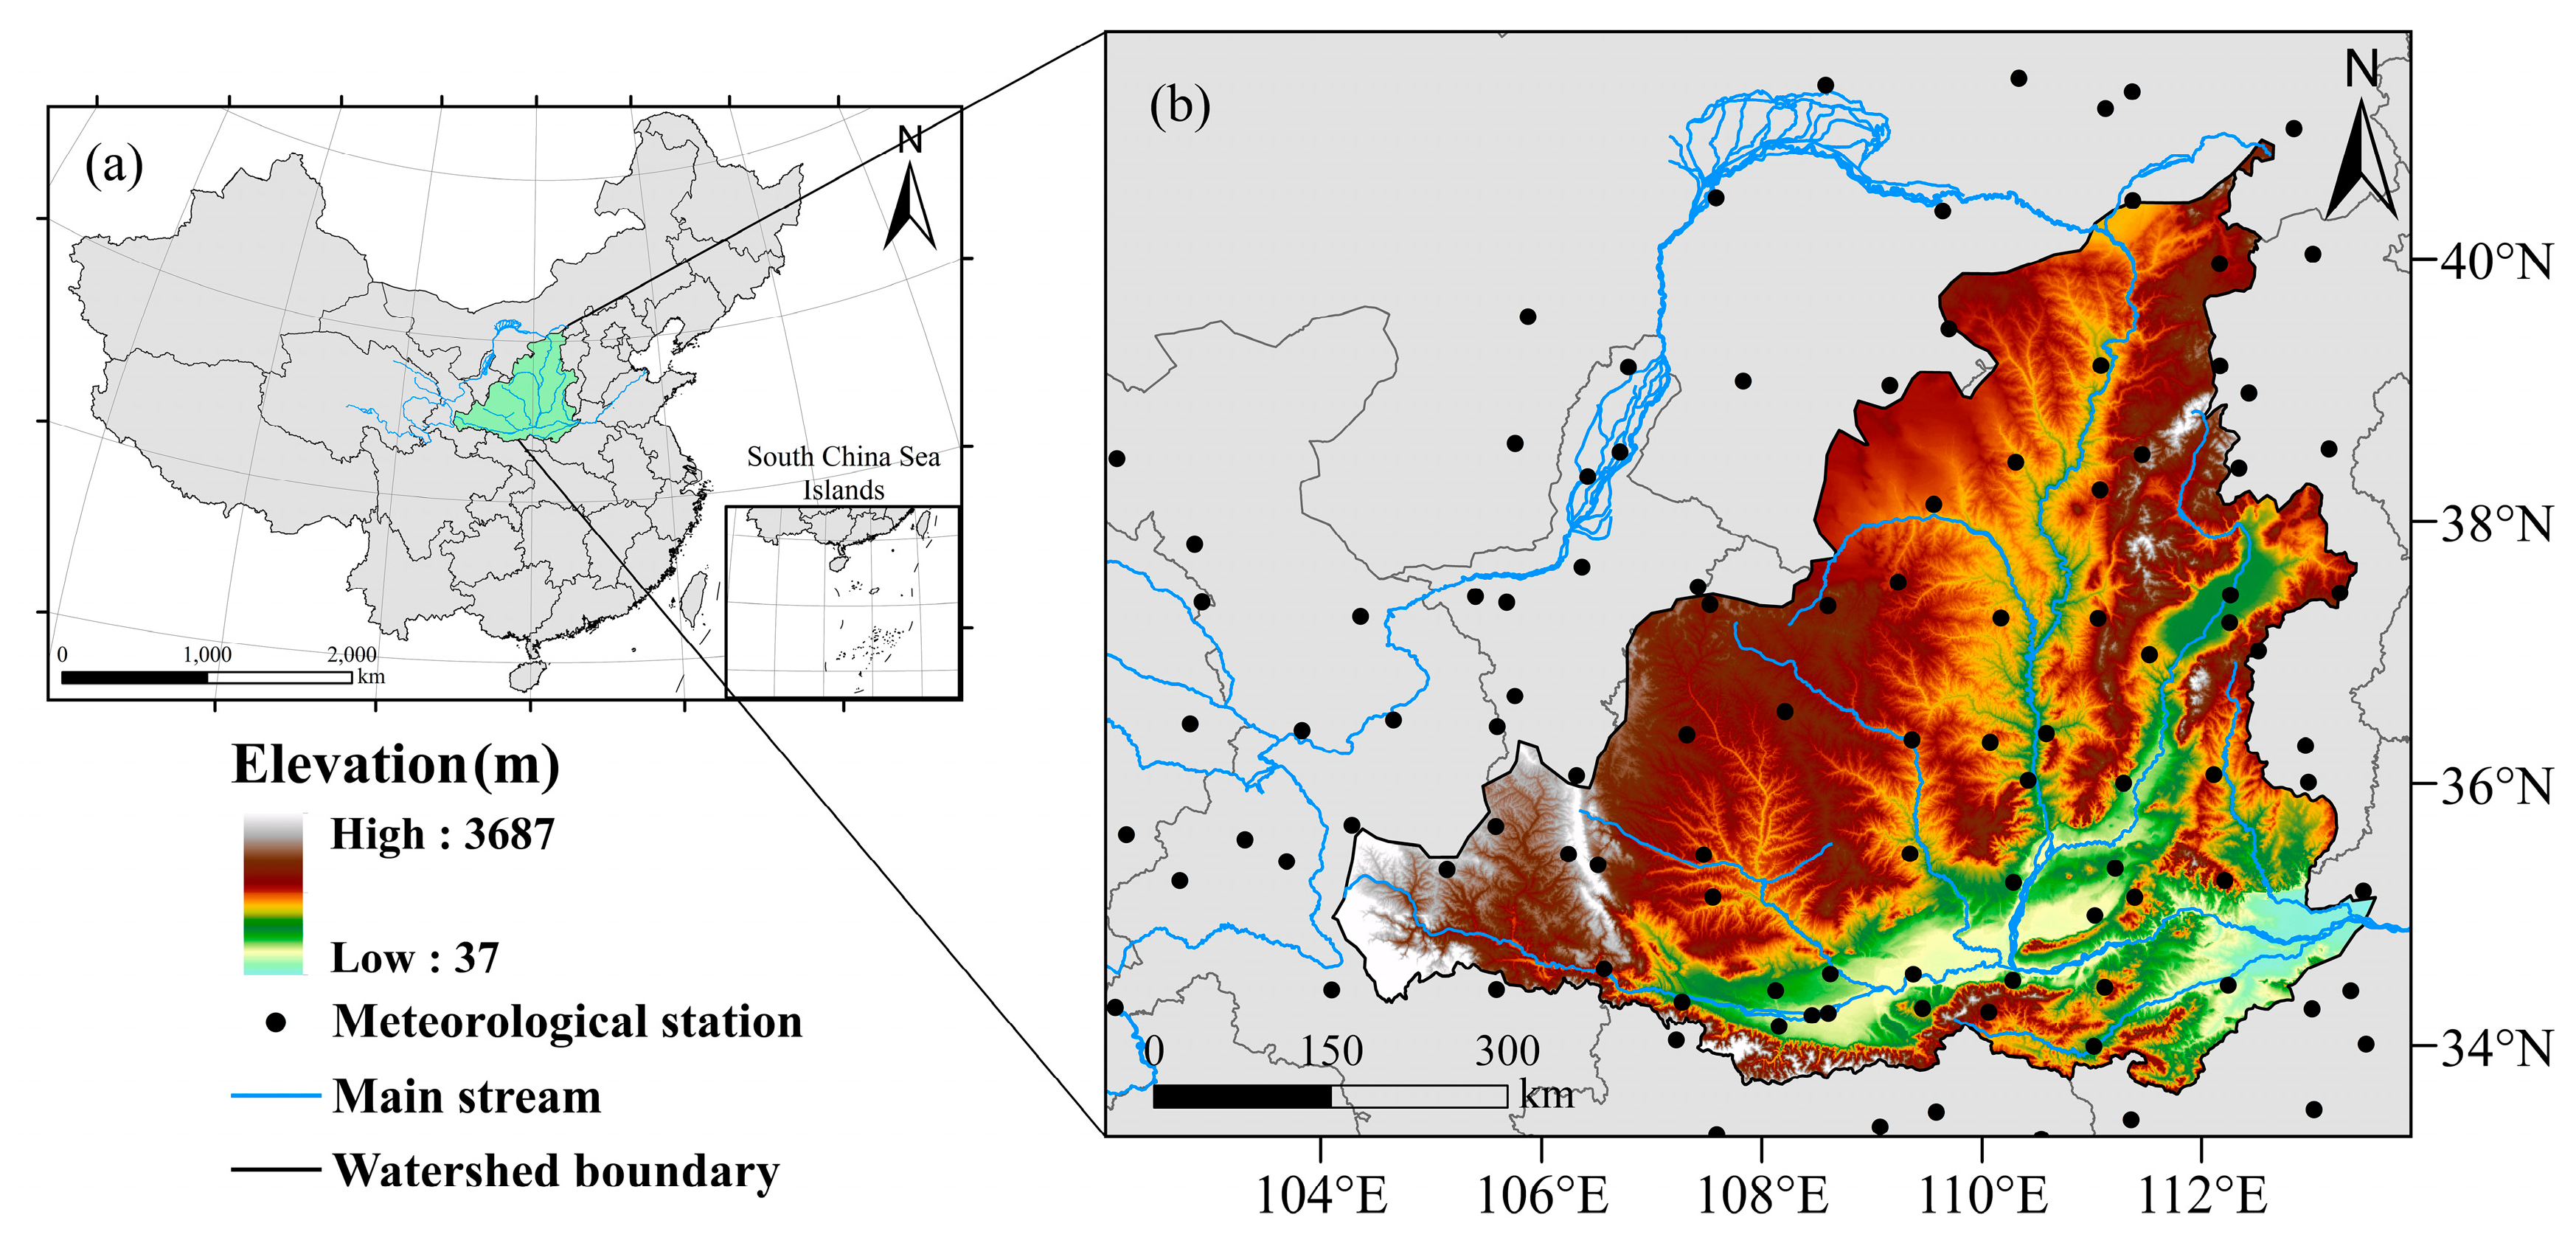
Figure 1. Study area. (a) China; (b) middle reaches of Yellow River Basin.
Water 15 02265 g001
Figure 2. SPEI changes at different timescales in the YRMB; (ae) represent SPEI sequences for 1-, 3-, 6-, 9-, and 12-month timescales, respectively.
Water 15 02265 g002
Figure 3. SPEI changes at the same timescale under the SSP126 scenario in the YRMB; (ae) represent SPEI sequences for 1-, 3-, 6-, 9-, and 12-month timescales, respectively.
Water 15 02265 g003
Figure 4. SPEI changes at the same timescale under the SSP245 scenario in the YRMB; (ae) represent SPEI sequences for 1-, 3-, 6-, 9-, and 12-month timescales, respectively.
Water 15 02265 g004
Figure 5. Spatial distribution of drought characteristic variables in the middle reaches of the Yellow River Basin. (a) Numbers of droughts; (b) drought duration; (c) drought severity; (d) drought intensity.
Water 15 02265 g005
Figure 6. Spatial distributions of drought characteristic variables under SSP126 (a,e,i,m), SSP245 (b,f,j,n), SSP370 (c,g,k,o), and SSP585 (d,h,l,p) discharge scenarios in the middle reaches of the Yellow River Basin ((ad): drought frequency; (eh): duration of drought; (il): drought severity; (mp): drought intensity).
Water 15 02265 g006
Figure 7. Optimal marginal distribution fitting diagram of the single variable in historical (ac), SSP245 (df), and SSP585 (gi) scenarios (where (a,d,g) represent drought duration; (b,e,h) represent drought intensity; and (c,f,i) represent drought intensity). Experience frequency refers to the frequency calculated using the experience frequency formula according to the measured sequence in order, from large to small. Theoretical frequency refers to the frequency calculated by the preferred edge distribution function or copula function.
Water 15 02265 g007
Figure 8. Experience frequency and theoretical frequency fitting of the optimal two-dimensional copula function in the middle reaches of the Yellow River Basin under historical, SSP245, and SSP585 scenarios (where (ac) is the historical period, (df) is the SSP245 scenario, and (gi) is the SSP585 scenario). The experience frequency value refers to the frequency calculated by the experience frequency formula according to the measured sequence in order from large to small. Theoretical frequency refers to the frequency calculated by the preferred edge distribution function or copula function.
Water 15 02265 g008
Figure 9. Joint probability values of meteorological drought variables ((a1,a2) D&S, (b1,b2) D&I, and (c1,c2) S&I) in the YRBM during the historical period.
Water 15 02265 g009
Figure 10. Joint exceedance probability values of meteorological drought variables ((a1,a2) D&S, (b1,b2) D&I, and (c1,c2) S&I) in the YRBM during the historical period.
Water 15 02265 g010
Figure 11. Meteorological drought variables ((a1,a2) D&S, (b1,b2) D&I, and (c1,c2) S&I) in the YRBM during the historical period.
Water 15 02265 g011
Figure 12. Co-occurrence return period of meteorological drought variables ((a1,a2) D&S, (b1,b2) D&I, and (c1,c2) S&I) in the YRBM.
Water 15 02265 g012
Table 1. SPEI drought classification criteria.
LevelsTypesSPEI
1Drought-free(−0.5, +∞)
2Mild drought(−1, −0.5]
3Moderate drought(−1.5, −1]
4Severe drought(−2, −1.5]
5Extreme drought(−∞, −2]
Table 2. Optimization of univariate distribution functions of meteorological drought conditions under different scenarios in the YRBM.
ScenarioDrought CharacteristicsPreferred FunctionParametersK-S Results
Statistical Magnitude Dip-ValuesDcritical value
(α = 0.05)
HistoricalDGenParetok = −0.3582, σ = 11.1480, μ = 0.97800.08900.85530.2028
SWeibullα = 1.1865, β = 8.96320.07600.9488
IWeibullα = 1.4445, β = 0.3823, γ = 0.51400.08030.9239
SSP245DWeibullα = 1.4701, β = 8.61610.11200.80620.2417
SGammaα = 0.7206, β = 9.5242, γ = 1.07980.08220.9773
IGenParetok = −0.2721, σ = 0.4548, μ = 0.51280.07870.9852
SSP585DGenParetok = −0.5130, σ = 10.8910, μ = 1.11180.14270.54880.2457
SGammaα = 0.8398, β = 8.2235, γ = 1.26770.08470.9740
IGammaα = 2.0096, β = 0.2074, γ = 0.51570.06110.9996
Table 3. Dependence of two variables of meteorological drought characteristic values under different scenarios in the YRBM.
ScenarioPearsonKendallSpearman
HistoricalD&S0.9570.9070.981
D&I0.7630.5680.737
S&I0.8750.6720.840
SSP245D&S0.9480.8970.976
D&I0.6840.5420.703
S&I0.8130.6600.812
SSP585D&S0.9380.9080.978
D&I0.5160.3490.515
S&I0.7570.4630.604
Table 4. Optimization of two-dimensional meteorological drought copula function under different scenarios in the YRBM.
ScenarioCopula FunctionD&SD&IS&I
AICBICAICBICAICBIC
HistoricalGaussian12.975314.736512.873614.634814.37516.1362
t15.001618.52415.08518.607416.513420.0358
Gumbel12.691614.452812.475514.236714.015915.7771
Clayton12.836214.597412.57914.340213.488515.2497
Frank13.212714.973913.245215.006414.573516.3347
SSP245Gaussian12.480413.881611.499412.900612.278513.6797
t14.488217.290613.622816.425214.226417.0288
Gumbel12.122813.52411.439312.840512.204913.6061
Clayton12.344913.746110.975412.376611.193512.5946
Frank12.485613.886811.597512.998712.186713.5879
SSP585Gaussian12.14113.508312.011713.37913.369214.7365
t14.020516.755114.159116.893715.374218.1087
Gumbel11.717513.084811.822913.190213.032414.3997
Clayton11.468812.836111.689913.057212.390813.7581
Frank12.054613.421912.231713.59913.483914.8512
Table 5. Drought characteristics’ univariate and joint distribution return periods.
ScenarioReturn PeriodDSID&SD&IS&I
ToTaToTaToTa
Historical1012.7611.380.988.9811.297.4115.387.1416.70
2017.0116.221.1417.7722.8914.3533.0612.3852.16
5021.2322.231.3244.1857.6535.2186.3327.56270.72
10023.6226.571.4588.20115.5770.00175.2352.631008.44
SSP2451010.4910.111.028.9211.376.4522.216.5321.35
2013.9415.861.2217.6523.0611.4877.6411.5773.65
5017.9623.751.4343.8758.1226.49443.1826.60416.06
10020.7429.861.5687.57116.5451.501716.4951.601605.04
SSP5851011.4610.191.057.4615.176.3323.756.5221.49
2014.7115.481.2412.8445.2711.3385.2611.5574.66
5017.5822.621.4828.13224.6826.33496.3426.57424.06
10019.0028.091.6553.25820.1451.331936.7051.571639.39
Note: To, co-recurrence period; Ta, co-occurrence recurrence period.
Disclaimer/Publisher’s Note: The statements, opinions and data contained in all publications are solely those of the individual author(s) and contributor(s) and not of MDPI and/or the editor(s). MDPI and/or the editor(s) disclaim responsibility for any injury to people or property resulting from any ideas, methods, instructions or products referred to in the content.