Article

Micro-Nano Bubbles Conditioning Treatment of Contaminated Sediment for Efficient Reduction: Dehydration Characteristic and Mechanism

1
Ocean College, Zhejiang University, Hangzhou 310058, China
2
National Engineering Research Center of Dredging Technology and Equipment, Shanghai 200120, China
*
Author to whom correspondence should be addressed.
Water 2023, 15(11), 1985; https://doi.org/10.3390/w15111985
Submission received: 25 April 2023 / Revised: 15 May 2023 / Accepted: 23 May 2023 / Published: 24 May 2023

Abstract

:
The reduction and dehydration treatment of contaminated sediment from rivers and lakes is a prerequisite for ensuring the subsequent safe disposal. In this study, micro-nano bubbles (MBs) technology was creatively proposed for the conditioning treatment of contaminated sediment to improve its sedimentation and dehydration performance. Orthogonal experiment and single factor experiment were conducted to optimize factors such as bubble size, intake air volume and treatment time. The conditioning effect was analyzed through direct and indirect characterization parameters. The results showed that the range (R) values for bubble size, intake air volume and treatment time were 101.8, 94.5 and 51.6 respectively in the orthogonal analysis. The optimum bubble size, intake air volume and treatment time were 1 μm, 30 L/min and 90 s. At this time, the CST of conditioned sediment decreased to 160.6 s (the reduction rate of 89.29%) and the moisture content of the filter cake decreased to 65.2%. Through the analysis of polysaccharide and MLSS, it was found that the MBs effectively exerted the oxidation and extracellular polymer cracking properties, which released polysaccharides that easily bind to water. The SEM analysis of the filter cake showed a loose structure and rich porosity compared to the undisturbed sediment. Meanwhile, the MBs promoted the homogenization degree of conditioners to achieve efficient dehydration. Therefore, MBs conditioning was verified as a novel and promising technique for improving the dehydration performance of river and lake contaminated sediment.

1. Introduction

With the rapid economic development of cities along the river basin, a large amount of industrial wastewater, domestic wastewater, and agricultural wastewater containing nutrient salts, heavy metals, and other pollution factors enter estuaries and lakes [1,2,3]. Therefore, sediment has become the fate and accumulation reservoir of nitrogen, phosphorus, nutrients, and heavy metal pollutants [4,5,6,7]. Environmental dredging aims to reduce the risk of endogenous pollution in the river or lake by accurately removing the upper sediments which are rich in N, P nutrients, heavy metal pollutants and organic pollutants [8,9]. Therefore, environmental dredging is recognized as one of the top strategies for removing severely polluted sediments [10]. Meanwhile, environmental dredging also result in the production of large amounts of sediment with environmental risks [11]. The dredged sediment is characterized by huge volume, high moisture content and serious pollution [12,13,14]. Improper disposal such as landfill, marine dumping and yard drainage may cause the risk of secondary pollution [15]. Efficient dehydration treatment of the sediment is a necessary prerequisite for ensuring subsequent safe disposal [11,16]. Currently, how to further improve the degree of dehydration of contaminated sediment has become one of the key and difficult issues in the research of river and lake environmental protection.
To date, several technologies for conditioning and dehydration of contaminated sediment mainly include physical, chemical, biological, physical-chemical conditioning, and joint treatment methods [17,18,19]. Chemical conditioning is commonly used in engineering, what enables rapid sedimentation of contaminated sediment and promotes the transition from bound water to free water through the compression of double electric layers, electrical neutralization and bridging action [20,21,22,23]. However, the overuse of chemical agents has the defect of high treatment costs and secondary pollution to the environment. Additionally, In large conditioning tanks, the mechanical method of homogenization is often prone to the drawbacks of crushing the flocs and uneven distribution of conditioners, resulting in poor dehydration efficiency and further increase in the demand for conditioners [11,20]. Therefore, an environmentally conditioning technology while combining chemical conditioning to achieve deep dehydration and homogenization of conditioners has received more attention.
Micro-nano bubbles (MBs) refer to tiny bubbles with diameters between the micron and nanometre levels, which have the characteristics of large specific surface area, high mass transfer efficiency, high interface potential and free radical generation [24,25,26,27]. Based on these characteristics, researchers have applied this technology to research on water treatment and sludge treatment. Pan’s study on the free radical characteristics of microbubbles for phenol degradation showed that the free radicals produced by microbubbles played a decisive role in the degradation of phenol [28]. Similarly, Tsutomn et al. treated methyl orange using oxygen microbubbles, and found that oxygen microbubbles could significantly improve the total organic carbon (TOC) reduction rate of methyl orange [29]. Wang also found that when using hydraulic cavitation to generate micro-nano bubbles, the degradation rate of alachlor increased by about 30% as the pH value increased from 2 to 12 [30]. MBs could overcome the differences in the permeability of dissimilar media and exhibit better fluidity and material delivery capability. Therefore, MBs were also used in groundwater pollution control, which was also the reason why they were applied to eutrophic water pollution control [31].
MBs were also widely used in sludge treatment, mainly because they could effectively promote the dissolution of sludge cells and degradation of pollutants. The characteristics of sludge treated with MBs were compared with traditional bubbles, and it was found that the concentration of TSS in the supernatant of sludge treated with MBs was significantly higher than that treated with traditional bubbles [32]. MBs could effectively dissolve sludge, and promote the release of dissolved organic matter (DOM) and the growth of microorganisms, thereby improving the dewatering capacity of sludge. Wang et al. explored the impact of MBs on the methane production ability of sludge and found that MBs accelerated the mobility of water molecules in the liquid phase, which increased methane production by 14% [33]. Yang et al. increased the economic feasibility of activated sludge disposal by applying of nitrogen nanobubbles to improve the anaerobic digestion efficiency of activated sludge [34]. Moreover, many previous studies showed that MBs conditioning was a promising strategy for sludge treatment or other pollutants treatment [35,36,37].
Although the researches on MBs had received much attention, rarely little attention caught the eyes of scholars about the MBs conditioning treatment of contaminated sediment, let alone the exploration of dehydration characteristic and mechanism. In this backdrop, we conducted a novel study to investigate the feasibility of MBs conditioning for contaminated sediment to improve dehydration performance. We evaluated and optimized the impact of various factors of MBs on the degree of dehydration. In addition, this study emphatically focused on the properties of conditioned sediment and filter cake to reveal the inherent mechanism of enhanced dehydration by MBs.

2. Materials and Methods

2.1. Materials and Device

In this study, the sediment was taken from the internally contaminated sediment from a shallow lake in a certain area, with a sampling depth of 5 cm. In order to simulate the dredging process and consider the pumping concentration after conditioning, the sampled sediment was diluted to a moisture content of 90%, at which time the CST was 1500s. When 1% PAM was added separately, the CST of conditioned sediment and the moisture of the filtered cake were 652.6 s and 78.2%.
The MBs conditioning device for contaminated sediment was a non-standard customized device, as shown in Figure 1. The device mainly consisted of air pump, check valve, flow regulator, homogenization conditioning tank, and microbubble generator. The particle size of MBs could be adjusted by replacing the microbubble generator, which had three specifications: T001, T100, and T500. They could generate bubbles with an average particle size of 1 μm, 100 μm, 500 μm. The intake air volume regulation was regulated by the flow regulator. The homogenization conditioning tank was a cylinder with a diameter of 12 cm.

2.2. Experimental Procedures

Orthogonal experiment: The L9 (34) orthogonal experiment table was selected to carry out the MBs conditioning experiment, as shown in Table 1. In each experiment, 2000 mL of contaminated sediment and 1% PAM (the dosage is based on the dry basis ratio, the same below) were added. The experiments were conducted according to present conditions. After standing for 5 min, an appropriate amount of conditioned sediment was took to measure the CST value.
Single factor optimization experiment: In a typical run, 2000 mL of sediment was selected and added to the conditioning tank with 1% PAM. MBs were introduced to conduct conditioning treatment according to different preset experimental conditions. The conditioned sediment was tested for CST, while performing EPS extraction and polysaccharide determination. At the same time, the conditioned sediment of equal quality each time was took for vacuum filtration, with vacuum degree of −0.1MPa. The filtered cake and filtrate were collected to detect the moisture content and the suspended solids concentration (MLSS) content.

2.3. Analysis Procedure

CST: The conditioned sediment was measured by a capillary water absorption time meter (DFC-10A, Beijing, China) to obtain CST value and determine its dehydration performance.
Moisture content: The filtered cake was place in a moisture content detector (JT-K8, Taizhou, China) to measure the moisture content at 105 °C [38].
Extraction of EPS: EPS was divided into soluble EPS (SEPS) and adhesive EPS (Bound EPS, BEPS) [39]. 50 mL of the conditioned sediment was centrifuged for 10 min at a rotational speed of 5000 r/min. The supernatant obtained under this condition was SEPS. Subsequently, 10 mL of 0.05% NaCl solution was added in and then subjected to water bath at 60 °C for 30 min. Centrifuged it with a rotational speed of 5000 r/min for 15 min. The supernatant was formed BEPS [40].
Polysaccharide content in EPS: Polysaccharides were determined by anthrone-sulfuric acid colorimetry. 2 mL of SEPS and BEPS solution were aspirated and immediately mixed with 6 mL of anthrone reagent, and then placed it in a boiling water bath for for 15 min. Then the mixture was immersed in an ice water bath for cooling for 15 min. the mixture was measured the absorbance value at a wavelength of 625 nm, and calculated the polysaccharide content of the sample solution based on the standard curve of glucose content [41,42].
MLSS: 50 mL of filtrate was filtered and the membrane was dried in an oven at 105 °C for 2 h. After cooling the filter membrane to indoor temperature, the MLSS was obtained through calculation.
Among the above analysis indexes, CST and moisture content were direct characterization methods, while EPS, polysaccharide content and MLSS were indirect characterization methods. The above indexes were used to jointly optimize the impact of various factors of MBs on sediment conditioning.

3. Results and Discussion

3.1. Orthogonal Experimental Analysis

Taking CST as the experimental target, the R values of bubble size, intake air volume, and time under three horizontal conditions were analyzed. The R analysis could determine the primary and secondary order of importance of factors. The larger the R value, the more significant the impact of this factor on experimental objectives. Therefore, it was possible to determine the order of influence of bubble size, intake air volume, and treatment time on CST reduction. The results of R values were shown in Table 2.
From Table 2, it could be seen that the conditioning of MBs could effectively reduce the CST value of contaminated sediment. Under nine reaction conditions, the CST reduction rate fluctuated between 74.51% and 90.87%. Under the two conditions of number 3 and 9, the original sediment was reduced from 1500 s to 136.9 s and 163.8 s, with a reduction rate of 90.87% and 89.08%, respectively. Under the action of MBs, the conditioners could well homogenize and react with the sediment to improve the sedimentation. This is because the sufficient reaction between sediment particles and conditioners achieved the effects of compressing the double electron layer and destabilizing [43,44]. At the same time, the microbubble’s high efficiency mass transfer ability, oxidation ability, and damage to extracellular polymers all contribute to reducing the difficulty of contaminated sediment dehydration.
The R values of bubbles size, intake air volume and treatment time were 101.8, 94.5, and 51.6, respectively. Therefore, the order of influence of three factors on the CST reduction of contaminated sediment was bubbles size, intake air volume and treatment time, respectively. The bubble size was the most important factor determining the dehydration. Mass transfer existed between two phases, and the efficiency of gas-liquid mass transfer was often inversely proportional to the diameter of bubbles [45]. This was because the smaller the bubbles size, the larger their specific surface area and the higher their mass transfer efficiency, which could better carry conditioners for homogenization and mixing. Moreover, the high zeta potential of MBs enhanced the adsorption of microbial cells in sediment. During the rising and breaking process of small bubbles, accompanied by the phenomenon of increased self pressurization and solubility, which promoted the dissolution of extracellular polymers of microbial cells.
In order to further achieve the optimal dehydration effect, it was necessary to conduct a series of single factor experiments according to the sequence of bubble sizes, intake air volume and time.

3.2. Effect of Bubble Size on Contaminated Sediment Conditioning

Effect of bubble size on direct characterization parameters: The CST of conditioned sediment and the moisture content of the filtered cake were the two most direct characterizations of the dewatering effect. The CST was shown a good and direct index for sediment and sludge filterability and dewaterability [46]. When intake air volume was 20 L/min and treatment time is 60 s, the impact of different bubble size on the CST and the moisture content of the filtered cake was shown in Figure 2.
With the increase of bubble size, the CST value of conditioned sediment increased rapidly, and the moisture content of conditioned sediment also showed an increasing trend. When the bubble size of MBs was 1 μm, the CST value and the moisture content of conditioned sediment reached the minimum values of 281.6 s and 71.2%, respectively. The reduction rate of CST relative to the original sediment reached 81.22%. As the bubble size increased to 500 μm, the CST value and the moisture content of conditioned sediment reached the maximum values of 397.6 s and 78.6%, respectively, with CST only achieving a reduction rate of 73.49%. The homogenization and conditioning effect decreased with the increase of bubble size. When the bubble size was between a few micrometers to a few hundred nanometers, the mass transfer ability, oxidation ability, and self pressurization ability of microbubbles were greatly enhanced, which was beneficial for the mass transfer of conditioners, the destruction of sludge cell structure and the degradation of macromolecular organic matter.
Effect of bubble size on indirect characterization parameters: There was a considerable amount of anaerobic microorganisms present in the internally contaminated sediment, and the EPS carried by anaerobic microorganisms was an important factor affecting the dewatering performance of the sediment. Polysaccharides in EPS were the main degradable components of extracellular polymers in microbial cells, and their polarity was significant. This lead to a tight binding between polysaccharides and water in sediment or sludge. Therefore, polysaccharides content as indirect index could well characterize the destruction effect of microbubbles on extracellular polymers in contaminated sediment.
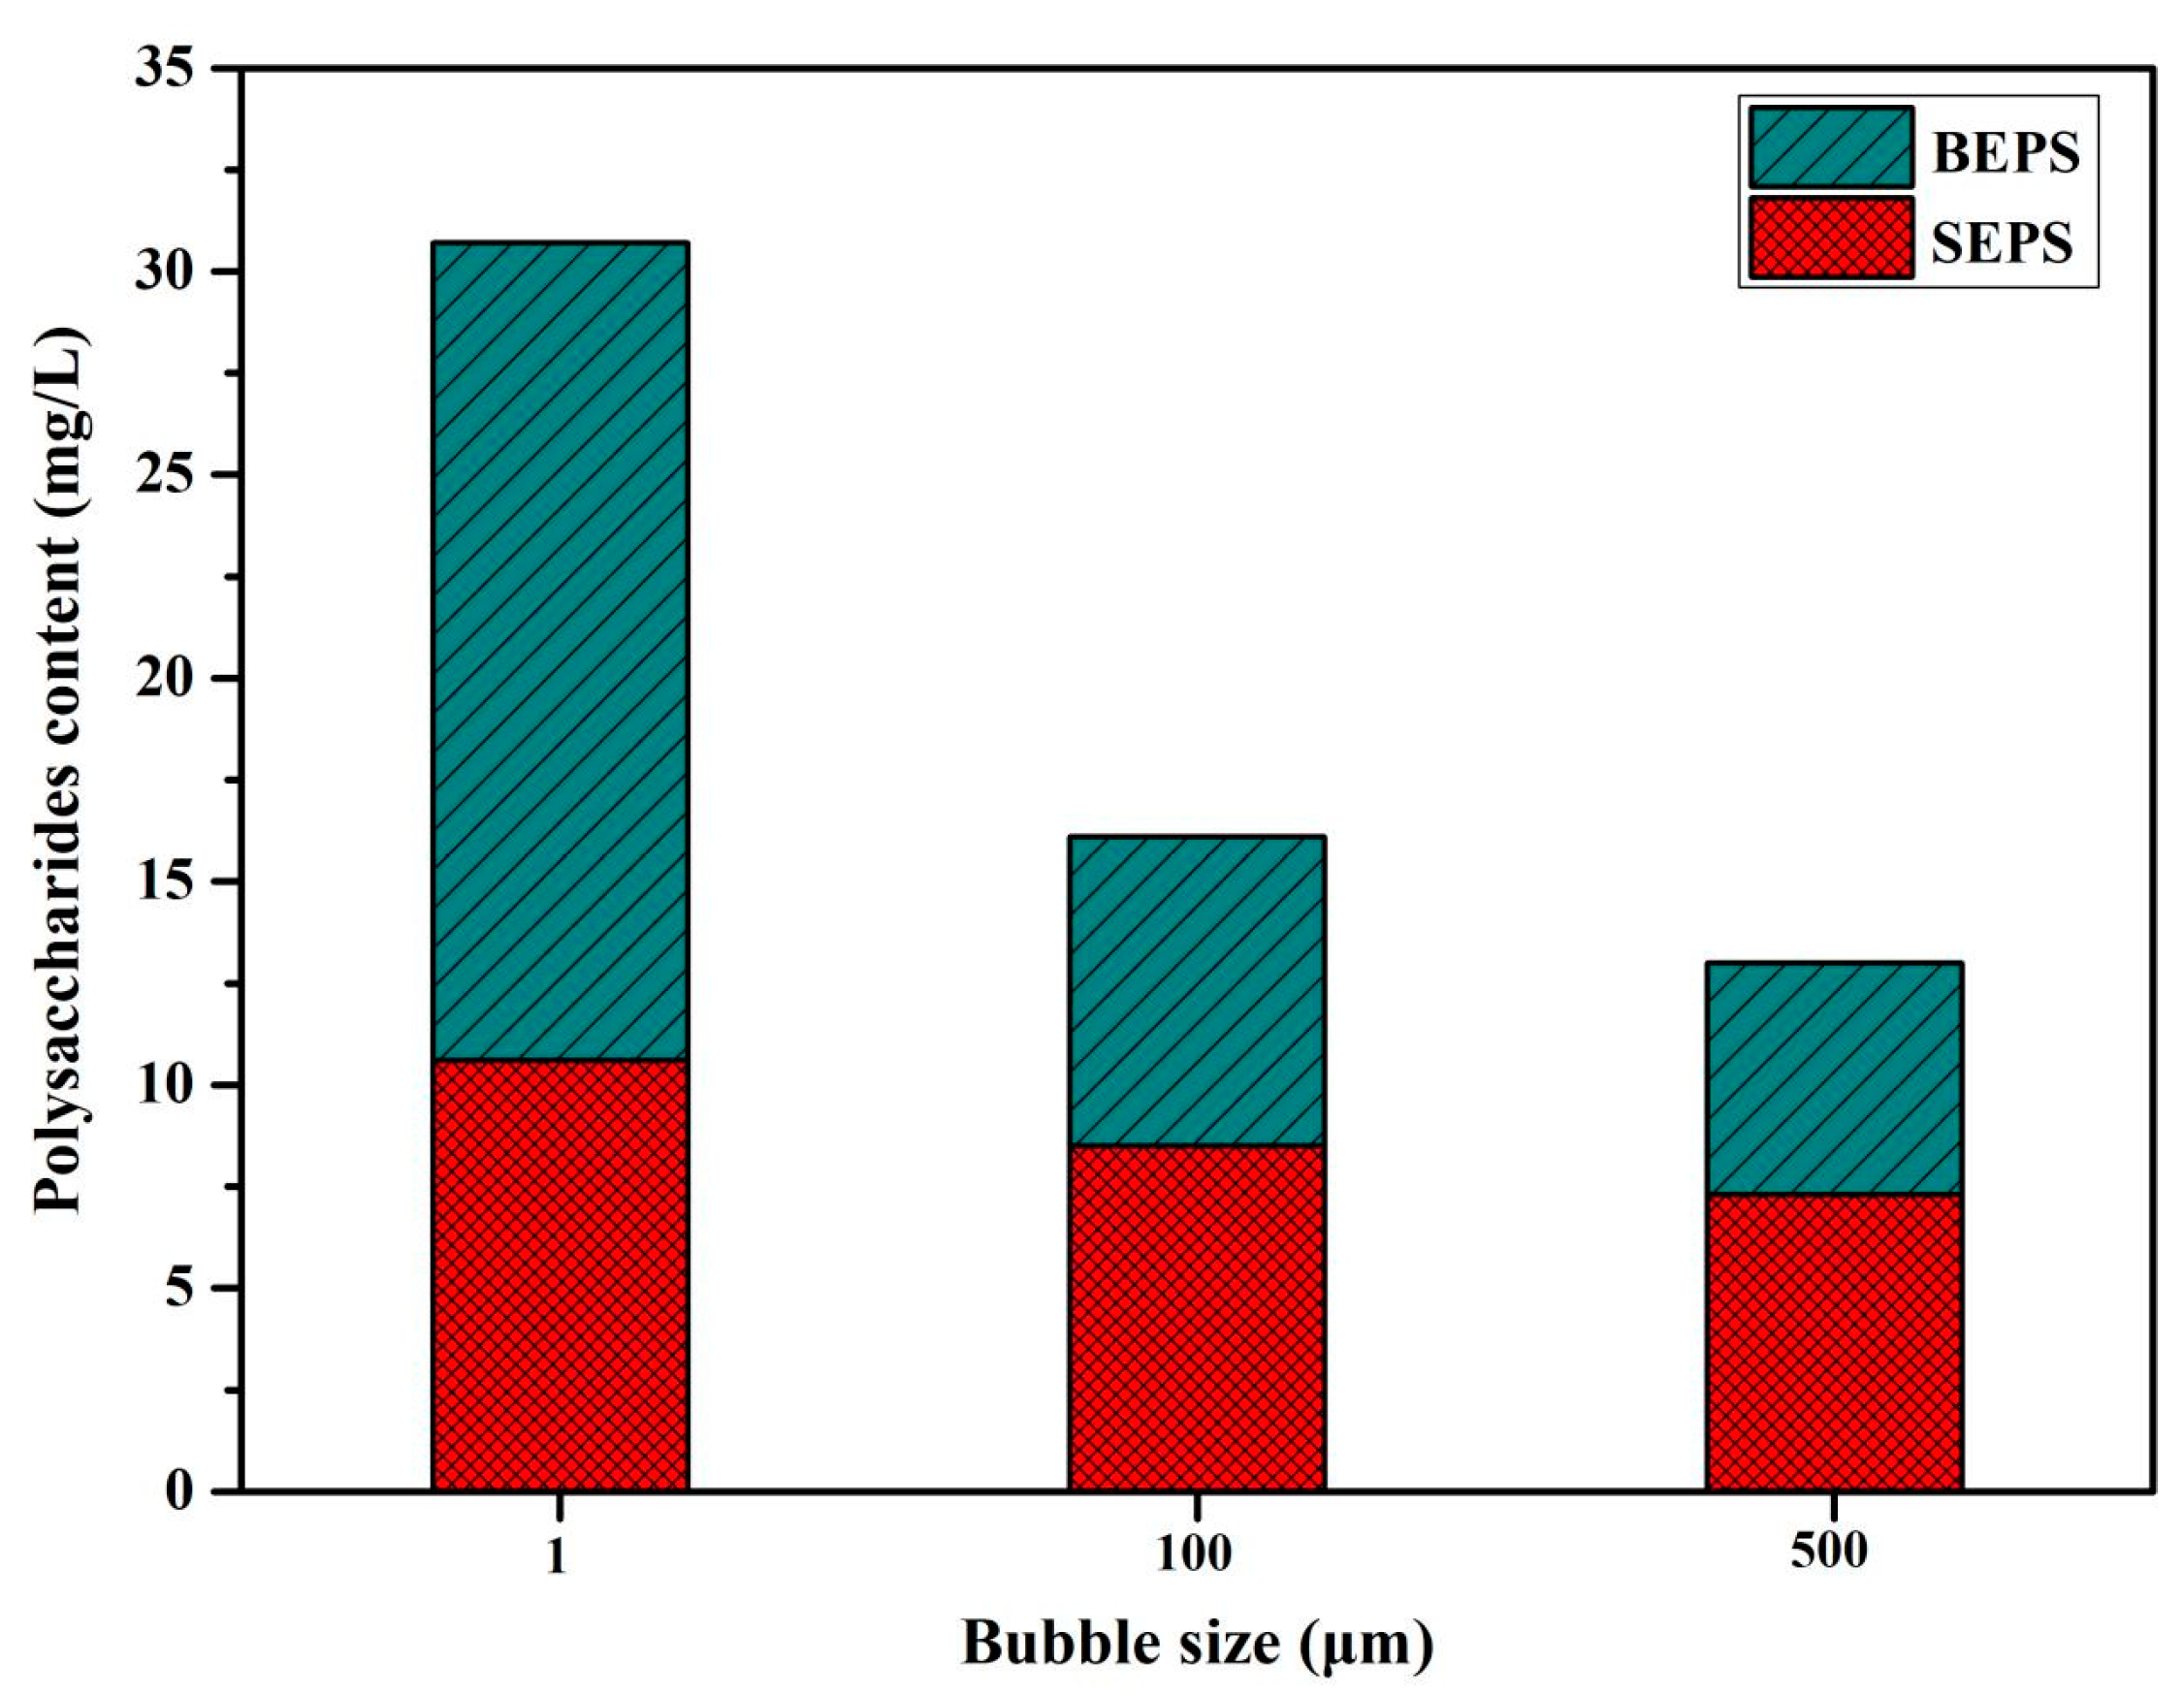
When intake air volume of microbubbles was 20 L/min and time was 60 s, Figure 3 reflected the effect of different bubble size on the polysaccharides content in SEPS and BEPS. When the bubble size of microbubbles decreased from 500 μm to 1 μm, the polysaccharides content in SEPS slightly increased, but the polysaccharides content in BEPS significantly increased. When MBs broke, the drastic change of the disappearance of the gas-liquid interface would stimulate the generation of a large number of hydroxyl radical. Hydroxyl radical was a kind of active molecule second only to fluoride ion, which had strong oxidizing ability. The hydroxyl radical generated by the MBs could oxidize and destroy the extracellular polymer, which can separate the polysaccharide from the bound water and improve the dehydration capacity [47]. These results also indicated that the smaller the bubble size, the better the degradation effect of contaminated sediment.
Figure 4 showed the influence of different bubble size on the MLSS content in the filtrate. When the bubble size decreased, the MLSS in the filtrate showed a significant decrease trend, which was consistent with the conclusions obtained in Figure 2 and Figure 3. The low concentration of MLSS in the filtrate could indirectly indicate that the sediment particles were fully reacted with the flocculant to achieve effective settlement.

3.3. Effect of Intake Air Volume on Contaminated Sediment Conditioning

Effect of intake air volume on direct characterization parameters: When bubble size was 1 μm and treatment time was 60 s, the effect of different intake air volume on the CST of conditioned sediment and the moisture content of the filtered cake was shown in Figure 5. Under the intake air volume of 20–40 L/min for MBs, it could be seen that the CST value of sediment showed a trend of first decreasing and then increasing. When the intake air volume was 30 L/min, the minimum CST value of sediment was 176.5 s, and the reduction rate relative to the original sediment reached 88.23%. Meanwhile, the excessive density of bubbles caused collisions, which also disrupted the adsorption balance between microbubbles and conditioners, leading to a decrease in sediment settling performance.
From Figure 5, it could be seen that the trend of the influence of different intake air volume on the mositure content of the filter cake was consistent with that of CST under the action of microbubbles carrying flocculants. The low intake air volume lead to the inability of microbubbles to carry enough conditioners to homogenize between the sediment particles, and also failed to fully damage the structure of the sludge particles. Excessive intake air volume disrupted the adsorption balance between microbubbles and the flocculent agents. When the intake air volume of MBs was 30 L/min, the mositure content of the filter cake reached the lowest value, which was 67.3%.
Effect of intake air volume on indirect characterization parameters: The effect of different intake air volume on polysaccharides content in SEPS and BEPS was shown in Figure 6. As the intake air volume increased, the polysaccharides content in SEPS showed a slow increasing trend. When the intake air volume continued to increase to 30 L/min, the polysaccharides content showed a fluctuating equilibrium state. The polysaccharides content in BEPS showed a significant increasing trend. When the intake air volume was 30 L/min, the maximum value of polysaccharides in BEPS was 40.5 mg/L, and the total polysaccharides content in EPS was 61.6 mg/L. Therefore, the results indicated a large amount of microbubble content significantly destroyed the cellular structure of microorganisms in the sediment and released extracellular polymers. According to relevant researches, released organic matters (protein or polysaccharides) were transformed into lower-binding matters, which suggested that the associations between extracellular polysaccharides molecules had become slightly apart and the binding ability with water also had become weak [11,48].
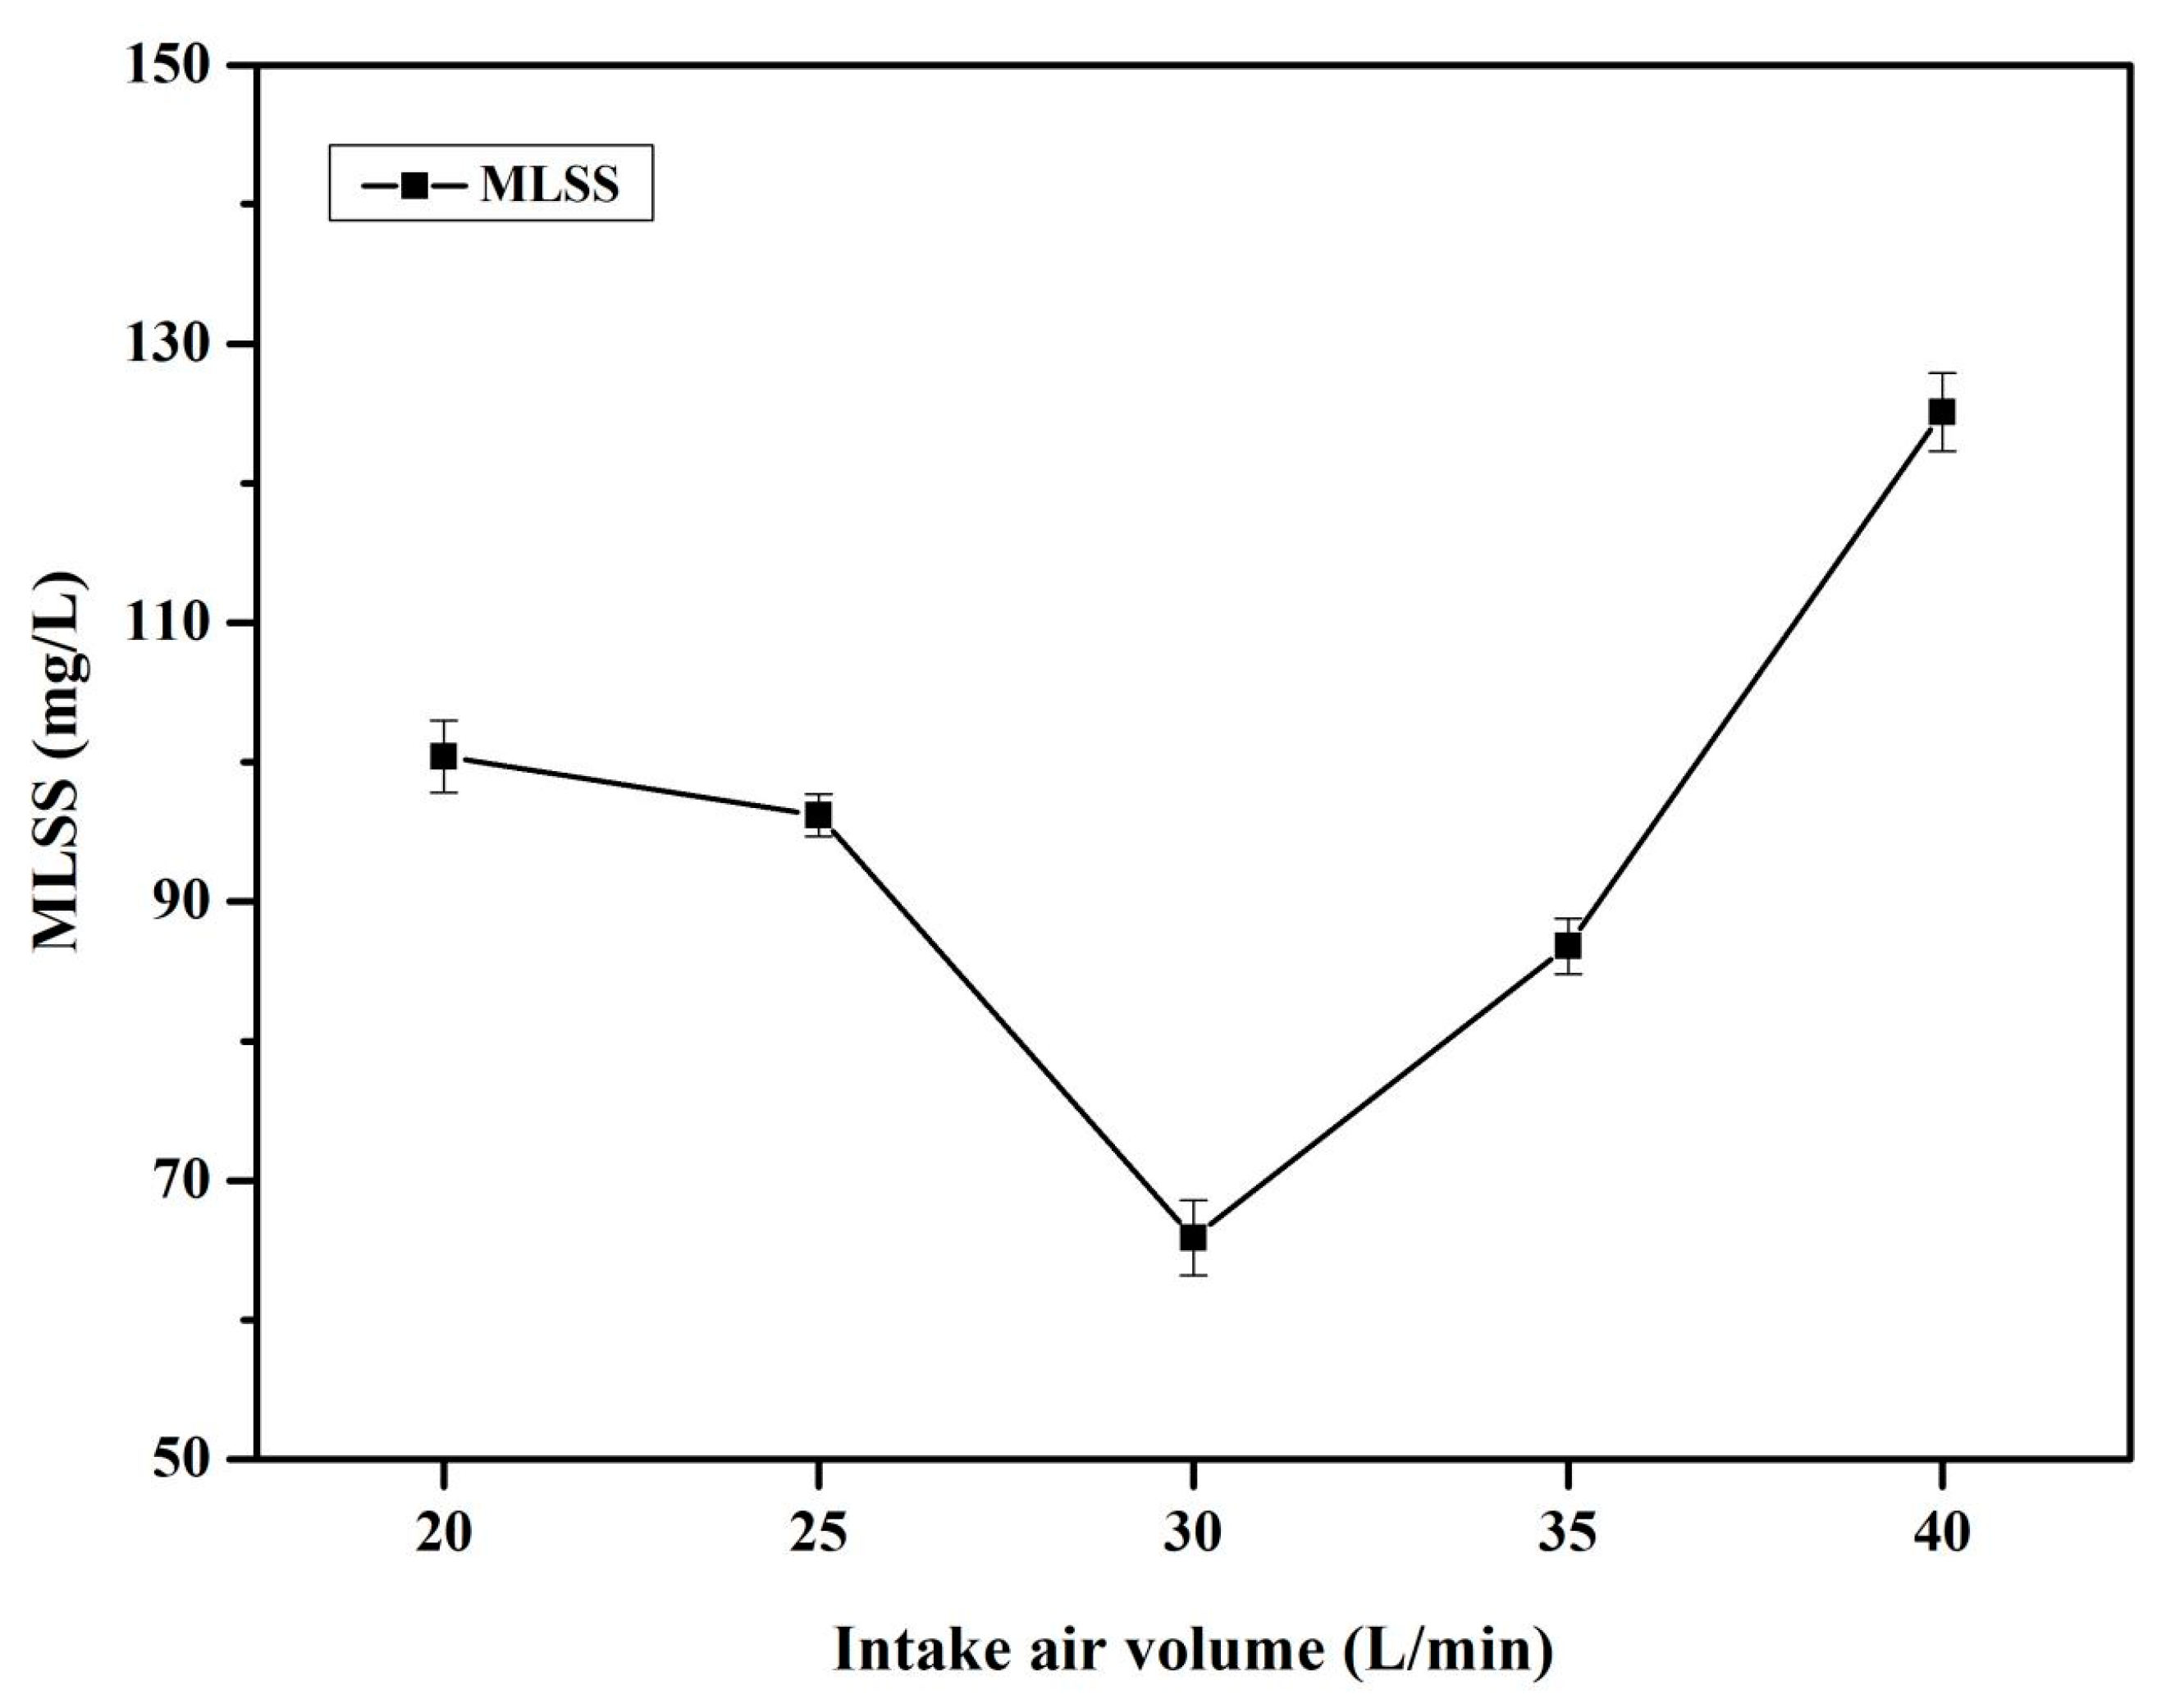
The effect of different intake air volume on on the MLSS content in the filtrate was shown in Figure 7. The influence of different intake air volume on the MLSS content and polysaccharide content in the filtrate were significantly different, but similar to the influence of CST. As the intake air volume increased, the MLSS content showed a sharp decrease and increase trend. When intake air volume was 30 L/min, the minimum value taken for MLSS was 65.9 mg/L. At this point, the amount of microbubbles and the adsorption of flocculants reached saturation point. In summary, the optimal intake air volume condition in this experimental study should be chosen as 30 L/min.

3.4. Effect of Intake Air Volume on Contaminated Sediment Conditioning

Effect of treatment time on direct characterization parameters: When the bubble size and intake air volume were 1 μm and 30 L/min, the effect of different time on the CST of conditioned sediment and the moisture content of the filtered cake was shown in Figure 8. Comparing the CST values of conditioned sediment with microbubbles under 60–180 s, it could be seen that the CST values of the sediment showed a trend of first decreasing, then steadily fluctuating, and then increasing, as the action time increases. When the time was 90 s, the minimum CST value of sediment was 160.6 s, and the reduction rate relative to the original sediment reached 89.29%. When the treatment time continued to increase to 120 s, the change of CST was not significant, which was 162.4 s with a reduction rate of 89.17%. As treatment time increased to over 120 s, the CST value significantly increased. The settling sediment particles exhibited the phenomenon of settling flocs being damaged and floating upwards when the treatment time of microbubbles was too long. The water in the sediment was filled between the floating particles in the form of interstitial water, which reduced filtration performance and caused a rapid increase in CST value. From Figure 8, it could be seen that when the treatment time was 90 s, the moisture content of the filter cake reached the optimal value, with a moisture content of 65.2%. Increasing the treatment time of MBs lead to the phenomenon of flocculation settlement being destroyed, which could lead to poor conditioning effect, as well as the result of too fast stirring rate in mechanical stirring that damaged settlement.
Effect of treatment time on indirect characterization parameters: The effect of different treatment time on the polysaccharides content in SEPS and BEPS was shown in Figure 9. When the treatment time was greater than 60 s, the total polysaccharides content of EPS in Figure 9 was significantly higher than that in Figure 3 and Figure 6. Adequate microbubble content and suitable treatment time effectively exerted the oxidizing and extracellular polymer breaking properties of MBs, which could release microbial extracellular organic polymers such as polysaccharides. In Figure 9, the polysaccharides content in SEPS and BEPS did not change significantly as the action time increased, both at high levels, because most of the polysaccharides were released through the action of MBs. From the perspective of organic groups in polysaccharides, the hydroxyl and aldehyde groups contained in polysaccharides had good hydrophilicity, which lead to polysaccharides binding more free water to form bound water. Through the conditioning process of microbubbles, the structure of polysaccharides was destroyed, and bound water was transformed into free water to improve dehydration performance.
The effect of different treatment time on the MLSS content in the filtrate was shown in Figure 10. When the treatment time was 90 s, the MLSS in the filtrate was the lowest at 43.2 mg/L. At this time, the particles in the conditioned sediment were effectively settled. Continuing to increase the treatment time, the settled flocs could float upwards, resulting in a relative increase in the concentration of suspended solids.
In summary, the optimal conditions for MBs conditioning could be selected as bubble size 1 μm, intake air volume 30 L/min and treatment time 90 s.

3.5. SEM Analysis

The SEM of the sediment and filter cake before and after the treatment of MBs were shown in Figure 11. SEM were the image magnified at 10 K magnification. The SEM analysis showed the structural changes of sediment after conditioning and dehydration through MBs treatment from a microscopic perspective.
The original dredged sediment image (Figure 11a) showed a complete structure, dense arrangement, almost no obvious cracks, and low porosity, which seriously hindered the filtration and transmission of water and affected the dewatering performance of the sediment. After conditioning with MBs, the microbial floc structure in the sediment was destroyed. The conditioners were evenly distributed among the sediment particles to undergo flocculation reaction. The porosity between the sediment particles increased, making it easier for water to be discharged during the filtration process. From Figure 11b, it could be seen that the SEM of the filter cake exhibited characteristics of loose structure and abundant pores, which were beneficial for improving the dewatering performance.

4. Conclusions

In this study, orthogonal experiments were designed to analyze the primary and secondary order of determining the importance of bubble size, intake air volume, and treatment time as three reference factors. Through single factor experiments, the effects of bubble size, intake air volume, and treatment time on the direct characterization parameters of CST and filter cake moisture content, as well as the indirect characterization parameters of polysaccharide content in EPS and MLSS concentration in filtrate, were analyzed to optimize the optimal experimental parameters. The SEM of the original sediment and filter cake before and after the MBs conditioning were analyzed. The conclusions were as follows.
(1) The R values of bubble size, intake air volume, and treatment time were 101.8, 94.5, and 51.6, respectively. Microbubbles close to the nanoscale had a large specific surface area and high mass transfer efficiency, which could better carry conditioning agents for homogenization and mixing. At the same time, the MBs of small bubble size were easy to promote the sedimentation of sediment and the dissolution of extracellular polymers.
(2) The optimal conditions for MBs conditioning in this experimental study could be selected as bubble size 1 μm, intake air volume 30 L/min, and treatment time 90s. Under these conditions, the CST of conditioned decreased to 160.6 s, with a relative reduction of 89.29%, and the moisture content of the filter cake decreased to 65.2%.
(3) The SEM of the filter cake showed a loose structure and rich porosity. Microscopic analysis revealed that the microbial floc structure in the sediment was destroyed, and the conditioning agents were evenly distributed between the sediment particles and achieved sufficient flocculation reaction through MBs conditioning.
In summary, The dehydration mechanism of MBs conditioning lay in the efficient homogenization of the conditioning agent, which promoted the flocculation reaction between the conditioning agent and the sediment particles. Meanwhile, the inherent characteristics of MBs promoted the release of extracellular polymers and hydrophilic organic compounds such as polysaccharides, effectively promoting the transition from bound water to free water and reducing the difficulty of dehydration. This study provided a promising technique and theoretical basis for the dehydration of river and lake contaminated sediment.

Author Contributions

Investigation, Q.Z. and X.Z.; experiment, Q.Z. and X.Z.; data analysis, X.Z.; writing—original draft preparation, Q.Z.; writing—review and editing, J.Y. and Z.S.; visualization, X.Z.; supervision, J.Y. and Z.S.; project administration, J.Y. and Z.S. All authors have read and agreed to the published version of the manuscript.

Funding

This research was funded by the National Key Research and Development Program of China. (No. 2021YFB2601100) and National Natural Science Foundation of China (Grant no. 52171280).

Data Availability Statement

The data presented in this study are available on request from the corresponding author.

Acknowledgments

We thank the National Engineering Research Center of Dredging Technology and Equipment for their help and support in indoor experimental platform.

Conflicts of Interest

The authors declare no conflict of interest.

References

  1. Wu, G.; Cao, W.; Wang, F.; Su, X.; Yan, Y.; Guan, Q. Riverine nutrient fluxes and environmental effects on China’s estuaries. Sci. Total Environ. 2019, 661, 130–137. [Google Scholar] [CrossRef] [PubMed]
  2. Wu, S.; Wu, Z.; Liang, Z.; Liu, Y.; Wang, Y. Denitrification and the controlling factors in Yunnan Plateau Lakes (China): Exploring the role of enhanced internal nitrogen cycling by algal blooms. J. Environ. Sci. 2019, 76, 349–358. [Google Scholar] [CrossRef]
  3. Meena, R.; Sathishkumar, P.; Ameen, F.; Yusoff, A.; Gu, F. Heavy metal pollution in immobile and mobile components of lentic ecosystems—A review. Environ. Sci. Pollut. Res. 2018, 25, 4134–4148. [Google Scholar] [CrossRef] [PubMed]
  4. Wu, Z.; Wang, C.; Jiang, H.; Li, K.; Yang, X.; Huang, W. Sediment pH structures the potential of the lake’s internal P pollution involved in different types of P reactivation. J. Clean. Prod. 2022, 352, 131576. [Google Scholar] [CrossRef]
  5. Zhang, Y.; Liu, G.; Gao, S.; Zhang, Z.; Huang, L. Effect of humic acid on phytoremediation of heavy metal contaminated sediment. J. Hazard. Mater. Adv. 2023, 9, 100235. [Google Scholar] [CrossRef]
  6. Chai, C.; Yu, Z.; Shen, Z.; Song, X.; Cao, X.; Yao, Y. Nutrient characteristics in the Yangtze River Estuary and the adjacent East China Sea before and after impoundment of the Three Gorges Dam. Sci. Total Environ. 2009, 407, 4687–4695. [Google Scholar] [CrossRef]
  7. Mai, B.; Fu, J.; Gan, Z.; Zheng, L.; Min, Y.; Sheng, G.; Wang, X. Polycyclic aromatic hydrocarbons in sediments from the Pearl river and estuary, China: Spatial and temporal distribution and sources. Appl. Geochem. 2001, 16, 1429–1445. [Google Scholar]
  8. Kibuye, F.; Zamyadi, A.; Wert, E. A critical review on operation and performance of source water control strategies for cyanobacterial blooms: Part II-mechanical and biological control methods. Harmful Algae 2021, 109, 102119. [Google Scholar] [CrossRef]
  9. Riza, M.; Ehsan, M.; Pervez, M.; Khyum, M.; Cai, Y.; Naddeo, V. Control of eutrophication in aquatic ecosystems by sustainable dredging: Effectiveness, environmental impacts, and implications. Case Stud. Chem. Environ. Eng. 2023, 7, 100297. [Google Scholar] [CrossRef]
  10. Liu, C.; Shao, S.; Shen, Q.; Fan, C.; Zhou, Q.; Yin, H.; Xu, F. Use of multi-objective dredging for remediation of contaminated sediments: A case study of a typical heavily polluted confluence area in China. Environ. Sci. Pollut. Res. 2015, 22, 17839–17849. [Google Scholar] [CrossRef]
  11. Wei, Q.; Liu, X.; Zhang, Y.; Zhang, K.; Li, Z.; Shen, Z.; Chow, C. Effect of tannic acid on the dewaterability of dredged sediment and the conditioning mechanism. J. Environ. Chem. Eng. 2021, 9, 104899. [Google Scholar] [CrossRef]
  12. Kumar, R.; Nagendran, R. Influence of initial pH on bioleaching of heavy metals from contaminated soil employing indigenous Acidithiobacillus thiooxidans. Chemosphere 2007, 66, 1775–1781. [Google Scholar] [CrossRef] [PubMed]
  13. Ringelberg, D.; Talley, J.; Perkins, E.; Tucker, S.; Luthy, R.; Bouwer, E.; Fredrickson, H. Succession of phenotypic, genotypic, and metabolic community characteristics during in vitro bioslurry treatment of polycyclic aromatic hydrocarbon-contaminated sediments. Appl. Environ. Microbiol. 2001, 67, 1542–1550. [Google Scholar] [CrossRef] [PubMed]
  14. Seiderer, L.; Newell, R. Analysis of the relationship between sediment composition and benthic community structure in coastal deposits: Implications for marine aggregate dredging. ICES J. Mar. Sci. 1999, 56, 757–765. [Google Scholar] [CrossRef]
  15. Rockers, P.; Tugwell, P.; Grimshaw, J.; Oliver, S.; Atun, R.; Røttingen, J.; Fretheim, A.; Ranson, M.; Daniels, K.; Luiza, V.; et al. Quasi-experimental study designs series–paper 12: Strengthening global capacity for evidence synthesis of quasi-experimental health systems research. J. Clin. Epidemiol. 2017, 89, 98–105. [Google Scholar] [CrossRef]
  16. Yang, N.; Xiao, H.; Pi, K.; Fang, J.; Liu, S.; Chen, Y.; Shi, Y.; Zhang, H.; Gerson, A.; Liu, D. Synchronization of dehydration and phosphorous immobilization for river sediment by calcified polyferric sulfate pretreatment. Chemosphere 2021, 269, 129403. [Google Scholar] [CrossRef]
  17. Berilgen, S.; Bulut, B. Laboratory investigations for dewatering of golden horn dredged sludge with geotextile tubes. Mar. Georesour. Geotechnol. 2016, 34, 638–647. [Google Scholar] [CrossRef]
  18. Chi, Y.; Guo, L.; Xu, Y.; Liu, J.; Xu, W.; Zhao, H. Rapid removal of bound water from dredged sediments using novel hybrid coagulants. Sep. Purif. Technol. 2018, 205, 169–175. [Google Scholar] [CrossRef]
  19. Han, S.; Li, J.; Zhou, Q.; Liu, G.; Wang, T. Harmless disposal and resource utilization of wastes from the lake in China: Dewatering, composting and safety evaluation of fertilizer. Algal Res. 2019, 43, 101623. [Google Scholar] [CrossRef]
  20. Wu, P.; Li, J.; Pi, K.; Li, Q.; Guo, X.; Yuan, J.; Wang, Z.; Wang, C.; Sun, P.; Shi, Y.; et al. Na2SO4 addition on electro-dewatering of urban river sediment by horizontal circular electric field: Comparison of three different electrodes. Dry Technol. 2019, 37, 1926–1938. [Google Scholar] [CrossRef]
  21. Song, Z.; Zhang, W.; Gao, H.; Wang, D. Comprehensive assessment of flocculation conditioning of dredged sediment using organic polymers: Dredged sediment dewaterability and release of pollutants. Sci. Total Environ. 2020, 739, 139884. [Google Scholar] [CrossRef] [PubMed]
  22. Cai, Y.; Wang, J.; Ma, J.; Wang, P.; Fu, H. A new method to improve the effectiveness of vacuum preloading on the consolidation of dredged fill in Wenzhou. Jpn. Geotech. Soc. Spec. Publ. 2016, 2, 1794–1797. [Google Scholar] [CrossRef]
  23. Guibal, E.; Vooren, M.; Dempsey, B.; Roussy, J. The use of chitosan for the removal of particulate and dissolved contaminants. ChemInform 2006, 37, 280. [Google Scholar] [CrossRef]
  24. Temesgen, T.; Bui, T.; Han, M.; Kim, T.; Park, H. Micro and nanobubble technologies as a new horizon for water-treatment techniques: A review. Adv. Colloid Interface Sci. 2017, 246, 40–51. [Google Scholar] [CrossRef] [PubMed]
  25. Lou, S.; Ouyang, Z.; Zhang, Y.; Li, X.; Yang, F. Nanobubbles on solid surface imaged by atomic force microscopy. J. Vac. Sci. Technol. B Microelectron. Nano Struct. 2000, 18, 2573–2575. [Google Scholar] [CrossRef]
  26. Masayoshi, T.; Taro, K.; Yoshitaka, Y.; Hirofumi, O.; Shouzou, H.; Hideaki, S. Effect of shrinking microbubble on gas hydrate formation. J. Phys. Chem. B 2003, 107, 2171–2173. [Google Scholar]
  27. Takahashi, M.; Chiba, K.; Li, P. Free-radical generation from collapsing microbubbles in the absence of a dynamic stimulus. J. Phys. Chem. B 2007, 111, 1343–1347. [Google Scholar] [CrossRef]
  28. Li, P.; Takahashi, M.; Chiba, K. Enhanced free-radical generation by shrinking microbubbles using a copper catalyst. Chemosphere 2009, 77, 1157–1160. [Google Scholar] [CrossRef]
  29. Tasaki, T.; Wada, T.; Fujimoto, K.; Kai, S.; Ohe, K.; Oshima, T.; Baba, Y.; Kukizaki, M. Degradation of methyl orange using short-wavelength UV irradiation with oxygen microbubbles. J. Hazard. Mater. 2009, 162, 1103–1110. [Google Scholar] [CrossRef]
  30. Wang, X.; Zhang, Y. Degradation of alachlor in aqueous solution by using hydrodynamic cavitation. J. Hazard. Mater. 2009, 161, 202–207. [Google Scholar] [CrossRef]
  31. Sun, Y.; Wang, S.; Niu, J. Microbial community evolution of black and stinking rivers during in situ remediation through micro-nano bubble and submerged resin floating bed technology. Bioresour. Technol. 2018, 258, 187–194. [Google Scholar] [CrossRef] [PubMed]
  32. Wang, L.; Li, Y.; Xiong, Y.; Mao, X.; Zhang, L.; Xu, J.; Tan, W.; Wang, J.; Li, T.; Xi, B.; et al. Spectroscopic characterization of dissolved organic matter from sludge solubilization treatment by micro-bubble technology. Ecol. Eng. 2017, 106, 94–100. [Google Scholar] [CrossRef]
  33. Wang, D.; Yang, X.; Tian, C.; Lei, Z.; Kobayashi, N.; Kobayashi, M.; Adachi, Y.; Shimizu, K.; Zhang, Z. Characteristics of ultra-fine bubble water and its trials on enhanced methane production from waste activated sludge. Bioresour. Technol. 2019, 273, 63–69. [Google Scholar] [CrossRef] [PubMed]
  34. Yang, X.; Nie, J.; Wang, D.; Zhao, Z.; Kobayashi, M.; Adachi, Y.; Shimizu, K.; Lei, Z.; Zhang, Z. Enhanced hydrolysis of waste activated sludge for methane production via anaerobic digestion under N2-nanobubble water addition. Sci. Total Environ. 2019, 693, 133524. [Google Scholar] [CrossRef]
  35. Yaparatne, S.; Doherty, Z.; Magdaleno, A.; Matula, E.; Garcia, S.; Apul, O. Effect of air nanobubbles on oxygen transfer, oxygen uptake, and diversity of aerobic microbial consortium in activated sludge reactors. Bioresour. Technol. 2022, 351, 127090. [Google Scholar] [CrossRef]
  36. Wang, X.; Lei, Z.; Zhang, Z.; Shimizu, K.; Lee, D.; Khanal, S. Use of nanobubble water bioaugmented anaerobically digested sludge for high-efficacy energy production from high-solids anaerobic digestion of corn straw. Sci. Total Environ. 2023, 863, 160825. [Google Scholar] [CrossRef]
  37. Zhou, S.; Liu, M.; Chen, B.; Sun, L.; Lu, H. Microbubble- and nanobubble-aeration for upgrading conventional activated sludge process: A review. Bioresour. Technol. 2022, 362, 127826. [Google Scholar] [CrossRef]
  38. Feng, Q.; Guo, K.; Gao, Y.; Liu, B.; Yue, Q.; Shi, W.; Feng, C.; Zhou, J.; Wang, G.; Gao, B. Effect of coagulation treatment on sludge dewatering performance: Application of polysilicate and their machanism. Sep. Purif. Technol. 2022, 301, 121954. [Google Scholar] [CrossRef]
  39. Ding, Y.; Tian, Y.; Li, Z.; Zuo, W.; Zhang, J. A comprehensive study into fouling properties of extracellular polymeric substance (EPS) extracted from bulk sludge and cake sludge in a mesophilic anaerobic membrane bioreactor. Bioresour. Technol. 2015, 192, 105–114. [Google Scholar] [CrossRef]
  40. Wang, T.; Chen, J.; Shen, H.; An, D. Effects of total solids content on waste activated sludge thermophilic anaerobic digestion and its sludge dewaterability. Bioresour. Technol. 2016, 217, 265–270. [Google Scholar] [CrossRef]
  41. Liu, J.; Zhang, Z.; Xue, W.; Siriweera, W.; Chen, G.; Wu, D. Anaerobic digestion of saline waste activated sludge and recovering raw sulfated polysaccharides. Bioresour. Technol. 2021, 335, 125255. [Google Scholar] [CrossRef] [PubMed]
  42. Xue, W.; Zeng, Q.; Lin, S.; Zan, F.; Hao, T.; Lin, Y.; Loosdrecht, M.; Chen, G. Recovery of high-value and scarce resources from biological wastewater treatment: Sulfated polysaccharides. Water Res. 2019, 163, 114889. [Google Scholar] [CrossRef] [PubMed]
  43. Wu, Y.; Zhang, P.; Zeng, G.; Jie, Y.; Liu, J. Enhancing sewage sludge dewaterability by a skeleton builder: Biochar produced from sludge cake conditioned with rice husk flour and Fecl3. ACS Sustain. Chem. Eng. 2016, 4, 5711–5717. [Google Scholar] [CrossRef]
  44. Lee, C.; Robinson, J.; Chong, M. A review on application of flocculants in wastewater treatment. Process. Saf. Environ. 2014, 92, 489–508. [Google Scholar] [CrossRef]
  45. Li, H.; Hu, L.; Xia, Z. Impact of groundwater salinity on bioremediation enhanced by micro-nano bubbles. Materials 2013, 6, 3676–3687. [Google Scholar] [CrossRef] [PubMed]
  46. Chen, G.; Lin, W.; Lee, D. Capillary suction time (CST) as a measure of sludge dewaterability. Water Sci. Technol. 1996, 34, 443–448. [Google Scholar] [CrossRef]
  47. Wang, W.; Fan, W.; Huo, M.; Zhao, H.; Lu, Y. Hydroxyl radical generation and contaminant removal from water by the collapse of microbubbles under different hydrochemical conditions. Water Air Soil Pollut. 2018, 229, 86. [Google Scholar] [CrossRef]
  48. Lin, H.; Wu, J.; Zhang, H. Degradation of bisphenol A in aqueous solution by a novel electro/Fe3+/peroxydisulfate process. Sep. Purif. Technol. 2013, 117, 18–23. [Google Scholar] [CrossRef]
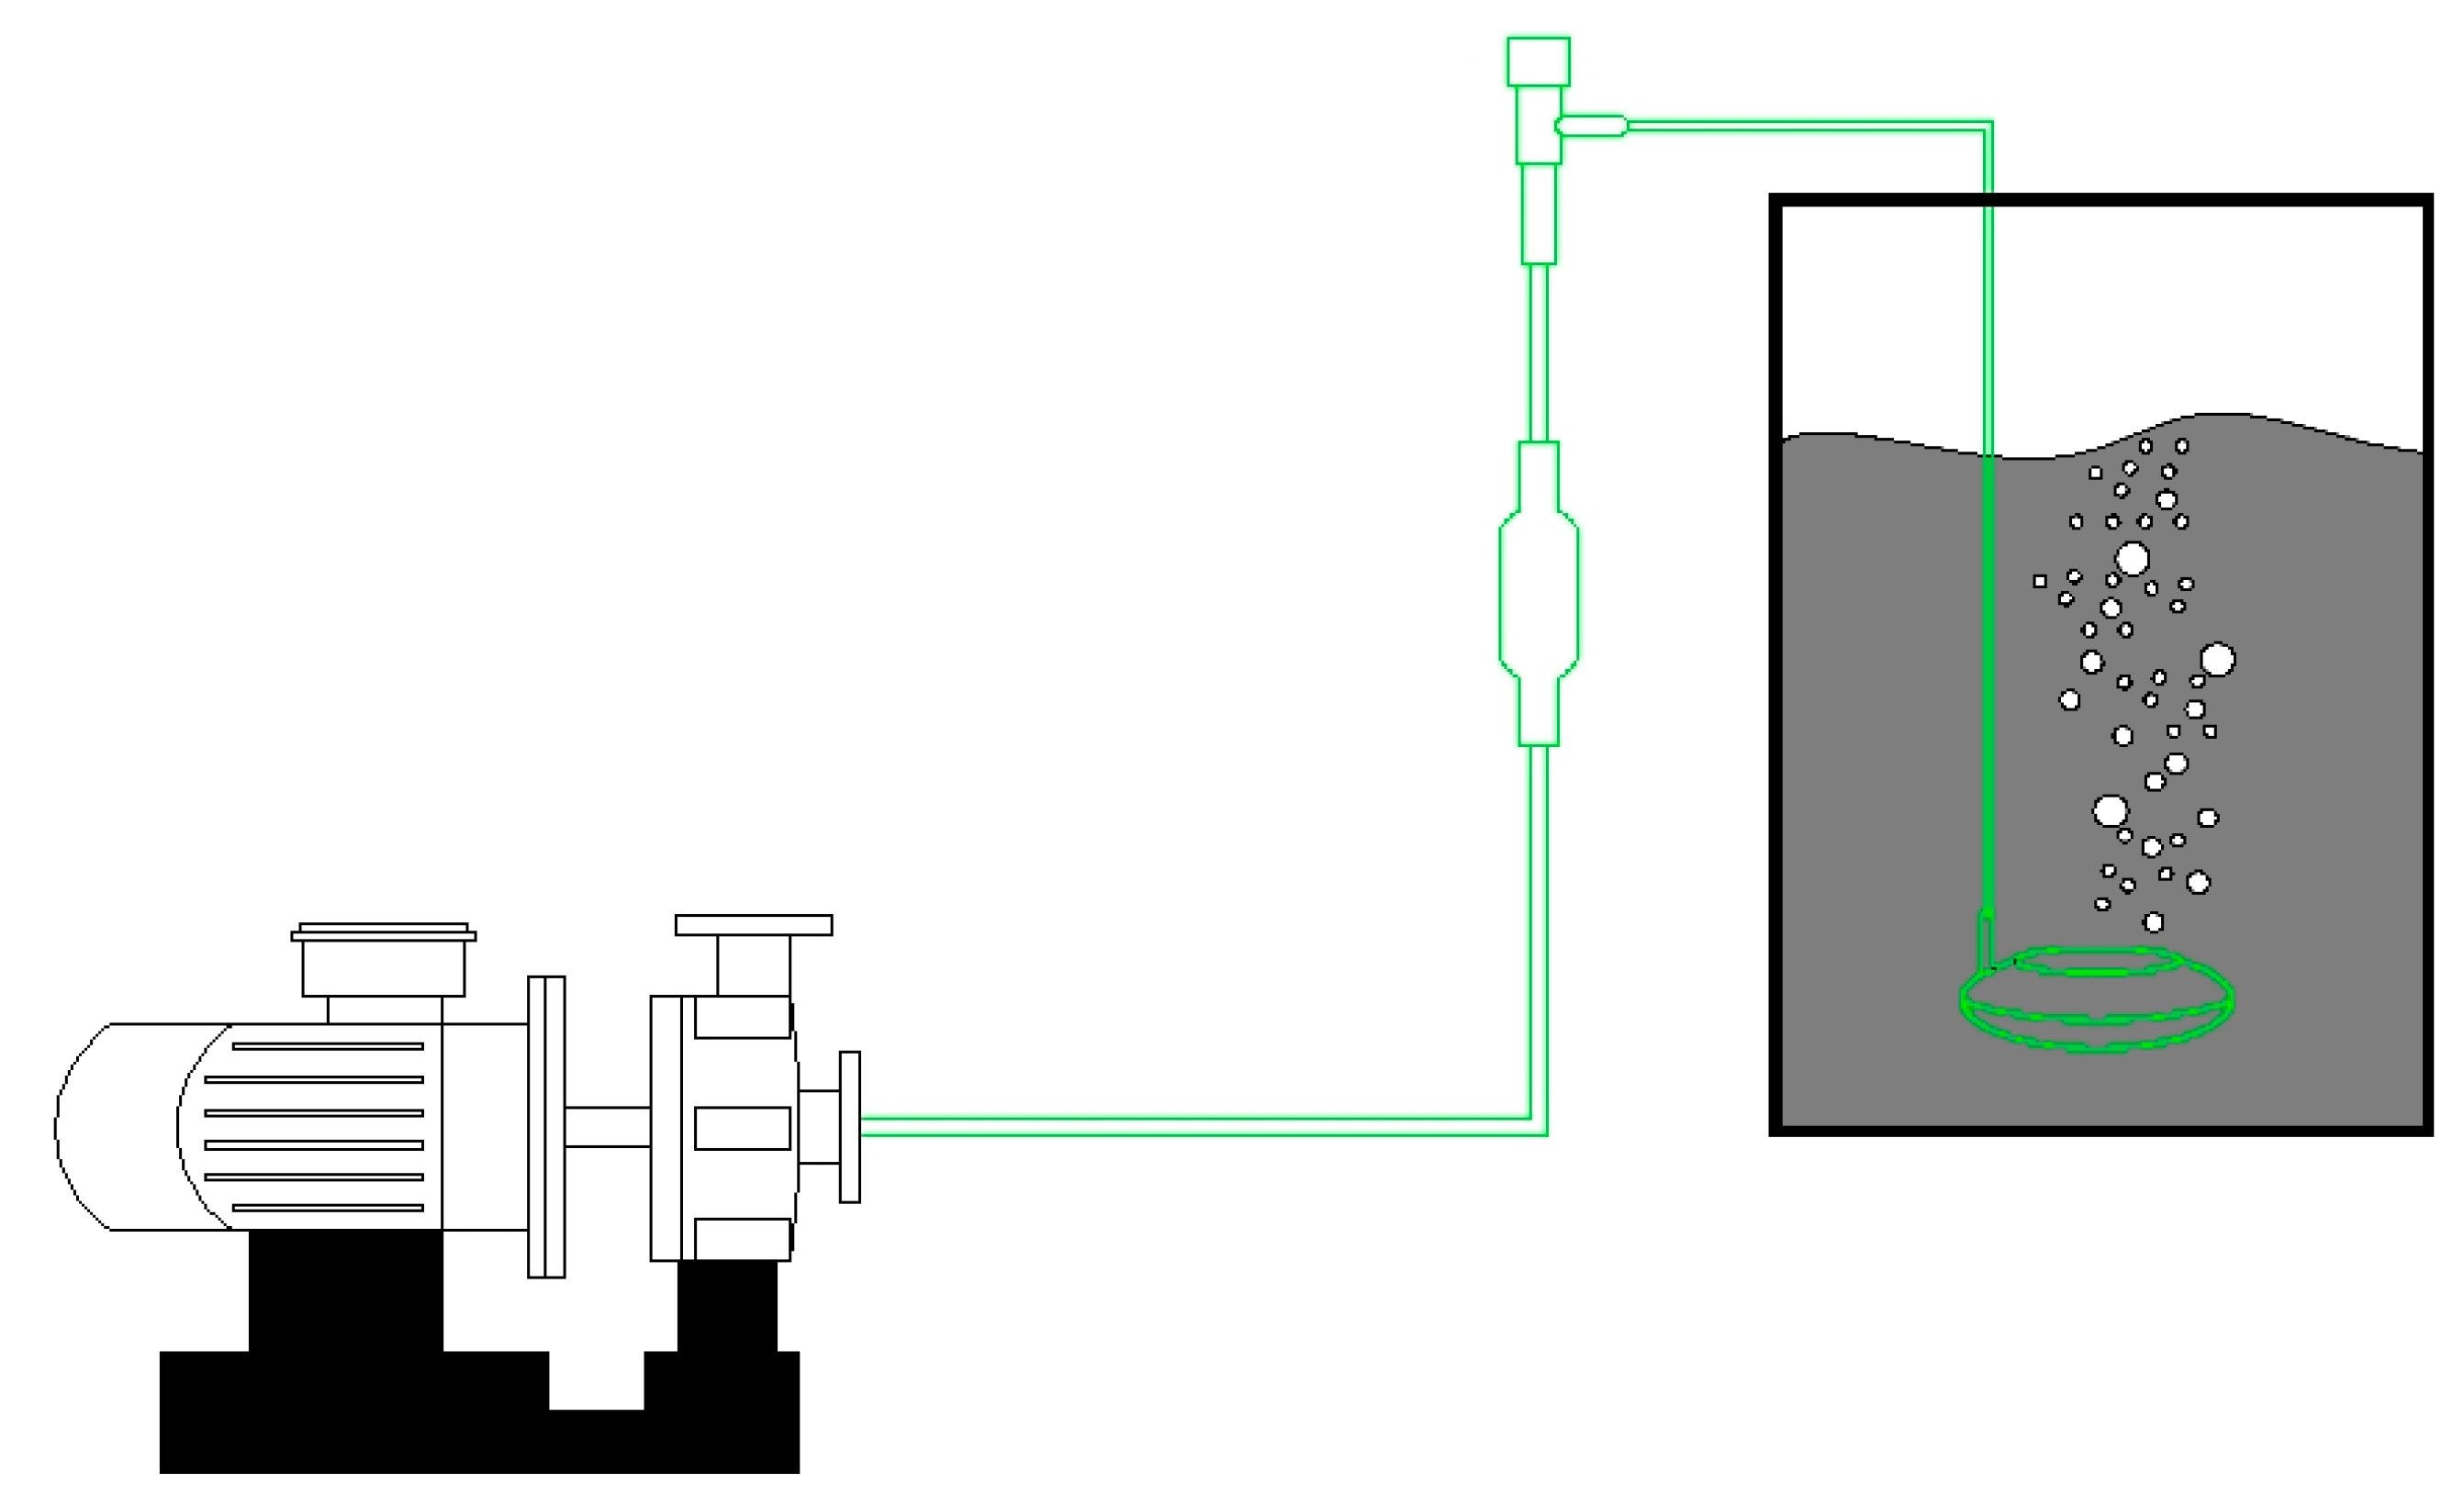
Figure 1. Experimental device of MBs conditioning for contaminated sediment.
Water 15 01985 g001
Figure 2. The impact of different bubble size on the CST of conditioned sediment and the moisture content of the filtered cake.
Water 15 01985 g002
Figure 3. The effect of different bubble size on the polysaccharides content in SEPS and BEPS.
Water 15 01985 g003
Figure 4. The influence of different bubble size on the MLSS content in the filtrate.
Water 15 01985 g004
Figure 5. The effect of different intake air volume on the CST of conditioned sediment and the moisture content of the filtered cake.
Water 15 01985 g005
Figure 6. The effect of intake air volume on the polysaccharides content in SEPS and BEPS.
Water 15 01985 g006
Figure 7. The influence of different intake air volume on the MLSS content in the filtrate.
Water 15 01985 g007
Figure 8. The effect of treatment time on the CST of conditioned sediment and the moisture content of the filter cake.
Water 15 01985 g008
Figure 9. The effect of treatment time on the polysaccharides content in SEPS and BEPS.
Water 15 01985 g009
Figure 10. The influence of treatment time on the MLSS content in the filtrate.
Water 15 01985 g010
Figure 11. The SEM of the sediment and filter cake before and after the treatment of MBs: (a) The SEM of sediment before the treatment (b) The SEM of filter cake after the treatment.
Water 15 01985 g011aWater 15 01985 g011b
Table 1. The orthogonal experimental design of MBs conditioning treatment of contaminated sediment.
NumberExperimental Factors
Treatment Time (min)Intake Air Volume (L/min)Bubble Size (μm)
1110500
2220100
35301
Table 2. Orthogonal experiment results of MBs conditioning of contaminated sediment.
NumberTreatment TimeIntake Air VolumeBubble SizeCST/s
1111325.6
2122382.3
3133136.9
4212224.7
5223263.5
6231343.2
7313244.7
8321281.6
9332163.8
R51.694.5101.8
Disclaimer/Publisher’s Note: The statements, opinions and data contained in all publications are solely those of the individual author(s) and contributor(s) and not of MDPI and/or the editor(s). MDPI and/or the editor(s) disclaim responsibility for any injury to people or property resulting from any ideas, methods, instructions or products referred to in the content.