
An Integrated Approach to an Assessment of Bottlenecks for Navigation on Riverine Waterways


Abstract
:1. Introduction
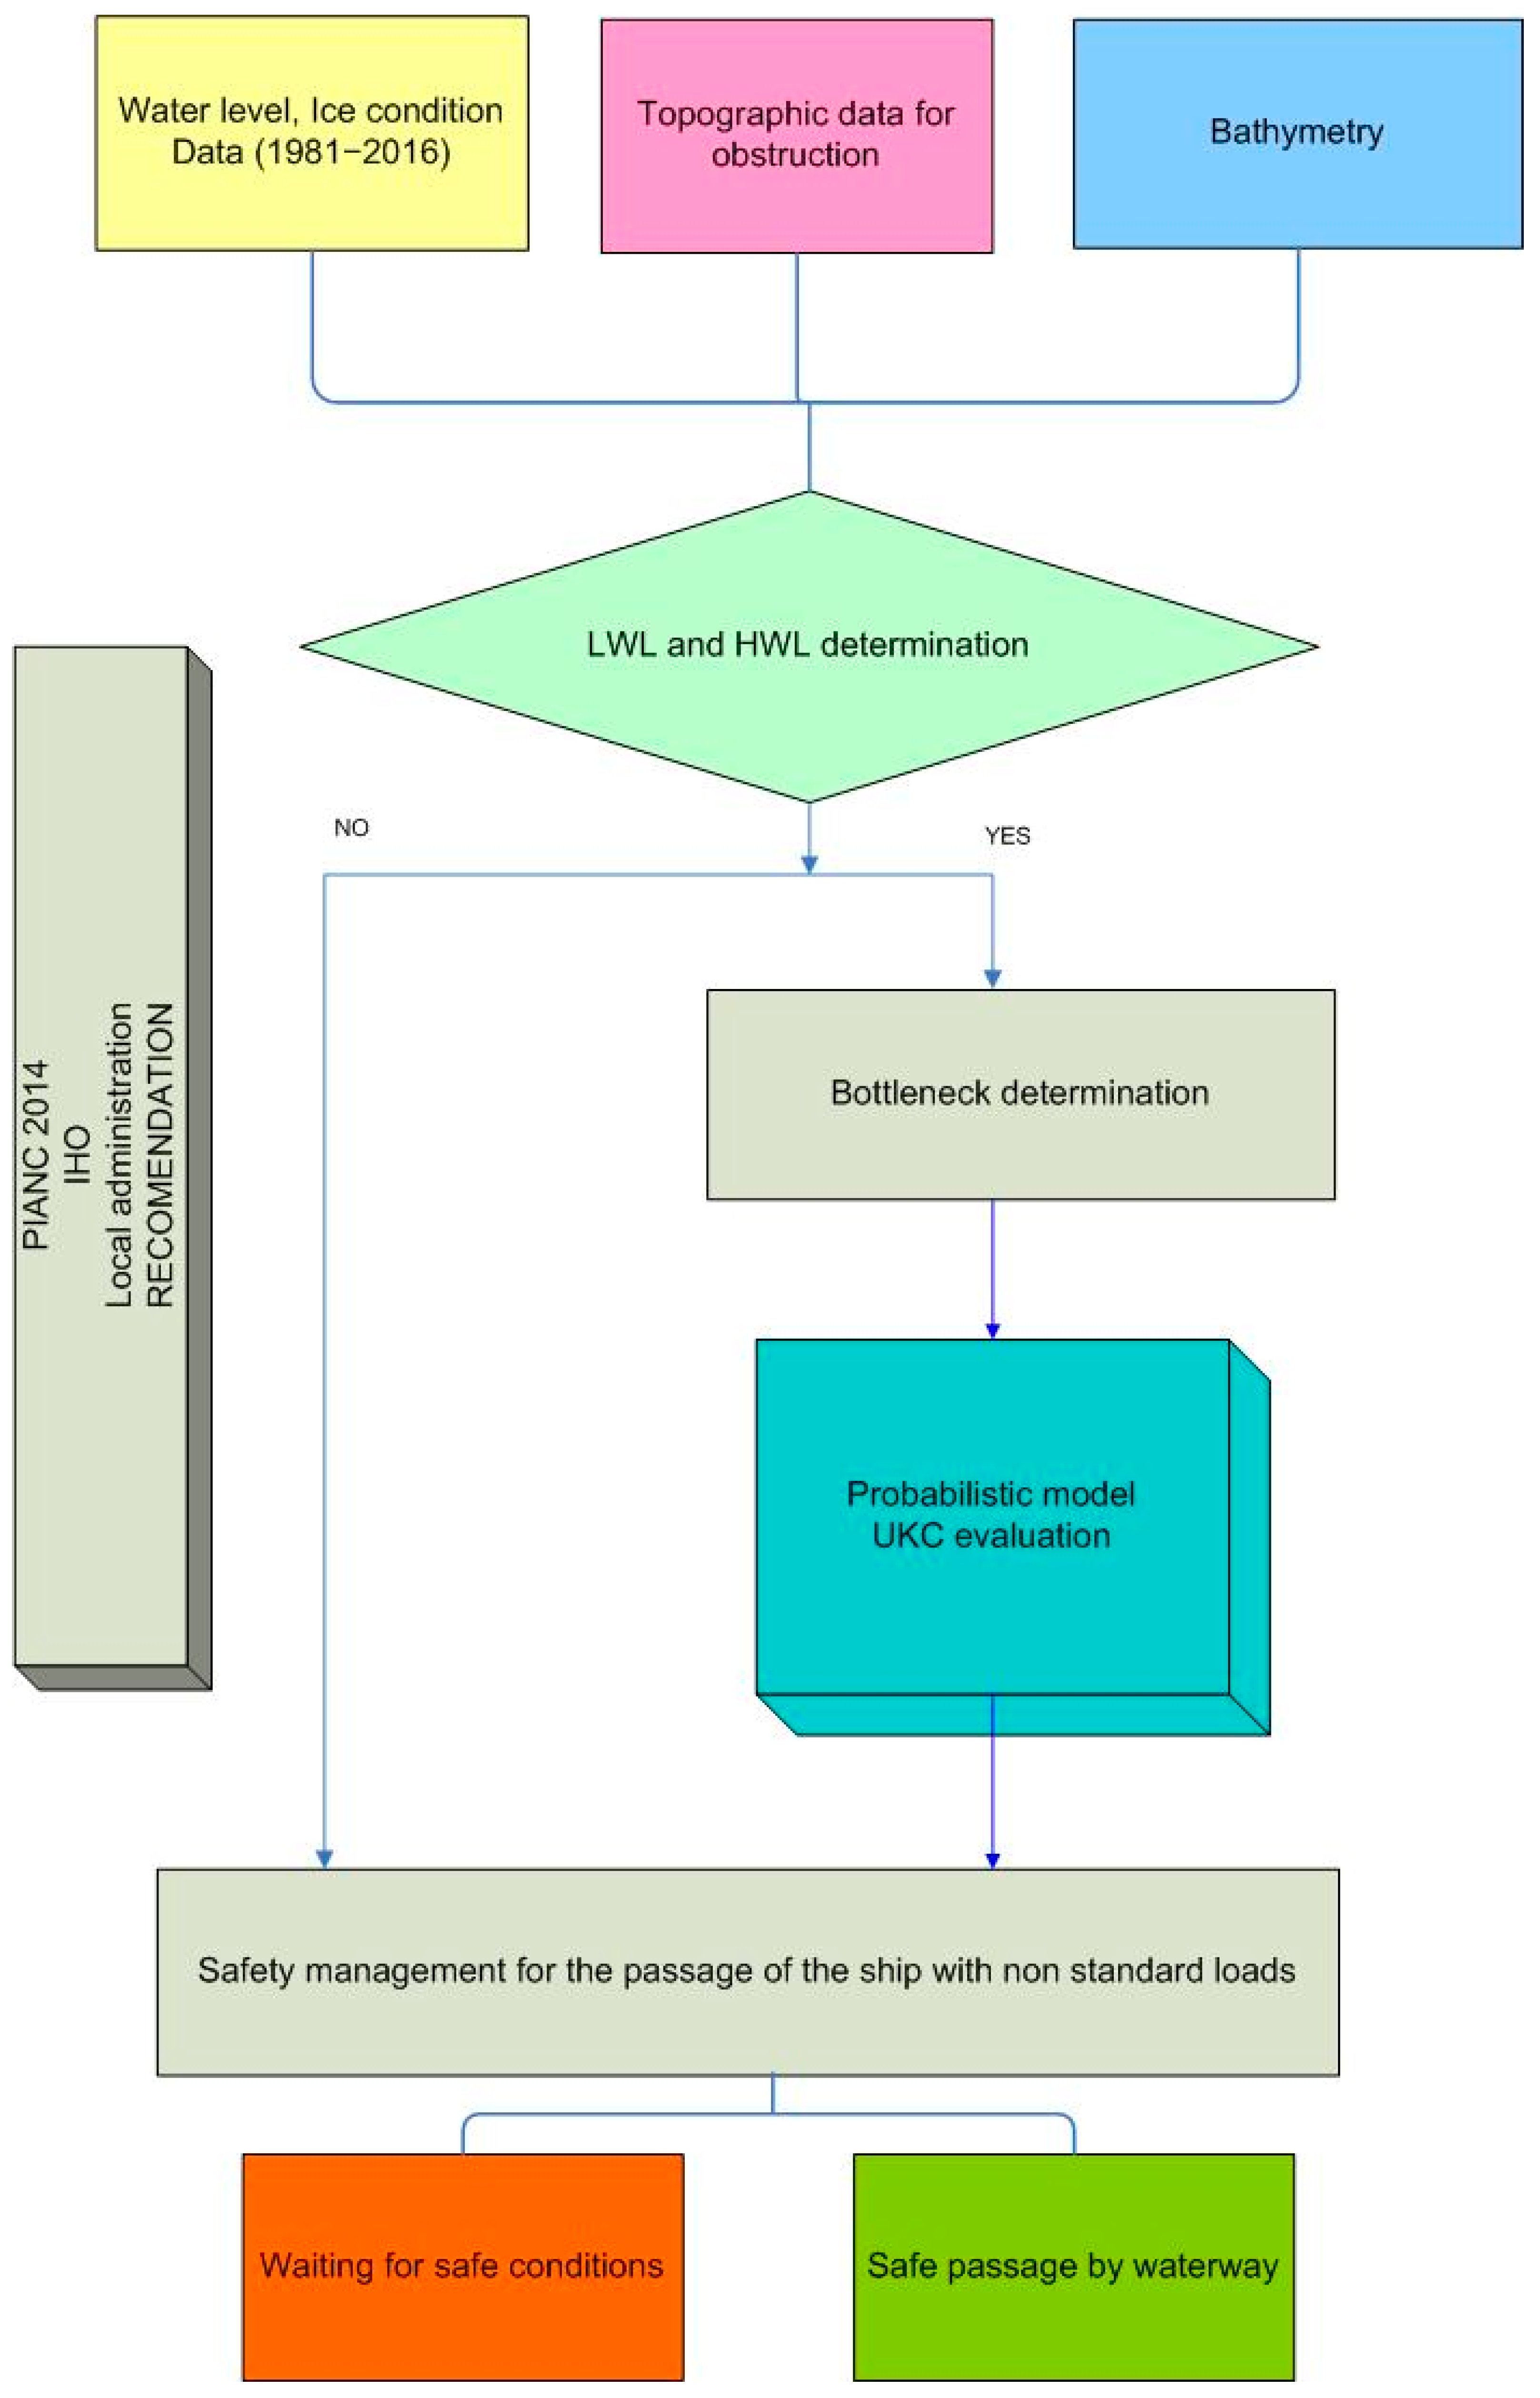
2. Methods and Data
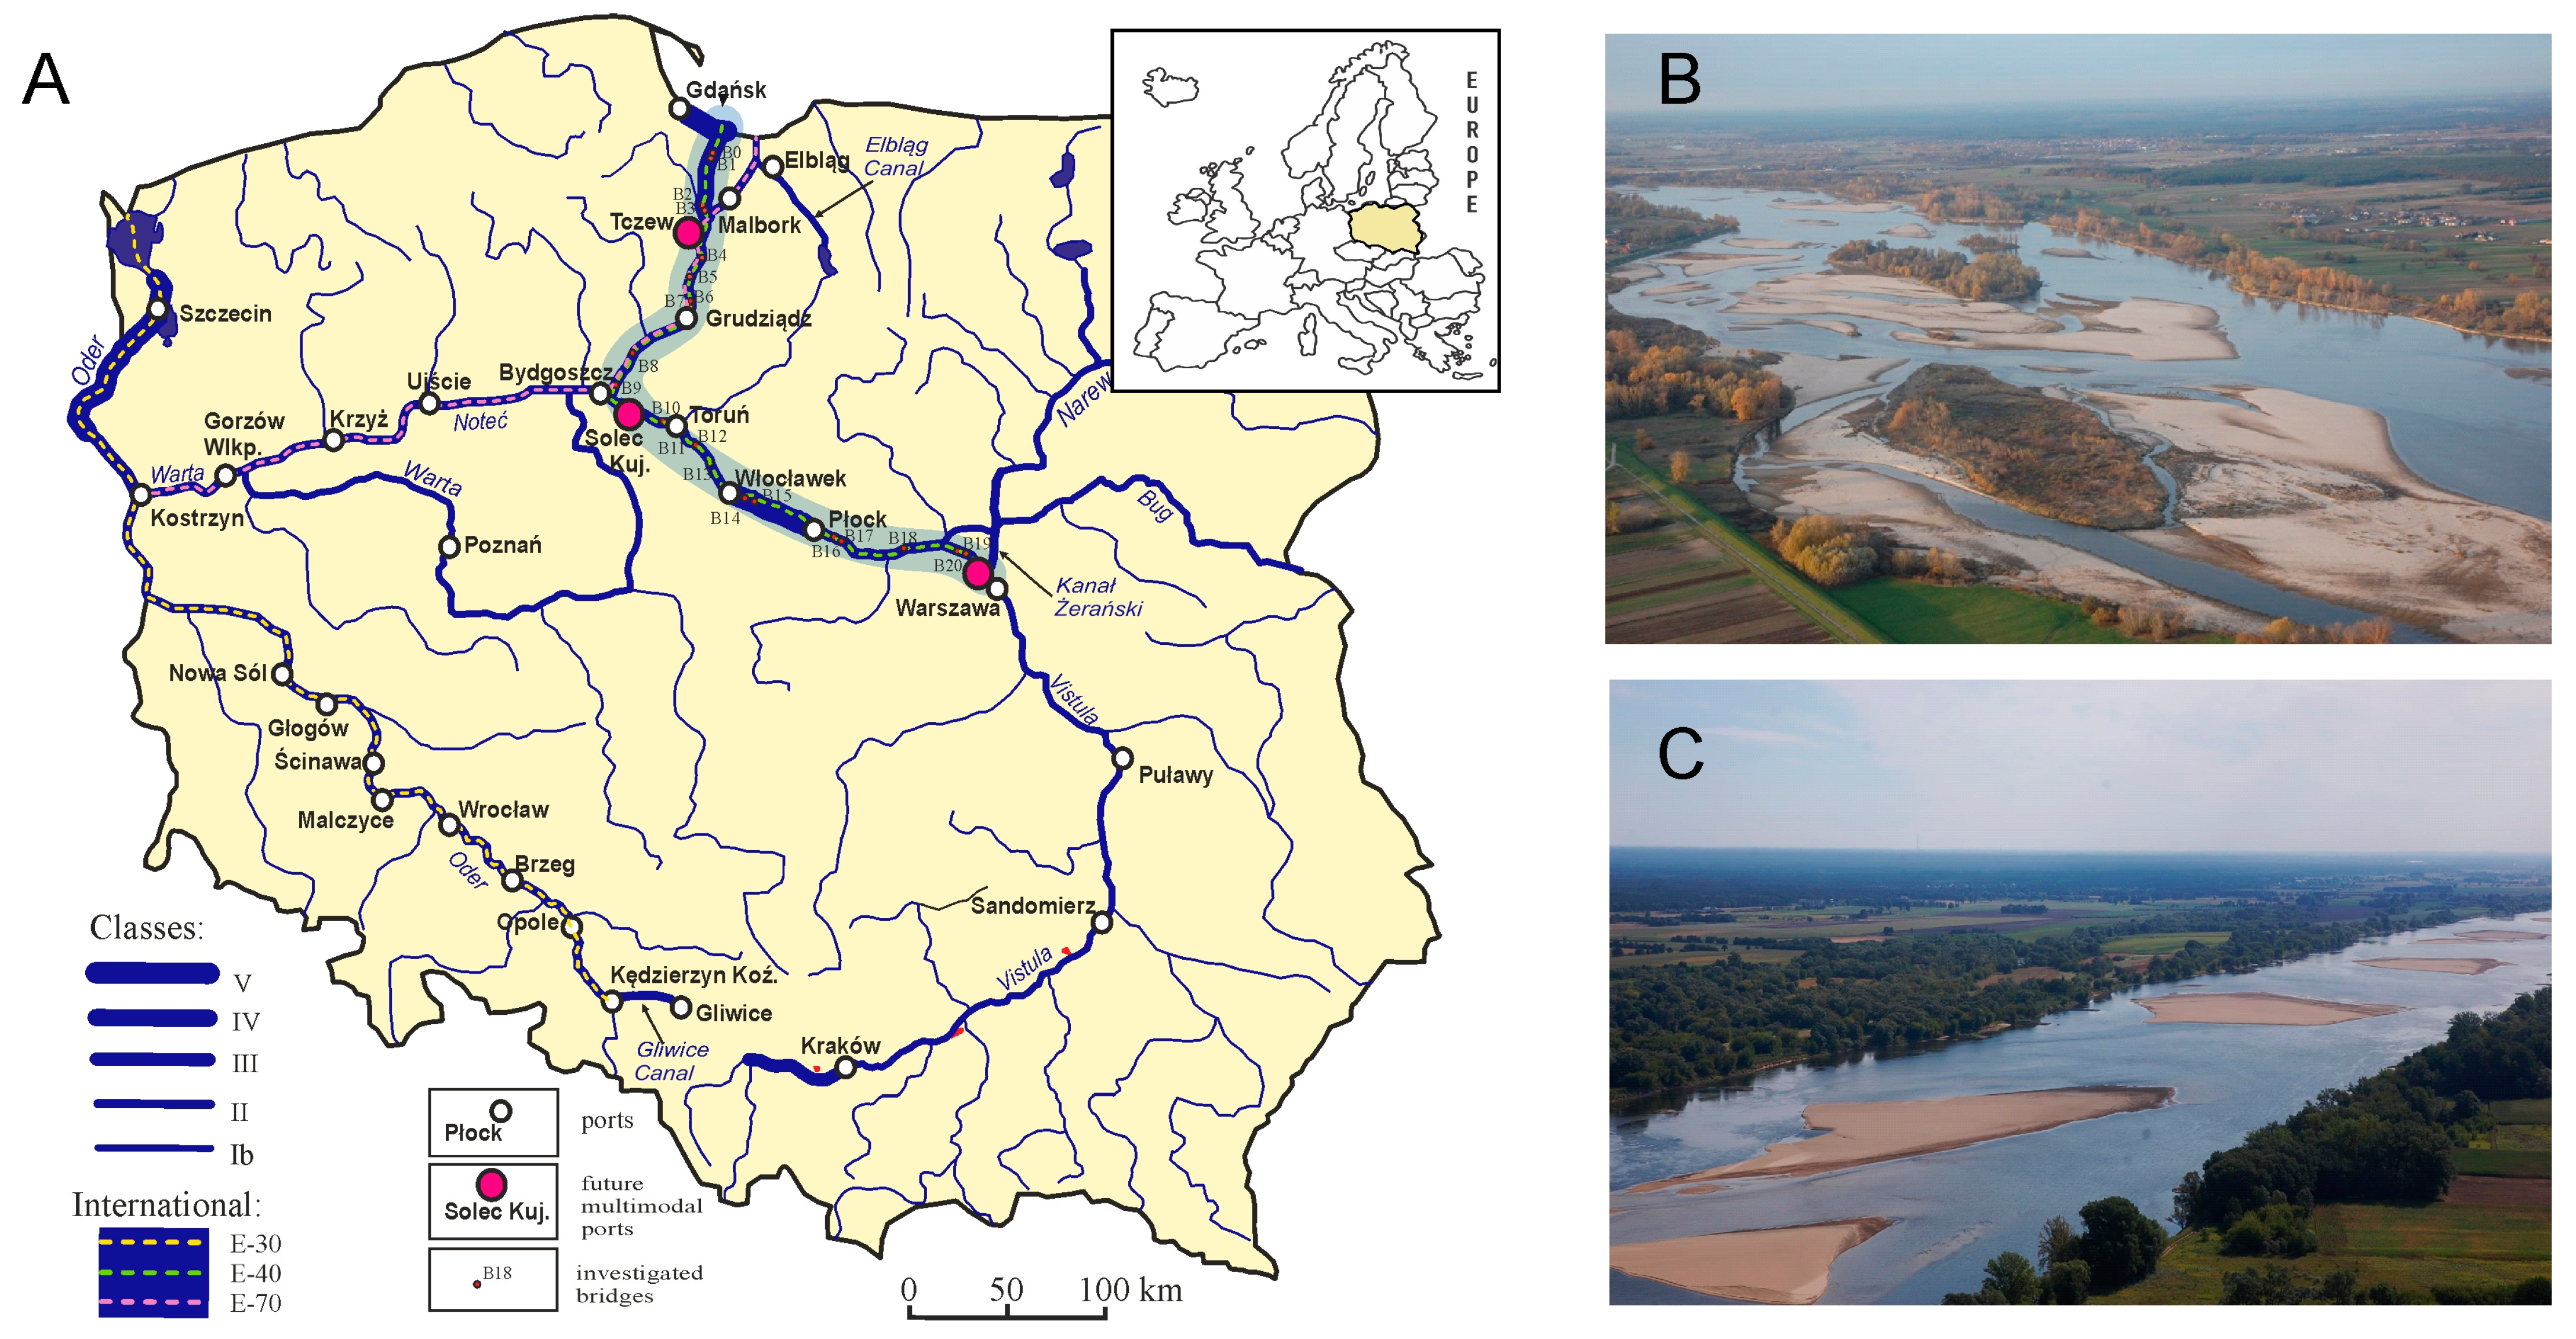
2.1. Study Area
2.2. Data
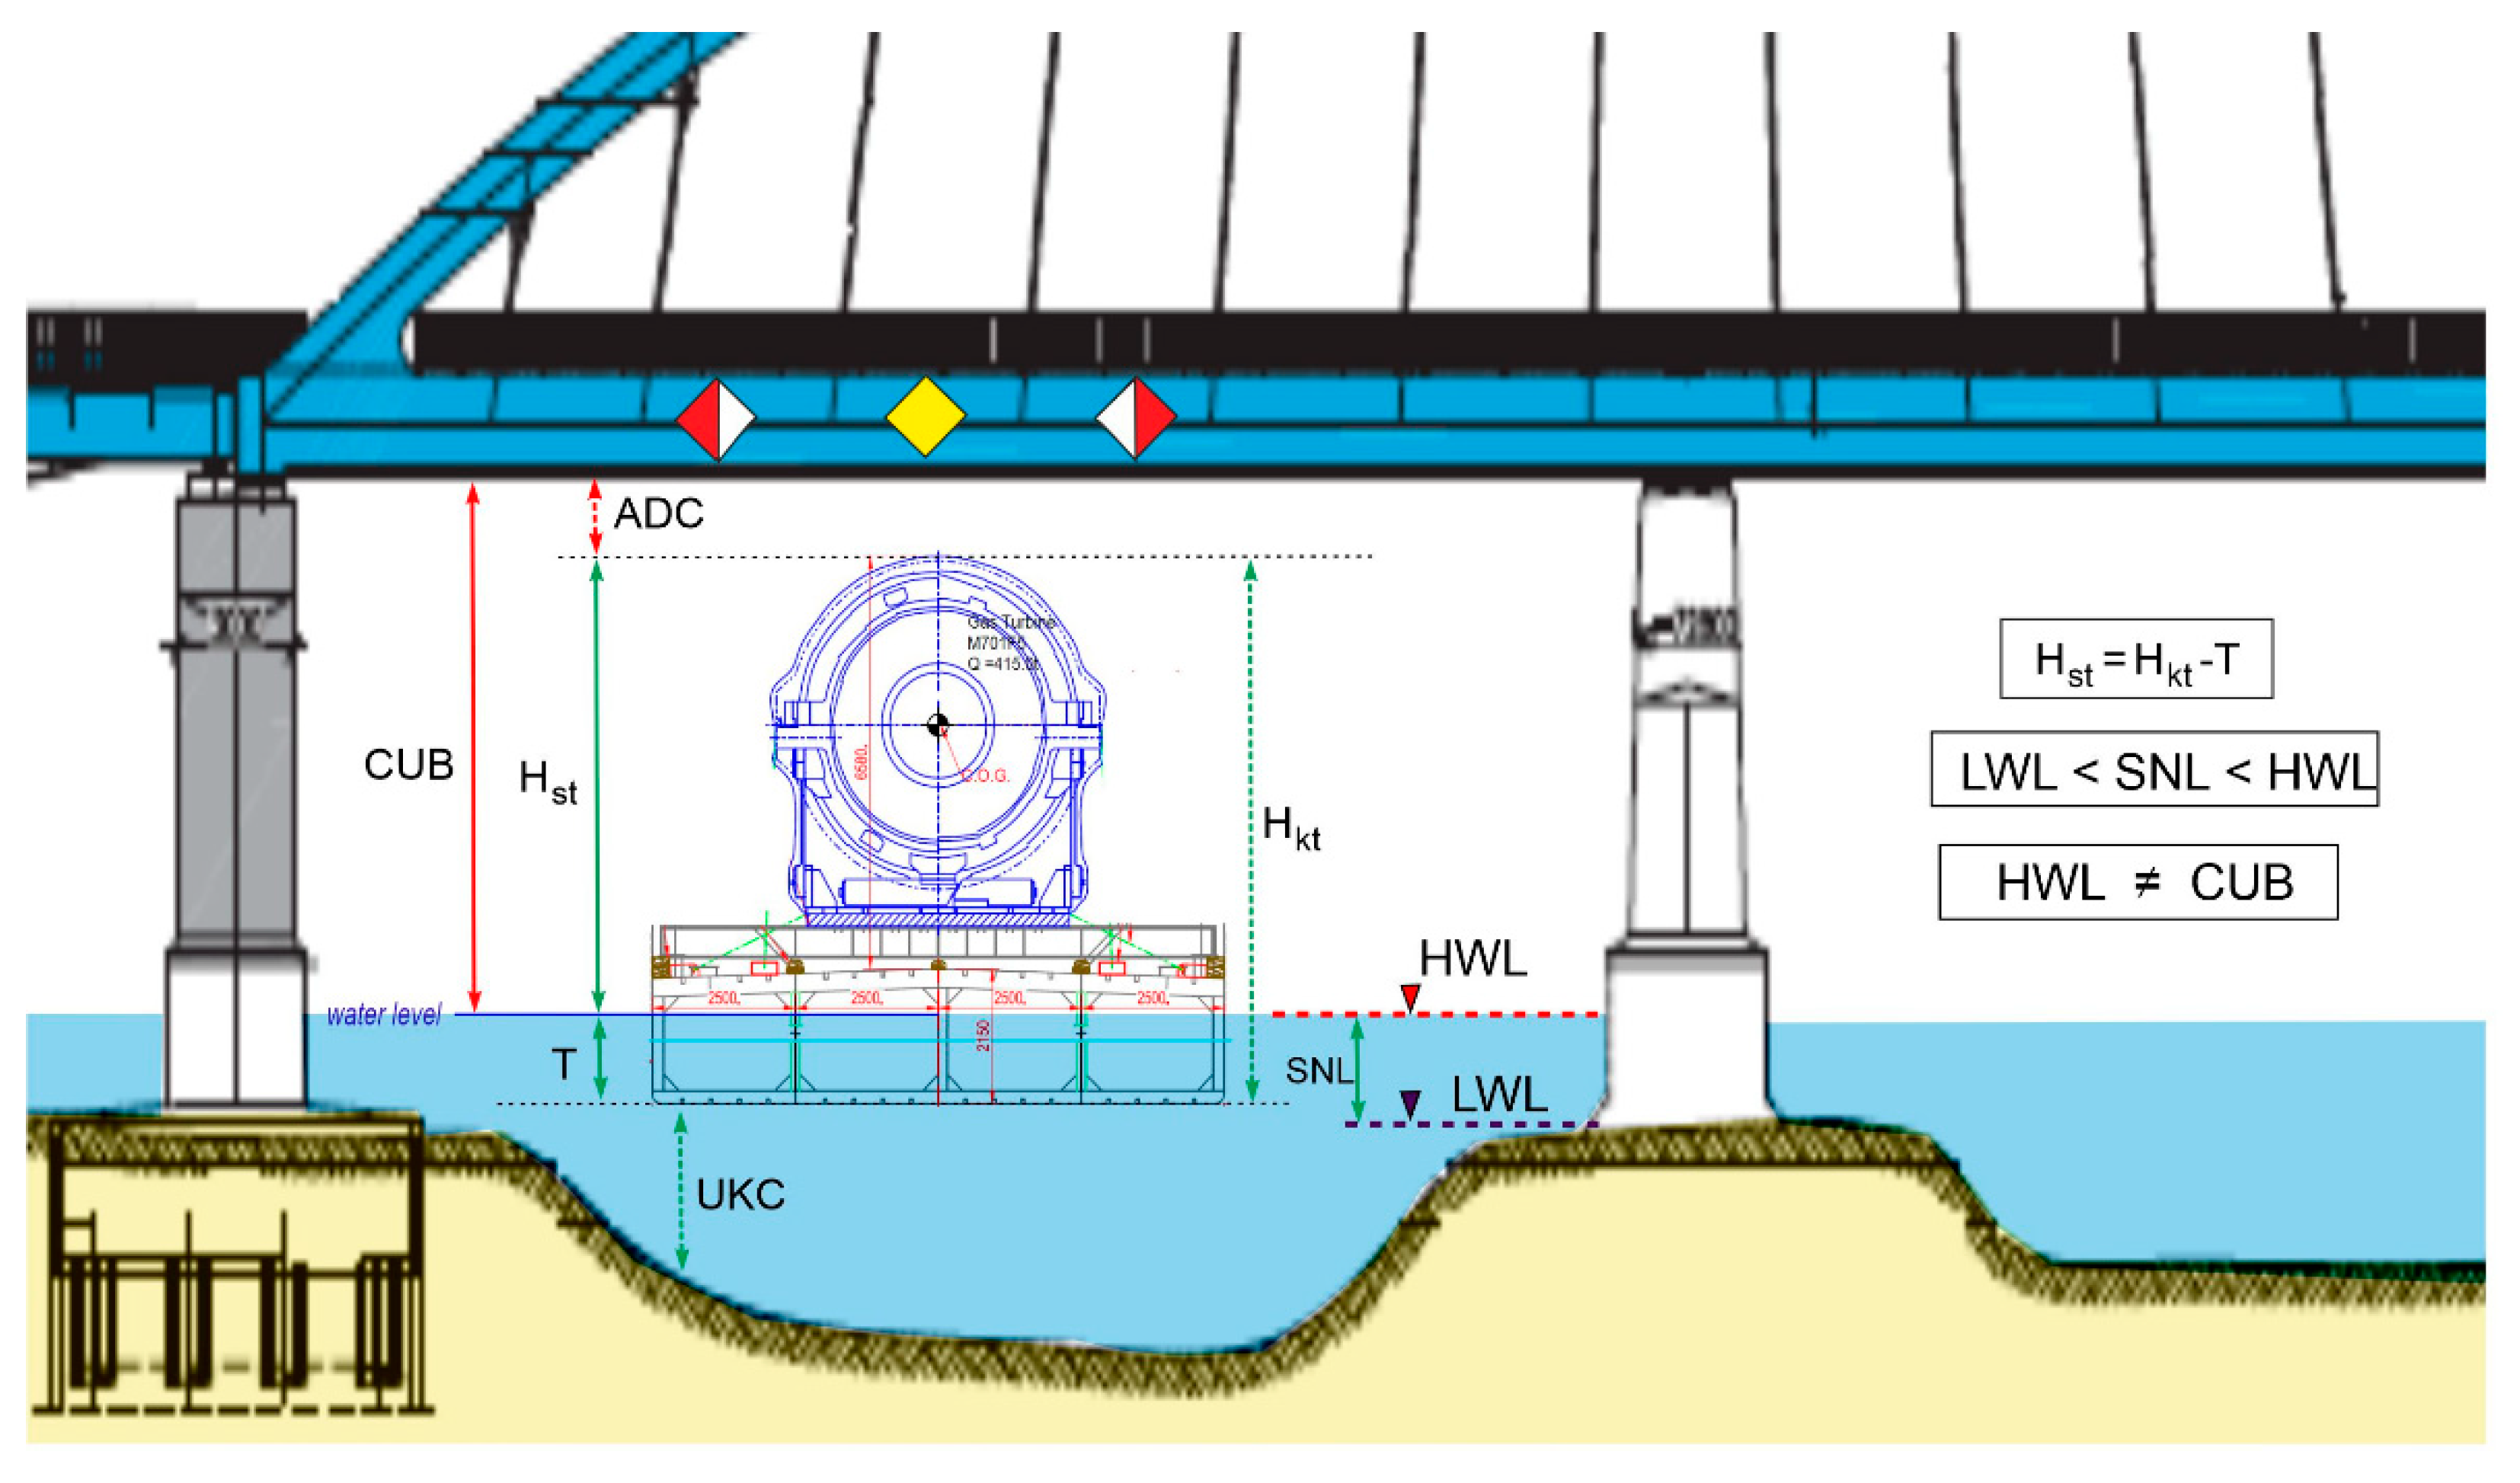
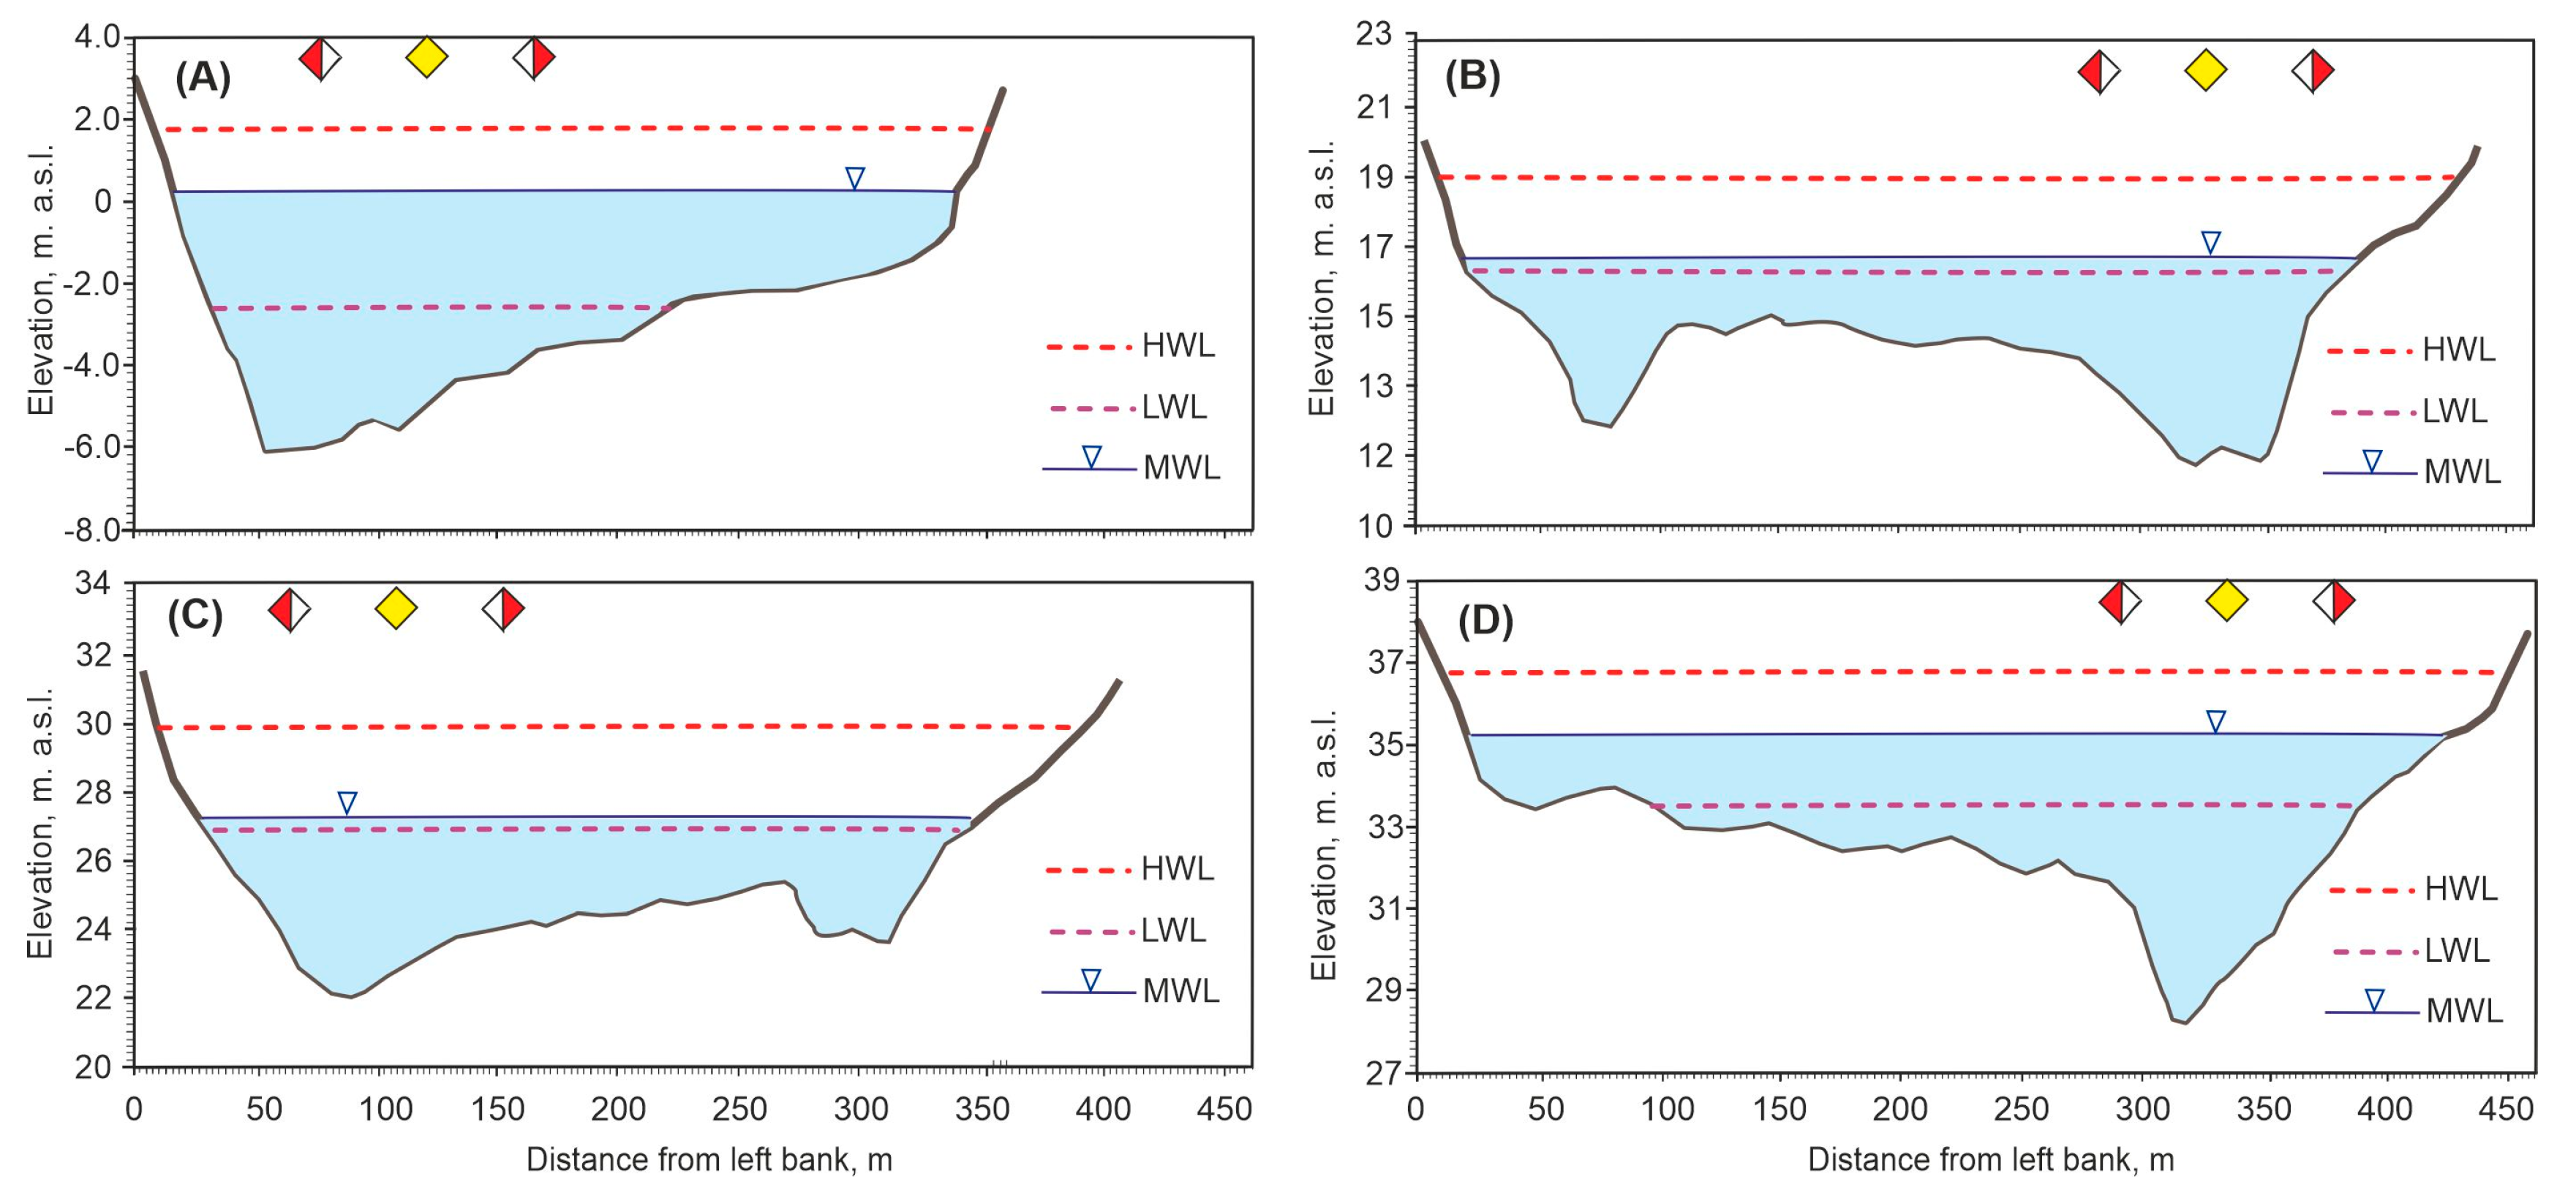
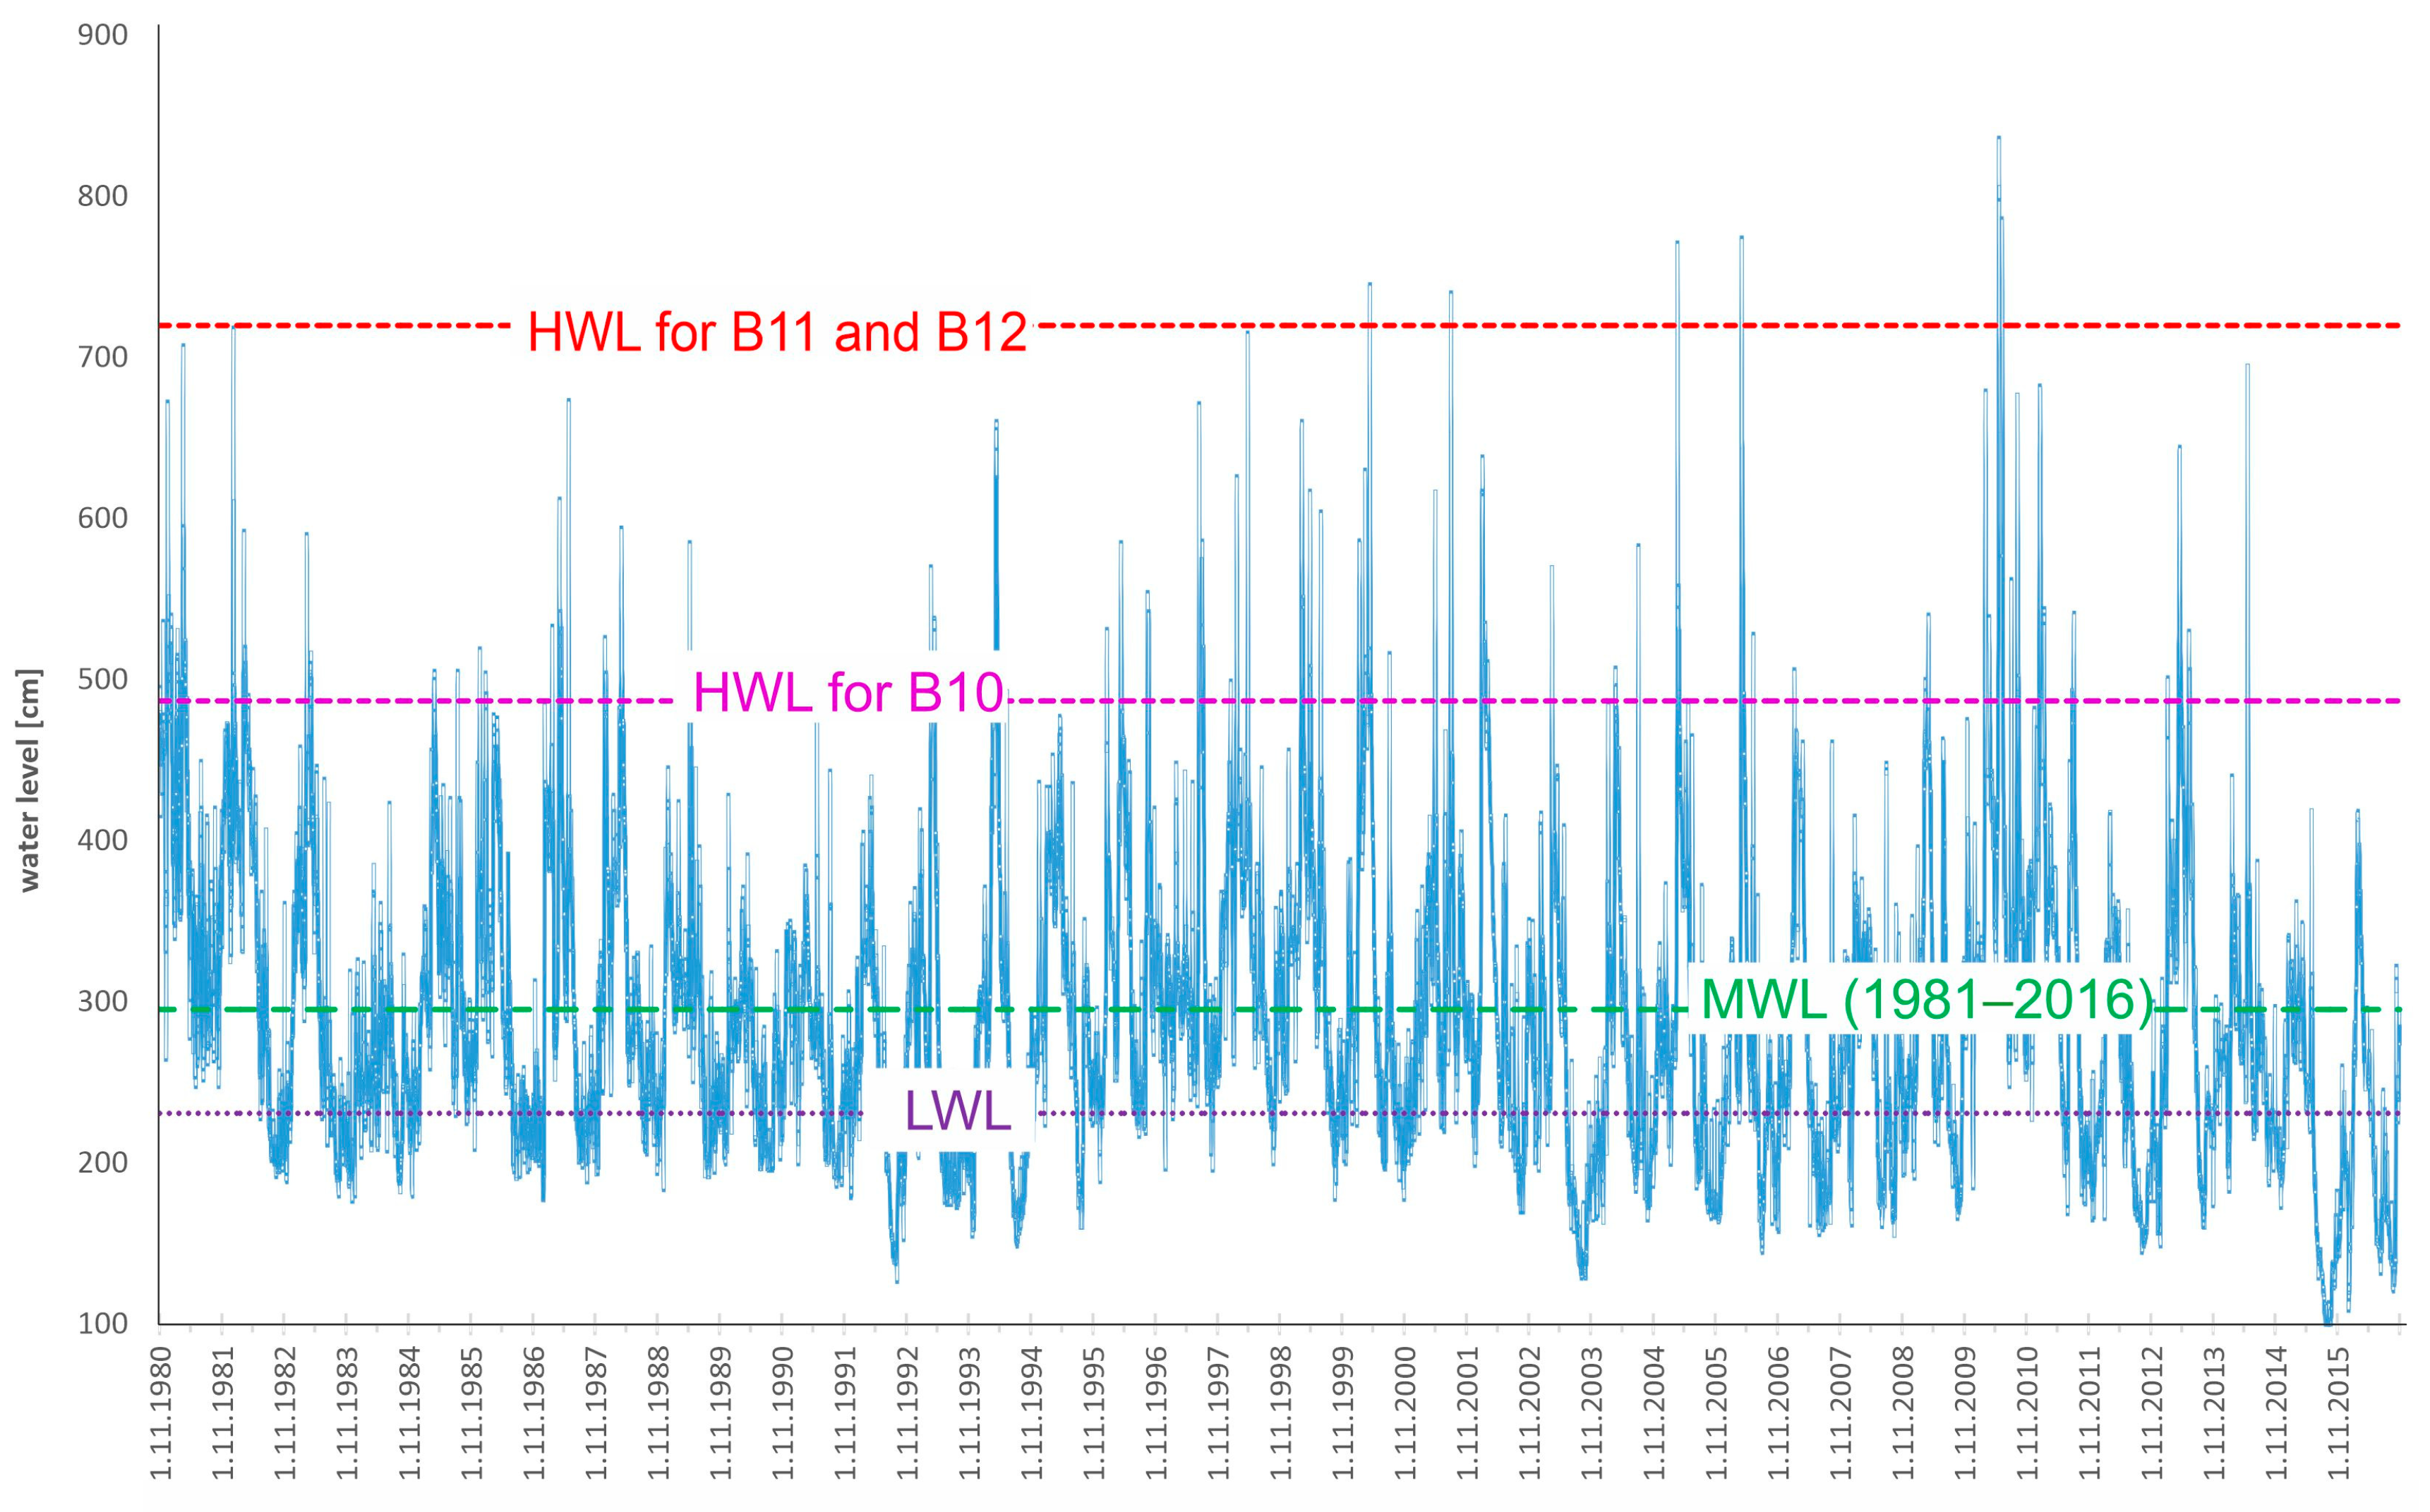
2.3. Marginal Conditions of Characteristic Water Level for Bridges
2.4. Ice Condition
2.5. Bridges Risk Assessment
- Bow collision with bridge pillar;
- Side collision with bridge pillar;
- Deckhouse (superstructure) collision with bridge span.
2.6. UKC Evaluation
- The accuracy of the hydrographic data;
- The vessel’s size and handling characteristics;
- Changes in the predicted tidal height caused by wind speed and direction and high or low barometric pressure in the case of seashore areas;
- The nature and stability of the riverbed—bedload transport, i.e., sand waves, siltation;
- Structures: underwater pipelines, other structures, etc.
2.7. Method of Constant Clearances
2.8. Method of Channel Depth Factors
- Allowance for static draught uncertainties (equals 0),
- Change in water density (equals 0),
- Ship squat and dynamic trim (range from 0.023 to 0.032),
- Dynamic heel (equals 0),
- Wave response allowance (equals 0),
- Net UKC (0.5 m).
- Allowance for bed level uncertainties (0.1 m);
- Allowance for bottom changes between dredging (0.253 m);
- Dredging execution tolerance—level was accepted at 0.2 m;
- Muddy channel beds (0.2 m).
2.9. Probabilistic Method
3. Models and Results
3.1. Probabilistic Model
- (a)
- Random draught module
- (b)
- Water level module
- (c)
- Depth module
- (d)
- Squat module
- (e)
- Under keel clearance module
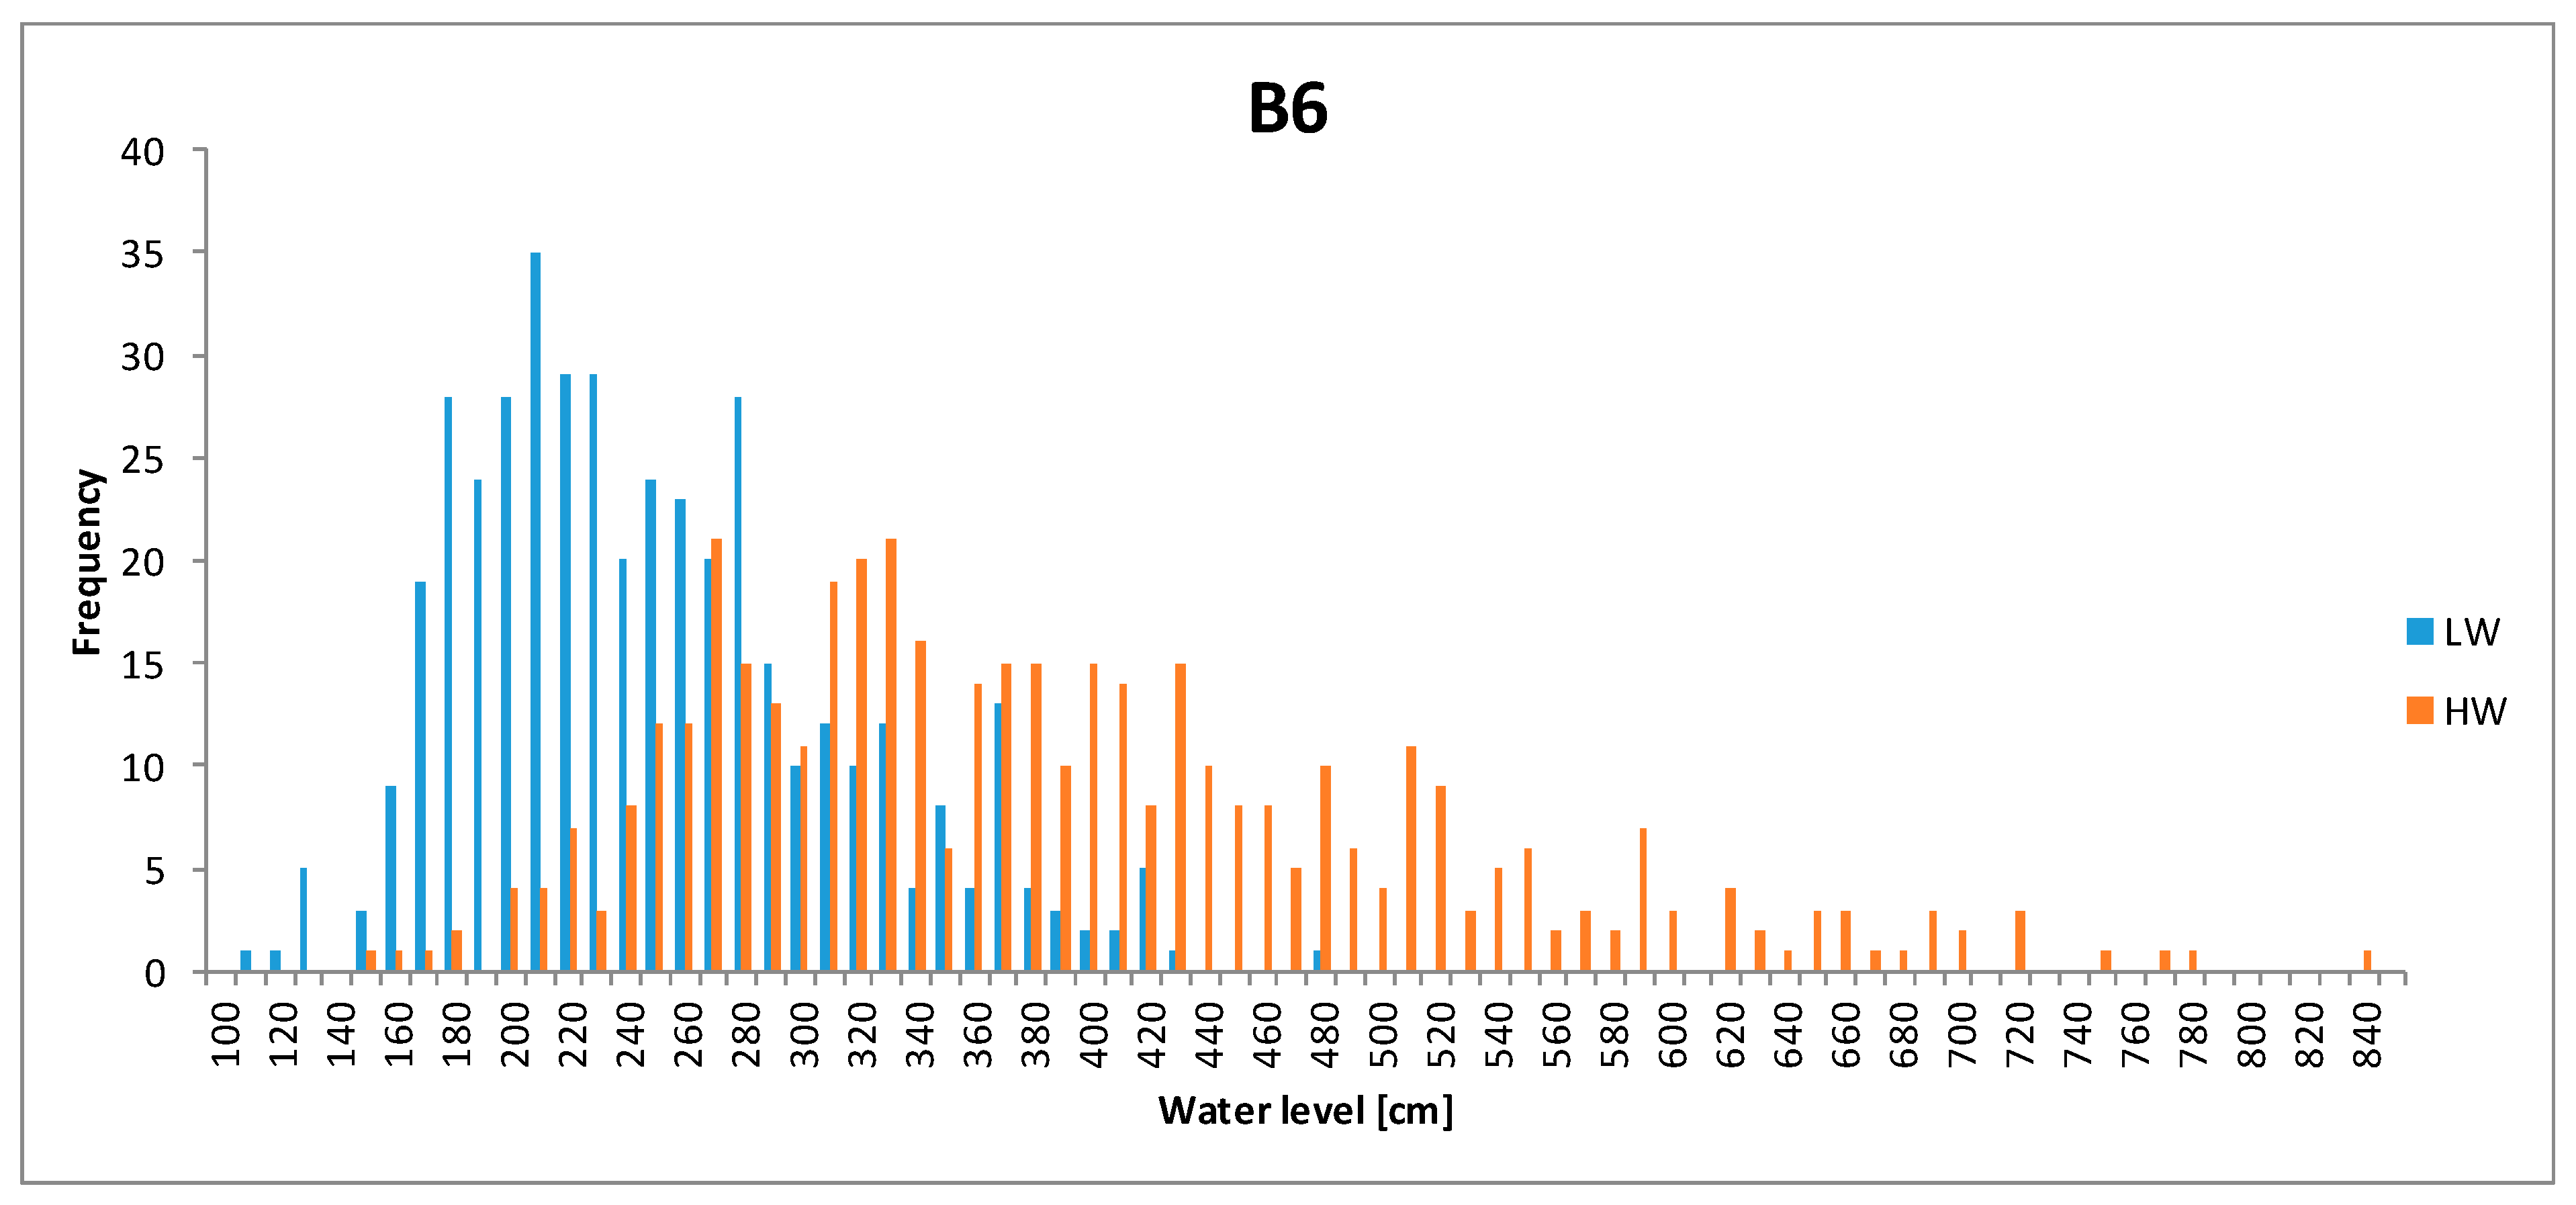
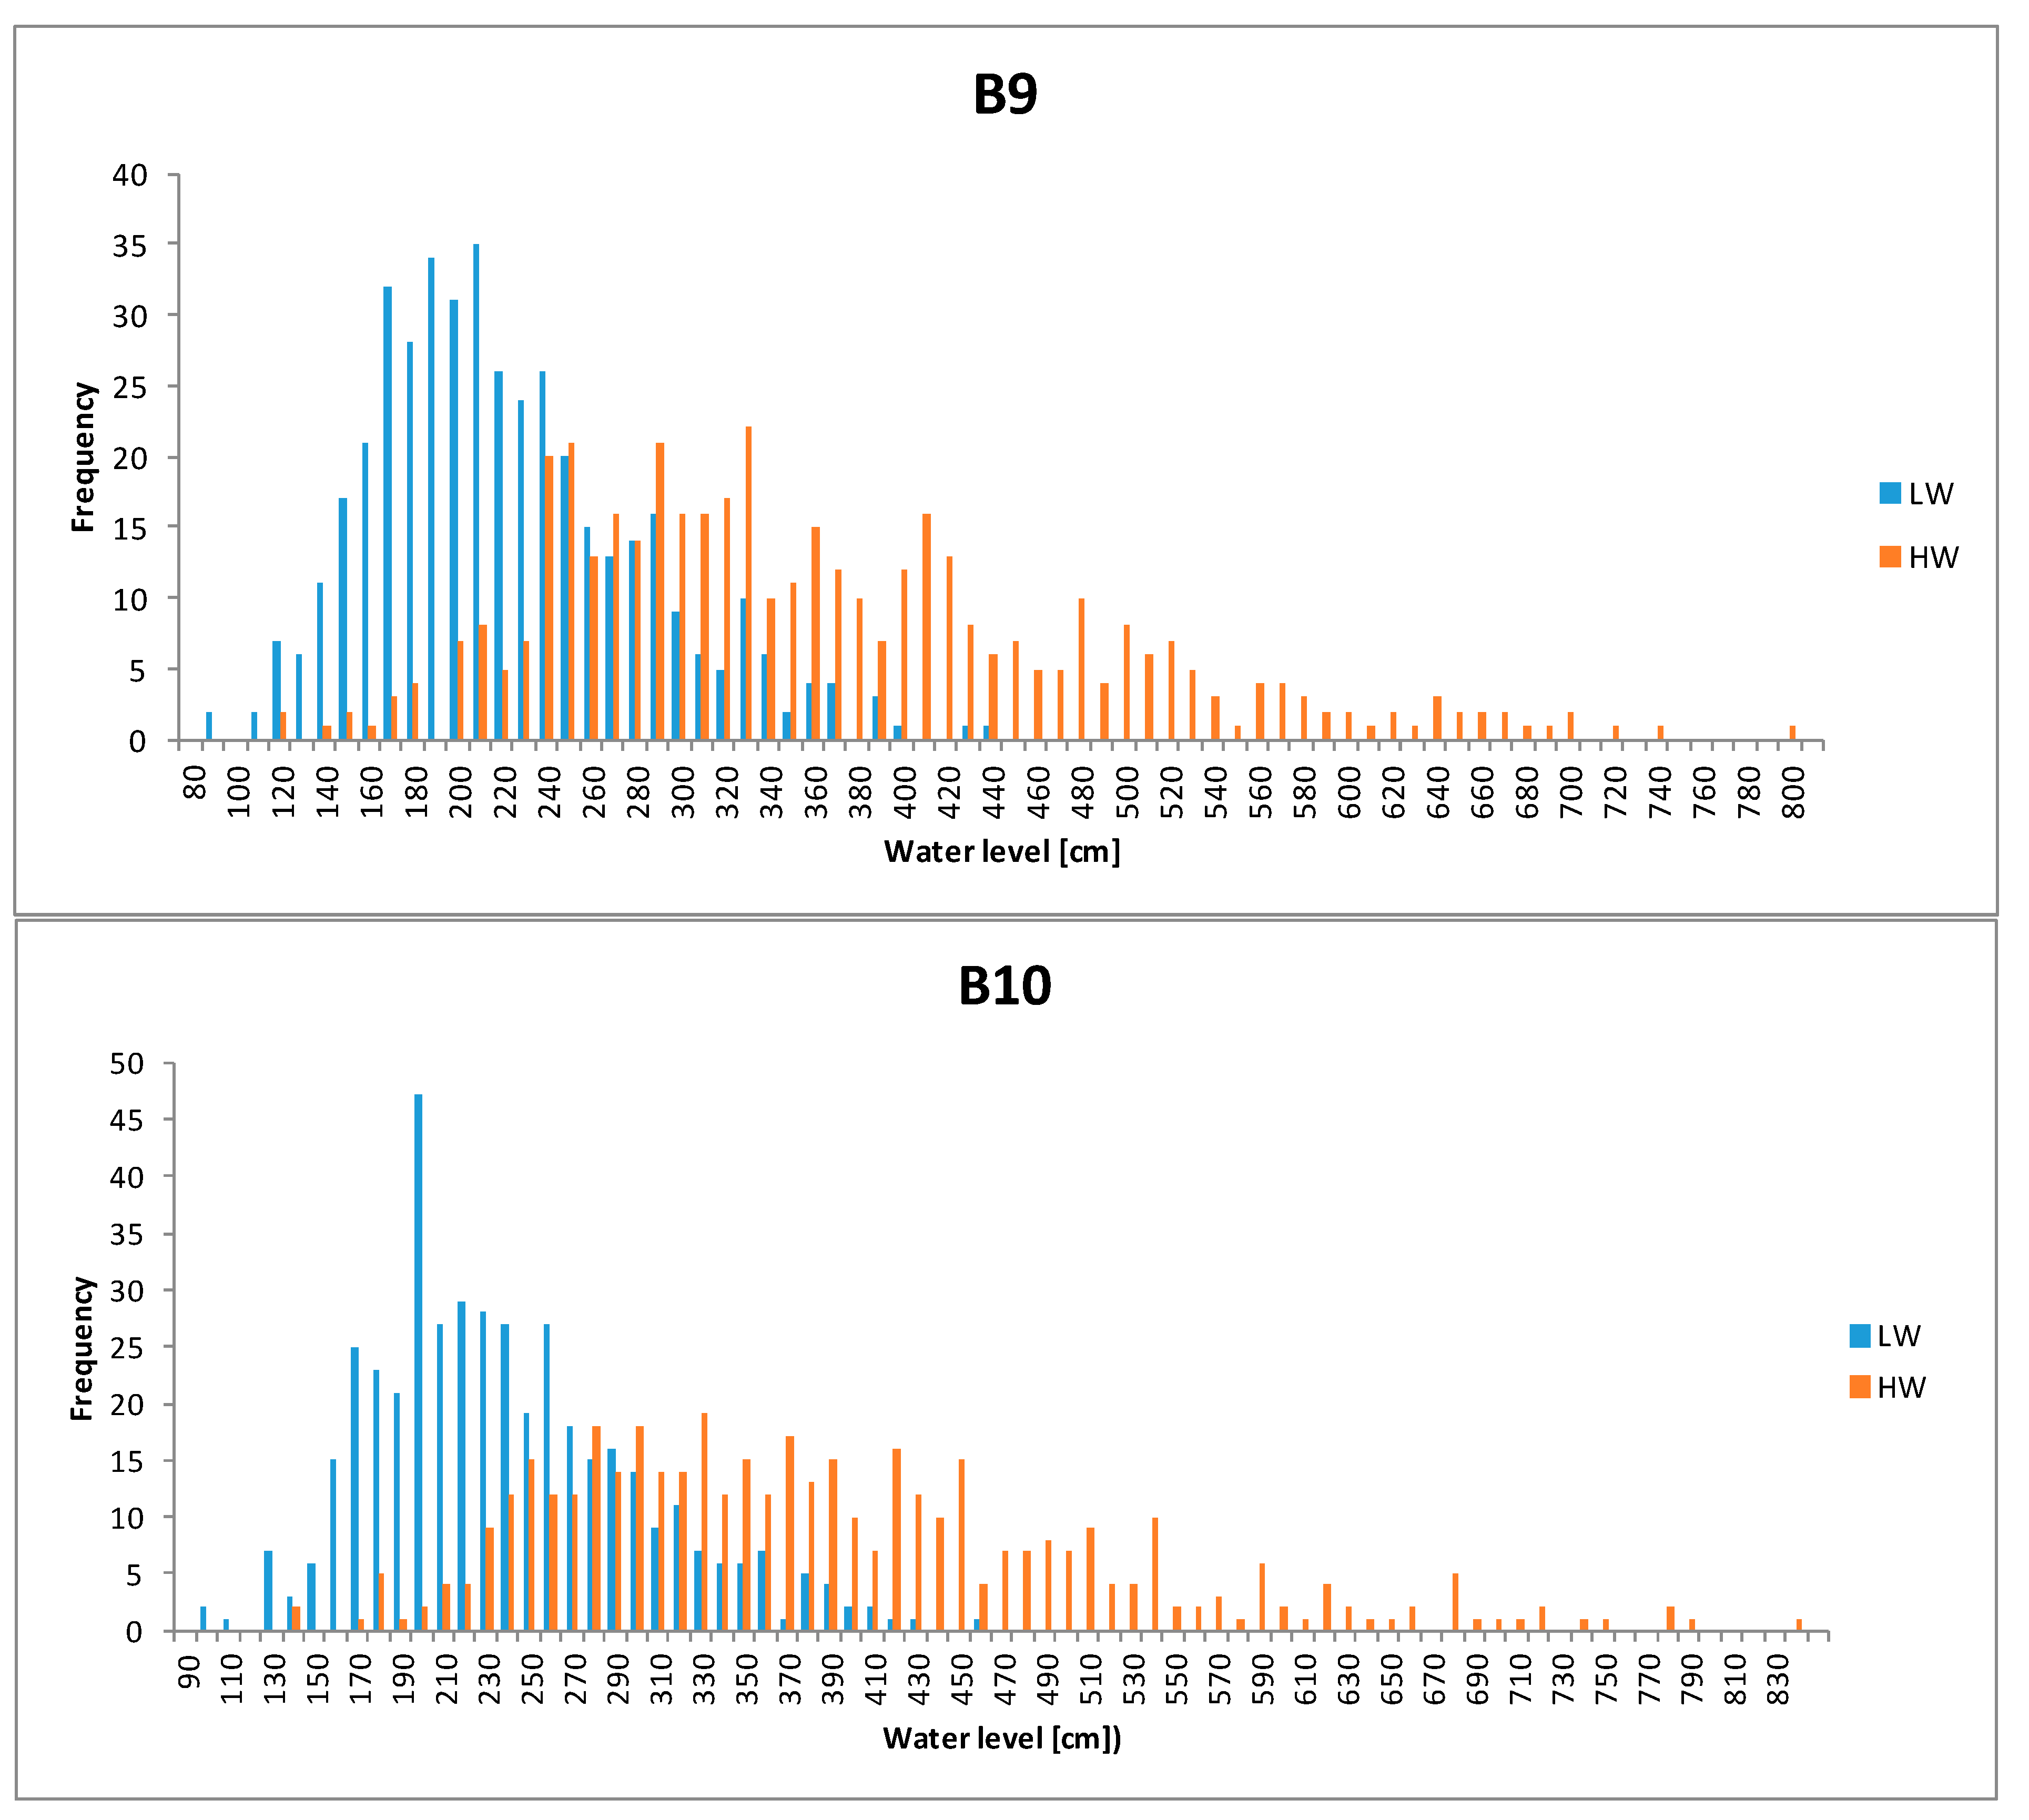
3.2. The Water Level Range Limit Values

| Bridge ID | Bridge Location | High Water Level (HWL) Limit Value in m a.s.l. | Low Water Level (LWL) Limit Value in m a.s.l. | HWL-LWL | |
|---|---|---|---|---|---|
| name | km | ||||
| B0 | Kiezmark S7 | 930.01 | 1.85 | −2.75 | 3.90 |
| B1 | Kiezmark | 929.95 | 1.15 | −0.90 | 2.05 |
| B2 | Tczew1 | 908.54 | 6.34 | 1.65 | 4.69 |
| B3 | Tczew2 | 908.51 | 6.00 | 2.63 | 3.37 |
| B4 | Knybawa | 903.86 | 8.14 | 2.63 | 5.51 |
| B5 | Korzeniewo | 868.25 | 20.13 | 10.20 | 9.93 |
| B6 | Grudziądz | 834.04 | 18.71 | 16.33 | 2.38 |
| B7 | Nowe Marzy | 827.86 | 20.63 | 16.33 | 4.30 |
| B8 | Chełmno | 807.59 | 26.38 | 21.20 | 5.18 |
| B9 | Fordon | 774.81 | 29.71 | 26.90 | 2.81 |
| B10 | Toruń1 | 735.00 | 36.77 | 34.40 | 2.37 |
| B11 | Toruń2 | 733.63 | 39.45 | 31.33 | 8.12 |
| B12 | Toruń3 | 731.34 | 41.04 | 32.40 | 8.64 |
| B13 | Brzoza Toruńska | 725.33 | 42.80 | 33.40 | 9.40 |
| B14 | Włocławek1 | 679.76 | 47.00 | 42.90 | 4.10 |
| B15 | Włocławek2 dam | 675.51 | 52.57 | 42.90 | 9.67 |
| B16 | Płock1 | 632.30 | 62.72 | 56.30 | 6.42 |
| B17 | Płock2 | 629.35 | 62.72 | 56.30 | 6.42 |
| B18 | Wyszogród | 589.10 | 71.58 | 62.64 | 8.94 |
| B19 | Modlin | 551.48 | 75.83 | 68.71 | 7.12 |
| B20 | Kazuń-Modlin | 549.02 | 72.14 | 68.71 | 3.43 |
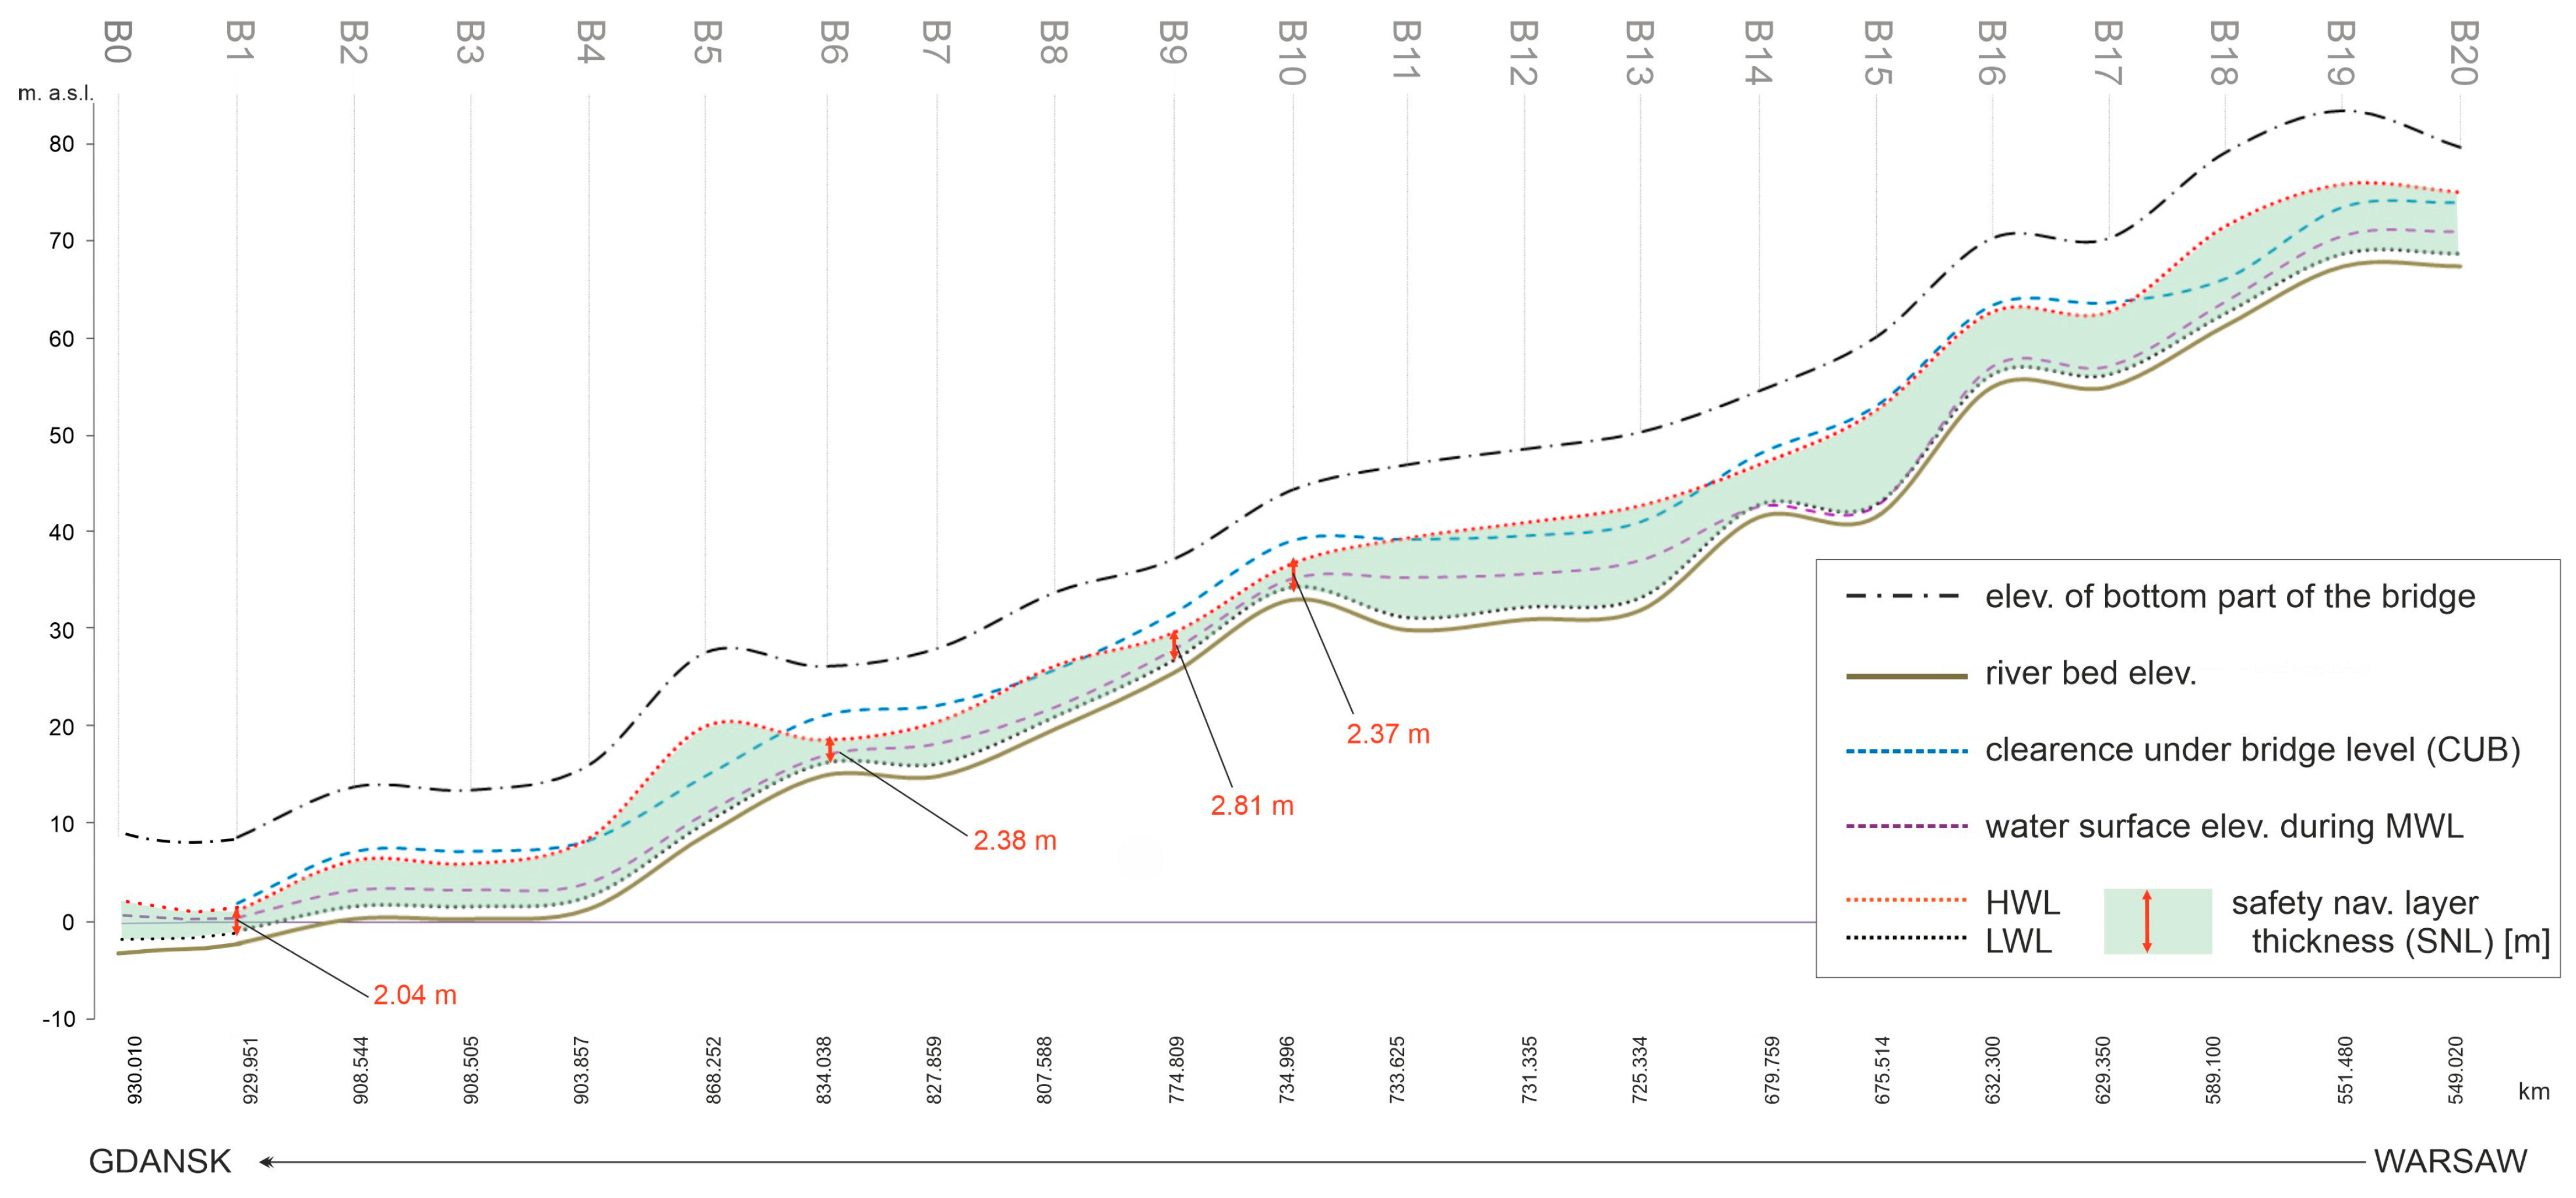
3.3. UKC Analysis
3.4. Other Hazards Associated with Navigation on the Vistula Waterway
4. Discussion
5. Conclusions
Author Contributions
Funding
Data Availability Statement
Conflicts of Interest
References
- Babiński, Z.; Habel, M. Hydromorphological conditions of the Lower Vistula in the development of navigation and hydropower. Acta Energetica 2013, 15, 91–101. [Google Scholar] [CrossRef] [Green Version]
- Ezzeldin, M.M.; Rageh, O.; Saad, M.I. Navigation Channel Problems due to sedimentation. In Proceedings of the International Maritime and Logistics Conference “Marlog 8”, Alexandria, Egypt, 17–19 March 2019; Available online: https://www.researchgate.net/publication/333812103_NAVIGATION_CHANNEL_PROBLEMS_DUE_TO_SEDIMENTATION (accessed on 10 November 2022).
- PIANC. Harbour Approach Channel Design Guidelines; Report No. 121-2014; PIANC: Brussel, Belgium, 2014. [Google Scholar]
- PIANC. Approach Channels. A Guide for Design; Final Report of the Joint PIANC-IAPH Working Group II-30 in Cooperation with IMPA and IALA; PIANC: Brussel, Belgium, 1997. [Google Scholar]
- de Vriend, H.J.; Havinga, H.; Visser, P.J.; Wang, Z.B. River Engineering; Lecture Notes CIE4345; TU Delft: Delft, The Netherlands, 2011; Available online: http://resolver.tudelft.nl/uuid:21fb76c9-930e-473a-a906-013537d5a5c0 (accessed on 22 November 2021).
- Jeszcze w tym Kwartale Rząd ma Przyjąć Dokument w Sprawie Intermodalu. Available online: https://www.rynekinfrastruktury.pl/wiadomosci/drogi/jeszcze-w-tym-kwartale-rzad-ma-przyjac-dokument-w-sprawie-intermodalu-78084.html (accessed on 12 October 2021).
- AGN—European Agreement on Main Inland Waterways of International Importance. Available online: https://www.parlament.gv.at/PAKT/VHG/XXIV/I/I_00681/imfname_184466.pdf (accessed on 12 December 2022).
- UNECE. Proceedings to Sessions of the UNECE Working Parties Concerned with Inland Navigation (SC.3 and SC.3/WP.3). Available online: https://unece.org/fileadmin/DAM/trans/main/sc3/SC3e_flyer.pdf (accessed on 12 December 2022).
- Gorączko, M.; Kubiak-Wójcicka, K. Waterways in Poland—The History, Present State and Future. In Management of Water Resources in Poland; Springer: Berlin/Heidelberg, Germany, 2021. [Google Scholar] [CrossRef]
- GUS—Inland Water Transport in Poland in 2021. Available online: https://stat.gov.pl/en/topics/transport-and-communications/transport/inland-water-transport-in-poland-in-2021,10,12.html (accessed on 12 December 2022).
- Chmieliński, M. Safety of Oversize Cargo in Ports and in the Sea Transport. TransNav Int. J. Mar. Navig. Saf. Sea Transp. 2017, 11, 151–157. [Google Scholar] [CrossRef] [Green Version]
- Gucma, L.; Schoeneich, M. Probabilistic Model of Underkeel Clearance in Decision Making Process of Port Captain. In TRANS’NAV 2007, Advances in Marine Navigation and Safety of Sea Transportation, Monograph; Weintrit, A., Ed.; The Nautical Institute: Gdynia, Poland, 2007. [Google Scholar]
- Galor, W. The Criterion of Safety Navigation Assessment in Sea-River Shipping. TransNav Int. J. Mar. Navig. Saf. Sea Transp. 2009, 3, 409–412. [Google Scholar]
- Jóźwiak, Z.; Bednarz, D. Logistic Conditionings in the International Transport of Oversized Cargo, Logistic Magazine t.2. 2010. Available online: https://www.logistyka.net.pl/bank-wiedzy/item/81450 (accessed on 15 October 2021).
- Galor, A.; Galor, W. Problems of domestic oversize cargo transport in aspect of carriage in South Baltic Region. In Proceedings of the VII Scientific and Technical Conference Logitrans, Logistics, Transport System, Safety in Transport, 2010; pp. 112–120. [Google Scholar]
- Petru, J.; Krivda, V. The Transport of Oversized Cargoes from the Perspective of Sustainable Transport Infrastructure in Cities. Sustainability 2021, 13, 5524. [Google Scholar] [CrossRef]
- Gołębiowski, C. Inland water transport in Poland. Transp. Res. Procedia 2016, 14, 223–232. [Google Scholar] [CrossRef] [Green Version]
- Schoeneich, M.; Habel, M.; Szatten, D. Limitation for Inland Ships in the Area of Planned Multimodal Port on Vistula River. Int. J. Mar. Navig. Saf. Sea Transp. 2020, 14, 551–555. [Google Scholar] [CrossRef]
- Krystek, R. The Integrated Transport Safety System. Saf. Water Transp. 2009, I, 334–335. [Google Scholar] [CrossRef] [Green Version]
- Rabant, H.; Habel, M.; Babiński, Z. Transport of Oversized Cargo on the Vistula River. Basic Parameters of the Waterway and Main Difficulties. Pr. Kom. Geogr. Komun. Pol. Tow. Geogr. 2016, 19, 7–17. [Google Scholar]
- Maintaining Safe Under Keel Clearance—Shallow Water Navigation Safety Guideline. Available online: http://www.shipsbusiness.com/shallow-water-navigation.html (accessed on 8 August 2021).
- Melnyk, O.; Malaksiano, M. Effectiveness Assessment of Non-Specialized Vessel Acquisition and Operation Projects, Considering Their Suitability for Oversized Cargo Transportation. Trans. Marit. Sci. 2020, 9, 23–34. [Google Scholar] [CrossRef] [Green Version]
- MSC.1/Circ.1498; Informative Material Related to the IMO/ILO/UNECE Code of Practice for Packing of Cargo Transport Units (CTU Code). IMO: London, UK, 2014.
- Ministerstwo Infrastruktury—Kierunki Rozwoju Transportu Intermodalnego do 2030 r. z Perspektywą do 2040 r. Available online: https://www.gov.pl/attachment/63382ca4-c027-4d00-9b03-99bbad9dbf1e (accessed on 10 November 2021).
- Strategia na Rzecz Odpowiedzialnego Rozwoju do Roku 2020 (z Perspektywą do 2030 r.) (The Strategy for Responsible Development for the Period up to 2020 (Including the Perspective up to 2030)). Warsaw, Poland, adopted by the Council of Ministers on 14 February 2017. Available online: https://www.gov.pl/web/ia/strategia-na-rzecz-odpowiedzialnego-rozwoju-do-roku-2020-z-perspektywa-do-2030-r--sor (accessed on 16 November 2022).
- Strategia Zrównoważonego Rozwoju Transportu do 2030 Roku (The Strategy for Sustainable Development of Transport for the Period up to 2030). Warsaw, Poland, adopted by the Council of Ministers on 24 September 2019. Available online: https://www.gov.pl/web/ia/strategia-zrownowazonego-rozwoju-transportu-do-2030-r-srt2030 (accessed on 16 November 2022).
- INE. Available online: https://www.inlandnavigation.eu/eu-topic/transport-by-water/ (accessed on 10 November 2022).
- Bolt, A.; Jerzyło, P. Determinants of inland navigation on the Vistula from Warsaw to Gdańsk. Acta Energetica 2013, 2, 56–63. [Google Scholar] [CrossRef]
- Habel, M.; Rabant, H.; Babiński, Z.; Szatten, D.; Marciniak, Ż.; Gierszewski, P. Determinants of locating multimodal port on the the lower Vistula River in the vicinity of Bydgoszcz. Logistyka Mag. 2014, 6, 4411–4420, ISSN 1231-5478. [Google Scholar]
- Studium Lokalizacji Platformy Multimodalnej. Available online: https://www.kujawsko-pomorskie.pl/pliki/2019/wspolpraca/20190325_emma/studium_lokalizacyjne_2.pdf (accessed on 10 November 2021).
- Szatten, D.; Habel, M.; Babiński, Z. Czynniki warunkujące żeglugę na Wiśle. Gospod. Wodna 2017, 11, 352–354. [Google Scholar]
- Szatten, D.; Habel, M.; Babiński, Z.; Schoeneich, M. Possibilities of inland waterway transport development on the Lower Vistula River from 2020–2030, considering River Basin Management Plans. Sci. J. Marit. Univ. Szczec. 2019, 59, 120–126. [Google Scholar] [CrossRef]
- Shen, H.T.; Bjedov, G.; Daly, S.F.; Lal, A.M. Numerical Model for Forecasting Ice Conditions on the Ohio River; Cold Regions Research and Engineering Laboratory: Hanover, NH, USA, 1991. [Google Scholar]
- AASHTO. Guide Specification and Commentary for Vessel Collision Design of Highway Bridges; Final Report; American Association of State Highway and Transportation Officials (AASHTO): Washington, DC, USA, 1991; Volume I. [Google Scholar]
- E DIN 1055-9; Einwirkungen auf Tragwerke, Teil 9: Ausergewöhnliche Einwirkungen. 2000. Available online: https://www.beuth.de/de/norm/din-1055-9/57085519 (accessed on 20 October 2021).
- ENV 1991–1; Eurocode 1, Basis of Design and Action on Structures, Part 1: Basis of Design. CEN/CS. 1994. Available online: https://eurocodes.jrc.ec.europa.eu/EN-Eurocodes/eurocode-1-actions-structures (accessed on 27 October 2021).
- Larsen, O.D. Ship Collision with Bridges—The Interaction between Vessel Traffic and Bridge Structures; International Association for Bridge and Structural Engineering (IABSE): Zurich, Switzerland, 1993. [Google Scholar]
- Gucma, L. Zarządzanie Ryzykiem w Rejonie Mostów Usytuowanych nad Drogami Wodnymi w Aspekcie Uderzenia Jednostek Pływających; Maritime University of Szczecin: Szczecin, Poland, 2013. [Google Scholar]
- Gucma, S.; Jagniszczak, I. Nawigacja Morska dla Kapitanów; Wydawnictwo Foka: Szczecin, Poland, 2006. [Google Scholar]
- O’Brien, T. Experience Using Underkeel Clearance Prediction Systems. In Proceedings of the 2nd IHMA Congress “Professionalism in Ports”, Dubai, United Arab Emirates, 28 April–3 May 2000. [Google Scholar]
- Moes, H. Probability and risk criteria for channel depth design and channel operation. In Proceedings of the PIANC International Navigation Seminar, Beijing, China, 26–30 May 2008. [Google Scholar]
- Robijns, T. Flow Beneath Inland Navigation Vessels; Delft University of Technology, Section Ports and Waterways: Delft, The Netherlands, 2014; Available online: https://repository.tudelft.nl/islandora/object/uuid:380ca986-dccd-469b-94f6-7e57940ced4f (accessed on 27 October 2021).
- Briggs, M.J.; Kopp, P.J.; Ankudinov, V.; Silver, A.L. Ship Squat Comparison and Validation Using PIANC, Ankudinov, and BNT Predictions. In Proceedings of the 2nd International Conference on Ship Maneuvering in Shallow and Confined Water: Ship to Ship Interactions, Trondheim, Norway, 18–20 May 2011; Volume 1. [Google Scholar]
- Mazurkiewicz, B. Morskie Budowle Hydrotechniczne Zalecenia do Projektowania i Wykonywania “Recommendations for Maritime Hydrotechnical Structures Design”; Fundacja Promocji Przemysłu Okrętowego i Gospodarki Morskiej: Gdansk, Poland, 2006; pp. 177–195. [Google Scholar]
- S44; IHO Standards for Hydrographic Surveys. IHO: Monte Carlo, Monaco, 2020. Available online: https://iho.int/uploads/user/pubs/standards/s-44/S-44_Edition_6.0.0_EN.pdf (accessed on 27 October 2021).
- Gucma, L. Probabilistic Monte Carlo method of determination safe underkeel clearance. In Proceedings of the XIV International Conference: The Role of Navigation in Support of Human Activity on the Sea, Gdynia, Poland, 2004. [Google Scholar]
- Gucma, S. Morskie Drogi Wodne Projektowanie i Eksploatacja w Ujęciu Inżynierii Ruchu; Fundacja Promocji Przemysłu Okrętowego i Gospodarki Morskiej: Gdansk, Poland, 2015; p. 392. [Google Scholar]
- Gucma, L. Risk Modelling of Ship Collisions Factors with Fixed Port and Offshore Structures. Maritime University of Szczecin: Szczecin, Poland, 2005. (In Polish) [Google Scholar]
- Schoeneich, M. Probabilistic Model of under-Keel Clearance Assessment as a Practical Tool for Ships’ Safety Determination in Existing and Designed Ports. In Proceedings of the First International Conference on Transportation Information and Safety (ICTIS), Wuhan, China, 30 June–2 July 2011. [Google Scholar] [CrossRef]
- Schoeneich, M. Modelling of ship’s draught measurement error for safety underkeel clerance determination. J. KONBiN 2008, 7, 165. [Google Scholar] [CrossRef]
- Gucma, S. Red. Określenie Dopuszczalnego Zanurzenia Statków Mogących Bezpiecznie Wchodzić do Portu Handlowego w Świnoujściu w Różnych Warunkach Hydrometeorologicznych; Praca Naukowo-Badawcza; Maritime University of Szczecin: Szczecin, Poland, 2004. [Google Scholar]
- Gucma, L.; Schoeneich, M. Określanie niepewności metod osiadania na podstawie badań rzeczywistych przeprowadzonych na promie m/f Jan Śniadecki w porcie Świnoujście. In Proceedings of the XV-th International Scientific and Technical Conference the Role of Navigation in Support of Human Activity on the Sea, Gdynia, Poland, 15–17 November 2006; pp. 135–145. [Google Scholar]
- Gourlay, T.P. Ship Underkeel Clearance in Waves. Proc. Coasts Ports 2007, 15, 1390. [Google Scholar]
- Arkuszewski, W. Wiślane Statki Pasażerskie XIX/XX Wieku; Ossolineum: Gdansk, Poland, 1973; p. 31. [Google Scholar]
- Wiśnicki, B. Determinants of river ports development into logistics trimodal nodes, illustrated by the ports of the Lower Vistula River. In Proceedings of the 2nd International Conference “Green Cities—Green Logistics for Greener Cities”, Szczecin, Poland, 2–3 March 2016; Volume 16, pp. 576–586. [Google Scholar]
- Uchwała nr 79 Rady Ministrów z Dnia 14 Czerwca 2016 r. w Sprawie Przyjęcia “Założeń do Planów Rozwoju Śródlądowych Dróg Wodnych w Polsce na Lata 2016–2020 z Perspektywą do Roku 2030” (M.P. 2016 poz. 711). Available online: https://eli.gov.pl/eli/MP/2016/711/ogl (accessed on 27 October 2021).
- Wojewódzka-Król, K.; Rolbiecki, R. Polityka Rozwoju Transportu, 1st ed.; Wydawnictwo Uniwersytetu Gdańskiego: Gdansk, Poland, 2012. [Google Scholar]
- Zhang, R.; Huang, C.; Feng, X. Empty container repositioning with foldable containers in a river transport network considering the limitations of bridge heights. Transp. Res. Part A Policy Pract. 2020, 133, 197–213. [Google Scholar] [CrossRef]
- Zhang, S.; Jing, Z.; Li, W.; Wang, L.; Liu, D.; Wang, T. Navigation risk assessment method based on flow conditions: A case study of the river reach between the Three Gorges Dam and the Gezhouba Dam. Ocean. Eng. 2019, 175, 71–79. [Google Scholar] [CrossRef]
- Habel, M. Dynamics of the Vistula River Channel Deformations Downstream of Włocławek Reservoir; Uniwersytet Kazimierza Wielkiego: Bydgoszcz, Poland, 2013; p. 144. [Google Scholar]
- Babiński, Z. Wpływ Zapór na Procesy Korytowe rzek Aluwialnych ze Szczególnym Uwzględnieniem Zbiornika Włocławskiego; Wyd. Akademii Bydgoskiej im; Kazimierza Wielkiego: Bydgoszcz, Poland, 2002. [Google Scholar]
- Hendrickx, C.; Breemersch, T. The effect of climate change on inland waterway transport. Transport Research Arena-Europe 2012. Proc.–Soc. Behav. Sci. 2012, 48, 1837–1847. [Google Scholar] [CrossRef] [Green Version]
- Vantorre, M.; Eloot, K.; Delefortrie, G.; Lataire, E.; Candries, M.; Verwilligen, J. Maneuvering in shallow and confined water. In Encyclopedia of Maritime and Offshore Engineering; John Wiley & Sons, Ltd.: Hoboken, NJ, USA, 2017. [Google Scholar]
- Durajczyk, P.; Drop, N. Possibilities of Using Inland Navigation to Improve Efficiency of Urban and Interurban Freight Transport with the Use of the River Information Services (RIS) System—Case Study. Energies 2021, 14, 7086. [Google Scholar] [CrossRef]
- Kamal, N.; Sadek, N. Evaluating and analyzing navigation efficiency for the River Nile (Case study: Ensa-Naga Hamady reach). Ain Shams Eng. J. 2018, 9, 2649–2669. [Google Scholar] [CrossRef]
- Jiang, D.; Wu, B.; Cheng, Z.; Xue, J.; van Gelder, P.H.A.J.M. Towards a probabilistic model for estimation of grounding accidents in fluctuating backwater zone of the Three Gorges Reservoir. Reliab. Eng. Syst. Saf. 2021, 205, 107239. [Google Scholar] [CrossRef]
- Scholten, A.; Rothstein, B. Navigation on the Danube—Limitations by Low Water Levels and Their Impacts; JRC Technical Reports; European Commission: Brussels, Belgium, 2016; ISBN 978-92-79-64798-7. [Google Scholar] [CrossRef]
- Glazik, R.; Grześ, M. Stopień wodny “Włocławek”—wybrane zagadnienia badawcze i eksploatacyjne. In Proceedings of the Scientific and Technical Conference, “Exploitation and Influence of Big Lowland Reservoirs for example Jeziorsko Reservoir”, Uniejów, Poland, 20–21 May 1999. [Google Scholar]
- Jonkeren, O.; Rietveld, P.; van Ommeren, J. Climate change and inland waterway transport—Welfare effects of low water levels on the river Rhine. J. Transp. Econ. Policy 2007, 41, 387–411. [Google Scholar]
- Mako, P.; Dávid, A.; Böhm, P.; Savu, S. Sustainable Transport in the Danube Region. Sustainability 2021, 13, 6797. [Google Scholar] [CrossRef]


| No. | Gauging Station in Warsaw | Kilometrage of River [km] | Elevation of “0” [m a.s.l.] | Mean Water Level (MWL) [cm] | Official Clearance under the Bridge [cm] |
|---|---|---|---|---|---|
| 1 | Przegalina LW | 936.0 | −5.06 | 529 | 700 |
| 2 | Gdańska Głowa | 931.2 | −5.06 | 552 | 700 |
| 3 | Tczew | 908.6 | −0.58 | 386 | 830 |
| 4 | Montowski headland (Biała Góra) | 886.4 | 4.62 | 264 | 740 |
| 5 | Korzeniewo | 867.0 | 7.91 | 325 | 730 |
| 6 | Grudziądz | 835.0 | 13.81 | 327 | 720 |
| 7 | Chełmno | 806.8 | 18.96 | 319 | 720 |
| 8 | Fordon | 774.9 | 24.74 | 325 | 700 |
| 9 | Toruń | 734.7 | 31.98 | 326 | 720 |
| 10 | Włocławek | 675.0 | 41.17 | 153 | 691 |
| 11 | Włocławek dam HW | 672.0 | 42.00 | 153 | 691 |
| 12 | Włocławek dam HW | 672.0 | 55.00 | 220 | 691 |
| 13 | Płock | 634.0 | 56.40 | 326 | 700 |
| 14 | Kępa Polska | 606.5 | 57.25 | 269 | 700 |
| 15 | Wyszogród | 586.9 | 60.28 | 355 | 588 |
| 16 | Modlin | 551.5 | 66.51 | 405 | 700 |
| 17 | Warszawa (harbour) | 513.3 | 76.08 | 237 | 700 |
| 1 | 2 | 3 | 4 | 5 | 6 | 7 |
|---|---|---|---|---|---|---|
| Bridge | Name | Kilometrage of River [km] | Established Clearance under the Bridge * [m] | Elevation for River Bottom [m a s.l.] | Elevation for Established Clearance under the Bridge [m a.s.l.] | Elevation of the Construction Floor [m a.s.l.] ** |
| B0 | Kiezmark S7 | 930.01 | - | −4.05 | - | 9.40 |
| B1 | Kiezmark | 929.95 | 6.79 | −2.20 | 1.94 | 8.73 |
| B2 | Tczew1 | 908.54 | 7.50 | 0.35 | 7.27 | 13.92 |
| B3 | Tczew2 | 908.51 | 7.16 | 1.33 | 7.29 | 13.58 |
| B4 | Knybawa | 903.86 | 9.70 | 1.33 | 8.38 | 16.12 |
| B5 | Korzeniewo | 868.25 | 12.50 | 8.90 | 15.01 | 27.71 |
| B6 | Grudziądz | 834.04 | 5.28 | 15.03 | 21.20 | 26.29 |
| B7 | Nowe Marzy | 827.86 | 7.20 | 15.03 | 22.31 | 28.21 |
| B8 | Chełmno | 807.59 | 7.80 | 19.90 | 25.98 | 33.96 |
| B9 | Fordon | 774.81 | 5.55 | 25.60 | 31.74 | 37.29 |
| B10 | Toruń1 | 735.00 | 5.17 | 33.10 | 39.15 | 44.35 |
| B11 | Toruń2 | 733.63 | 7.85 | 30.03 | 39.33 | 47.03 |
| B12 | Toruń3 | 731.34 | 9.44 | 31.10 | 39.72 | 48.62 |
| B13 | Brzoza | 725.33 | 11.20 | 32.10 | 41.16 | 50.38 |
| B14 | Włocławek1 | 679.76 | 6.48 | 41.60 | 48.08 | 54.56 |
| B15 | Włocławek2 | 675.51 | 12.00 | 41.60 | 53.00 | 60.08 |
| B16 | Płock1 | 632.30 | 6.90 | 55.00 | 63.40 | 70.30 |
| B17 | Płock2 | 629.35 | 6.90 | 55.00 | 63.67 | 70.30 |
| B18 | Wyszogród | 589.10 | 13.00 | 61.34 | 66.17 | 79.16 |
| B19 | Modlin | 551.48 | 9.90 | 67.41 | 73.51 | 83.41 |
| B20 | Kazuń-Modlin | 549.02 | 6.13 | 67.41 | 73.96 | 79.64 |
| Bridge | Water Level | % of Days in the Period 1981–2016 | Average Number of Days | % Days on Average | |||
|---|---|---|---|---|---|---|---|
| Entire Period | Winter Months | Entire Year | Winter Months | Entire Year | Winter Months | ||
| B6 | <LWL | 33.3 | 18.2 | 124.9 | 68.3 | 34.2 | 37.94 |
| >HWL | 4.8 | 2.3 | 18.1 | 8.5 | 4.9 | 6.3 | |
| B9 | <LWL | 28.0 | 17.02 | 102.3 | 62.11 | 28.02 | 34.5 |
| >HWL | 2.6 | 0.71 | 8.7 | 2.6 | 2.38 | 1.44 | |
| B10 | <LWL | 27.2 | 14.8 | 99.4 | 26.8 | 27.2 | 14.8 |
| >HWL | 4.0 | 6.1 | 14.8 | 11.0 | 4.0 | 6.1 | |
| B11 | <LWL | 27.2 | 14.8 | 99.4 | 26.8 | 27.2 | 14.8 |
| >HWL | 0.14 | 0.08 | 0.5 | 0.14 | 0.1 | 0.1 | |
| B12 | <LWL | 27.2 | 14.8 | 99.4 | 26.8 | 27.2 | 14.8 |
| >HWL | 0.14 | 0.08 | 0.5 | 0.14 | 0.1 | 0.1 | |
| Method | UKC Value [m] | |||
|---|---|---|---|---|
| B1 | B6 | B9 | B10 | |
| Minimal required UKC | ||||
| 1.529 | 1.935 | 1.844 | 1.939 |
| 1.069 | 1.276 | 1.285 | 1.28 |
| Operating UKC | ||||
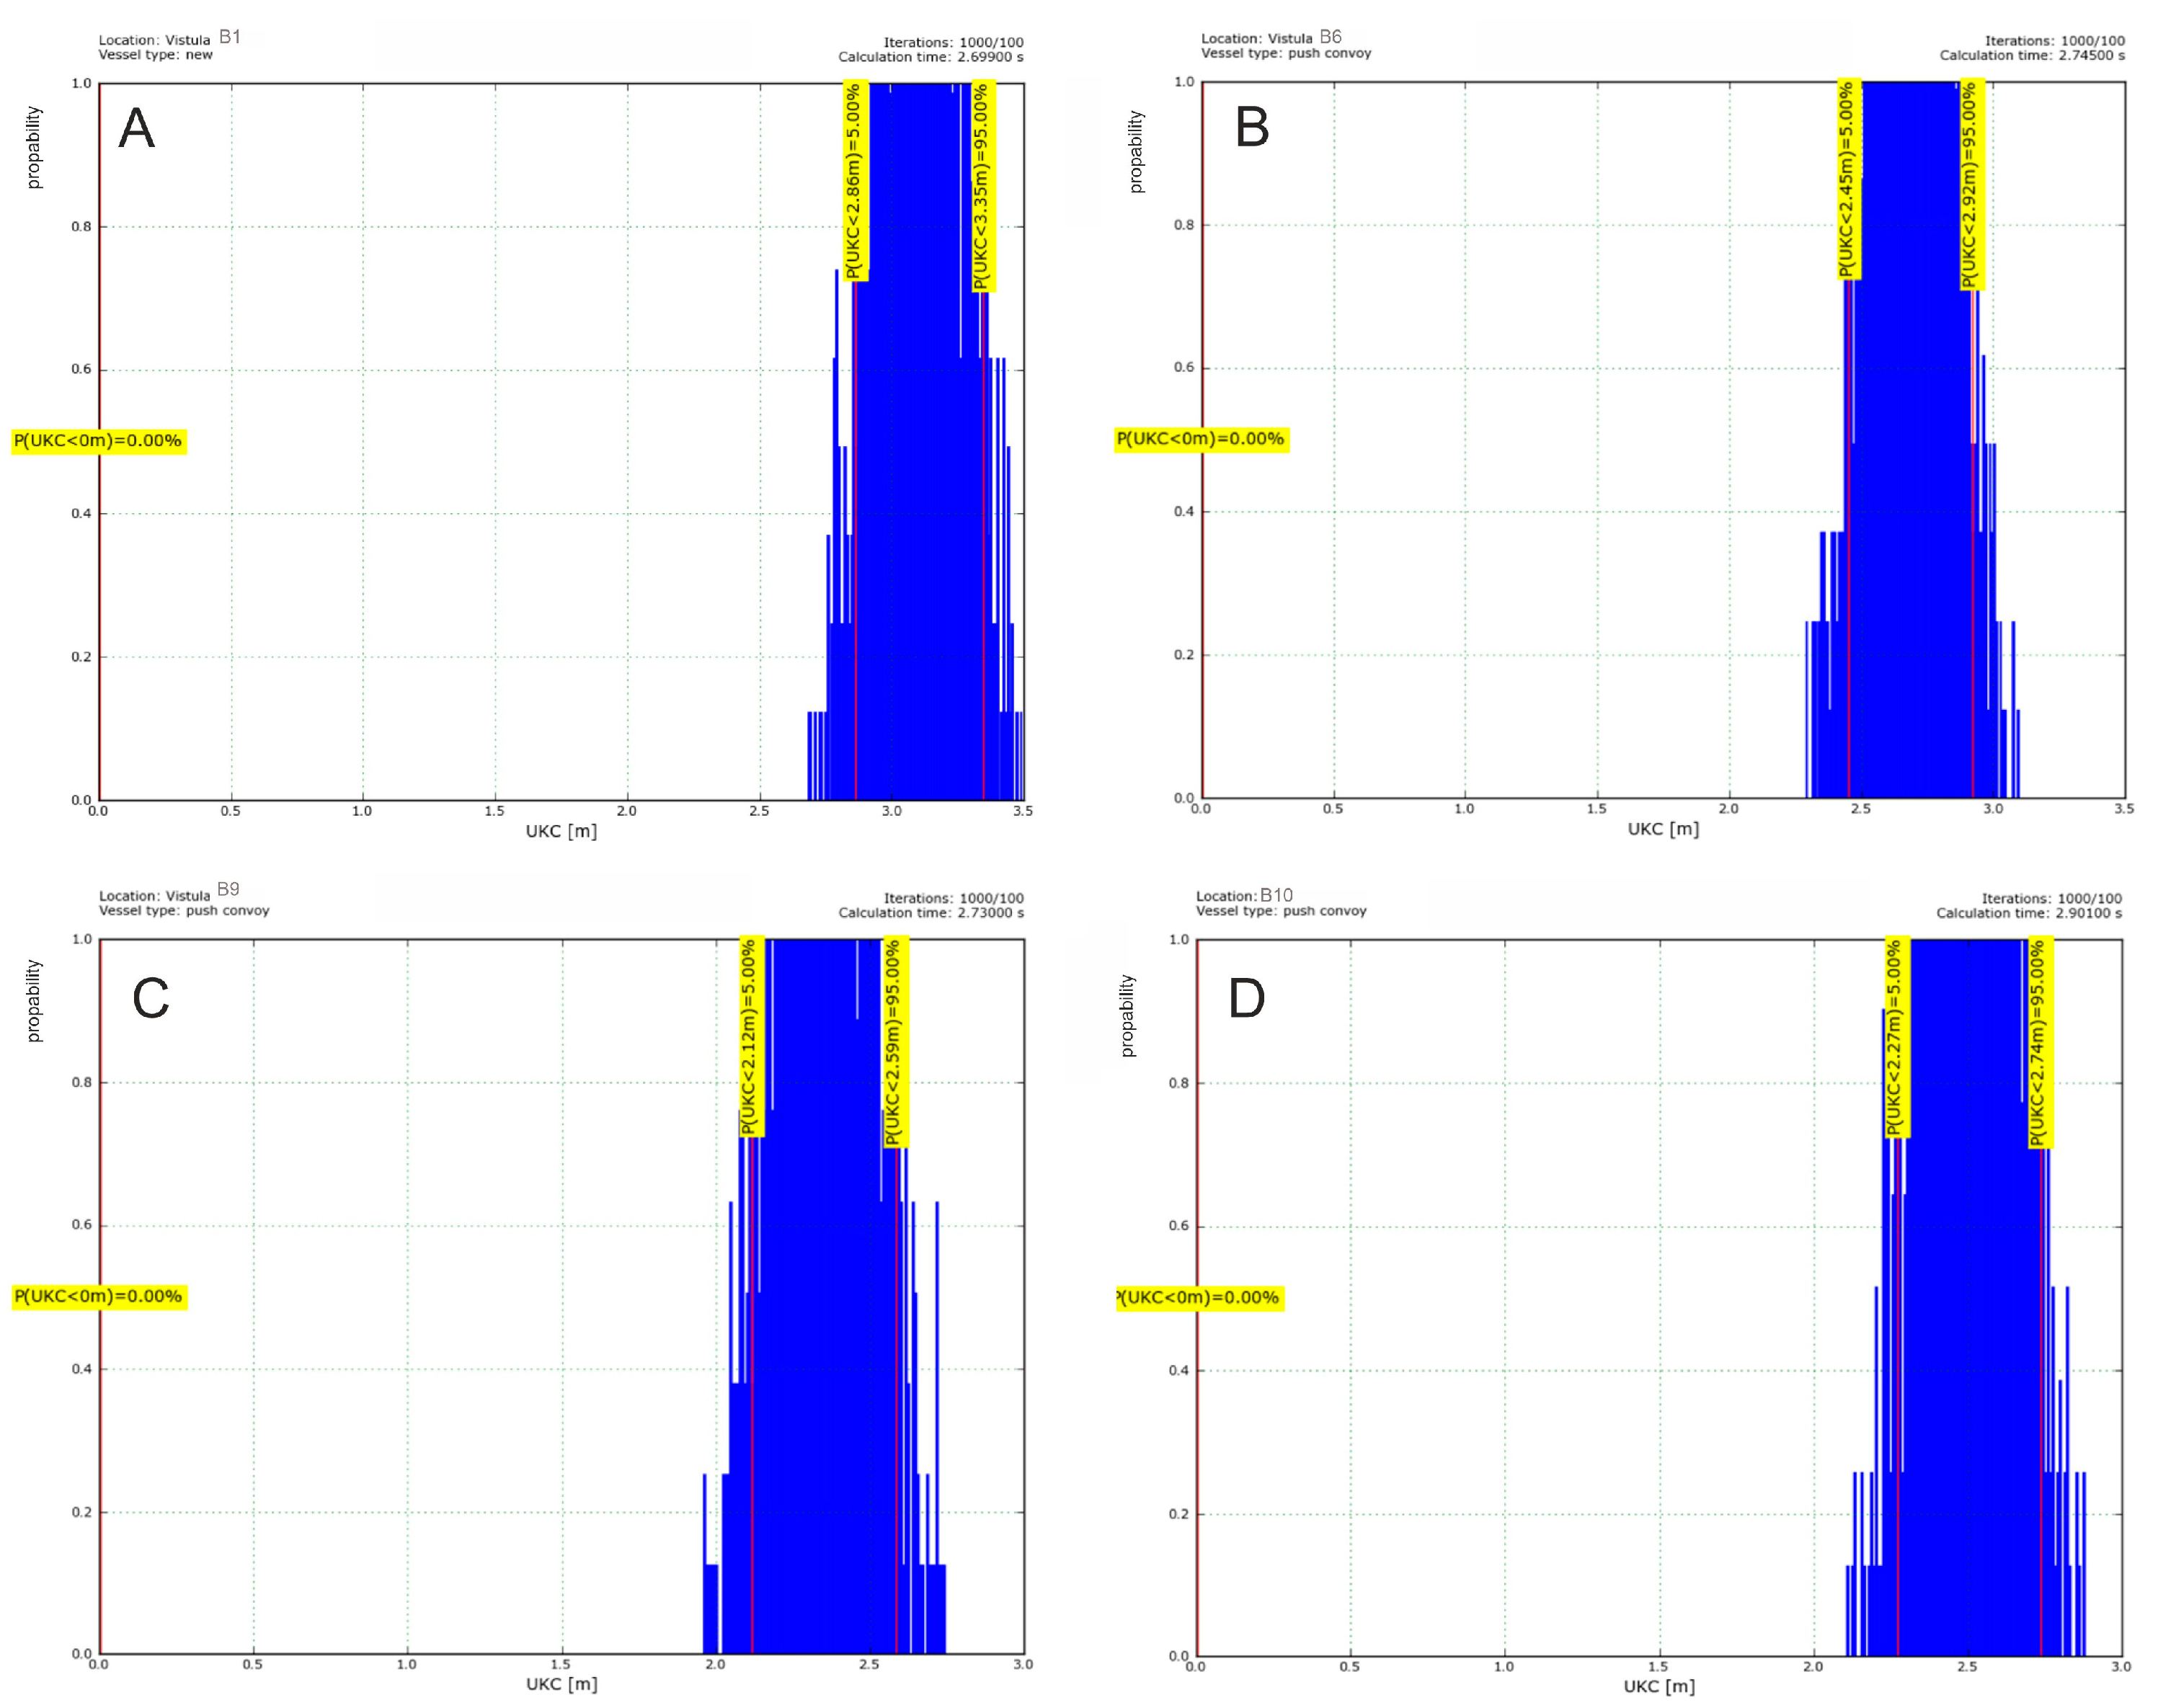
| Probabilistic Method | 3.1 | 2.7 | 2.35 | 2.5 |
| Simulation Results | Calculated Values for the Cross Profile | |||
|---|---|---|---|---|
| B1 | B6 | B9 | B10 | |
| P(UKC < 0) | 0.0 | 0.0 | 0.0 | 0.0 |
| Mean squat | 3.1 m | 2.7 m | 2.35 m | 2.5 m |
| Constant UKC component method | 1.22 m | 1.22 m | 1.22 m | 1.22 m |
| 5% UKC percentile | 2.86 m | 2.45 m | 2.12 m | 2.27 m |
| 95% UKC percentile | 3.35 m | 2.92 m | 2.59 m | 2.74 m |
| Type of Event | Occurrence of the Event with the Probability (in %) | ||||
|---|---|---|---|---|---|
| November | December | January | February | March | |
| Pancake ice | 14 | 50 | 52 | 40 | 16 |
| Bank ice | 0 | 11 | 20 | 18 | 7 |
| Ice cover | 0 | 2 | 25 (99 *) | 24 (99 *) | 25 |
| Ice floe | 0 | 2 | 11 | 18 | 16 |
Disclaimer/Publisher’s Note: The statements, opinions and data contained in all publications are solely those of the individual author(s) and contributor(s) and not of MDPI and/or the editor(s). MDPI and/or the editor(s) disclaim responsibility for any injury to people or property resulting from any ideas, methods, instructions or products referred to in the content. |
© 2022 by the authors. Licensee MDPI, Basel, Switzerland. This article is an open access article distributed under the terms and conditions of the Creative Commons Attribution (CC BY) license (https://creativecommons.org/licenses/by/4.0/).
Share and Cite
Schoeneich, M.; Habel, M.; Szatten, D.; Absalon, D.; Montewka, J. An Integrated Approach to an Assessment of Bottlenecks for Navigation on Riverine Waterways. Water 2023, 15, 141. https://doi.org/10.3390/w15010141
Schoeneich M, Habel M, Szatten D, Absalon D, Montewka J. An Integrated Approach to an Assessment of Bottlenecks for Navigation on Riverine Waterways. Water. 2023; 15(1):141. https://doi.org/10.3390/w15010141
Chicago/Turabian StyleSchoeneich, Marta, Michał Habel, Dawid Szatten, Damian Absalon, and Jakub Montewka. 2023. "An Integrated Approach to an Assessment of Bottlenecks for Navigation on Riverine Waterways" Water 15, no. 1: 141. https://doi.org/10.3390/w15010141
APA StyleSchoeneich, M., Habel, M., Szatten, D., Absalon, D., & Montewka, J. (2023). An Integrated Approach to an Assessment of Bottlenecks for Navigation on Riverine Waterways. Water, 15(1), 141. https://doi.org/10.3390/w15010141