

The Regulating Role of Meteorology in the Wetland-Air CO2 Fluxes at the Largest Shallow Grass-Type Lake on the North China Plain


Abstract
:1. Introduction
2. Methods
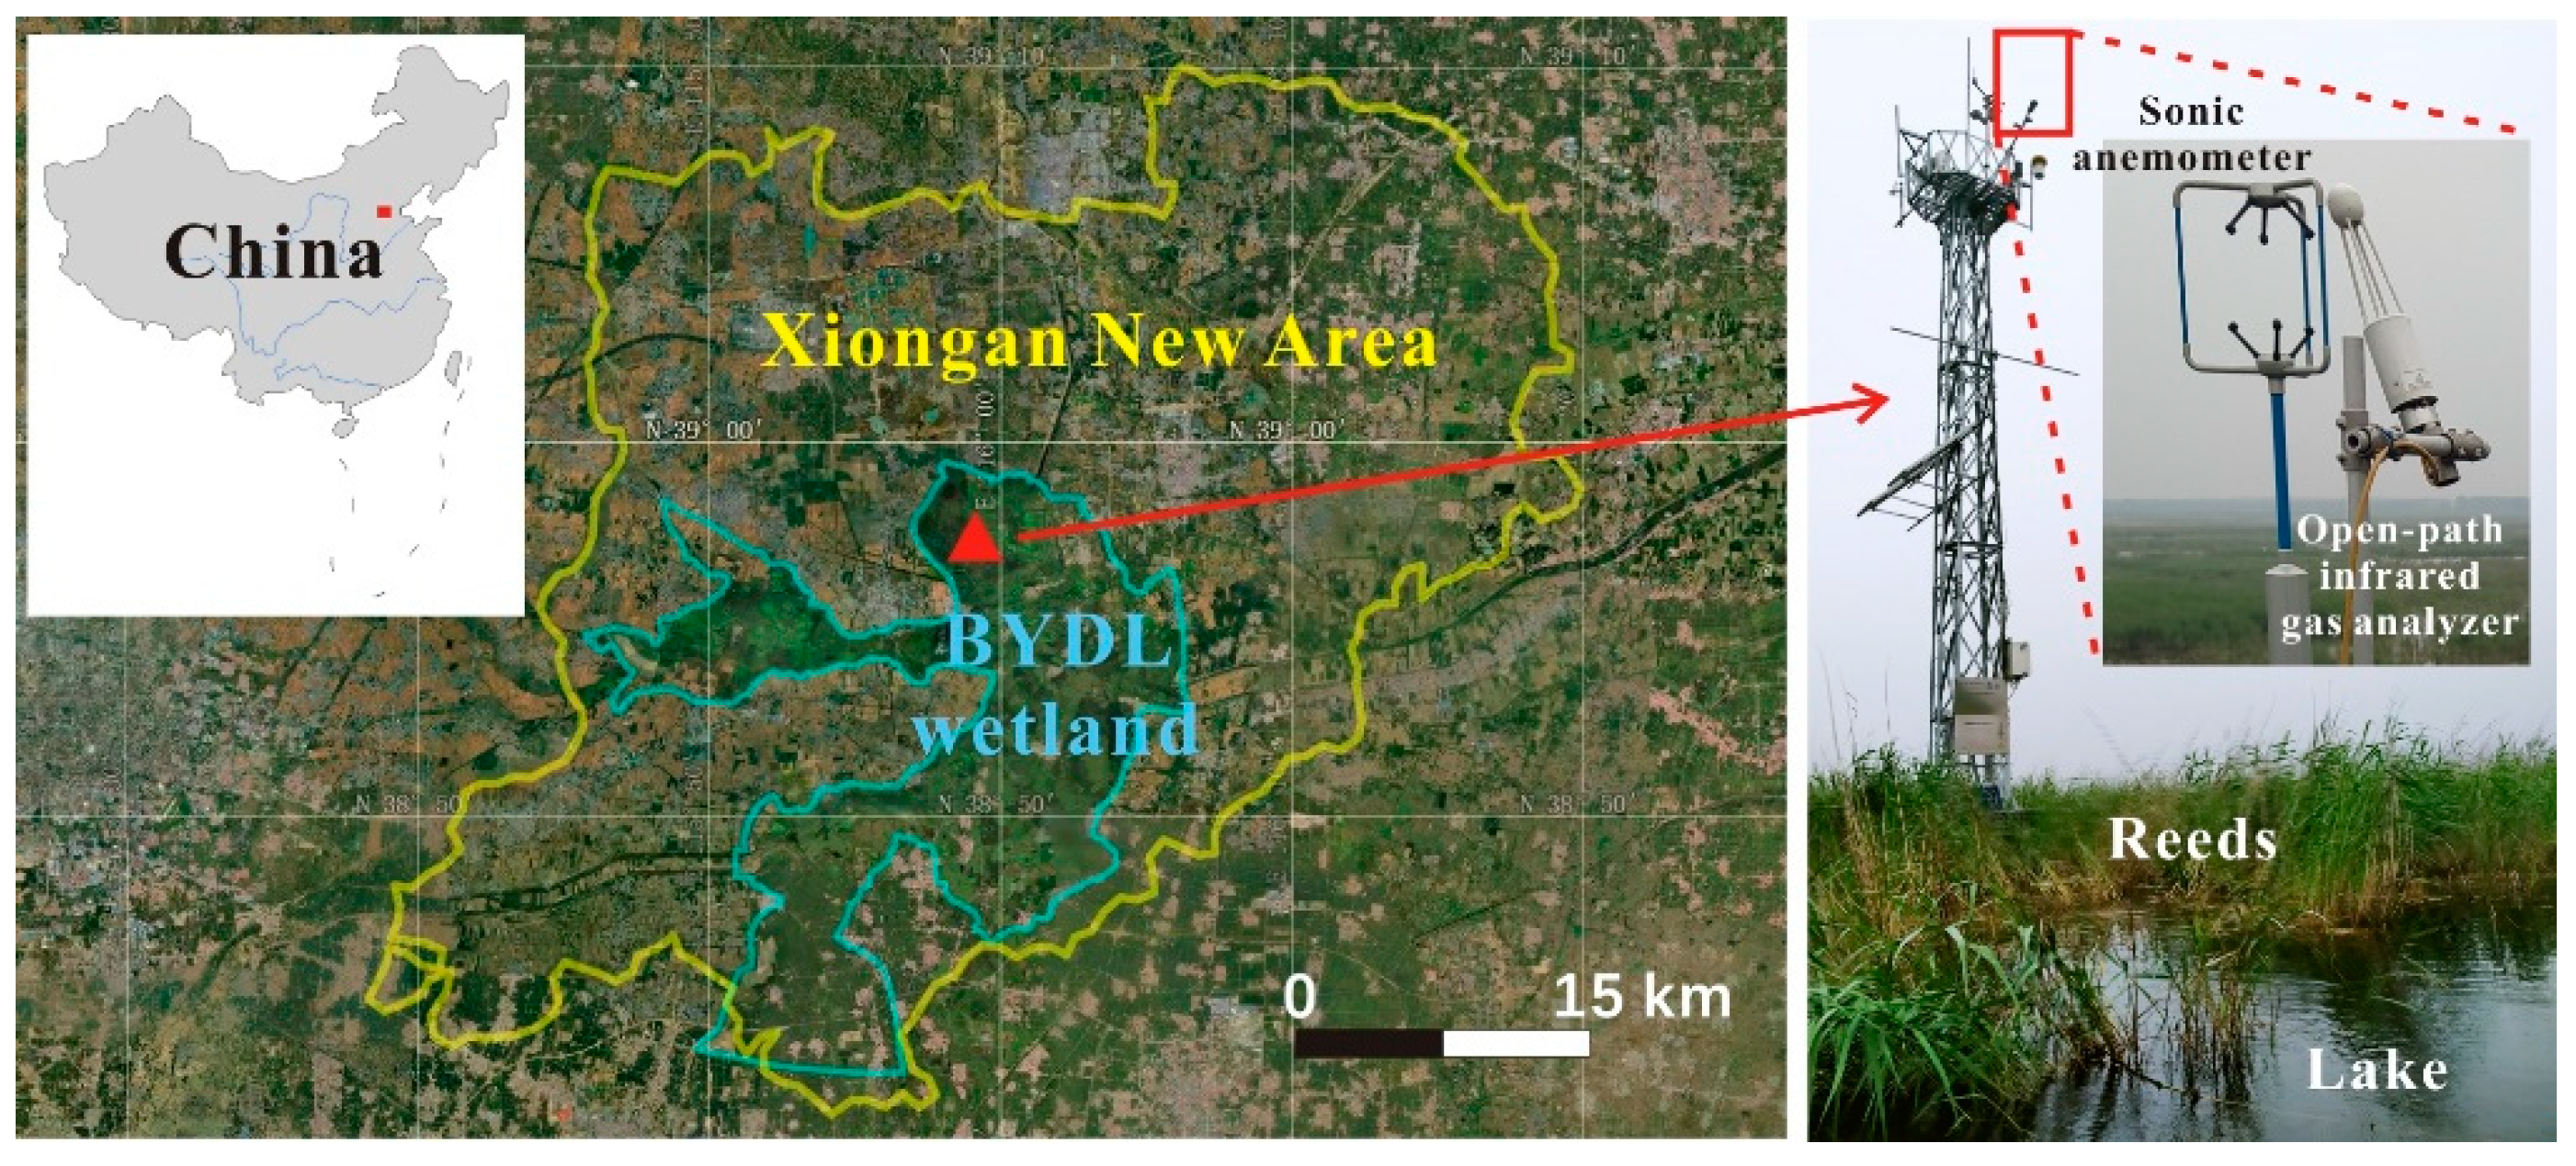
2.1. Study Site
2.2. In-Situ Monitoring of the Meteorological Data
2.3. Eddy Covariance Approach
2.4. Data Process and Correlation Analysis
3. Results
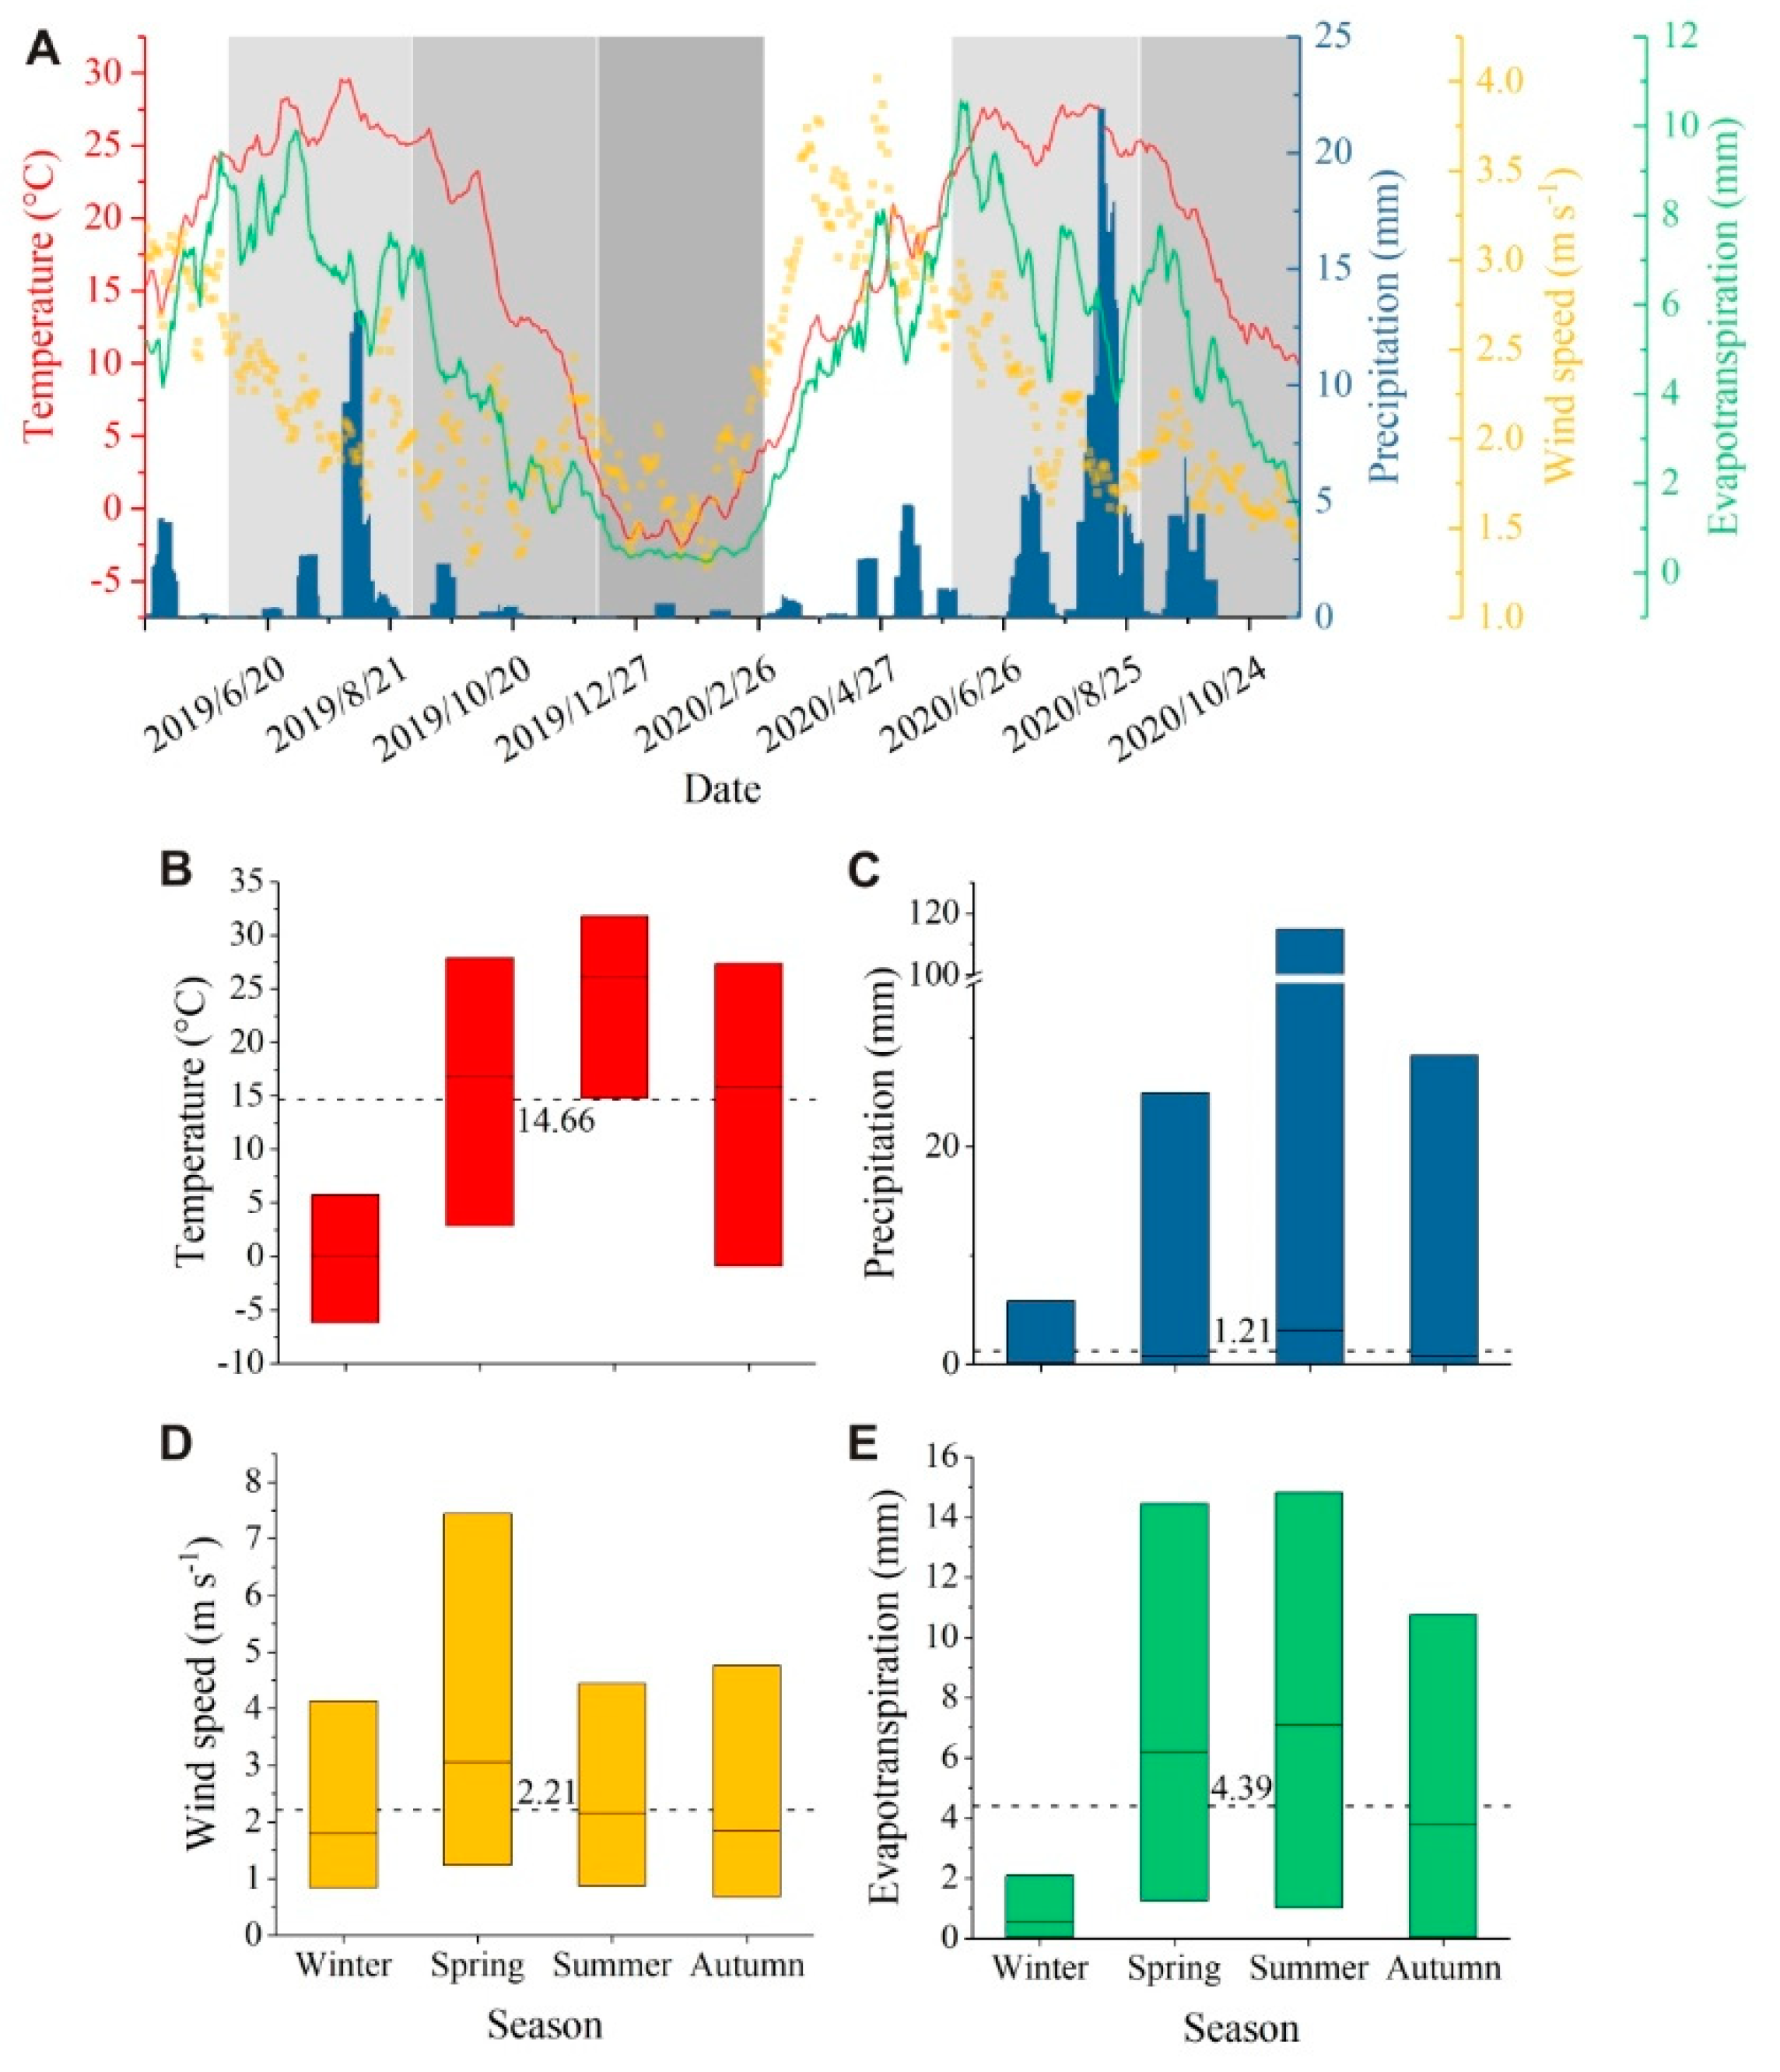
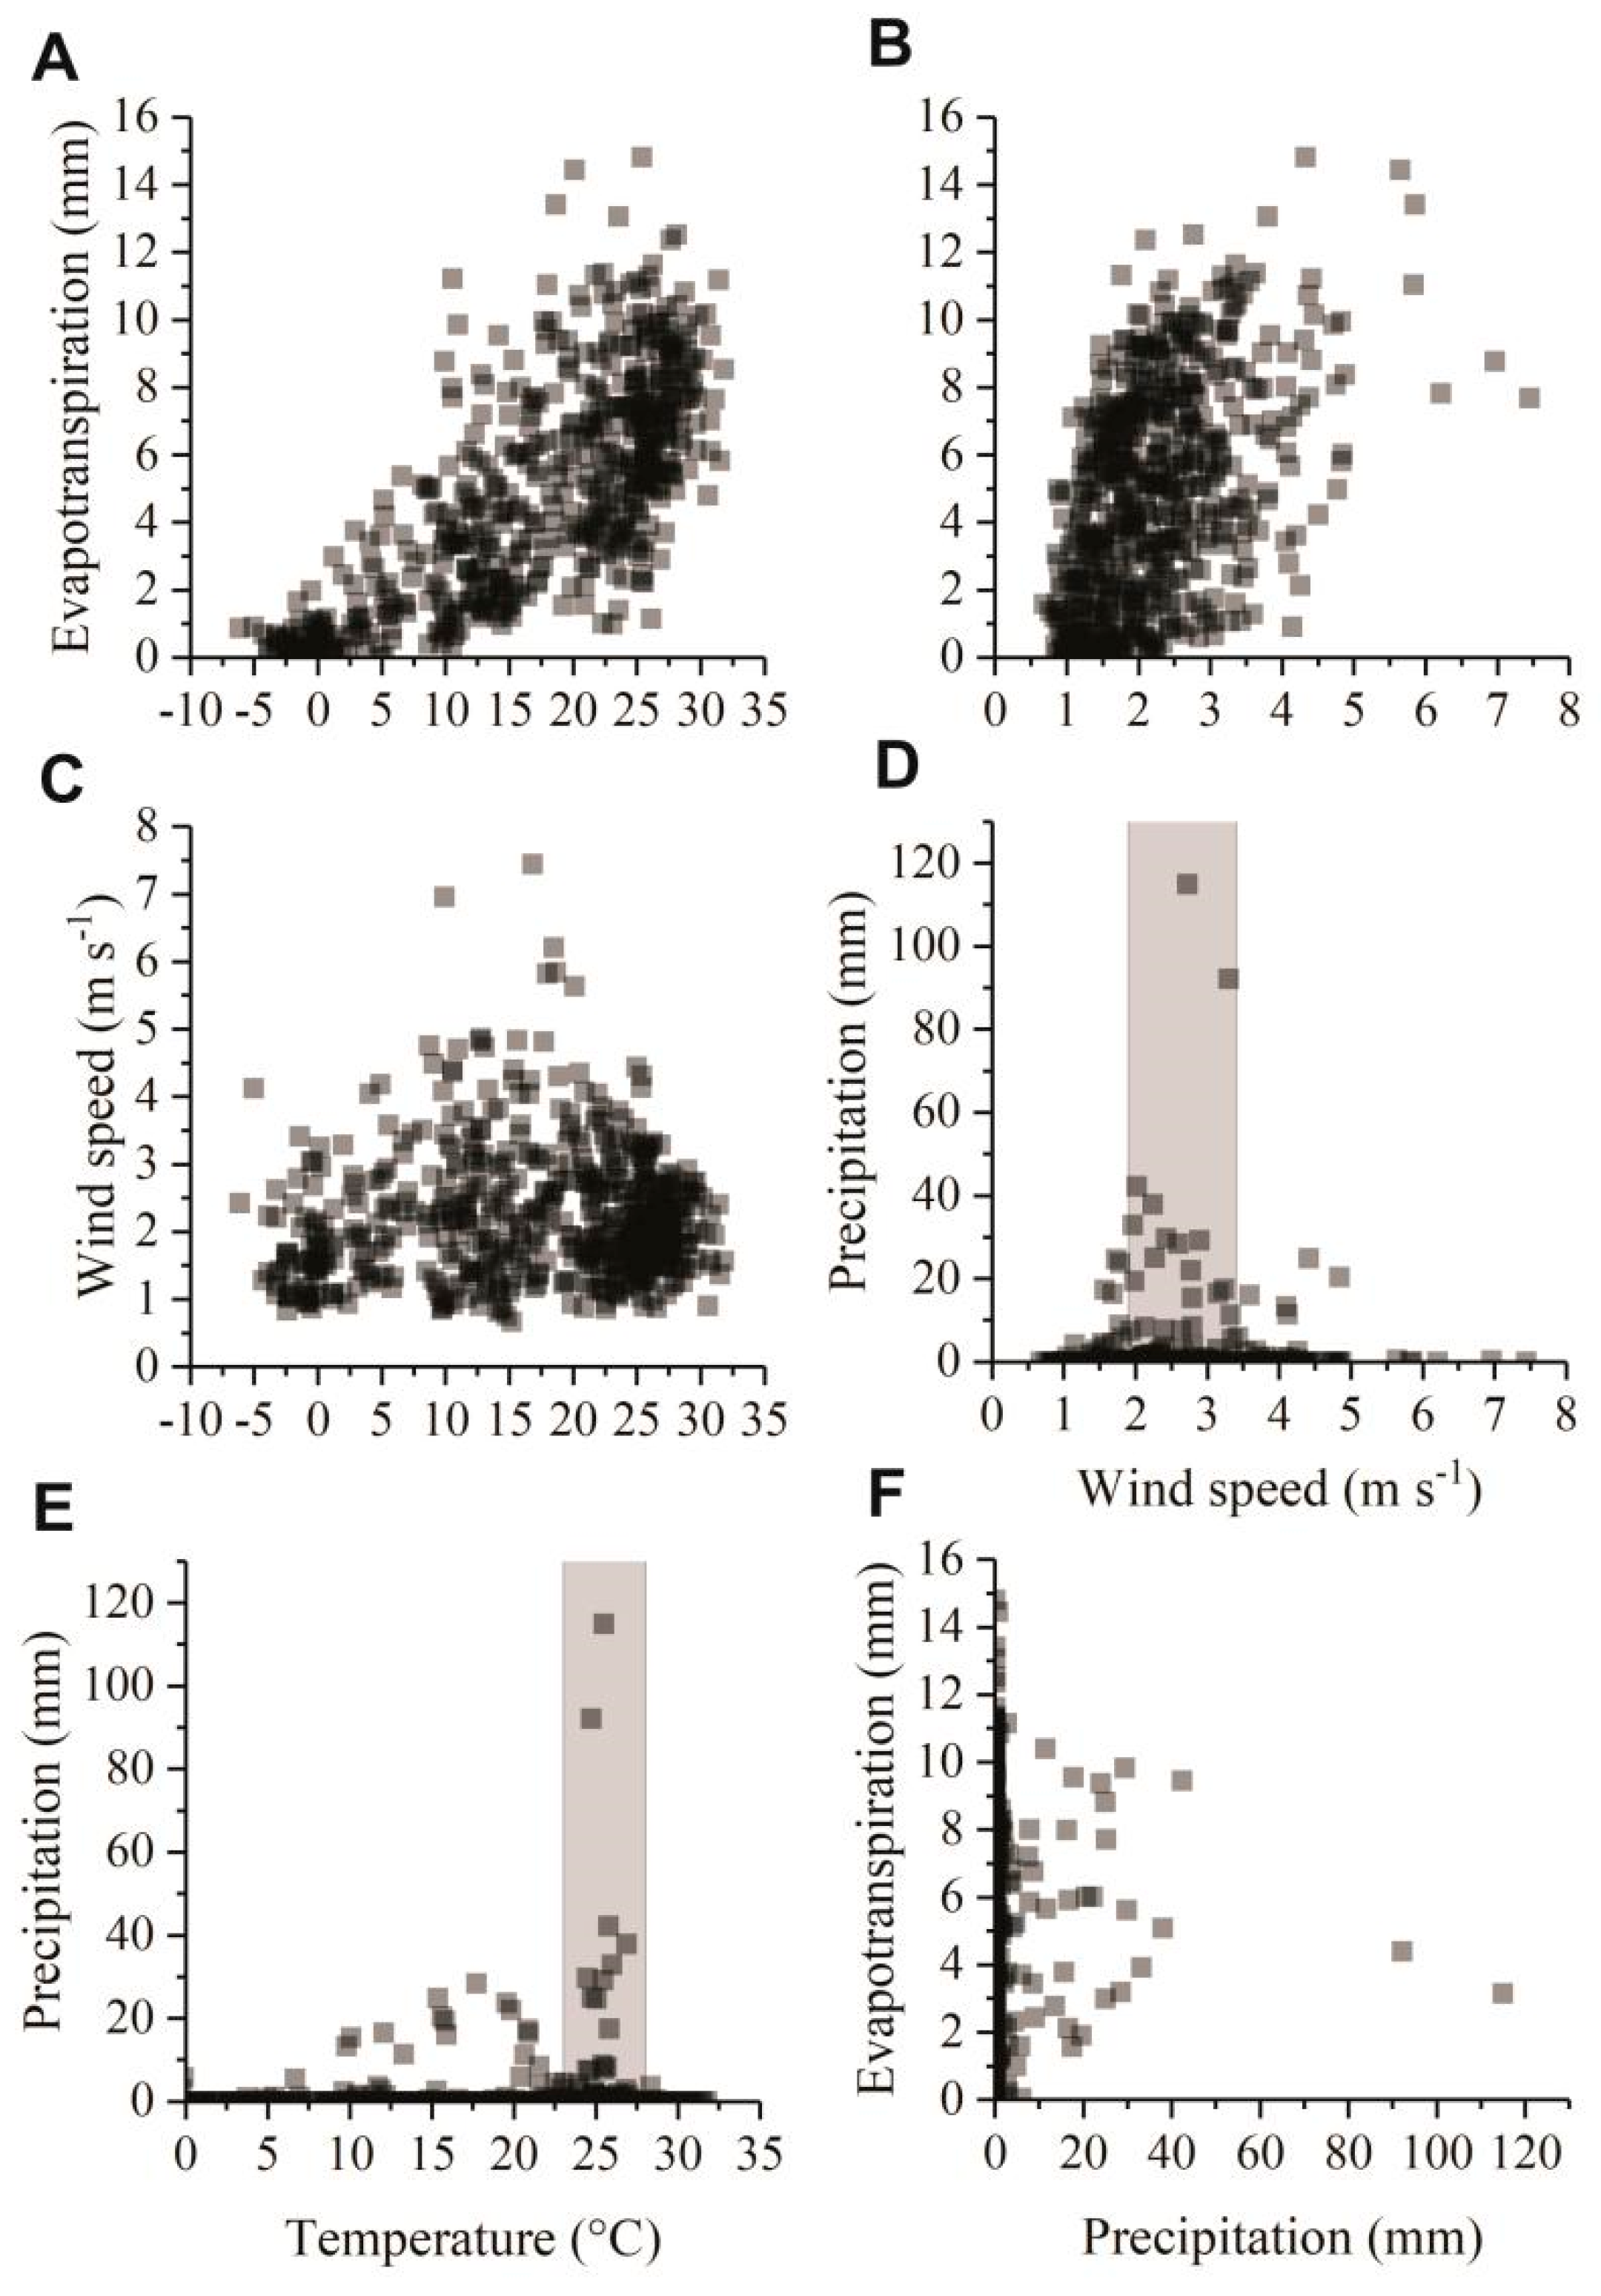
3.1. Meteorological Conditions
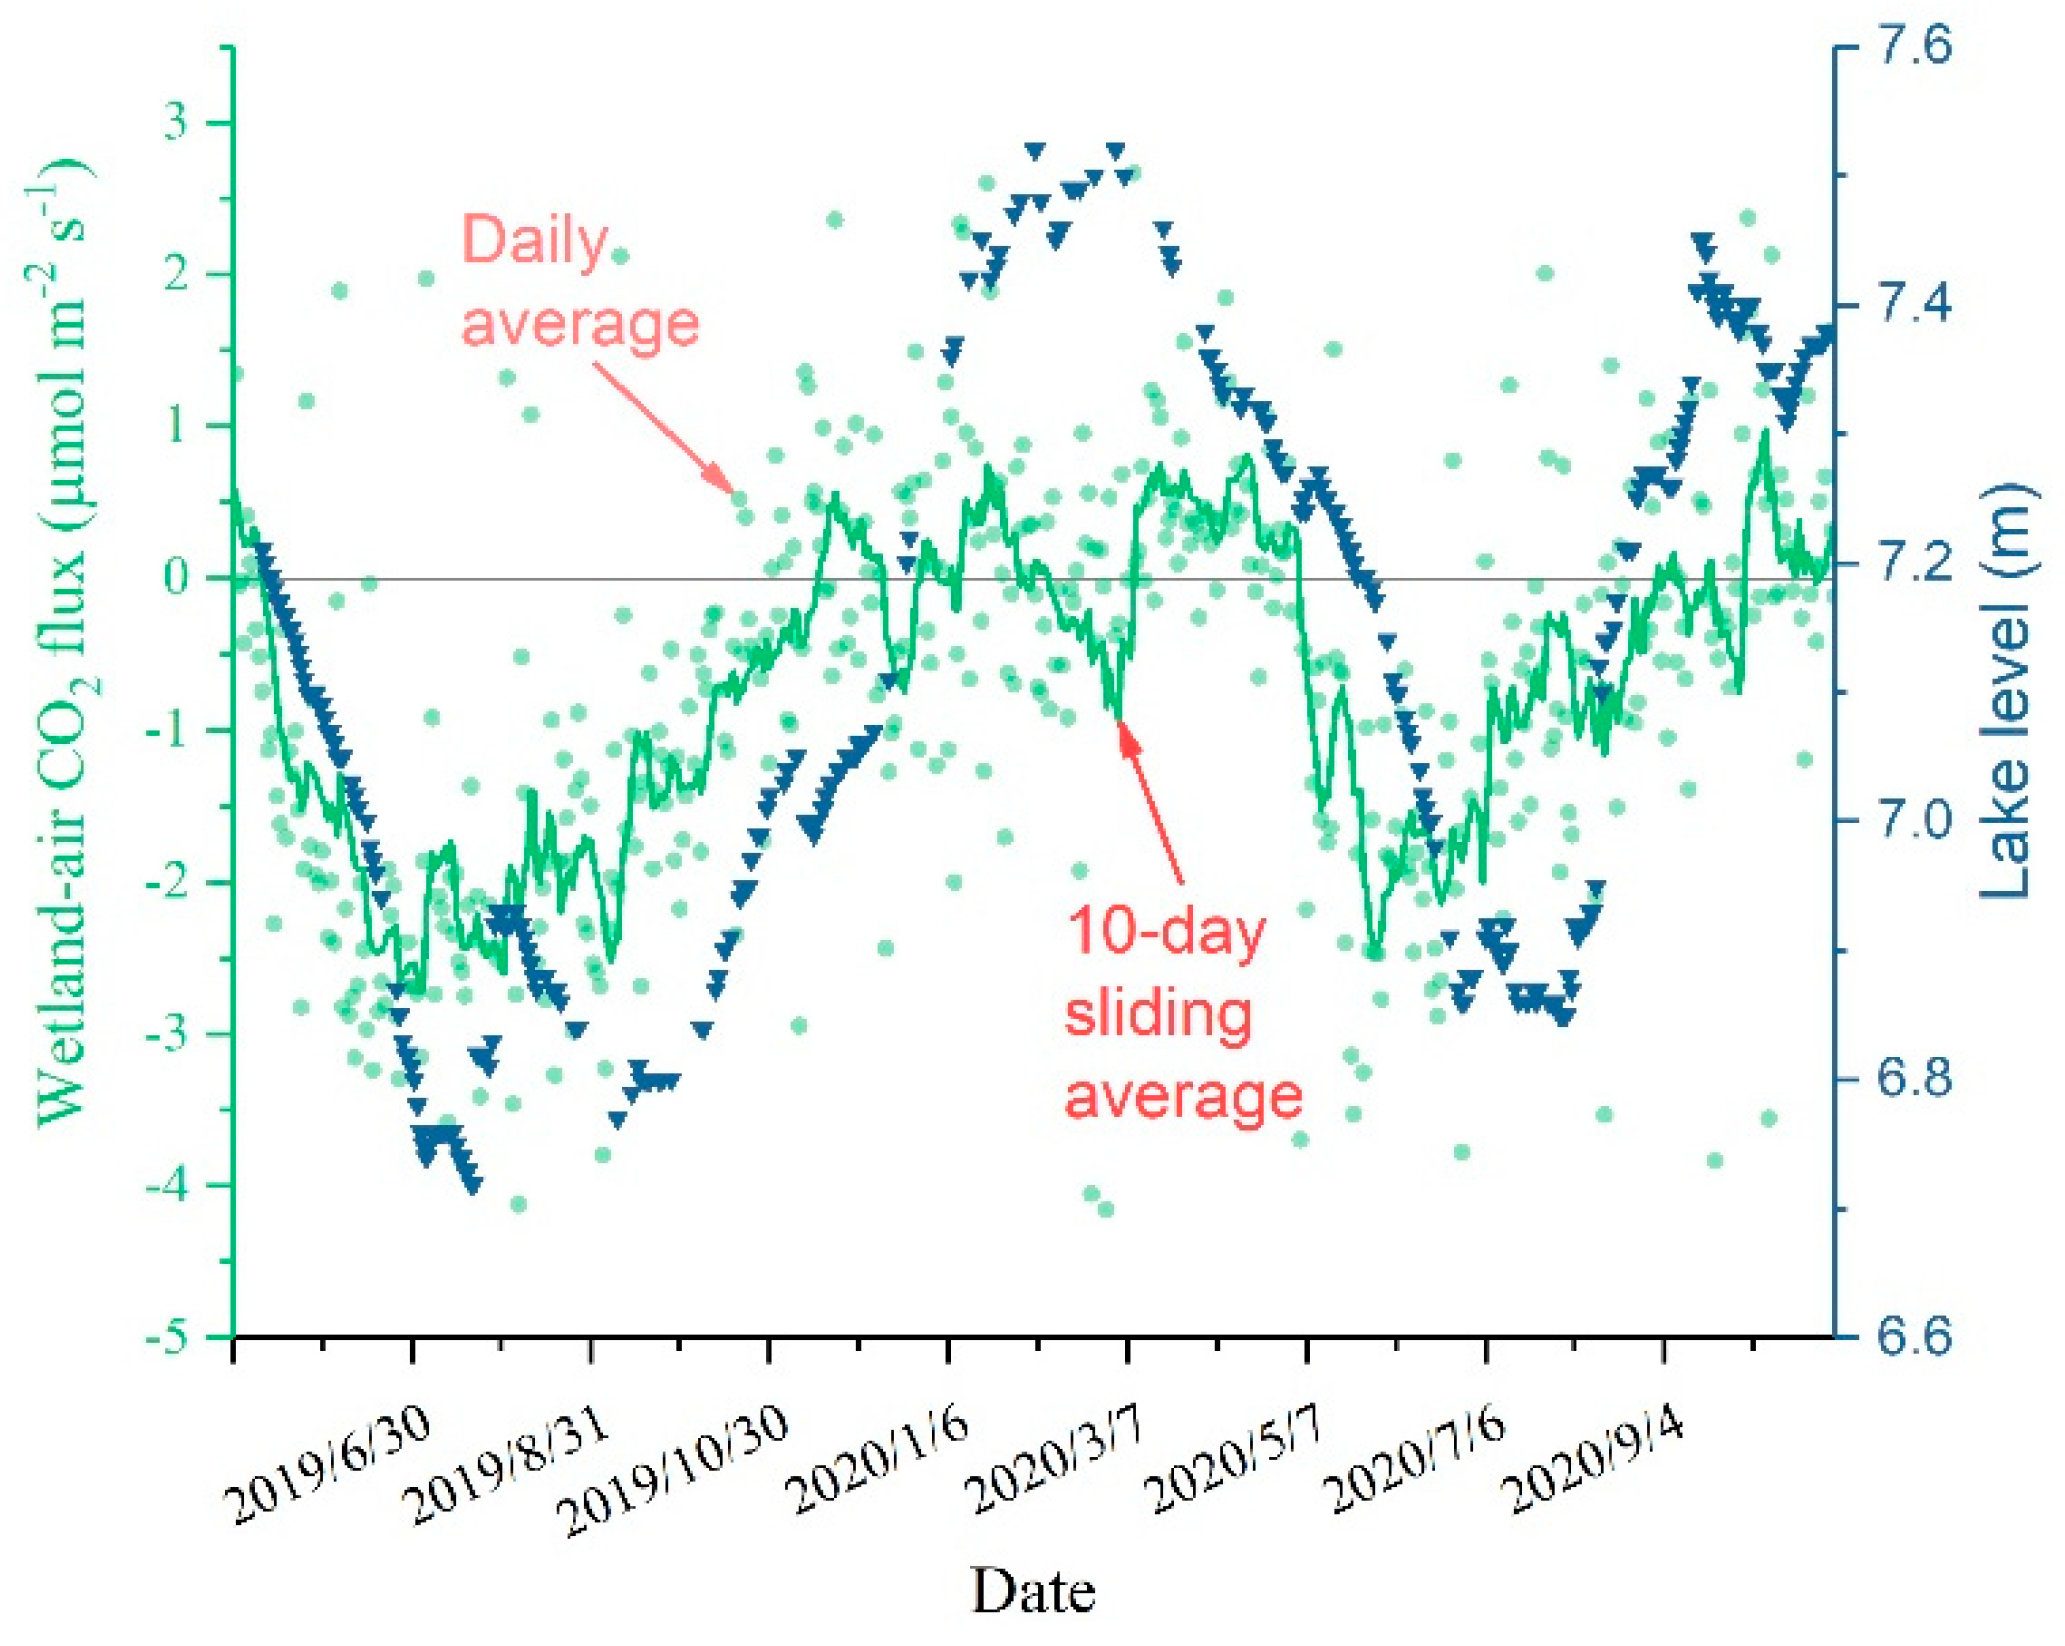
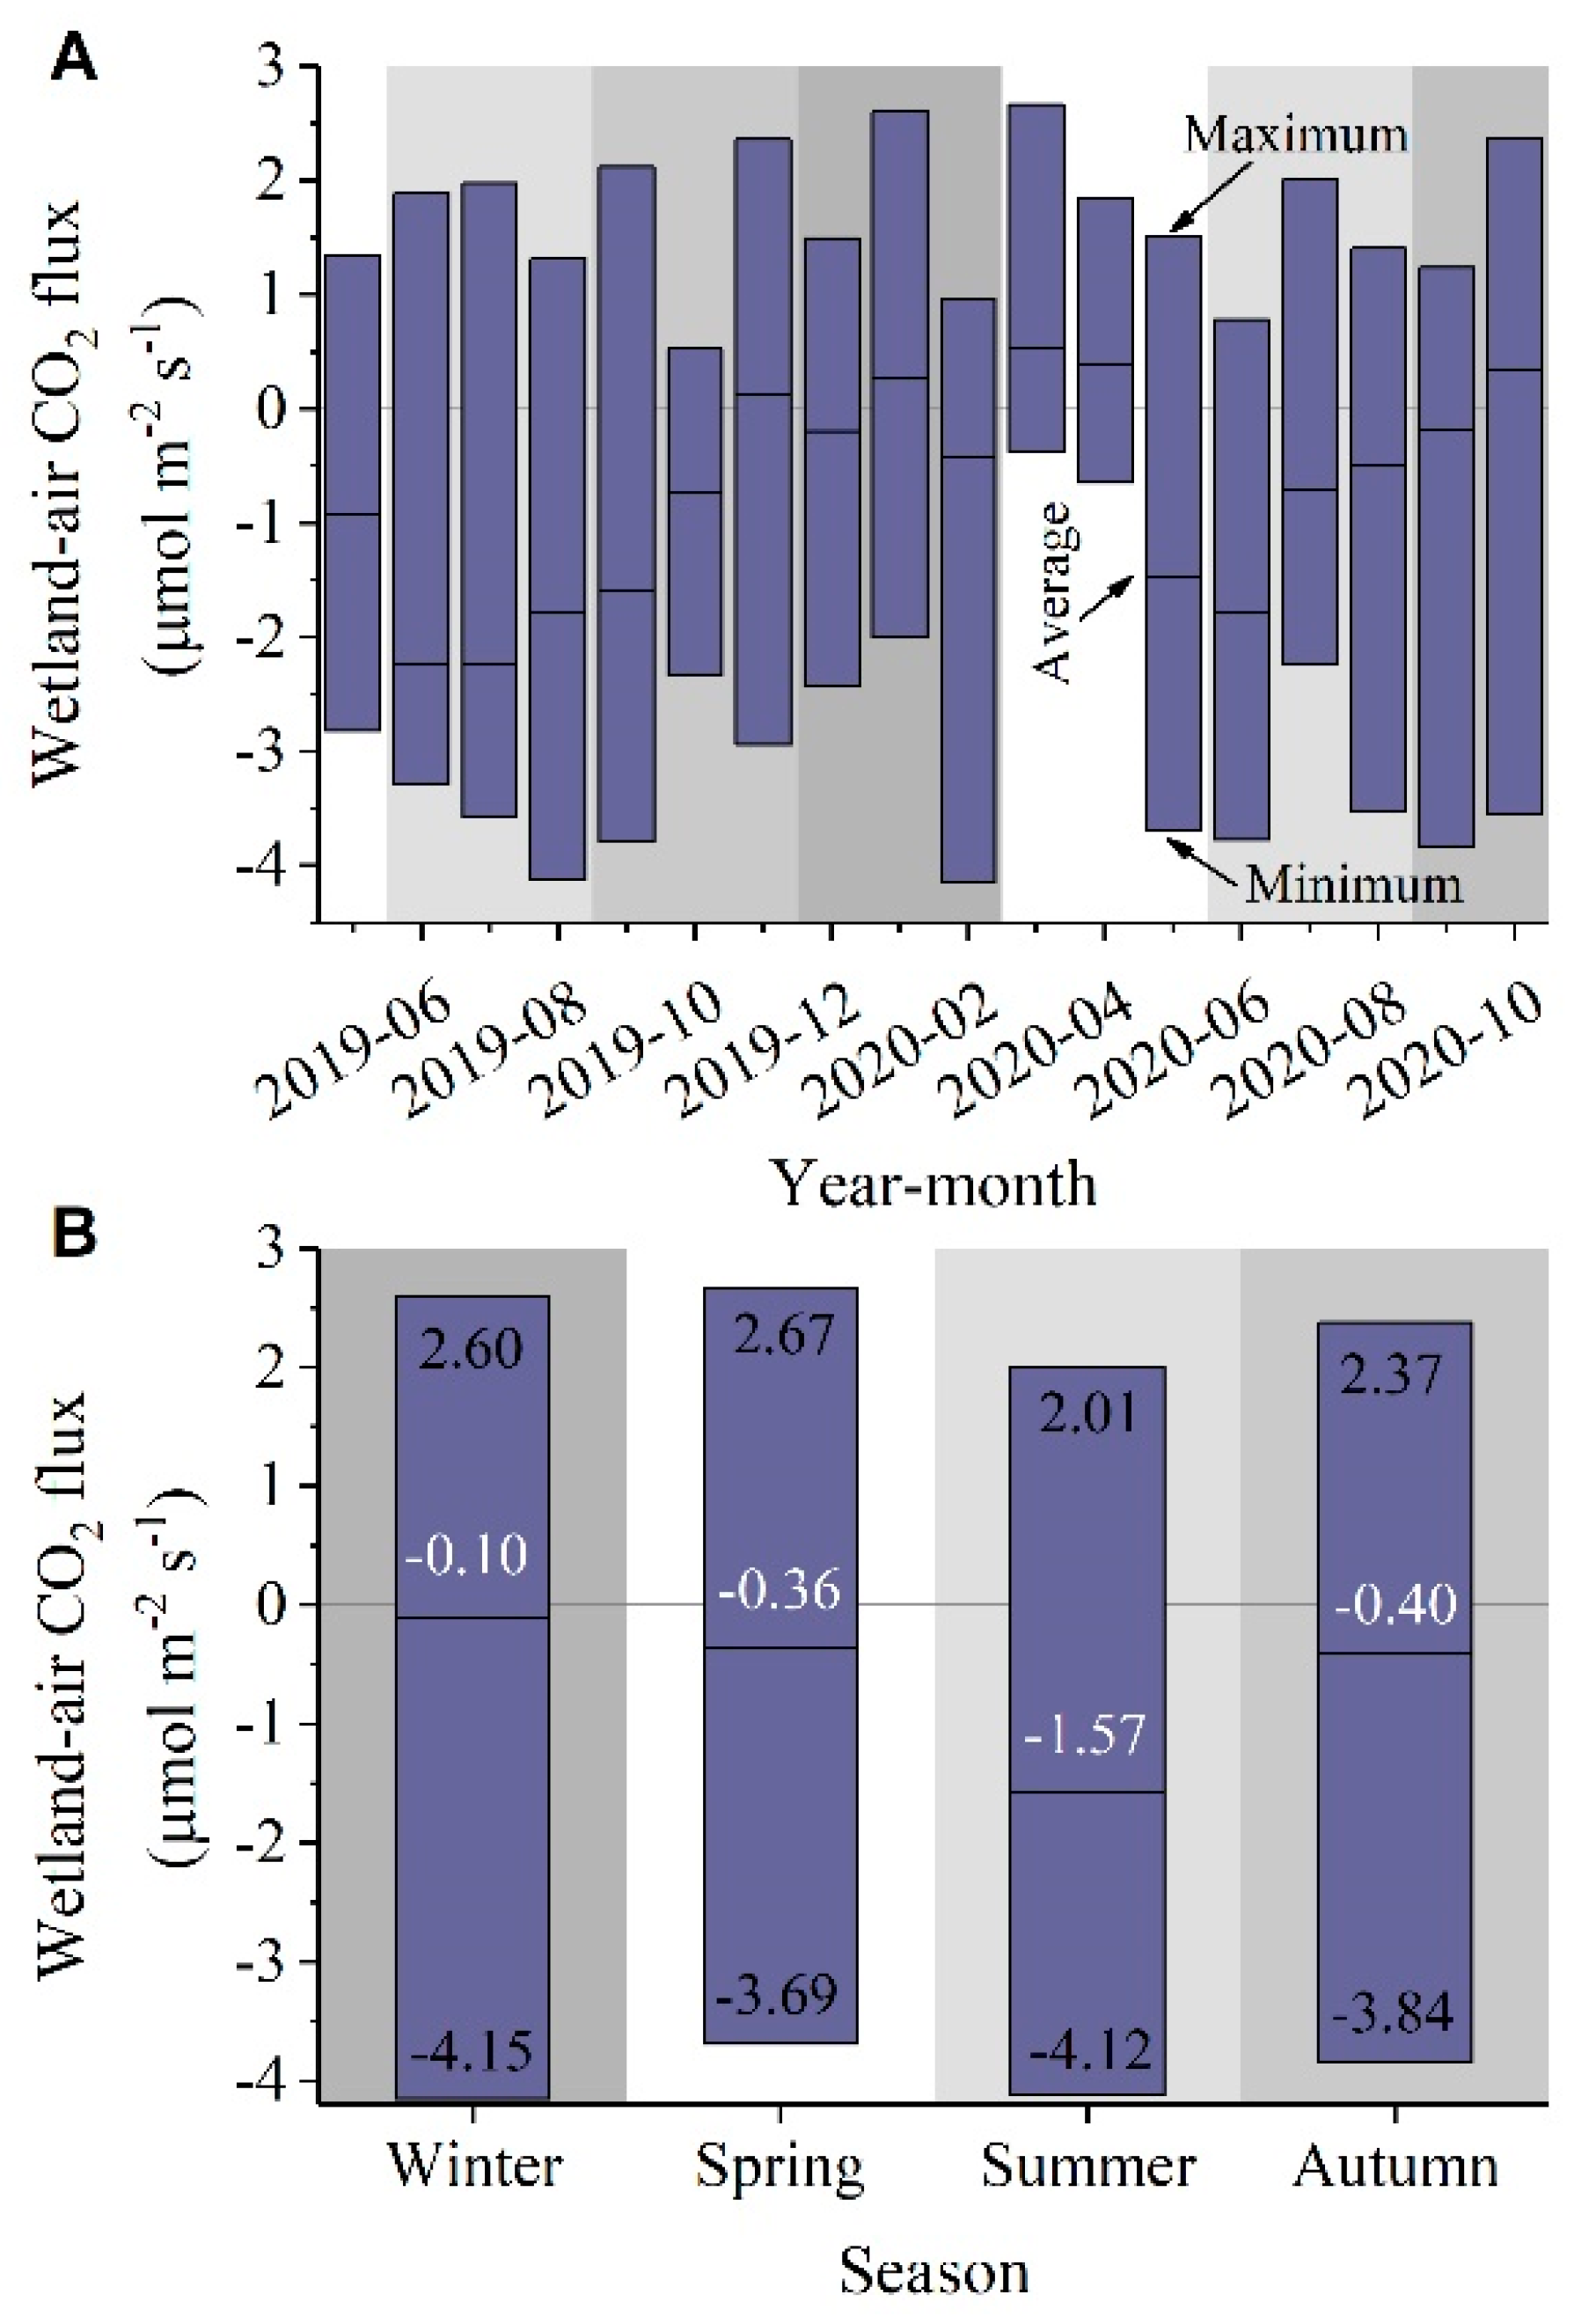
3.2. Temporal Variations of the Wetland-Air CO2 Exchange Fluxes
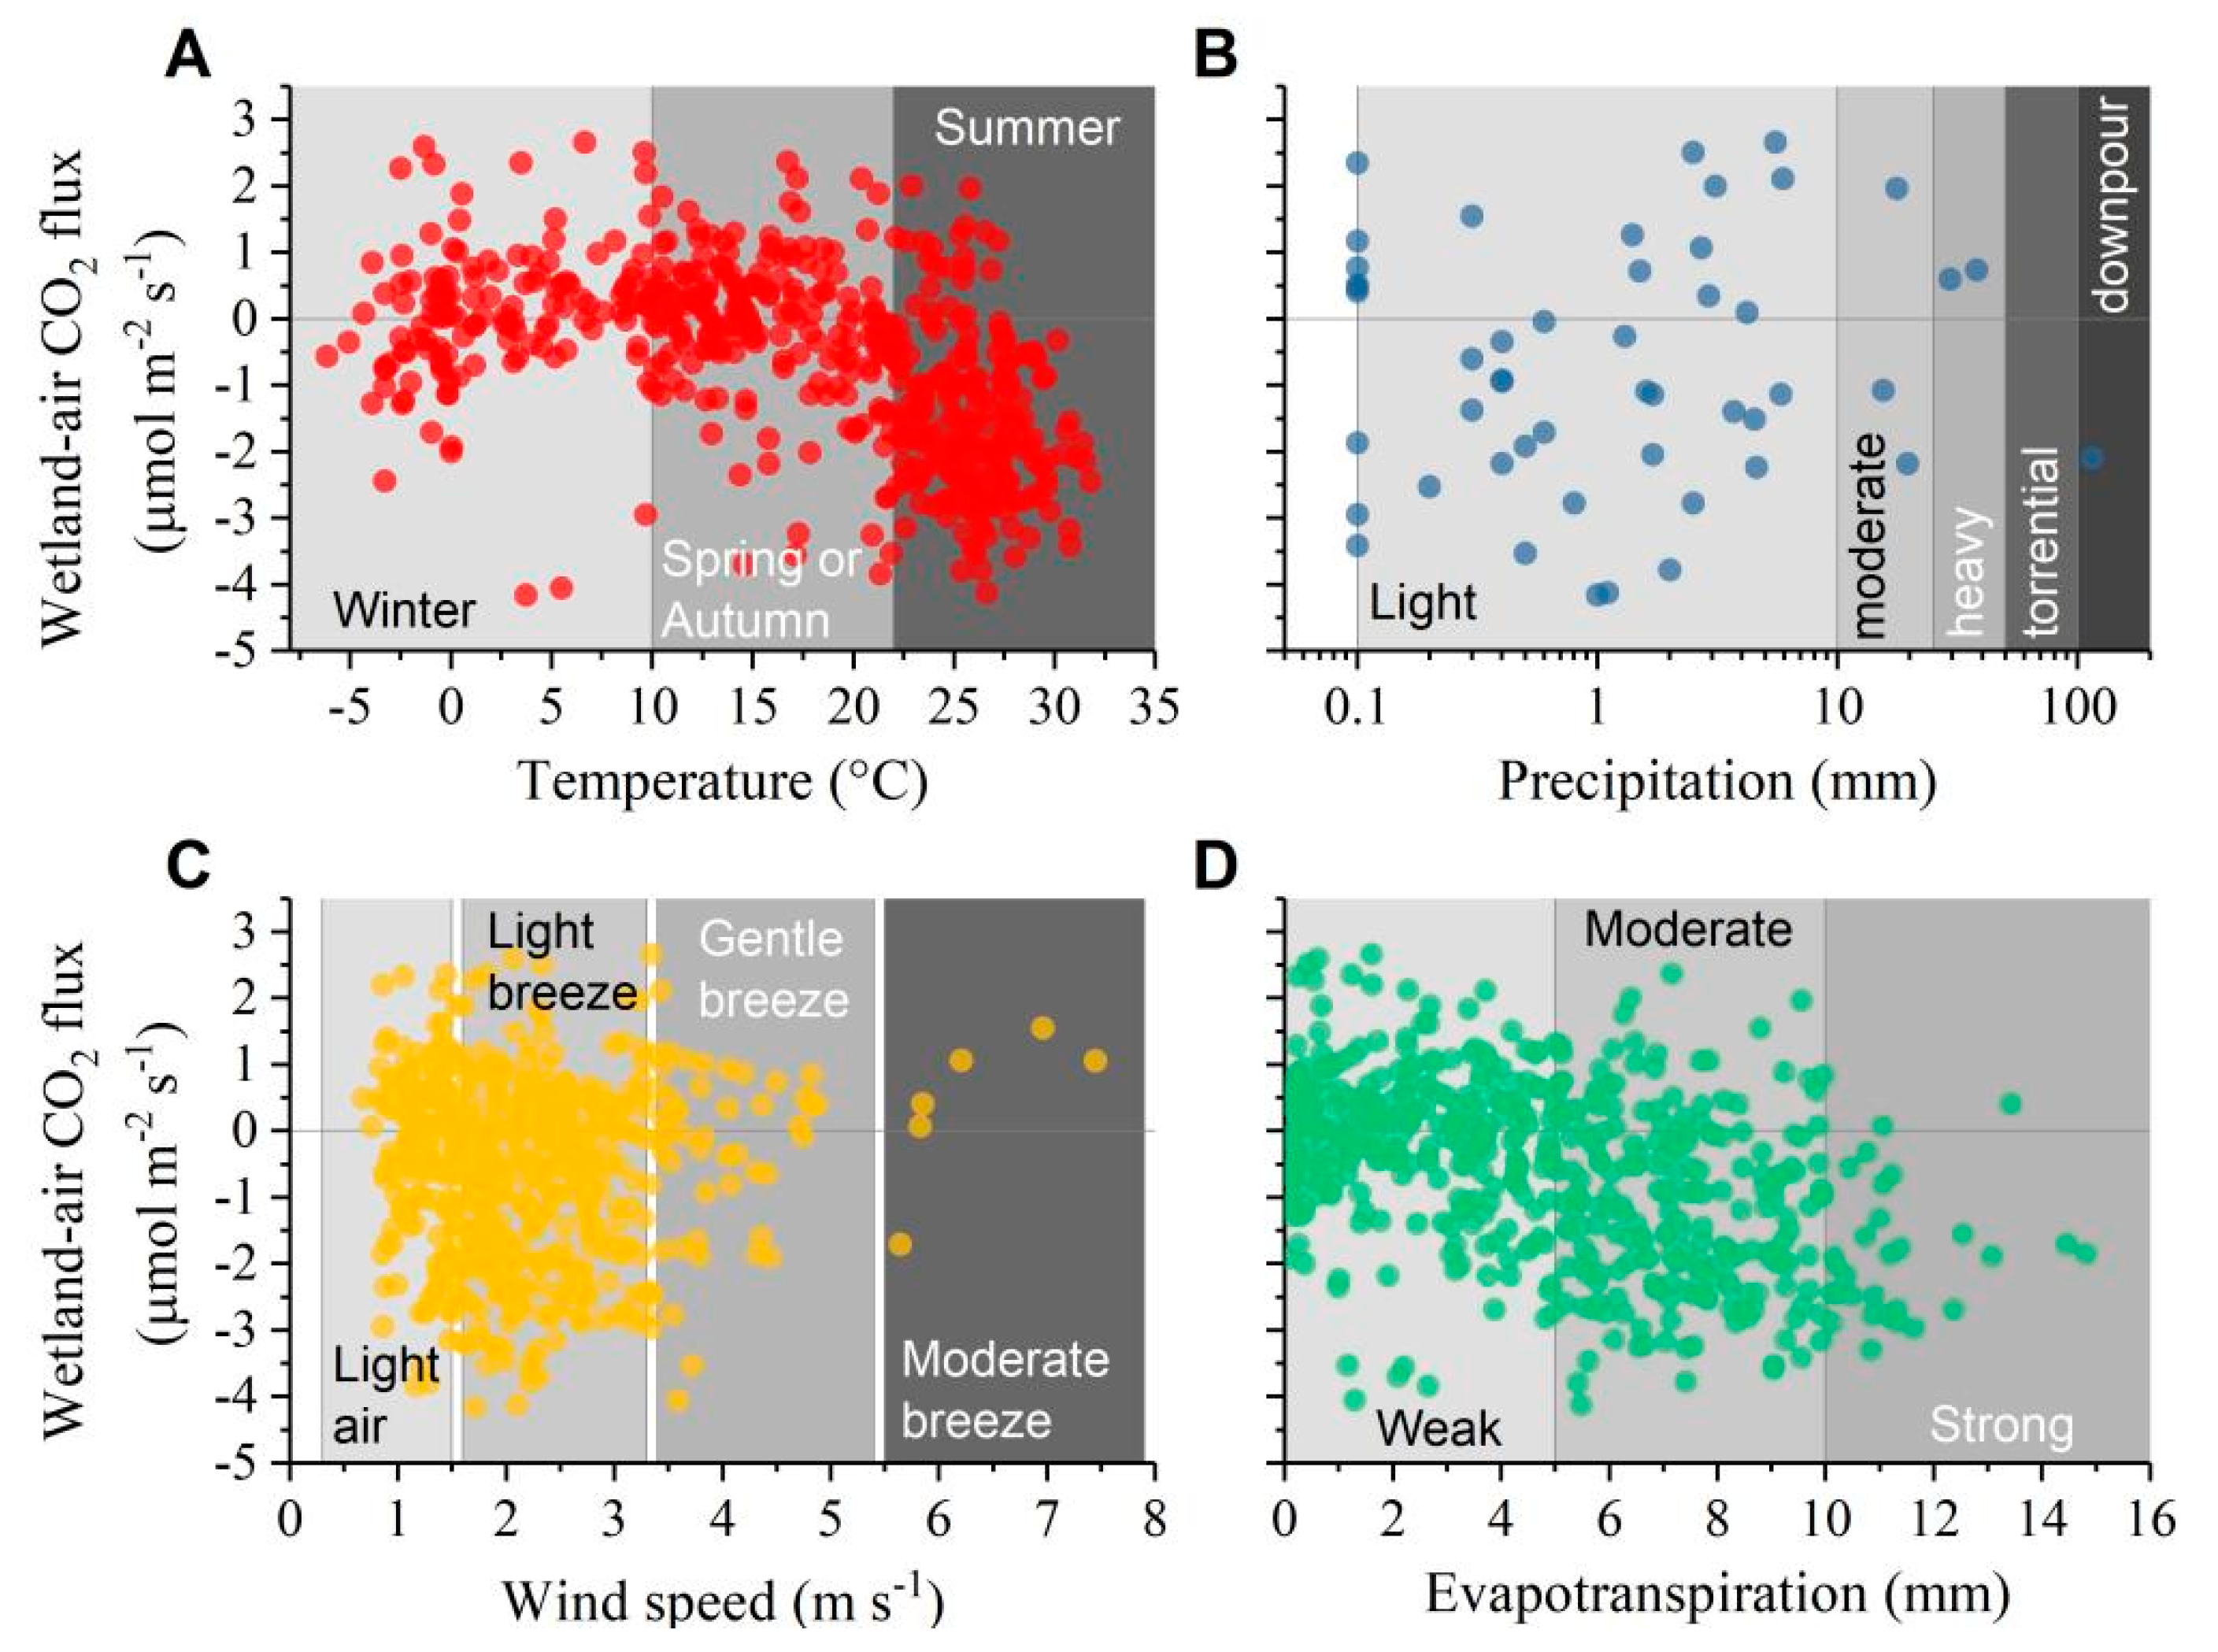
3.3. Relations between the Wetland-Air CO2 Fluxes and the Meteorological Variables
4. Discussion
4.1. The Role of Meteorology in the Wetland-Air CO2 Exchanges
4.2. Comparisons of the Wetland-Air CO2 Fluxes with Previous Studies
4.3. Limitations of the Current Study
5. Conclusions
Author Contributions
Funding
Institutional Review Board Statement
Informed Consent Statement
Data Availability Statement
Acknowledgments
Conflicts of Interest
References
- Holgerson, M.A.; Raymond, P.A. Large contribution to inland water CO2 and CH4 emissions from very small ponds. Nat. Geosci. 2016, 9, 222–226. [Google Scholar] [CrossRef]
- Qi, T.C.; Xiao, Q.T.; Miao, Y.Q.; Duan, H. Temporal and spatial variation of carbon dioxide concentration and its exchange fluxes in Lake Chaohu. J. Lake Sci. 2019, 31, 766–778. [Google Scholar]
- Raymond, P.A.; Hartmann, J.; Lauerwald, R.; Sobek, S.; McDonald, C.; Hoover, M.; Butman, D.; Striegl, R.; Mayorga, E.; Humborg, C.; et al. Global carbon dioxide emissions from inland waters. Nature 2013, 503, 355–359. [Google Scholar] [CrossRef] [PubMed] [Green Version]
- Kumar, A.; Yang, T.; Sharma, M.P. Greenhouse gas measurement from Chinese freshwater bodies: A review. J. Cleaner Prod. 2019, 233, 368–378. [Google Scholar] [CrossRef]
- Gu, B.; Schelske, C.L.; Coveney, M.F. Low carbon dioxide partial pressure in a productive subtropical lake. Aquat. Sci. 2011, 73, 317–330. [Google Scholar] [CrossRef]
- Schindler, D.E.; Carpenter, S.R.; Cole, J.J.; Kitchell, J.F.; Pace, M.L. Influence of food web structure on carbon exchange between lakes and the atmosphere. Science 1997, 277, 248–251. [Google Scholar] [CrossRef] [Green Version]
- Cui, B.S.; Han, Z.; Li, X.; Lan, Y.; Bai, J.H.; Cai, Y.Z. The Driving Mechanism and Regulation Mode of Swamping in Baiyang Lake; Science Press: Beijing, China, 2017. [Google Scholar]
- Ga, J. Photosynthetic Characteristics of Phragmites Australis and Wetland Soil CO2 Flux in Baiyangdian Lake; Hebei University: Baoding, China, 2013. [Google Scholar]
- Niu, C.; Wang, S.; Guo, Y.; Liu, W.; Zhang, J. Emission characteristics of CH4 and CO2 from Phragmites australis-dominated land/inland water ecotones in Baiyangdian Wetland. Jiangsu Agric. Sci. 2018, 46, 209–213. [Google Scholar]
- Zhao, Y.; Wang, F. Characteristics and influencing factors of CH4 and CO2 emissions in Baiyangdian Wetland. Chin. Agric. Sci. Bull. 2022, 38, 63–70. [Google Scholar]
- Wang, K.L.; Zhao, K.; Li, H.T.; Zhang, B.Y.; Li, W.P. Study on wetland extraction based on the synthetic identification method in the Baiyangdian Wetland, Hebei Province. Geoscience 2017, 31, 1294. [Google Scholar]
- Hu, S.S.; Zhang, T. Variation characteristics of potential evapotranspiration and actual evapotranspiration during 1960-2011 in Baiyangdian Basin. South--North Water Transf. Water Sci. Technol. 2016, 14, 67–71. [Google Scholar]
- Aubinet, M.; Vesala, T.; Papale, D. Eddy Covariance: A Practical Guide to Measurement and Data Analysis; Springer Dordrecht: Dordrecht, The Netherlands, 2012. [Google Scholar]
- Burba, G. Eddy Covariance Method for Scientific, Regulatory, and Commercial Applications; LI-COR Biosciences: Lincoln, NE, USA, 2022. [Google Scholar]
- Webb, E.K.; Pearman, G.I.; Leuning, R. Correction of flux measurements for density effects due to heat and water vapour transfer. Q J R Meteorolog. Soc. 1980, 106, 85–100. [Google Scholar] [CrossRef]
- Lee, X.; Massman, W.; Law, B. Handbook of Micrometeorology: A Guide for Surface Flux Measurement and Analysis; Springer Science & Business Media: Berlin, Germany, 2004. [Google Scholar]
- Massman, W. Reply to comment by Rannik on “A simple method for estimating frequency response corrections for eddy covariance systems”. Agric. Forest Meteorol. 2001, 107, 247–251. [Google Scholar] [CrossRef]
- Paw, U.K.T.; Baldocchi, D.D.; Meyers, T.P.; Wilson, K.B. Correction of eddy-covariance measurements incorporating both advective effects and density fluxes. Bound-Lay Meteorol. 2000, 97, 487–511. [Google Scholar] [CrossRef]
- Suo, J.J. Study on multi-scale moving average and interpolation method of daily evapotranspiration. Yangtze River 2018, 49, 35–39. [Google Scholar]
- Morin, T.H.; Rey-Sánchez, A.C.; Vogel, C.S.; Matheny, A.M.; Kenny, W.T.; Bohrer, G. Carbon dioxide emissions from an oligotrophic temperate lake: An eddy covariance approach. Ecol. Eng. 2018, 114, 25–33. [Google Scholar] [CrossRef]
- Wang, H.; Zhou, G. Long-term flux characteristics of Phragmites ecosystem in Panjin Wetland. J. Meteorol. Environ. 2006, 22, 18–24. [Google Scholar]
- Xing, Y.; Xie, P.; Yang, H.; Ni, L.; Wang, Y.; Rong, K. Methane and carbon dioxide fluxes from a shallow hypereutrophic subtropical Lake in China. Atmos. Environ. 2005, 39, 5532–5540. [Google Scholar] [CrossRef]
- Li, X.H. Study of the Greenhouse Gas Flux of Water-Air Interface and Its Spatio-Temporal Change in Taihu Lake [Master of Engineering]. Master’s Thesis, Hohai University, Nanjing, China, 2005. [Google Scholar]
- Ding, W.; Zhu, R.; Dawei, M.; Xu, H. Summertime fluxes of N2O, CH4 and CO2 from the littoral zone of Lake Daming, East Antarctica: Effects of environmental conditions. Antarct Sci. 2013, 25, 752–762. [Google Scholar] [CrossRef]
- Gao, Y.Q. Analysis of CO2 Flux Variation and Its Driving Factors in a Submerged Macrophytes Habitat of Lake Taihu [Doctor]. Ph.D. Thesis, Nanjing University of Information Science and Technology, Nanjing, China, 2018. [Google Scholar]
- Macklin, P.A.; Suryaputra, I.G.N.A.; Maher, D.T.; Santos, I.R. Carbon dioxide dynamics in a lake and a reservoir on a tropical island (Bali, Indonesia). PLoS ONE 2018, 13, e0198678. [Google Scholar] [CrossRef] [Green Version]
- Han, B.; Meng, X.; Yang, Q.; Wu, R.; Lv, S.; Li, Z.; Wang, X.; Li, Y.; Yu, L. Connections between daily surface temperature contrast and CO2 flux over a Tibetan lake: A case study of Ngoring Lake. J. Geophys. Res. Atmos. 2020, 125, e2019JD032277. [Google Scholar] [CrossRef]
- Yang, P.; Wang, N.; Zhao, L.; Zhang, D.; Zhao, H.; Niu, Z.; Fan, G. Variation characteristics and influencing mechanism of CO2 flux from lakes in the Badain Jaran Desert: A case study of Yindeer Lake. Ecol. Indic. 2021, 127, 107731. [Google Scholar] [CrossRef]
- Li, X.Y.; Shi, F.Z.; Ma, Y.J.; Zhao, S.J.; Wei, J.Q. Significant winter CO2 uptake by saline lakes on the Qinghai-Tibet Plateau. Global Change Biol. 2022, 28, 2041–2052. [Google Scholar] [CrossRef] [PubMed]
- Sun, H.; Lu, X.; Yu, R.; Yang, J.; Liu, X.; Cao, Z.; Zhang, Z.; Li, M.; Geng, Y. Eutrophication decreased CO2 but increased CH4 emissions from lake: A case study of a shallow Lake Ulansuhai. Water Res. 2021, 201, 117363. [Google Scholar] [CrossRef]
- Xiao, Q.; Liu, Z.; Hu, Z.; Wang, W.; Zhang, M.; Xiao, W.; Duan, H. Notable changes of carbon dioxide in a eutrophic lake caused by water diversion. J. Hydrol. 2021, 603, 127064. [Google Scholar] [CrossRef]
- St Pierre, K.A.; St Louis, V.L.; Schiff, S.L.; Lehnherr, I.; Dainard, P.G.; Gardner, A.S.; Aukes, P.J.; Sharp, M.J. Proglacial freshwaters are significant and previously unrecognized sinks of atmospheric CO2. Proc. Natl. Acad. Sci. USA 2019, 116, 17690–17695. [Google Scholar] [CrossRef] [Green Version]
- Xiao, Q.; Xu, X.; Duan, H.; Qi, T.; Qin, B.; Lee, X.; Hu, Z.; Wang, W.; Xiao, W.; Zhang, M. Eutrophic Lake Taihu as a significant CO2 source during 2000–2015. Water Res. 2020, 170, 115331. [Google Scholar] [CrossRef]
- Marotta, H.; Duarte, C.M.; Meirelles-Pereira, F.; Bento, L.; Esteves, F.A.; Enrich-Prast, A. Long-term CO2 variability in two shallow tropical lakes experiencing episodic eutrophication and acidification events. Ecosystems 2010, 13, 382–392. [Google Scholar] [CrossRef]
- Finlay, K.; Leavitt, P.; Wissel, B.; Prairie, Y. Regulation of spatial and temporal variability of carbon flux in six hard-water lakes of the northern Great Plains. Limnol. Oceanogr. 2009, 54, 2553–2564. [Google Scholar] [CrossRef]


| Temperature | Precipitation | Wind Speed | Evapotranspiration | Wetland-Air CO2 Flux | |
|---|---|---|---|---|---|
| Temperature | 1 | ||||
| Precipitation | 0.099 * | 1 | |||
| Wind speed | 0.062 | 0.093 * | 1 | ||
| Evapotranspiration | 0.732 ** | 0.025 | 0.468 ** | 1 | |
| Wetland-air CO2 flux | −0.485 ** | −0.012 | 0.051 | −0.406 ** | 1 |
| Summer of the Year | Daily Average Temperature (°C) | Daily Average Precipitation (mm) | Daily Average Wind Speed (m s−1) | Daily Evapotranspiration (mm) | Daily Wetland-Air CO2 Flux (μmol m−2 s−1) |
|---|---|---|---|---|---|
| 2019 | 26.22 | 1.94 | 2.16 | 7.32 | −2.10 |
| 2020 | 25.94 | 4.26 | 2.15 | 6.84 | −1.03 |
| Ratio of 2019 to 2020 | 1.01 | 0.46 | 1.01 | 1.07 | 2.03 |
| Site | Wetland-Air CO2 Flux (μmol m−2 s−1) | Reference |
|---|---|---|
| Dongtinghu Lake | −0.04 (daily average) | [23] |
| Chaohu Lake | −0.10 (daily average) | |
| Hongzehu Lake | −0.17 (daily average) | |
| Erhai Lake | −0.01 (daily average) | |
| Dianchi Lake | −0.12 (daily average) | |
| Donghu Lake | 0.37 ± 0.29 (winter), −0.02 ± 0.06 (spring) −0.04 ± 0.11 (summer), 0.04 ± 0.09 (autumn) | [22] |
| Lake Daming | −0.10~0.04 (summer) | [24] |
| Taihu Lake | −2.23~0.19 (annual average: −0.73) | [25] (Monthly statistics) |
| Lake Batur | −0.03 | [26] |
| Ngoring Lake | −0.70~−0.13 (June to September) | [27] |
| Yindeer Lake | −0.84~0.24 (annual average: −0.26) | [28] |
| Panjin reed wetland | −2.75 (June~September 2004) −3.04(June~September 2005) | [21] |
| Qinghai Lake | −0.84 ± 0.37 (Ice-covered) −0.40 ± 0.34 (Ice-free) | [29] |
| BYDL | −2.34~−0.33 (average: −1.29, June~October) | [8] |
| BYDL | −2.24~−0.74 (average: −1.72, June~October 2019) −1.79~0.34 (average: −0.57, June~October 2020) | This study (Monthly statistics) |
| BYDL | −0.10 (winter), −0.36 (spring) −1.57 (summer), −0.40 (autumn) −0.63 (average over the monitoring period) −0.71 (annual average, from 12 April 2019 to 12 April 2020) | This study (Seasonal statistics) |
Disclaimer/Publisher’s Note: The statements, opinions and data contained in all publications are solely those of the individual author(s) and contributor(s) and not of MDPI and/or the editor(s). MDPI and/or the editor(s) disclaim responsibility for any injury to people or property resulting from any ideas, methods, instructions or products referred to in the content. |
© 2022 by the authors. Licensee MDPI, Basel, Switzerland. This article is an open access article distributed under the terms and conditions of the Creative Commons Attribution (CC BY) license (https://creativecommons.org/licenses/by/4.0/).
Share and Cite
Li, G.; Xiao, K.; Wang, Q.; Zhang, Y.; Li, H.; Li, H. The Regulating Role of Meteorology in the Wetland-Air CO2 Fluxes at the Largest Shallow Grass-Type Lake on the North China Plain. Water 2023, 15, 139. https://doi.org/10.3390/w15010139
Li G, Xiao K, Wang Q, Zhang Y, Li H, Li H. The Regulating Role of Meteorology in the Wetland-Air CO2 Fluxes at the Largest Shallow Grass-Type Lake on the North China Plain. Water. 2023; 15(1):139. https://doi.org/10.3390/w15010139
Chicago/Turabian StyleLi, Gang, Kai Xiao, Qianqian Wang, Yan Zhang, Haitao Li, and Hailong Li. 2023. "The Regulating Role of Meteorology in the Wetland-Air CO2 Fluxes at the Largest Shallow Grass-Type Lake on the North China Plain" Water 15, no. 1: 139. https://doi.org/10.3390/w15010139
APA StyleLi, G., Xiao, K., Wang, Q., Zhang, Y., Li, H., & Li, H. (2023). The Regulating Role of Meteorology in the Wetland-Air CO2 Fluxes at the Largest Shallow Grass-Type Lake on the North China Plain. Water, 15(1), 139. https://doi.org/10.3390/w15010139