Article

Changes in the Amount of Rainwater in the Roztocze National Park (Poland) in 2001–2020 and the Possibility of Using Rainwater in the Context of Ongoing Climate Variability

by
Tadeusz Grabowski
1,2,
Krzysztof Jóźwiakowski
2,*,
Andrzej Bochniak
3 and
Agnieszka Micek
2
1
Roztocze National Park, Plażowa 2, 22-470 Zwierzyniec, Poland
2
Department of Environmental Engineering and Geodesy, University of Life Sciences in Lublin, Leszczyńskiego 7, 20-069 Lublin, Poland
3
Department of Applied Mathematics and Computer Science, University of Life Sciences in Lublin, Głęboka 28, 20-612 Lublin, Poland
*
Author to whom correspondence should be addressed.
Water 2022, 14(9), 1334; https://doi.org/10.3390/w14091334
Submission received: 3 March 2022 / Revised: 18 April 2022 / Accepted: 18 April 2022 / Published: 20 April 2022

Abstract

:
Data for the years 2001–2020 on changes in the amount of rainwater in the Roztocze National Park (RNP) in the catchment area of the Świerszcz River (Poland) were investigated to evaluate the possibility of using rainwater in the park for various purposes in the context of ongoing climate variability. An analysis of data from the RNP’s Integrated Monitoring of the Natural Environment showed that the average annual air temperature increased by 2.1 °C over the 20-year period, while the amount of precipitation decreased, especially in the winter seasons. These changes periodically led to a negative hydrological balance. As an effect, the groundwater table was gradually lowering, the flow of the Świerszcz River was reduced, and there were periodic shortages of water feeding the Echo Ponds. Water shortages also negatively affected the flora and fauna of the RNP. In order to quantitatively protect the Park’s water resources, a proposition was made to build a rainwater management system at the Animal Breeding Centre in Florianka to provide water for watering Polish Konik horses, flushing toilets, washing cars and agricultural equipment, and fire-prevention purposes. The excess water would be discharged to a nearby pond, which is an amphibian breeding site. It was estimated that the system was capable of meeting 100% of the demand for lower-quality water in the summer period. Moreover, it was determined that 9109 m3 of rainwater could be obtained annually from the roofs of all public utility buildings located in the RNP.

1. Introduction

Water is essential for human life and well-being, as well as the economy of all countries. Freshwater accounts for only 2.5% of the Earth’s water resources, and the remainder (97.5%) is the salt water found in the world’s oceans. On top of that, as much as 68.7% of the Earth’s freshwater is frozen in mountain glaciers and ice sheets [1]. This means that the available water resources, mainly found as groundwater and surface waters, are small.
Freshwater is a renewable resource, but the world’s reserves of clean and fresh water are constantly diminishing. In many parts of the globe, the demand for water exceeds the supply, and, as the human population continues to grow, numerous countries face increasing water shortages. Today, more than 2.1 billion people worldwide do not have easy access to water at home, and another 2.3 billion have poor sanitation [2].
The awareness of the global importance of water conservation did not develop until the 20th century, when more than half of the world’s wetlands had been lost. Freshwater ecosystems, which are rich in biodiversity, are disappearing faster than marine aquatic ecosystems [3]. Therefore, it is necessary to rationally manage water resources and seek solutions that will permit us to protect the Earth’s freshwater reserves and obtain water from various sources.
In recent years, there has been more and more talk worldwide of wastewater reuse and the use of closed-loop systems [4,5,6,7,8]. In countries which experience the greatest water shortages, attempts are being made at using the desalination technology to convert sea and ocean water into freshwater [9,10,11,12]. However, the costs of applying wastewater treatment and desalination technologies are quite high [13,14,15]. Therefore, it seems that a more advantageous solution is to employ, where possible, systems for the collection and use of rainwater [16,17,18], the treatment of which does not require expensive technologies.
The collection and use of rainwater is one of the measures that can improve water security and access to freshwater in the face of climate change [17]. Research conducted by numerous authors around the world shows that rainwater harvesting systems (RWHS) can provide from 12 to 100% of potable water for a household, depending on environmental and social conditions [16,19,20,21,22,23]. Eroksuz and Rahman [24] investigated the water-saving potential of rainwater tanks installed in multistory residential buildings in three cities of Eastern Australia. They found that a rainwater tank of an appropriate size installed in a multistory building could deliver considerable water savings even in dry years.
When designing RWHS, attention should also be paid to the selection of the right size of tanks and the comparison of the assumed and actual performance of the system. The return on investment costs can be significantly extended in the case of over-sized tanks in relation to optimized-sized tanks [25]. Attention is also drawn to the need for a more multi-criteria approach when modeling urban RWHS, not only to collect water, while taking into account economic constraints, but also considering other benefits to nature [26]. Additionally, the use of different optimization algorithms and ranking methods can help to reach the optimal solution while designing RWHS. Moreover, numerical optimization can provide an additional tool to increase efficiency of systems and reduce project cost [27]. The significance of RWHS is also shown in aspects of reduction of electricity consumption and greenhouse gas emissions compared to public centralized supply systems [28]. RWHS is of particular importance in countries with tropical climates, where RWHS can reduce water scarcity in dry season and may help urban drainage system in the rainy season [29]. In counties such as Ethiopia, RWHS from large institutions will enable a significant volume of potable water to be transferred to localities critically suffering from water shortage [30]. It should also be kept in mind that the efficiency of rainwater management is usually judged on the basis of long-term averages. However, such a long-term assessment is poorly suited to the goal of mitigating the effects of short-term high-intensity rainfall [31]. With the development of IoT (Internet of Things) technology, the possibility of real-time monitoring has also opened up; it can help in the construction of systems preventing urban flooding and sewers overflows [32].
The literature review presented above shows that, so far, rainwater management installations have been usually used in urbanized areas in cities. However, the proper management of rainwater should be a key concern for protected areas, such as national parks, landscape parks, nature reserves, or Natura 2000 sites, as it may contribute to sustainable protection of waters and biodiversity in those areas [33,34]. The existing and planned protected areas require adequate water resources to ensure the functioning of river valleys and other areas with aquatic and water-dependent ecosystems, as well as the proper protection of ecological corridors. This applies to all watercourses and their valleys, both within and outside protected areas [33].
The forecast climate changes, and especially their effects, may lead to a transformation of the water cycle and alterations in the structure of the water balance (water budget) of catchment areas, and above all, to an increase in the frequency and extent of droughts and a reduction in water resources [35]. Action is therefore needed to mitigate the future effects of climate change. Negative changes in the quantity of water resources mean that the demand of the human population and nature for water is not met in full; they also lead to an increased occurrence of contamination of water for public supply, periodic local deficits of water for public supply, and periodic water shortages for irrigation in agriculture and forestry. An acceleration of the hydrological cycle can lead to more and more frequent extreme water-related events—both droughts and floods. In order to reduce the risk of flooding, it is necessary to extend the existing retention systems by building dams and dry polders and developing solutions for the so-called “small retention” of rainwater [35]. Local measures also need to be taken to retain and use rainwater flowing from the roofs of single-family houses or public buildings.
The goal of this paper is to present data on changes in the amount of rainwater in the Roztocze National Park (RNP) in Poland in the years 2001–2020 and discuss the possibilities of using the rainwater for various purposes in the context of the climate change taking place in this protected area.

2. Materials and Methods

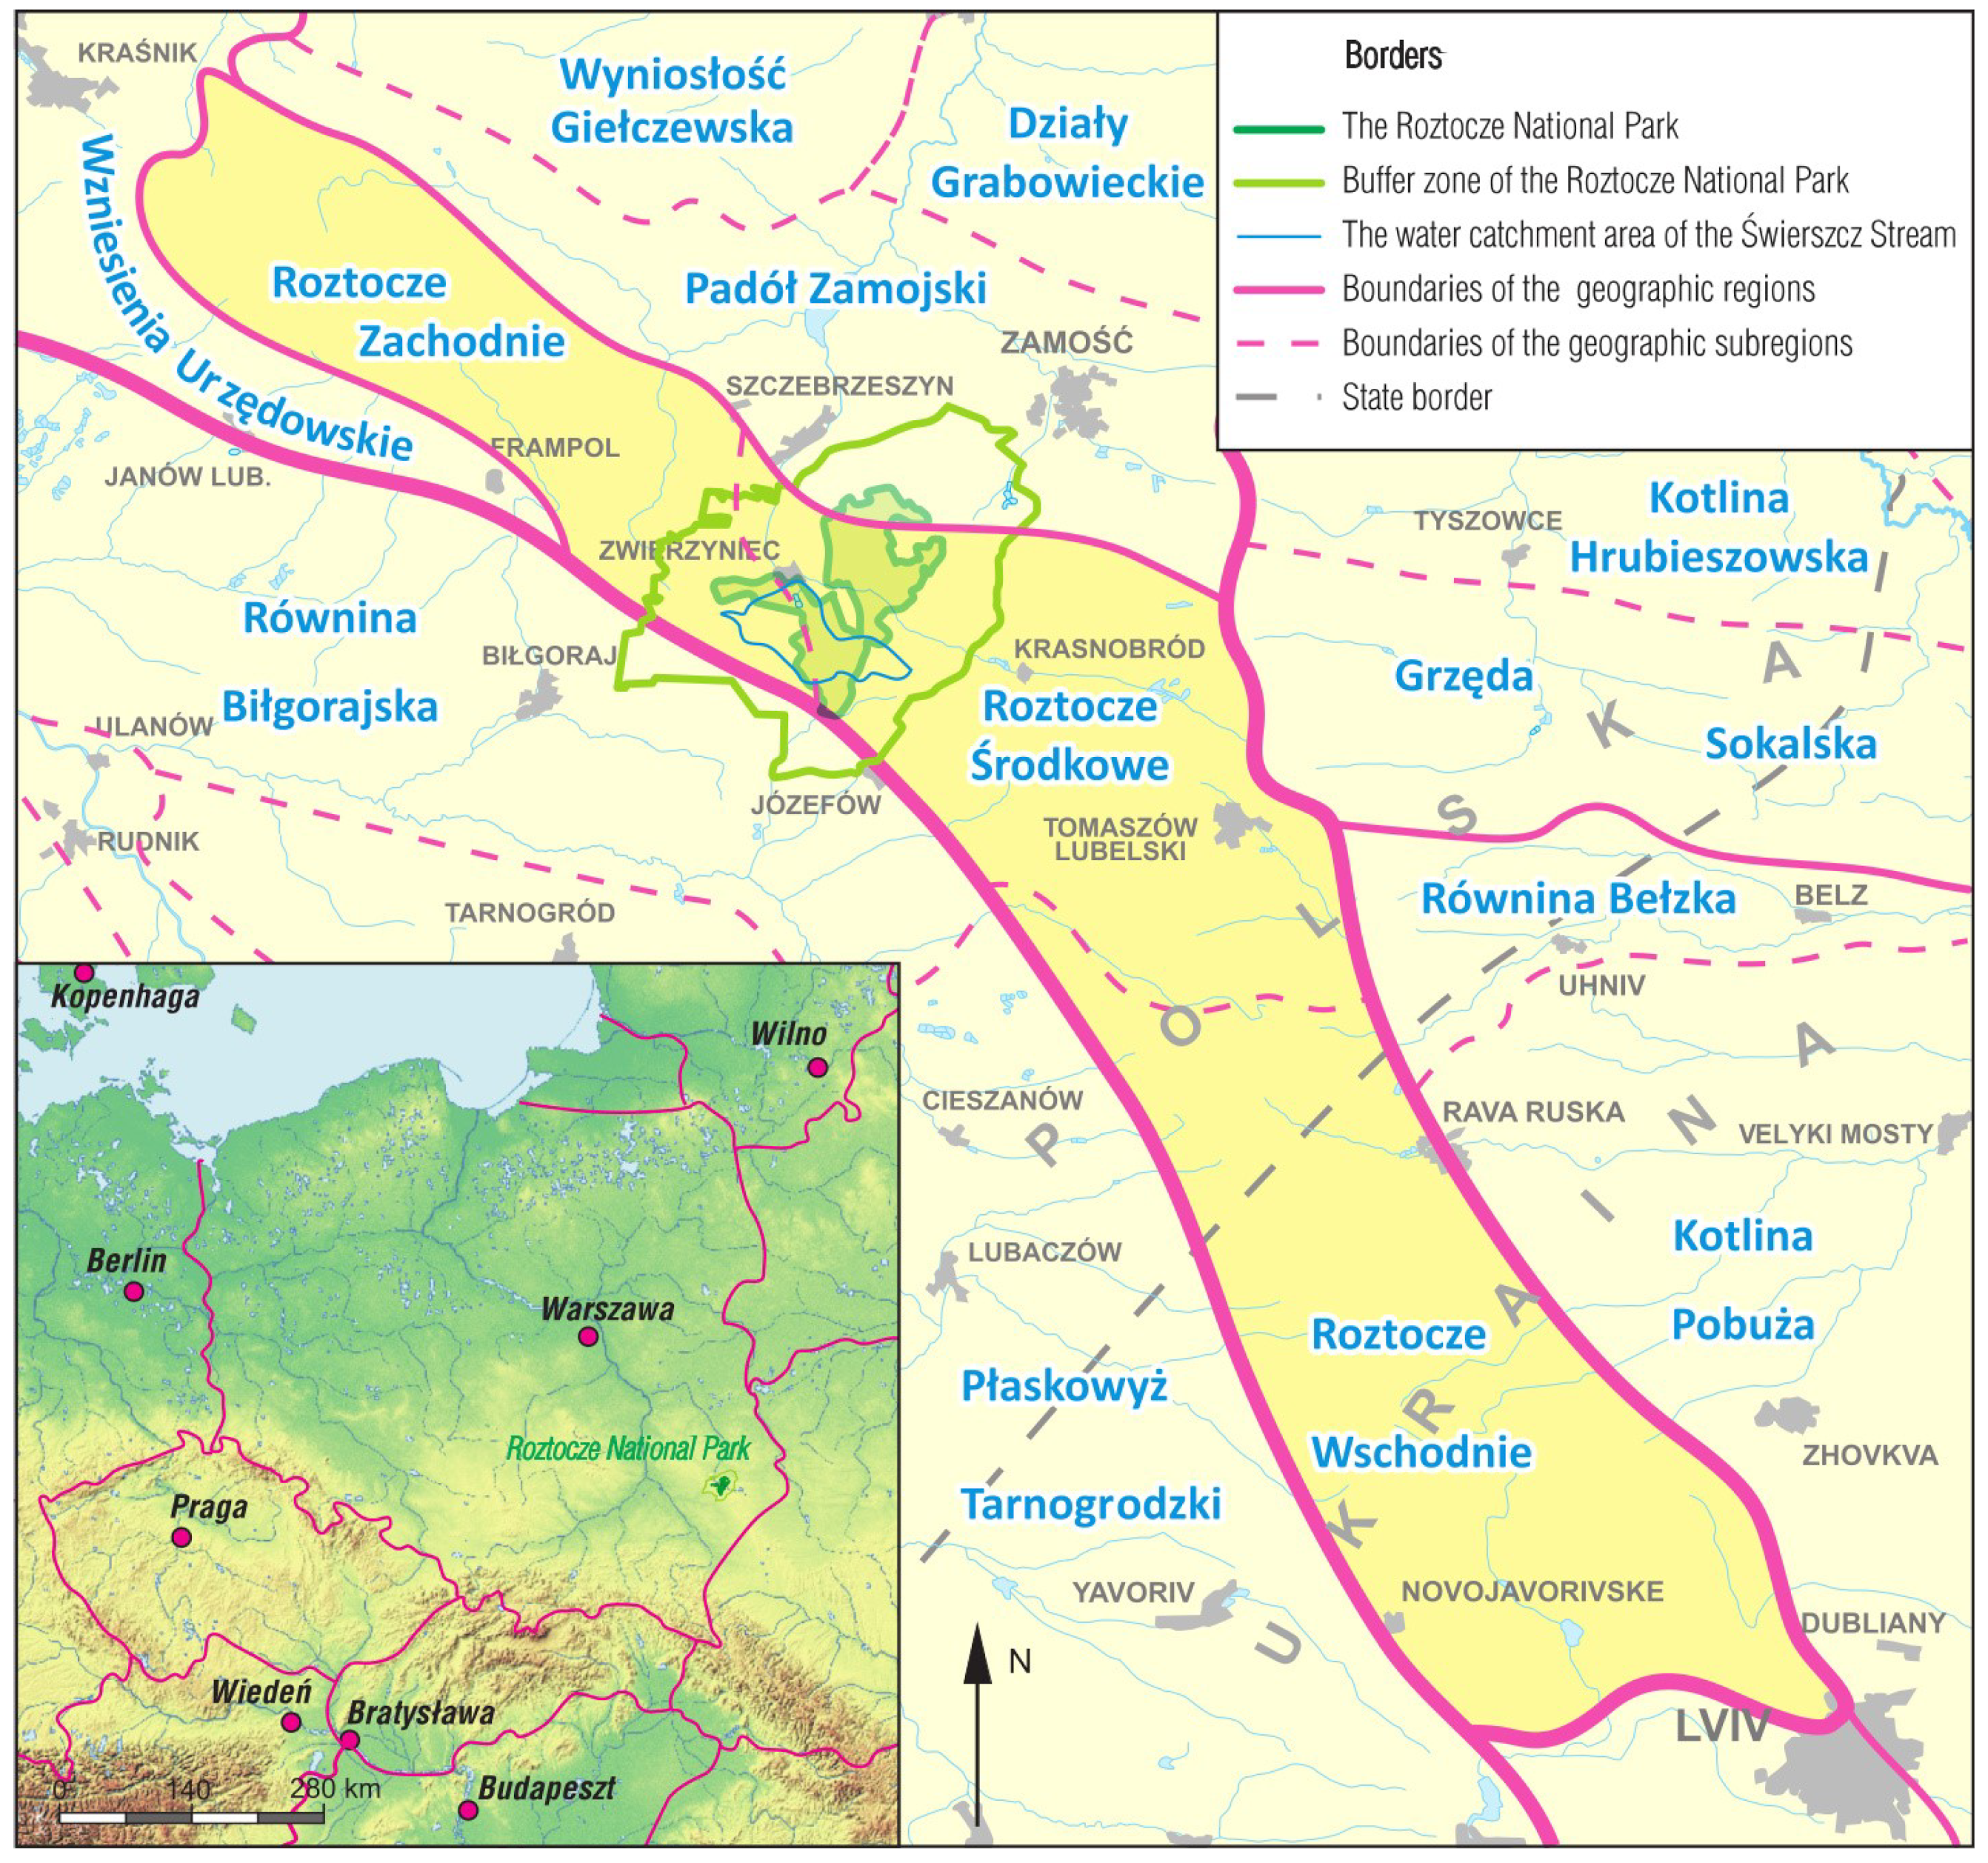
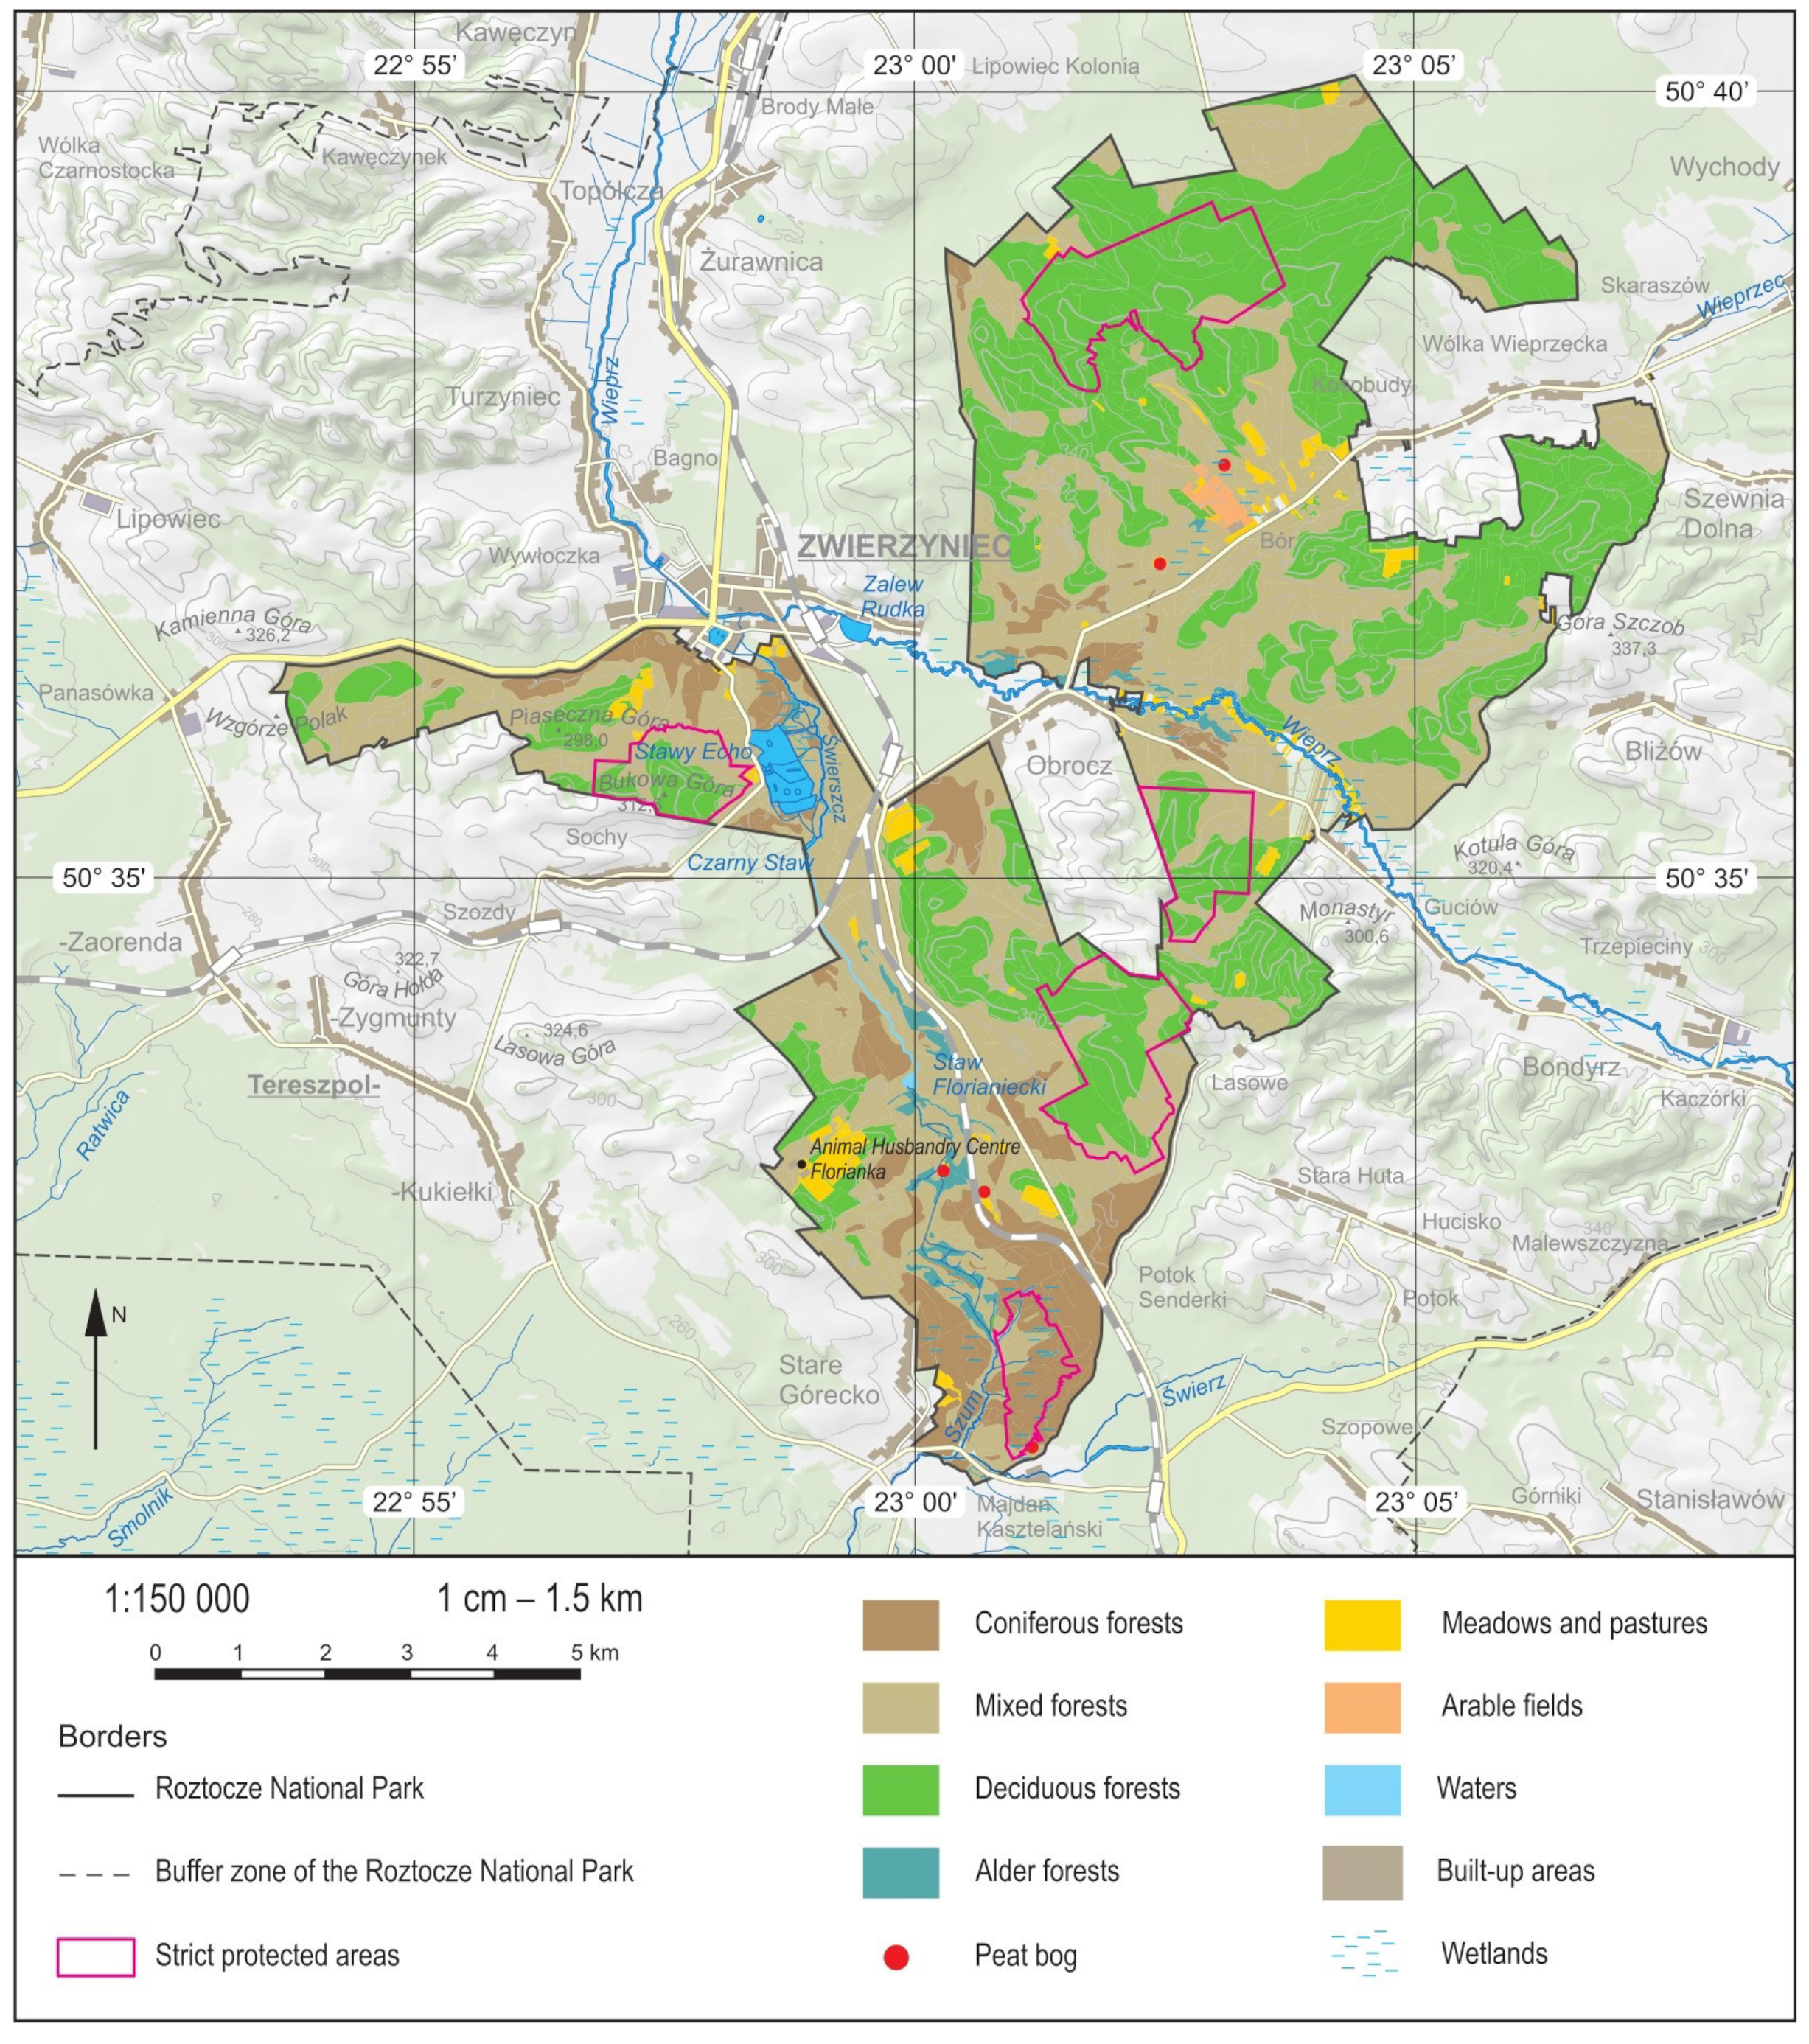
2.1. Characteristics of the Study Area

RNP is located in Roztocze, which is a region situated on the border between Poland and the Ukraine, in Southeastern Poland (Figure 1). It is a region that forms a natural borderline visible as a narrow belt of limestone hills connecting the Lublin Upland with Podolia. It differs from the neighboring lands in its geological structure, topography, climate, hydrological regime, soils, and vegetation. The region has many peculiar features, including a well-preserved, distinctive landscape, which is unique in Europe [36,37]. About 95% of the RNP is covered with various types of forests [38].
The RNP covers an area of 8482.83 ha and is one of Poland’s 23 national parks. It was established in 1974 to preserve the natural and cultural heritage of the Roztocze region and provide access to it for scientists, tourists, and recreation visitors in a way that would not adversely affect the protected object. According to the Nature Conservation Act, it is also one of the Park’s tasks to provide nature education experiences [40].
In Romer’s division of Poland into climatic regions [41], the climate of Roztocze was classified as a Central Uplands climate of the region of the Lublin–Lviv Uplands and Ridges (D4). The climate of the RNP is a temperate, transitional climate, which has slightly more continental features compared to other areas of Poland [42]. The area of the RNP is one of the coolest in the region. The average annual air temperature varies from 7.4 to 7.5 °C and is about 1–2 °C lower on the hills. Annual precipitation is usually 600–650 mm. The RNP has a moderately high insolation, with average annual sunlight hours ranging from 1550 to 1600. The park displays a considerable topoclimatic diversity related to its varied topography (which leads to variability of exposure), large elevation differences, and a plant species composition which determines the height and density of the vegetation cover [42].
The area of the RNP has a very sparse network of surface waters. This is mainly due to the high permeability and water capacity of the bedrock, which retains water from precipitation. Surface waters cover only 52.6 ha, which is 0.62% of the total area of the RNP. Groundwater is found in porous-fissure rocks of the Upper Cretaceous, occurring as marls, opokas, and gaizes, and in sandy sediments and Quaternary gravels filling buried river valleys. In the river valley zones, the waters of the Cretaceous layers merge with the waters contained in alluvia, creating a common circulation-and-drainage system, the so-called Roztocze Water Level, which is characterized by large resources of groundwater [43].
In the central part of the RNP is located the catchment of the Świerszcz River, along with the complex of Echo Ponds (Figure 2), which covers an area of 4651 ha, 40% of which lies within the park. The RNP is a Natura 2000 habitat area coded Central Roztocze PLH060017 and part of a Natura 2000 bird sanctuary coded Roztocze PLB060012. The remainder of the bird sanctuary is located within the RNP’s buffer zone [44,45].
The map shows the coverage of the territory of the RPN in which the Animal Breeding Center is located. A total of 93.81% of the park is covered with various types of forests. The predicted climate changes will also affect the structure of forests in the Roztocze area. As it is known, the main factor influencing the diversification of species growth is the availability of water, which is conditioned by the level of rainfall and losses caused by evapotranspiration [46]. The land-cover map shows the natural context of the changes taking place.

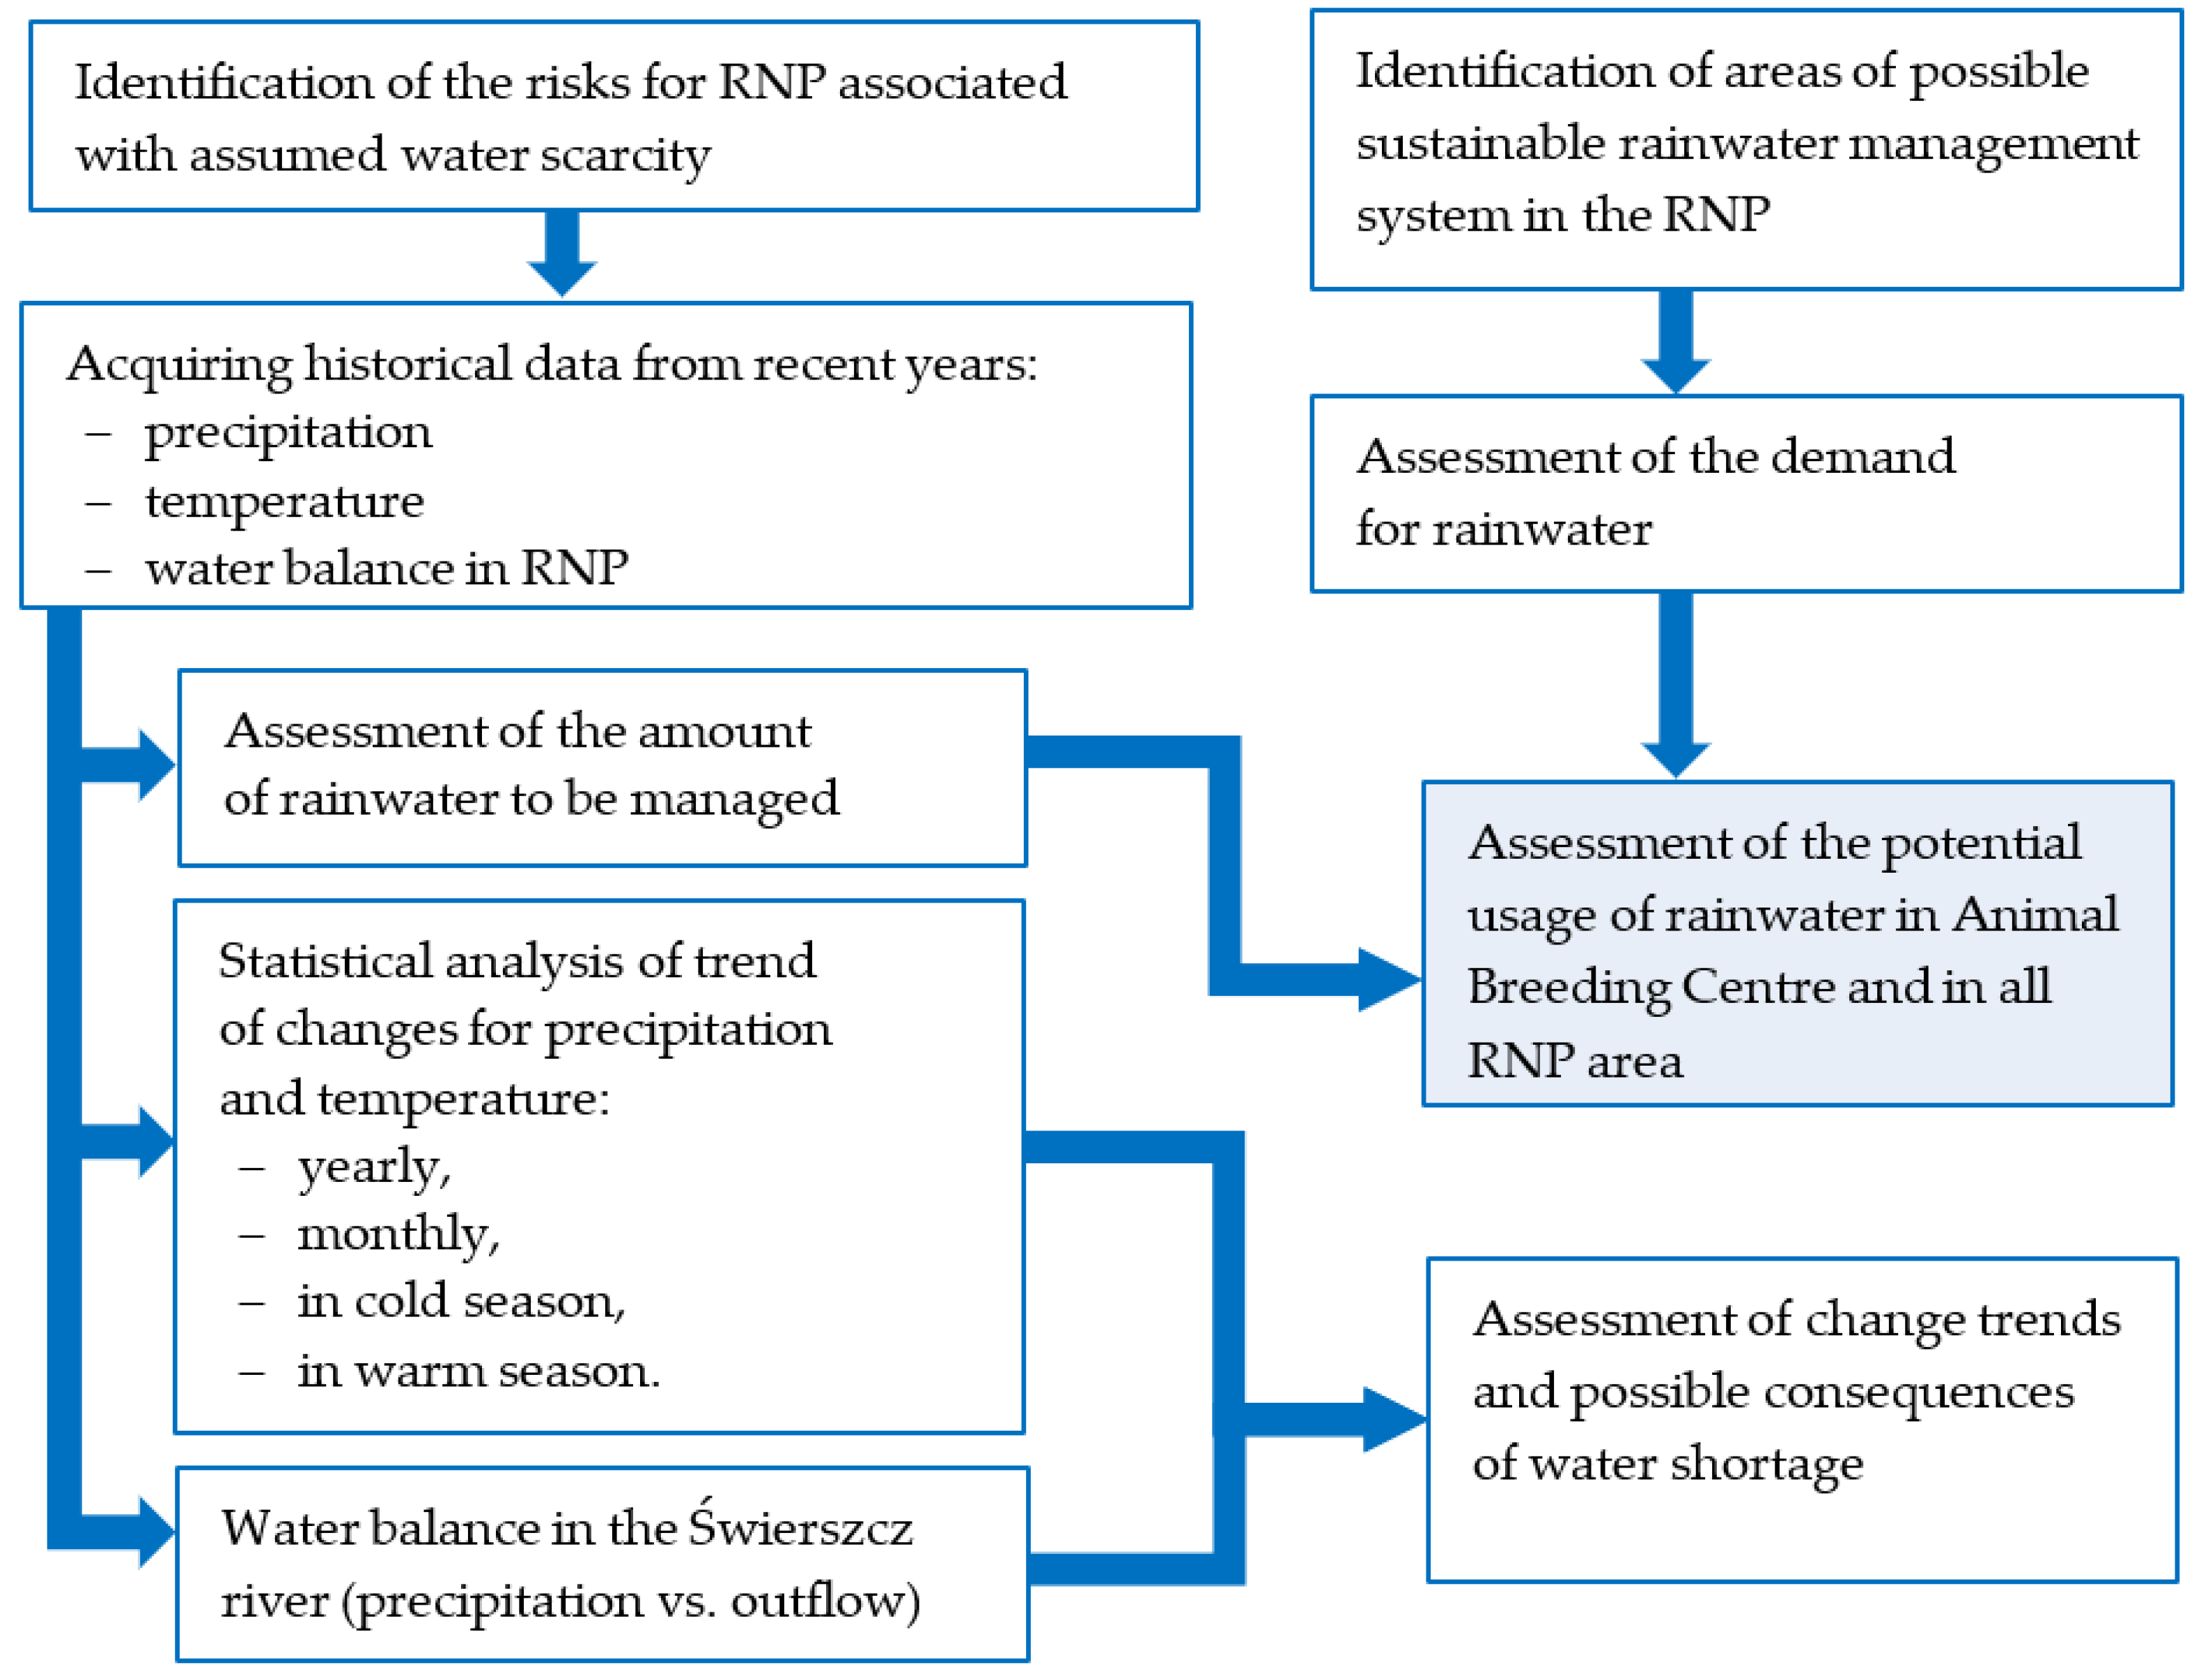
2.2. Scope and Statistical Analysis

The literature data regarding climate change in the RNP were gleaned from monographs on the RNP and the Roztocze region [42,47]. Changes in the precipitation levels in the area of the RNP in the years 2001–2020 were determined on the basis of data coming from the Reports of the “Roztocze” Base Station of the Integrated Monitoring of Natural Environment (BS IMNE), which belongs to the RNP, and from the Chief Inspectorate for Environmental Protection (CIEP), which operates under the Integrated Monitoring of Natural Environment (IMNE). The missing data were obtained from the Roztocze Scientific Station in Guciów, affiliated with Maria Curie Skłodowska University (MCSU) in Lublin. The IMNE measurement data meet the relevant standards and norms and are based on proven and comparable field research and laboratory analysis methods. The methodological assumptions of the IMNE, a compilation of data on the measurement system, methods of laboratory analysis, and the principles of collecting and processing measurement results are presented in a study from the series Biblioteka Monitoringu Środowiska (Environmental Monitoring Library) [48]. The study also presents a conception of a system for the harvesting and utilization of rainwater designed for the RNP’s Animal Breeding Centre (Ośrodek Hodowli Zwierząt) in Florianka and discusses the possibility of using rainwater in all public utility facilities in the RNP. The aspects covered by the research and methodology adopted in the analysis are presented in Figure 3.
Two statistical analyses were performed to assess changes in the value of the sum of precipitation and air temperature. In the first one, mean precipitation and air temperature values for the RNP were compared between two decades (2001–2010 and 2011–2020), using one-way analysis of variance (ANOVA). Comparisons of mean values for precipitation and air temperature were made for various periods, namely all-year-round, cold season, warm season, and for each month separately, in order to get a more accurate overview of the observed changes. The second analysis was aimed at determining the trends of changes in air temperature and precipitation in relation to the subsequent years of the studied period. The precipitation and air temperature trends over the study period were determined by using linear regression. Pearson’s correlation coefficients, r, between the study year and precipitation and between the study year and air temperature were calculated. As in the case of ANOVA, these trends were analyzed whole years, warm and cold seasons, and for each of the months. Statistical calculations were performed by using Tibco Statistica v. 14 software [49]. Statistical differences were determined at the significance level of α = 0.05.

3. Results

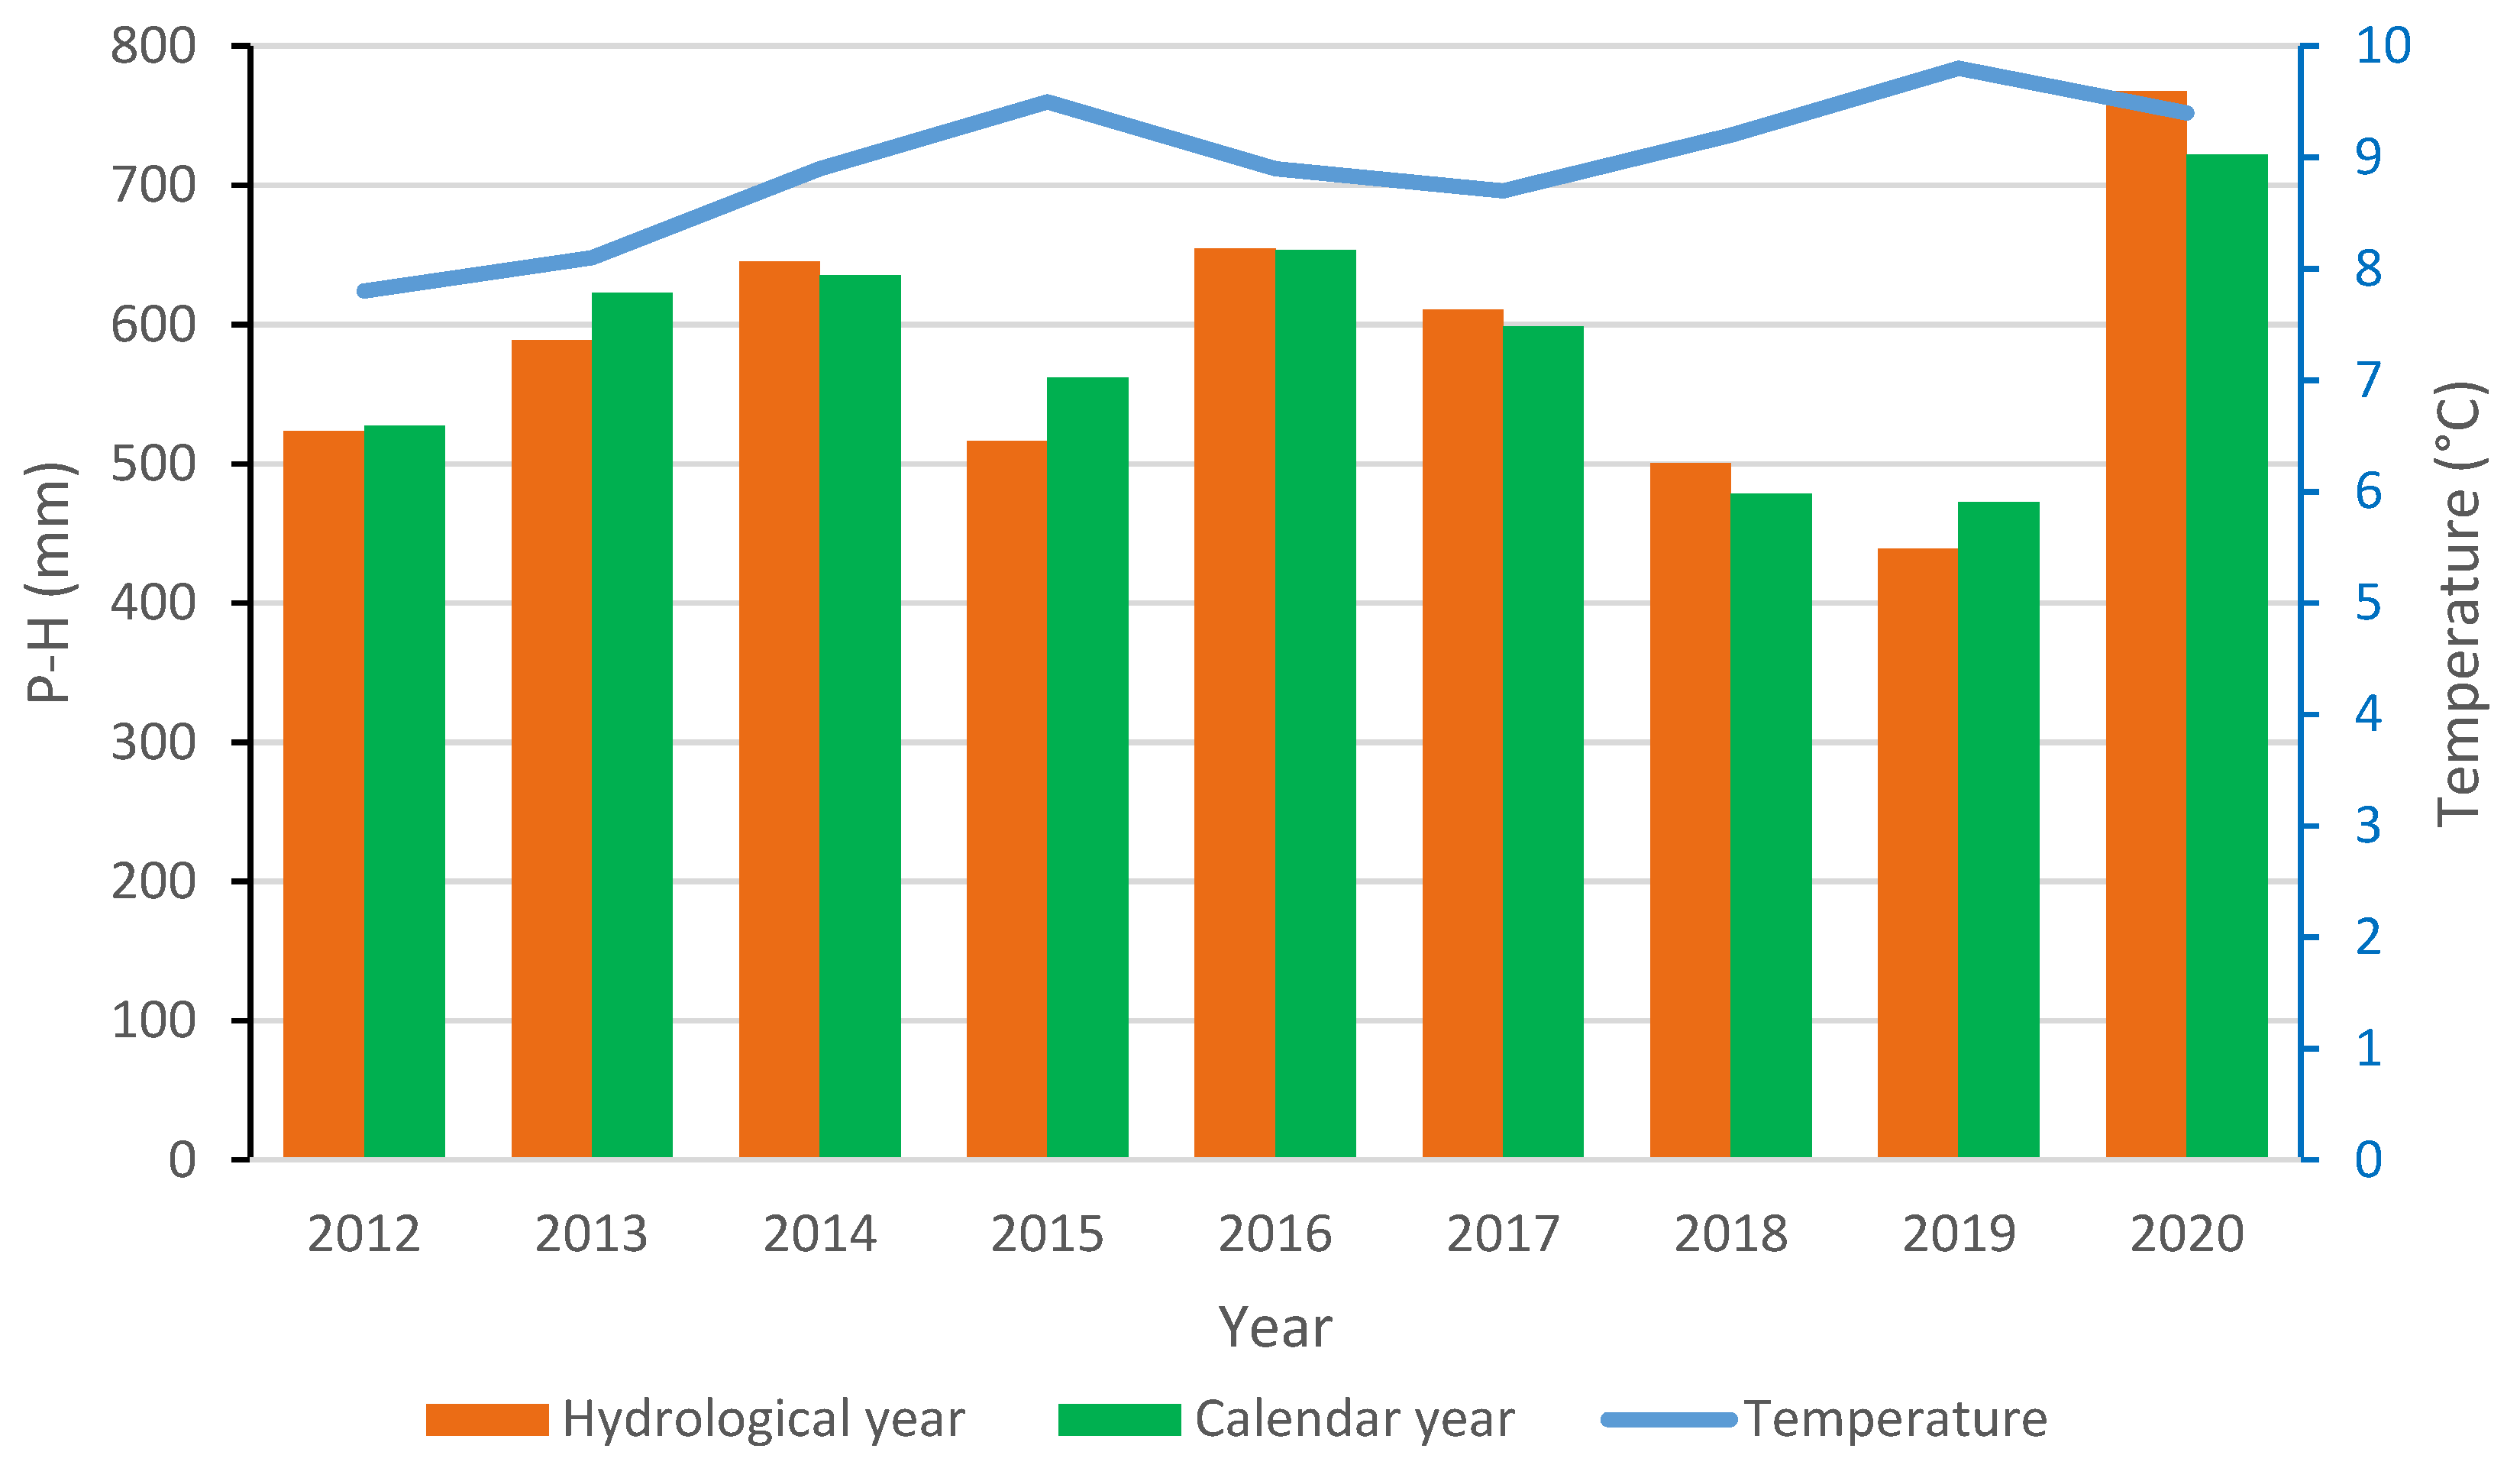
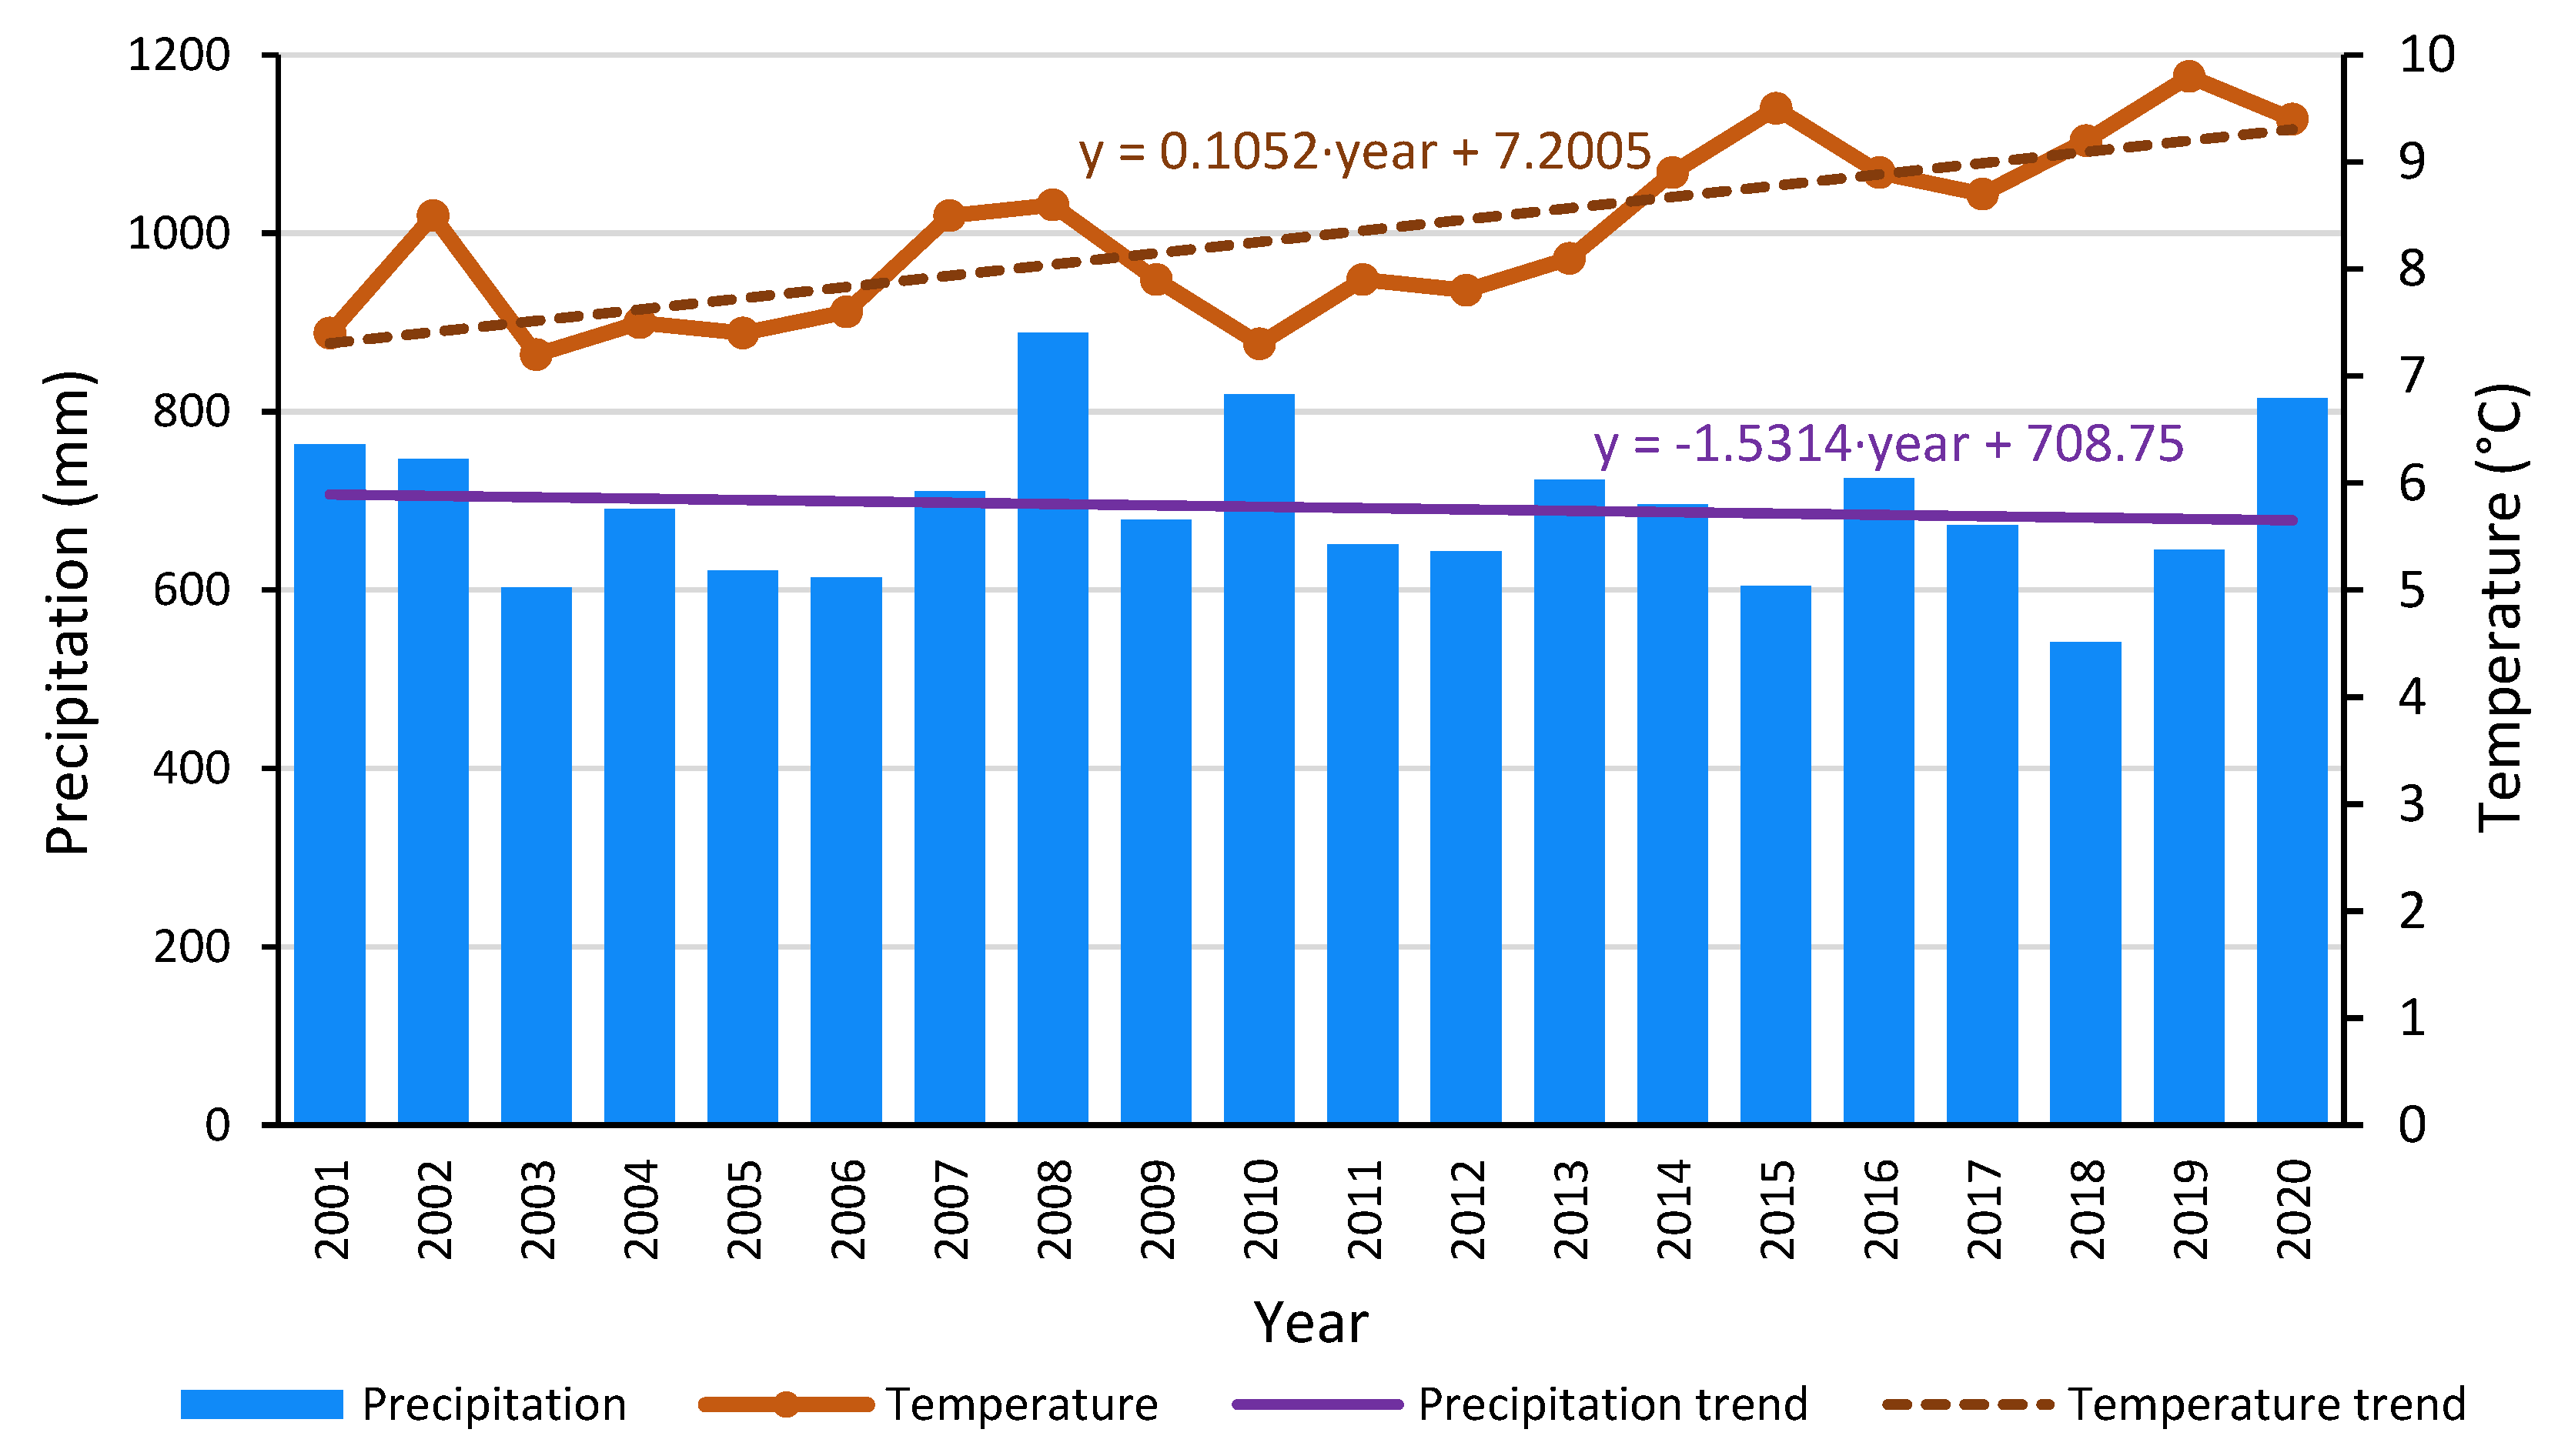
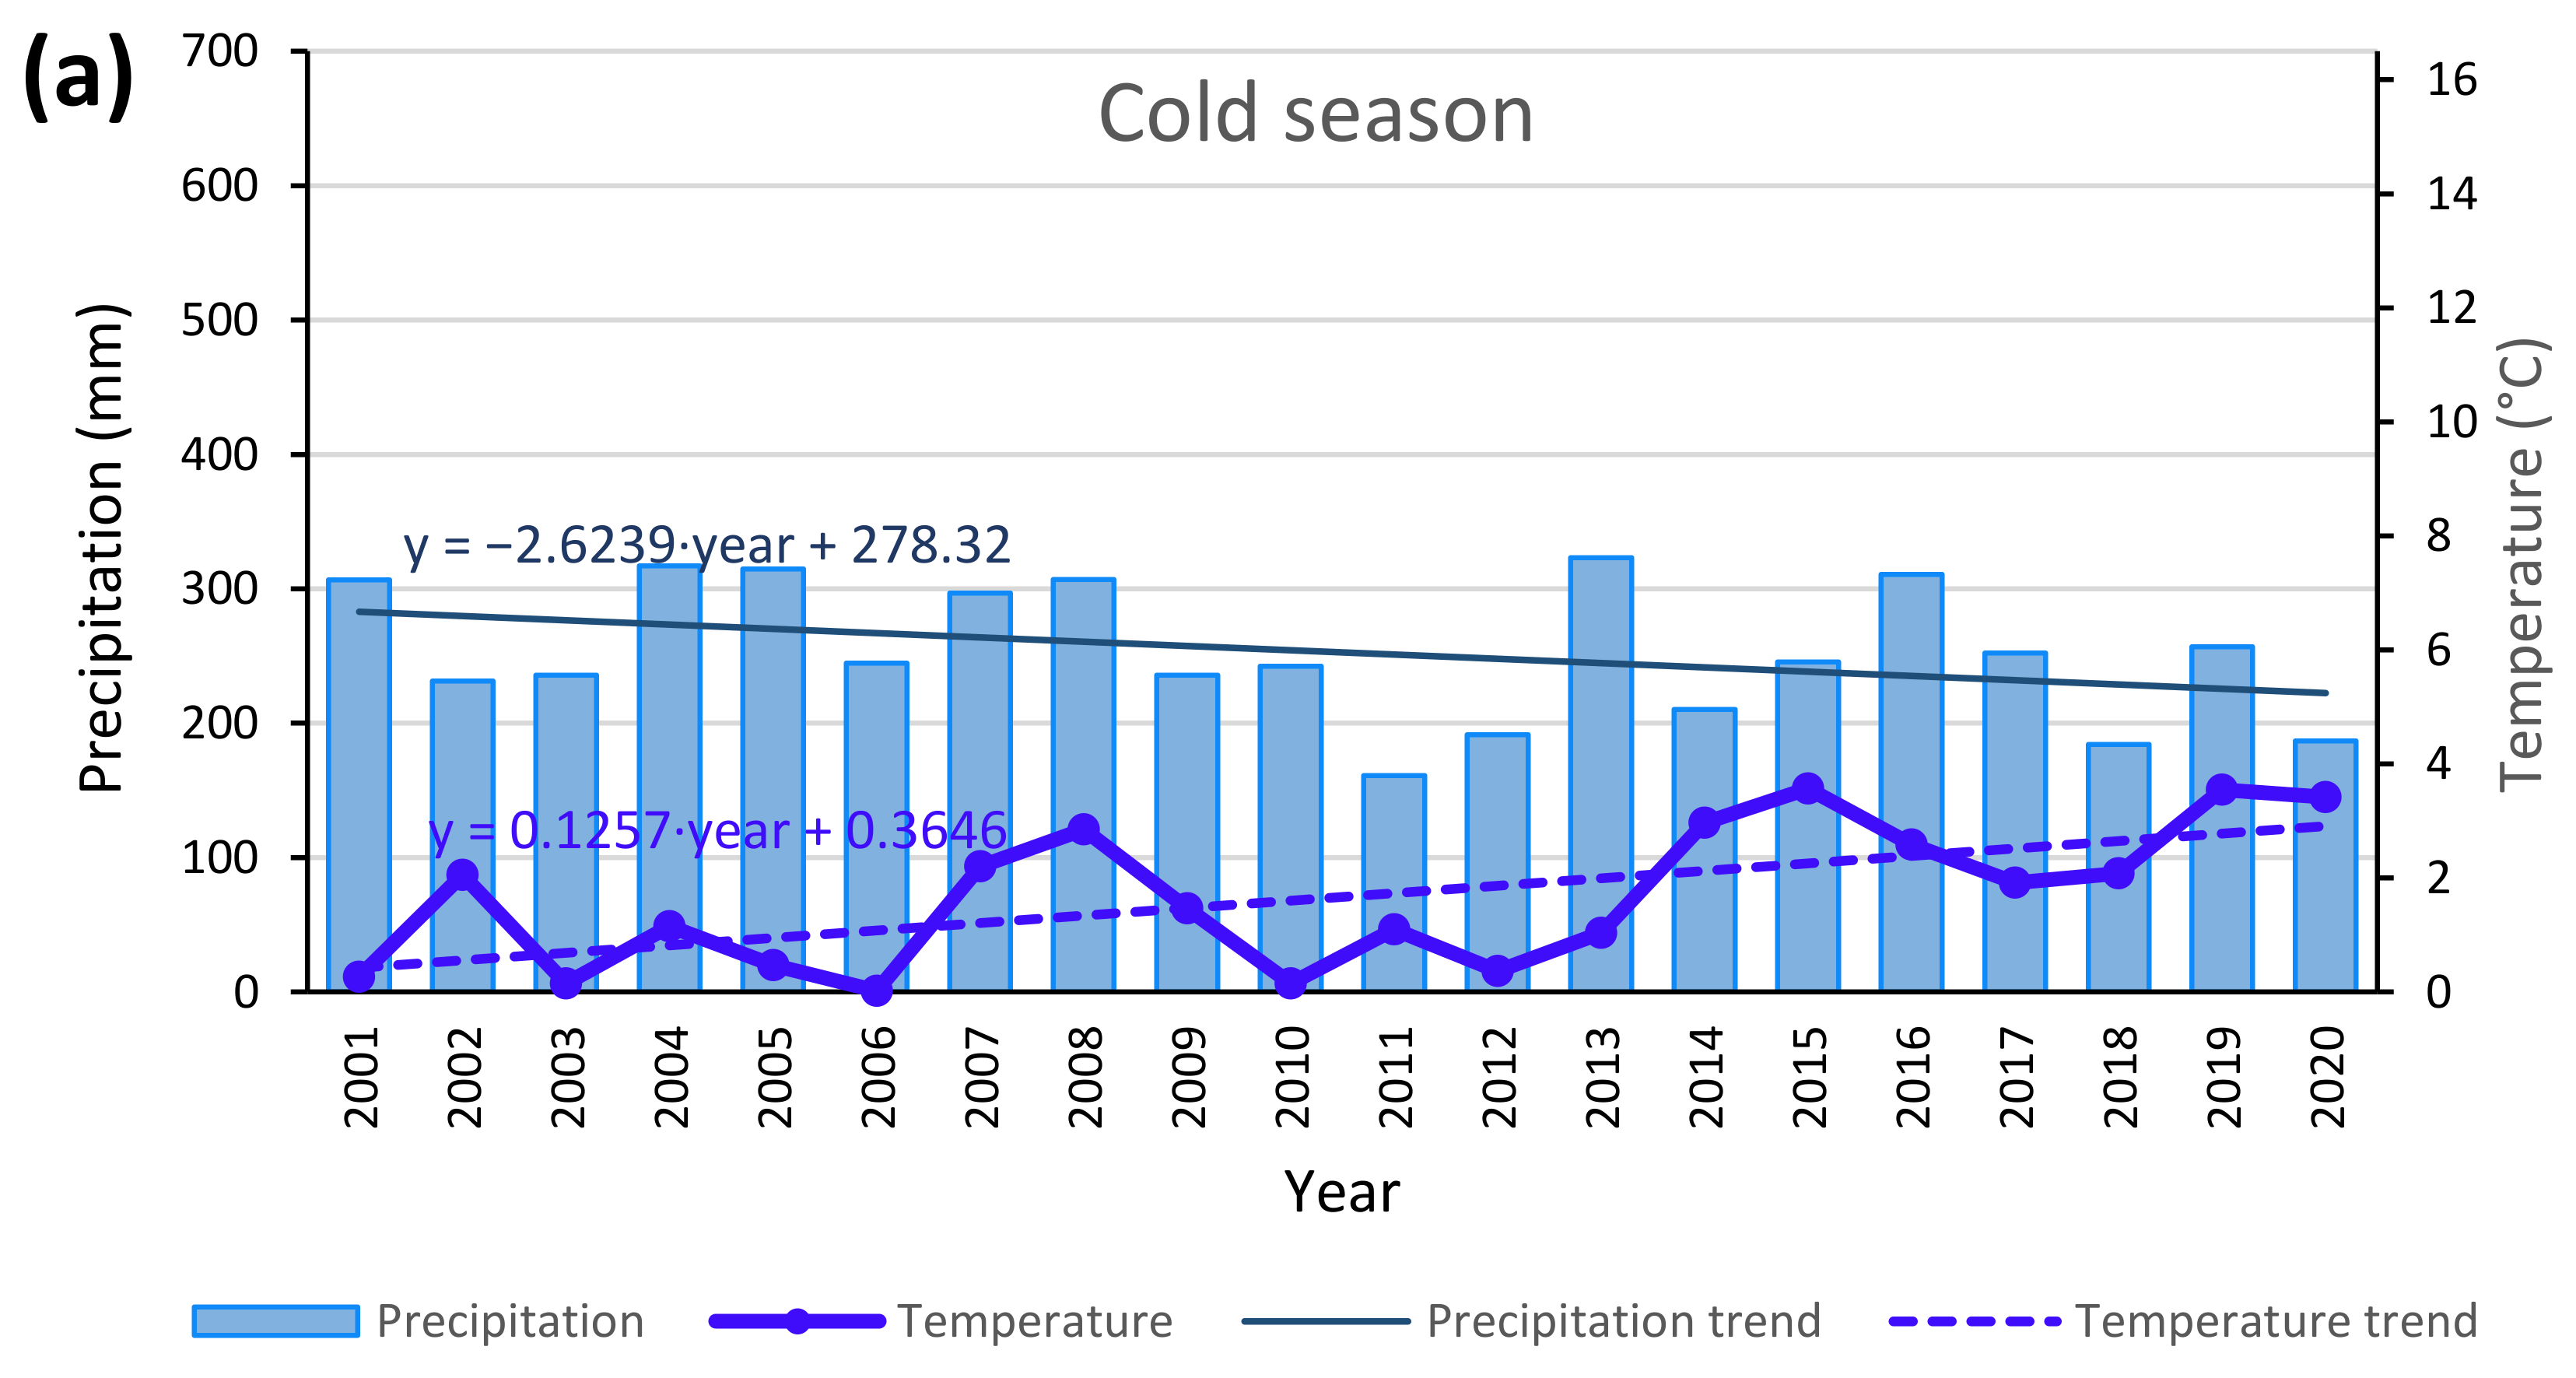
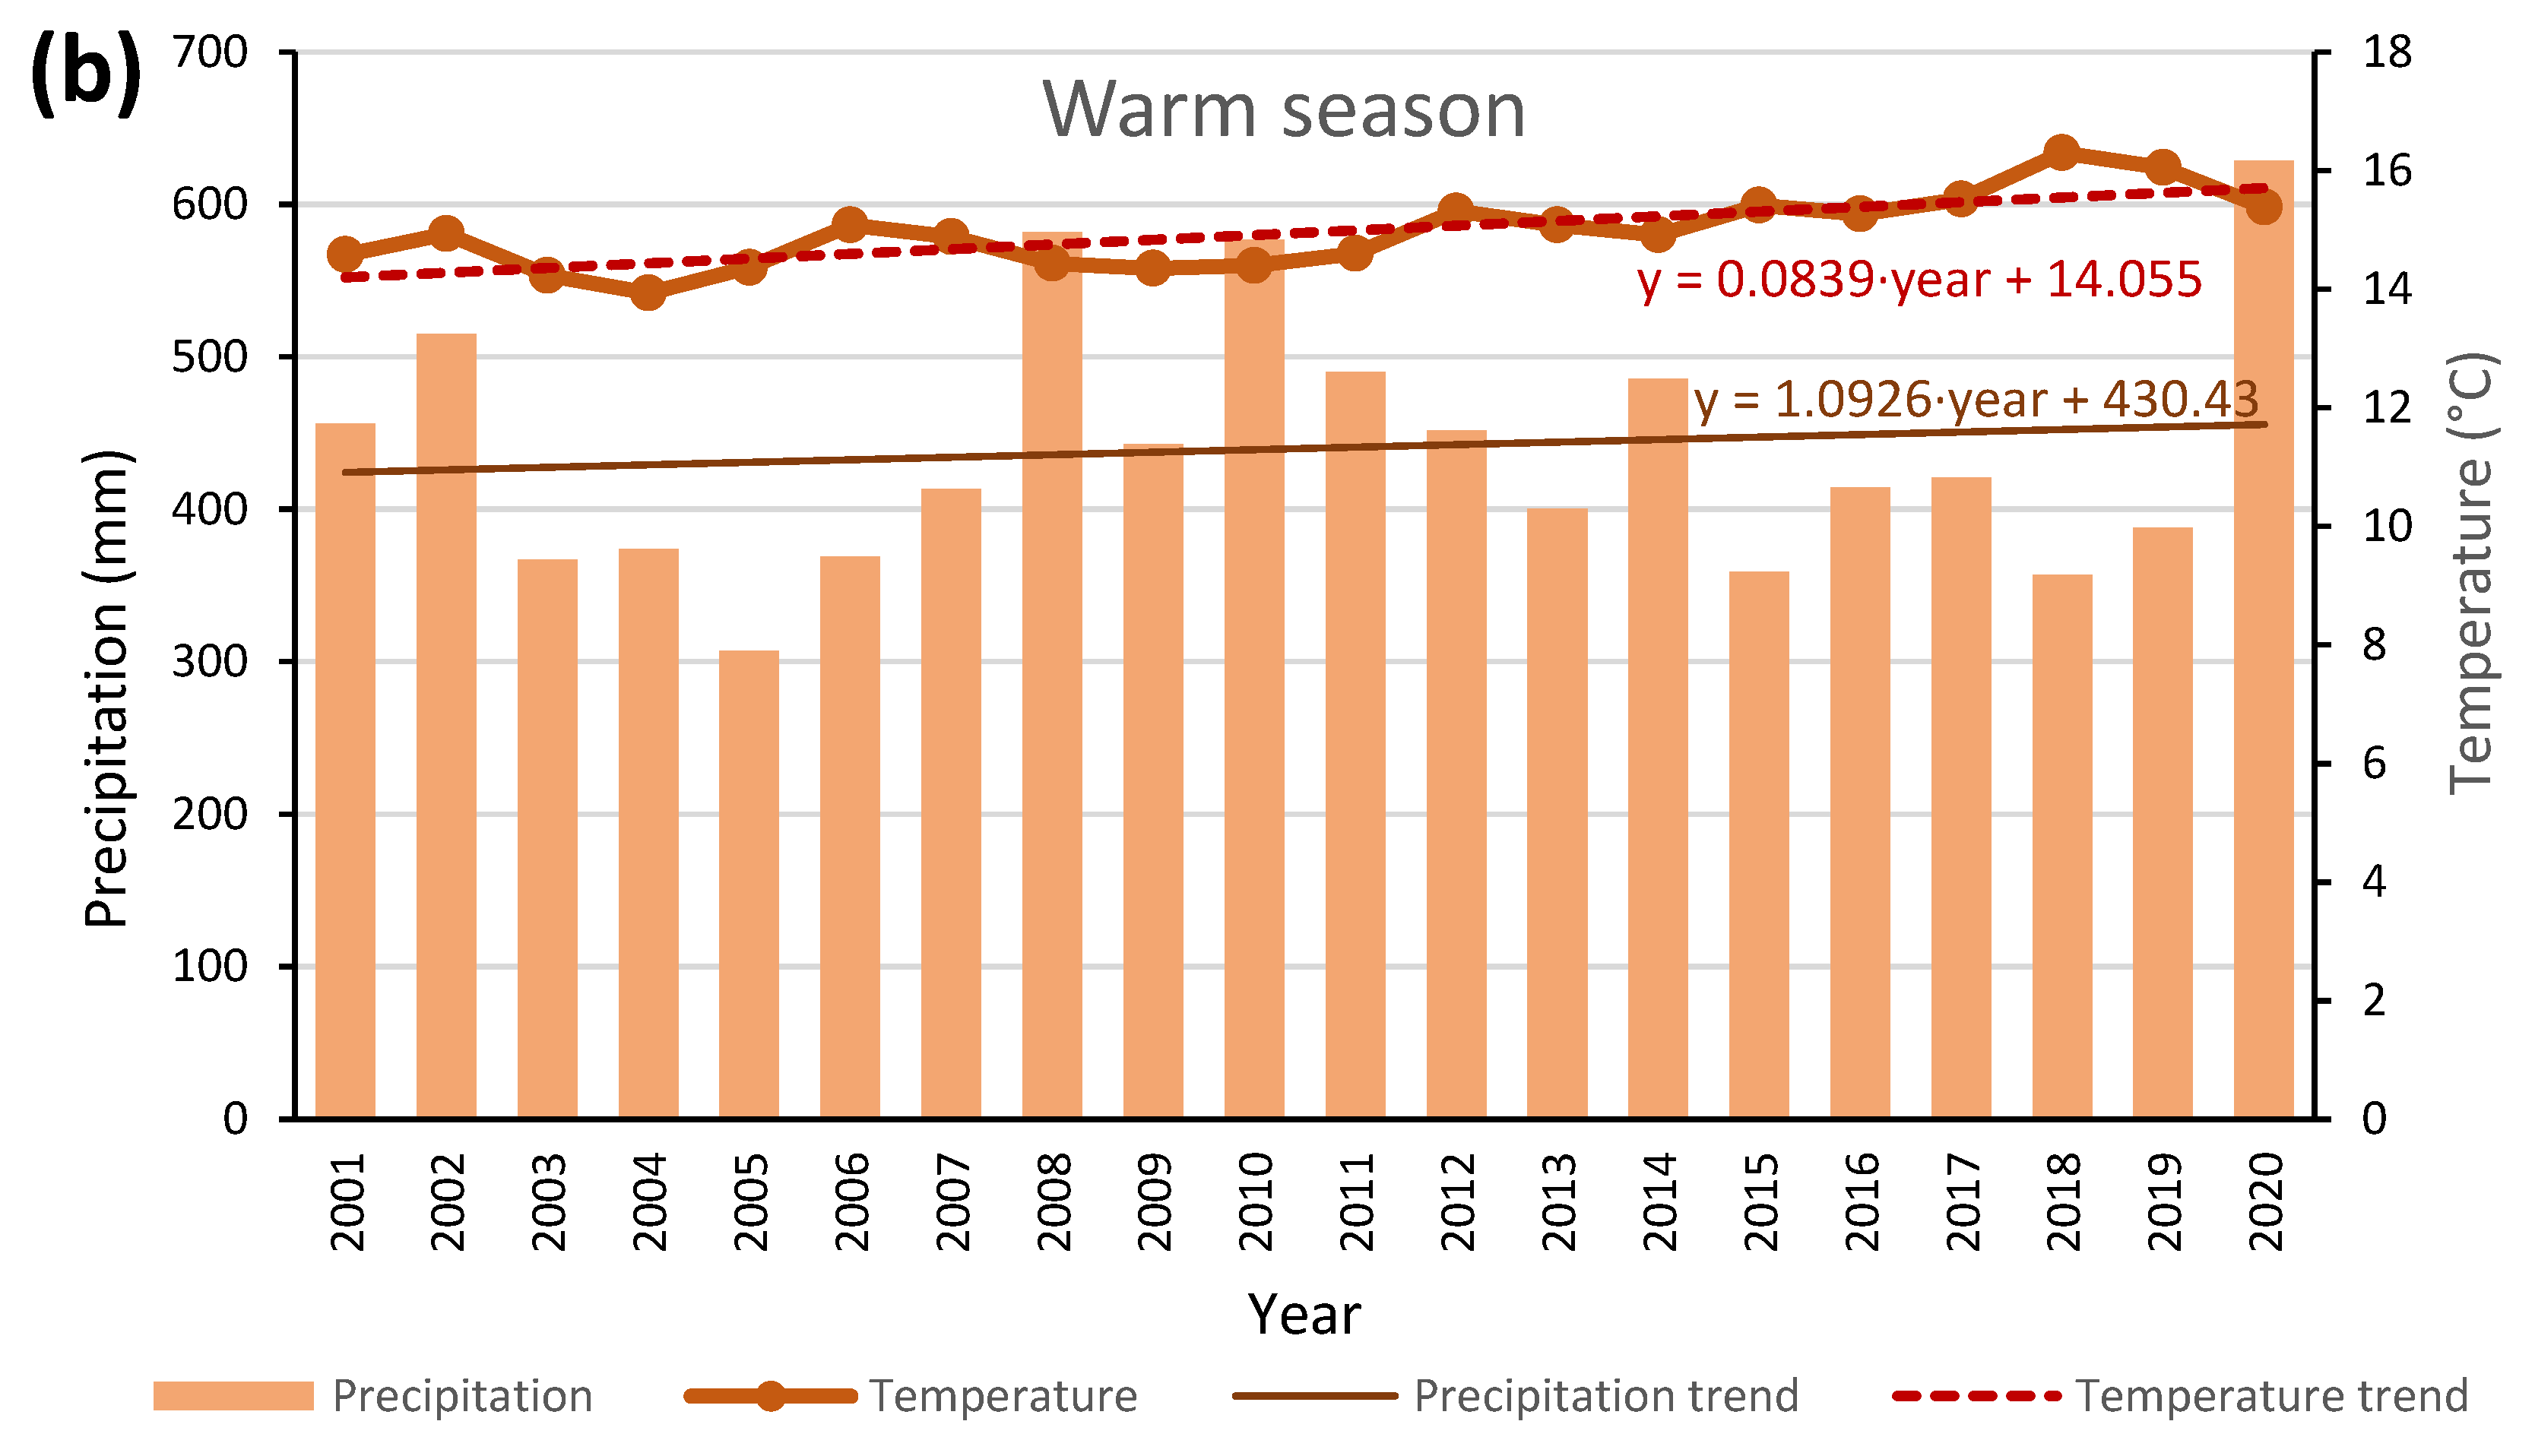
3.1. Changes in the Precipitation Level and the Water Balance in the RNP in 2011–2020

Studies conducted by the RNP as part of the IMNE program of CIEP’s State Environmental Monitoring show the unfavorable changes in the hydrological regime of the RNP that had occurred over the past ten years (2011–2020) [50]. In May 2020, the level of Cretaceous groundwater recorded in the Roztocze National Park was the lowest in the entire history of measurements which had been conducted since 1986—the water table was 17.5 m below ground level (b.g.l). It was 3.50 m lower than the highest level recorded in mid-June 2013 (13.92 m b.g.l). This situation was caused by a decrease in the precipitation levels, a distribution of precipitation that was unfavorable from the point of view of nature (especially a lack of a snow cover in winter), and an increase of approx. 2.0 °C in the average annual temperature. All of this gave rise to a periodically negative hydrological balance in the territory of the RNP, especially in the catchment of the Świerszcz River [50,51], resulting in a number of biotic changes. The simplified water balance of the catchment area of the Świerszcz River presented in Figure 4, which compares precipitation and outflow in the years 2012–2020, does not show a significant statistical change. Still, the decrease in the precipitation levels and the unfavorable distribution of precipitation across the year (no winter precipitation), as well as the increase in temperature in the years 2017–2019, led to a lack of water in Echo Ponds and resulted in the upper section of the Świerszcz River drying up.
On the basis of the collected data, it was found that the annual precipitation levels in the RNP in 2011–2020 were, on average, 41.75 mm lower than in 2001–2010, with the largest drop in the precipitation level occurring in the winter season (41.02 mm) and only a slight decrease observed in the warm period (by 0.73 mm).
The mean annual precipitation values for the two decades did not differ significantly statistically (ANOVA, p-values: 0.283, 0.067, and 0.362, respectively). No significant statistical differences were found either when each month was analyzed individually. The air-temperature data showed that, in the second decade (2011–2020) the annual air temperature was 1.03 °C higher than in the first one. In the cold season, the average temperature in the second decade was higher by 1.18 °C, and in the warm season, it was higher by 0.87 °C. These differences were statistically significant (ANOVA, p-values: 0.002, 0.026, and <0.001, respectively). When changes in average temperatures in the individual months were analyzed, significant increases were observed in the second decade in June (the mean higher by 1.51 °C, p = 0.022), August (1.28 °C, p = 0.005), September (1.69 °C, p = 0.002), and, the highest, in December (2.66 °C, p = 0.036). In the remaining months, the changes were not statistically significant, and a decrease was recorded only in July (by 0.23 °C).
Analogous results were obtained when the trends were analyzed by using linear regression: there was a decrease in the precipitation level and an increase in air temperature (Figure 5). As the regression line coefficients show, the average annual decrease in the precipitation level was 1.53 mm, which represents a total decrease of 30.6 mm between 2001 and 2020 (r = −0.11, p = 0.654). In turn, the average air temperature increased by 0.11 °C annually, giving a total increase of 2.1 °C (r = 0.77, p < 0.001) over the twenty-year period.
Regression lines obtained in the analysis of the trend in the amount of precipitation in the cold period (Figure 6a) indicate that precipitation fell annually by 2.62 mm, which corresponds to a decrease of 52.5 mm between the beginning and end of the study period (the years 2001 and 2020) (r = −0.32, p = 0.174). In the warm period (Figure 6b), a slight upward trend was recorded, with precipitation increasing by 1.09 mm annually (21.9 mm over the 20-year period, r = 0.08, p = 0.752).
The p-values show that these correlations are not statistically significant, and the upward trend in the warm half-year was influenced by a large amount of rainfall received in the last year of the study (2020). In the case of air temperature, statistically significant upward trends were recorded both in the cold and the warm season. The temperatures in the cold half-year increased by 0.13 °C annually (by 2.61 °C over the 20-year period, r = 0.62, p = 0.004), and in the warm half-year by 0.08 °C (1.58 °C over the 20 years, r = 0.79, p < 0.001). The research we conducted shows that changes in air temperature in the RNP are not uniform. Decadal periods can be discerned in precipitation in the warm season.
Table 1 shows the trend in the amount of average precipitation in the years 2001–2020. December was the only cold month in which an increase in precipitation (by 0.48 mm annually) was recorded; in the remaining cold months, precipitation decreased. In the case of the warm months, the greatest changes were recorded in May (average annual increase by 0.19 mm) and July (average annual decrease by 0.17 mm). The correlation coefficient was not statistically significant for any of the months.
In the case of air temperature, significant increases were recorded in the following months: June (by 0.17 °C annually and by 3.48 °C over the 20 years, r = 0.68, p = 0.001), August (0.13 °C and 2.65 °C, respectively; r = 0.71, p < 0.001), September (0.15 °C and 2.92 °C, respectively; r = 0.64, p = 0.002), and December (0.26 °C and 5.29 °C, respectively; r = 0.54, p = 0.014). In the remaining months, the regression slope was not significantly different from 0 (Table 2).
The air temperature in the RNP in the 20-year period from 2001 to 2020 increased by 2.1 °C, which was a greater increase than that recorded in Poland [52,53,54] and in the world [55,56] in the previous periods (decadal increases by 0.2–0.5 °C). A particularly large increase in temperature in the RNP in the period between 2001 and 2020 was recorded in December—by as much as 5.29 °C. Such a situation may lead to the occurrence of snowless winters in the future and more and more frequent dry periods in spring. Despite the lack of clear trends in annual precipitation totals in the RNP, large fluctuations in the amount of precipitation in the individual years caused an increase in the frequency of dry periods, which was also mentioned by Ziernicka-Wojtaszek and Kopciska [57]. This unfavorable situation is exacerbated by the downward trend observed in the share of winter precipitation in the annual total, as this contributes to changes in the natural environment in the RNP.

3.2. Natural Determinants and Consequences of the Climate Changes in the Roztocze National Park

Research conducted by the RNP as part of the IMNE program of CIEP’s State Environmental Monitoring shows that the natural environment of the RNP had experienced unfavorable changes over the past decade (2011–2020), especially in the catchment area of the Świerszcz River [50]. The ongoing climate change has led to adverse changes in the natural environment and the human socio-economic environment.
Water shortages, thermal and precipitation conditions which are unfavorable for trees, and the lowering of the groundwater level have affected the main forest-forming species of the RNP. As observed by Szwagrzyk and Bodziarczyk [58], climate change has an adverse effect on the most important tree species in the Park—the Baltic pine (Pinus sylvestris). In the last few years, events such as drought and the massive outbreaks of the sharp-dentated bark beetle (Ips acuminatus) have resulted in a decline in Baltic pine stands, especially where the pine grows in fertile sites. If summers continue to be hot and dry, the dieback of the pine may considerably accelerate [58].
Through the Roztocze National Park runs the eastern border of the continuous range of the beech (Fagus sylvatica), fir (Abies alba), larch (Larix decidua), and spruce (Picea abies). The presence of beech and fir forests in this area as borderland communities and the tracking of their dynamics may be helpful in interpreting climate change. It is all the more important that Holly Cross fir forests (91P0) (Abietetum polonicum) occur only in Poland [59]. The fir trees growing in the forests of the RNP show two opposite trends. On the one hand, the share of fir trees in fertile sites, especially in beech forests, decreases due to the gradual loss of older trees; in recent years, this phenomenon has been accelerated by droughts. On the other hand, in poorer soils, especially under the canopy of pine, fir regenerates much better. Its growth in less fertile sites, however, may be hampered over time by water scarcity.
In recent years, a significant decrease in the population of spruce (Picea abies) has been observed in Poland, compared to all other tree species. It has been caused by adverse climate changes [58]. The temperature and rainfall conditions in the recent years have been unfavorable for trees, inducing the development of pathogenic fungi and leading to a dynamic increase in the population of cambio-xylophage and foliophage insects, which damage trees, threatening their health and sometimes also causing their dieback and falling out of stands [60].
In the last decade, a decrease in the level of groundwater has been observed in both deep Cretaceous aquifers and in shallower Quaternary waters, e.g., those of the peat bog complex “Międzyrzeki”. It should be emphasized that maintaining a high and stable level of the groundwater table in a peat bog ensures its longevity and proper functioning, as it prevents the destructive processes of peat rotting and encourages the development of vegetation appropriate for this extremely valuable ecosystem, which is endangered across Europe [50]. On a positive note, Szwagrzyk and Bodziarczyk [58] note that the coniferous swamps and swamp forests that grow in the peat bogs of the “Międzyrzeki” area are neither endangered nor subject to adverse changes. The current distribution and range of fragments of these forests confirm that this habitat has been stable over the last 30 years. Nevertheless, it should be borne in mind that the changes in the hydrological regime and the potential increase in eutrophication are the effects of the appearance of ecologically alien species.

3.3. Socio-Economic Determinants and Consequences of Climate Changes in the Roztocze National Park

It has been observed that climate changes in the RNP are manifested by a lack of water in the upper section of the Świerszcz River and in Echo Ponds. These changes were particularly acute in the years 2011–2020 and were found to have important social ramifications. Echo Ponds are open to bathers, and the operation of the bathing site constitutes a sort of social compromise included in the Plan for the Protection of the RNP [61]. The lack of water in Echo Ponds in the tourist season of 2020 caused the dissatisfaction of the local community and visitors to the park. Failure to understand the ongoing changes in climate resulted in numerous media “attacks” on the RNP in which the ponds are located. The scarcity of water caused social tensions and contributed to the negative perception of the RNP. Meanwhile, the employees of the Park, who continuously monitor the environment, noted the changes taking place and made good use of the low water level, performing repairs and maintenance on hydro-technical devices to ensure effective water retention. Small flows in the Świerszcz River led to an increased activity of the European beaver (Castor fiber), which built dams in the lower section of the river, thus increasing water retention.
The levels of surface waters and groundwater in the RNP also affect the rearing of Polish Konik horses (Equus ferus caballus), which are bred in a stud farm located in the catchment area of the Świerszcz River. This stream is a natural watering place for the herd, which lives in semi-natural conditions in the sanctuary. The stud farm where the Polish Konik horses are kept is supplied with water from a groundwater well located at the Animal Breeding Centre in Florianka. In the years 2011–2020, the groundwater level in the well in Florianka was observed to become lower and lower, and the efficiency of the well decreased. In the same period, a lack of water or a large drop in the water level was also found in the wells located in the northern part of the Roztocze National Park in the settlements of Krzywe, Stara Huta, and Sochy and in the catchment area of the Świerszcz River. Water shortages in the area of the Animal Breeding Centre in Florianka constitute a serious fire hazard, as the groundwater intake, due to its low efficiency, does not meet the legal requirements set out in the applicable regulations [62].

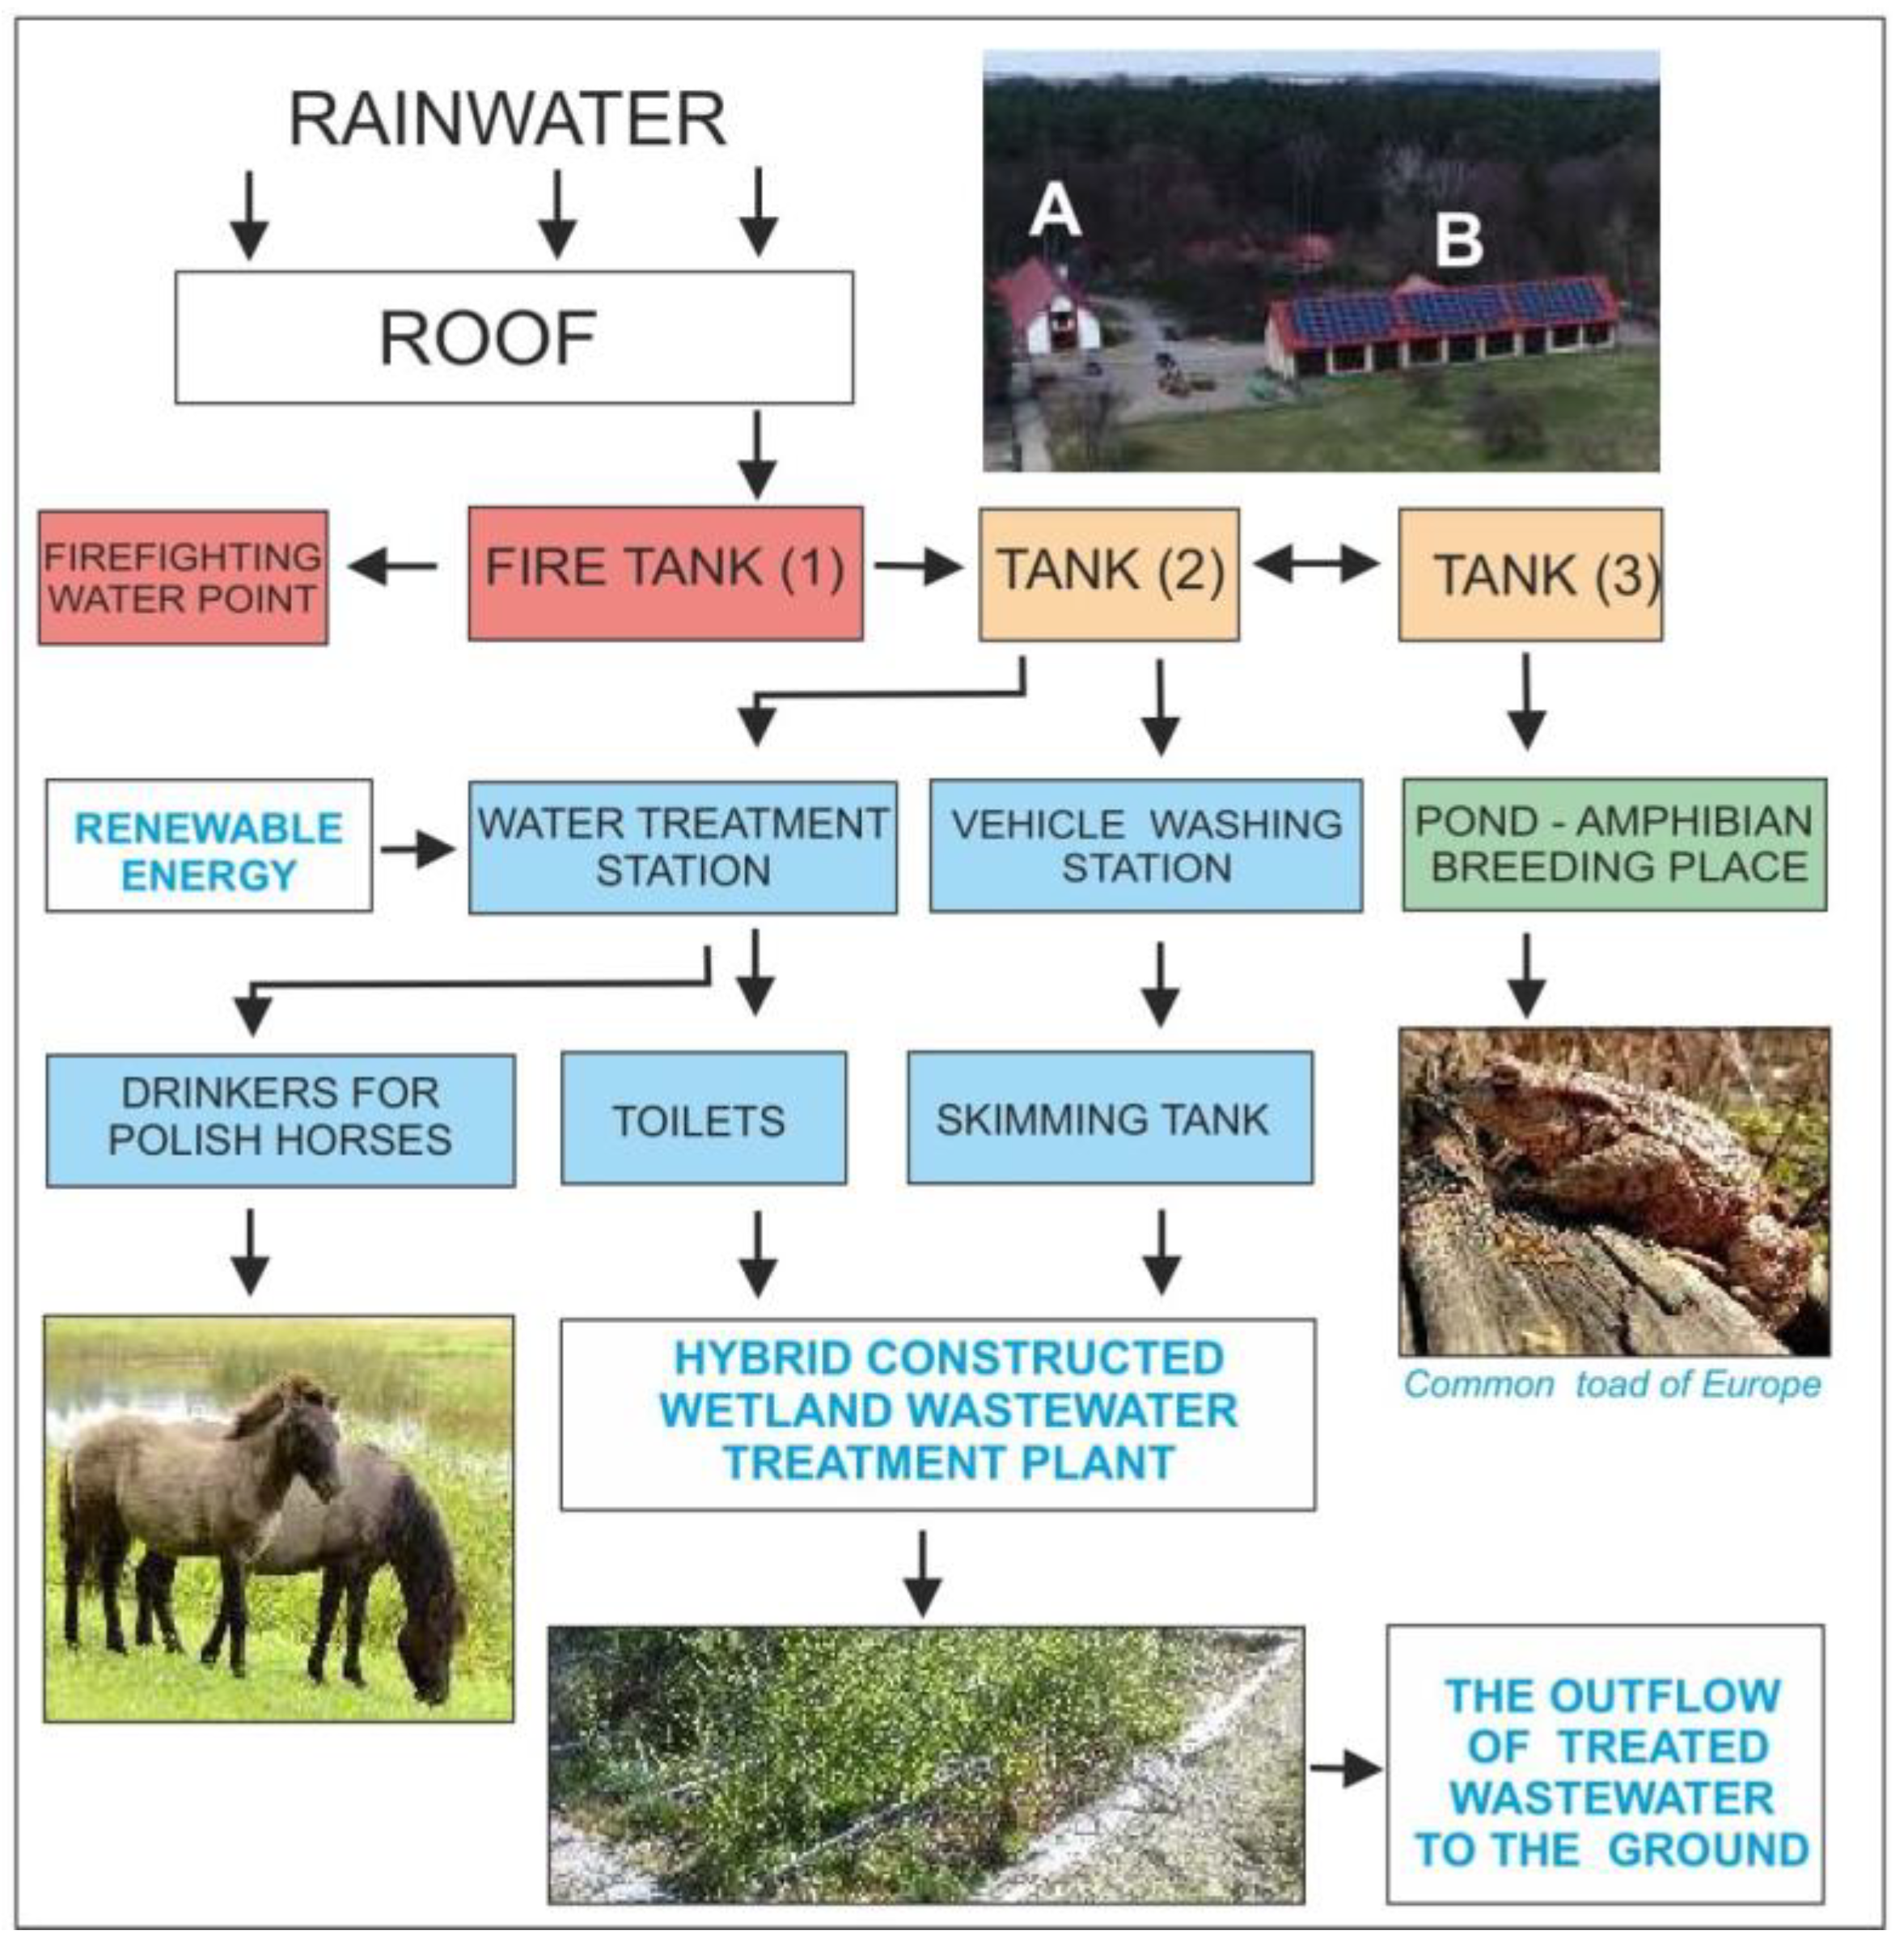
3.4. Conception of a Rainwater Management System for the RNP’s Animal Breeding Centre in Florianka

In order to quantitatively protect the Park’s decreasing water resources and limit the consumption of high-quality water, a decision was made to introduce rainwater retention and management solutions in the Park’s public utility facilities. Figure 7 shows a diagram of a rainwater management system which is planned to be built at the RNP’s Animal Breeding Centre in Florianka. The schematic of the installation was drawn on the basis of the Functional and Utility Program prepared by Grabowski et al. [63].
The Animal Breeding Centre runs a stud farm of the Polish Konik horse, and the Uhruska sheep and white-backed cattle, and maintains meadows and pastures to provide the animals with fodder. Aside from that, the Animal Breeding Centre is open to visitors. Annually, 2.5 thousand tourists visit Florianka, and 35 thousand pass through it in transit. The forest settlement Florianka is supplied with water from a 50 m–deep well located at an altitude of 264.2 m a.s.l. The average annual water usage in Florianka calculated from water-meter readings taken in the years 2018–2021 is 1137 m3. The decreasing groundwater level and the reduced efficiency of the well call for the use of rainwater.
The rainwater harvested from the planned installation is planned to be used for various purposes at the RNP’s Animal Breeding Centre. Treated by filtration and irradiation with a UV lamp, it will be used to water the Polish Konik horses and flush toilets. Untreated rainwater, on the other hand, will be used for fire prevention purposes and washing cars and agricultural equipment; excess water will be discharged into the nearby19th century ponds, which serve as a natural breeding site for amphibians. The design also assumes that the wastewater generated during the flushing of toilets and washing vehicles will be discharged, after appropriate pretreatment in a skimming tank, to the existing hybrid constructed wetland located in the neighboring settlement in Florianka, approximately 500 m away from the Animal Breeding Centre. The structure, efficiency, and reliability of the discussed treatment plant have been described in a study by Micek et al. [64].
The subsections below contain calculations regarding the water demand in the RNP’s Animal Breeding Centre and the amount of rainwater that can be harvested from the roofs of two farm buildings located at the Animal Breeding Centre.

3.4.1. Demand for Water for Different Usage in the RNP’s Animal Breeding Centre

To calculate the demand for water in the Animal Breeding Centre, we used the water consumption standards set out in the Regulation of the Polish Minister of Infrastructure [65] and quarterly water usage readings taken from the Centre’s deep water intake in 2018–2021. Table 3 shows the monthly demand for rainwater in the Animal Breeding Centre.
The data provided in Table 3 show that the total annual demand for rainwater in the Animal Breeding Centre was 894.5 m3. The greatest demand for water was for watering animals—almost 800 m3, which represented over 89% of the total demand. The data show that the demand for water was the highest in the spring and summer, from May to August, i.e., in the period when the precipitation levels were also the highest.

3.4.2. Determination of the Amount of Rainwater Flowing from the Roofs of the Animal Breeding Centre Buildings in the RNP

Field measurements and calculations show that the total area of the roofs of the Animal Breeding Centre’s two farm buildings (A—stable and B—barn) (Figure 7) from which rainwater will be harvested is 1191 m2. The roof area of building A is 467 m2, and that of building B is 724 m2.
The amount of rainwater flowing from the surface of roofs A and B was calculated by using a modified formula, Formula (1), previously used by Aladenol and Adeboye [66], Adugna et al. [30], and Villar-Navascués et al. [67]:
VRW = (TRA · AAR · SRC)/1000
where: VRW—volume of rainwater flowing from the roof surface during a year (m3); TRA—total area of roofs A and B (m2); AAR—average annual rainfall in the RNP in the years 2001–2020 (686 mm); and SRC—surface runoff coefficient—a dimensionless value (0.9) determined for smooth sheet metal roofs based on a study by Farrene et al. [68].
The calculations made using Formula (1) show that, on average, 735 m3 of rainwater, which can be used for various purposes, flows annually from the roofs of the two buildings (A and B) located in the RNP’s Animal Breeding Centre. There is a large variation in the amount of rainfall throughout the year, and Figure 8 shows the volume of water that is available for use in the different months. Monthly volume of roof rainwater was calculated from Formula (2):
VMRW = (TRA · AMR · SRC)/1000,
where VMRW—average rainfall volume in the RNP for a given month in the 20-year period from 2001 to 2020.
Figure 8 shows that the amount of rainwater was the largest in the spring and summer (from May to August), i.e., when the demand for water was the highest. During this period, rainwater could cover 100% of the demand for water to be used for various previously mentioned purposes. In the remaining months, rainwater could cover 54–90% of the Animal Breeding Centre’s demand for water.

4. Discussion

Regional climate models (RCA3, HadRM3, HIRHAM5, CLM, and RegCM3) for Poland, including Roztocze and the RPN, forecast an increase in air temperature [69]. The forecasts of changes in thermal conditions for the years 2021–2050 in relation to the years 1961–1990 show that the greatest warming will occur in winter and the smallest in summer. The average temperature is predicted to increase by about 1 to 3 °C. It will be caused by a shorter duration of snow cover of ever smaller thickness. The HIRHAM3 model in Roztocze assumes that the average temperature will not change. The HADRM3 model predicts warming and an increase in temperature in Roztocze by 3.75 °C.
According to the research in the years 2001–2020, the air temperature increased by 2.51 °C in the cold season, and in the warm season, it increased by 1.68 °C. The average temperature increase is 2.10 °C, which corresponds to the projected changes. The temperature in December increased by 5.29 °C. In the warm season, the months of May and July were colder by 0.5 °C. The obtained results are consistent with the forecasts from the abovementioned models.
Total annual precipitation in the territory of the RPN does not show clear trends in comparison to the air temperature. The research carried out in 2001–2020, however, confirms some forecasts. Air-temperature changes in the RPN are not uniform. We can distinguish 10-year periods when, in the winter half of the year, a drop in air temperature is accompanied by an increase in precipitation, and in the warm half of the year, a decrease in air temperature is associated with an increase in rainfall. Annual amounts of precipitation in the territory of the RPN in 2011–2020 were, on average, 41.7 mm lower than in 2001–2010, with the largest decrease in the amount of precipitation in the cold season (41.02 mm), and only insignificant in the warm season (by 0.73 mm).
Previous studies have shown that rainwater is usually of fairly good quality [20,70,71]. Only some parameters of rainwater exceed the standards specified for water intended for human consumption [70]. A study of rainwater flowing from the roofs of two outbuildings located near the Roztocze National Park Directorate building also showed that the water was of a fairly good quality [72], although it contained increased levels of ammonia, coliform and fecal coliform bacteria, and meso- and psychrophilic bacteria, which were probably caused by contamination of the roof surface with bird droppings. The water also had a slightly alkaline pH, which may indicate that the air and the surfaces of the roofs were polluted with dust particles from local furnaces and with animal waste. Jóźwiakowski et al. [72] showed that, in terms of microbiological parameters and some chemical parameters, the rainwater tested was not suitable for drinking or hygienic purposes, but could be safely used for washing vehicles, watering green areas, or flushing toilets. On the other hand, rainwater can be easily treated to drinking-water standards; the sole shortcoming is the low level of minerals [73,74].
The installation for the harvesting and utilization of rainwater mentioned above, which collects water from the buildings of the Roztocze National Park Directorate, was constructed in 2014 on the basis of a conception developed by Jóźwiakowski et al. [75]. The authors of the conception determined that 323 m3 of rainwater could be harvested per year from two garage roofs with a surface area of 185 and 302 m2 and used for washing vehicles and irrigating green areas. They also calculated that this amount of water was sufficient to meet the annual water demand for these purposes. The rainwater-harvesting installation for the RNP Directorate building has an ecological effect, as it allows users to limit the consumption of high-quality groundwater from the Roztocze aquifer located in this legally protected area. At the same time, the installation improves the image of the RNP as a pro-ecological institution which implements modern technological solutions to protect and preserve the most valuable assets of the natural environment. In the future, other systems of this type are planned to be installed in the RNP.
Table 4 shows a list of all public utility buildings located in the Roztocze National Park that could be equipped with rainwater-harvesting and -utilization systems, as well as the average annual amount of water that could be collected from these facilities. The surface area of the roofs of the RNP’s public utility facilities was determined on the basis of a register of the Roztocze National Park’s structures and buildings and GPS measurements.
The calculations show that the construction of rainwater harvesting systems for the public utility facilities located in the RNP would allow for the collection and use of 9109 m3 of rainwater per year.

5. Conclusions

The climate-change forecast based on regional climate models for 2021–2050 regarding changes in thermal conditions and precipitation in Poland and in Europe [69] and data from the literature on the Roztocze National Park [47] indicate that there is an upward trend in air temperature and a very high yearly variability in precipitation levels. This tendency was also confirmed in this present study, which additionally shows that there is a downward trend in the amount of precipitation, especially in the winter months. These changes have a negative impact on the natural environment, especially the Park’s forest-forming species, and contribute to the lowering of the level of groundwater and the lack or scarcity of surface waters in water bodies, such as the upper section of the Świerszcz River and Echo Ponds. Particularly dramatic changes were recorded in 2017–2020, and they led to profound environmental and social consequences. The study focuses mainly on the impact of rainfall and temperature on the groundwater level balance, but, of course, not all aspects affecting it were considered in the study, such as infiltration, which also affects the lowering of the level of groundwater [73].
In the present study, we proposed that, in order to quantitatively protect the diminishing water resources in the area of the RNP and to limit the consumption of high-quality water, measures should be taken for the retention and management of rainwater in public utility facilities. We found that local solutions based on natural resources of rainwater could satisfy a considerable part of the water demand of the Roztocze National Park’s public utility facilities. We determined that approximately 9109 m3 of water could be retained and used in the park during a year. As an example of such a solution, we presented a sustainable rainwater management system to be installed at the Animal Breeding Centre in Florianka that would ensure the continuity of operation of the Polish Konik horse stud farm (the symbol of the RNP) and the proper maintenance of the Animal Breeding Centre in Florianka, which is visited by about 40 thousand people yearly. It was assumed that, in this system, rainwater, after treatment, would be used for watering the horses and for flushing toilets. Untreated rainwater, on the other hand, would be used for fire prevention purposes and for washing cars and agricultural equipment. The excess water would be discharged to a nearby pond, which is an amphibian breeding site. It was found that, in the spring and summer period (from May to August), rainwater could cover 100% of the Animal Breeding Centre’s demand for water used for various purposes.
In the future, the use of rainwater harvesting and utilization systems will contribute to the broadly understood water protection and will help counteract the effects of drought in the face of the changing climate in Poland and around the world.

Author Contributions

Conceptualization, T.G. and K.J.; methodology, T.G. and K.J.; software, T.G., A.B. and A.M.; validation, T.G., K.J. and A.B.; formal analysis, T.G. and A.B.; investigation, T.G.; resources, T.G.; data curation, T.G.; writing—original draft preparation, T.G. and K.J.; writing—review and editing, T.G., K.J., A.B. and A.M.; visualization, T.G. and A.B.; supervision, T.G. and K.J.; project administration, T.G. and K.J.; funding acquisition, T.G. and K.J. All authors have read and agreed to the published version of the manuscript.

Funding

The paper was written within the framework of a PhD thesis prepared by Tadeusz Grabowski, M.Sc., from the project no DWD/4/88/2020 financed by the Ministry of Education and Science (Poland) entitled “Development and implementation of a system for the collection and use of rainwater for watering animals in the Roztocze National Park/Development, implementation and analysis of the functioning of a hybrid constructed wetland wastewater treatment plant with a closed water circuit in Poleski National Park”.

Institutional Review Board Statement

Not applicable.

Informed Consent Statement

Not applicable.

Data Availability Statement

Not applicable.

Acknowledgments

This paper is a result of cooperation between Roztocze National Park (RNP) based in Zwierzyniec, University of Life Sciences in Lublin, and Maria Curie Skłodowska University in Lublin (UMCS). The authors would like to thank the Director and staff of RNP for creating a climate for creative work. Special thanks are given to the staff of the RNP Integrated Environmental Monitoring Base Station and the staff of the Department of Hydrology and Climatology of the Maria Curie-Skłodowska University (UMCS) for many years of research on the natural environment of Roztocze and RNP and for their kindness and assistance in compiling the paper.

Conflicts of Interest

The authors declare no conflict of interest.

References

  1. UNESCO. Changing Natural Systems. In The United Nations World Water Development Report 2; UNESCO & WMO, with IAEA: Paris, France, 2006; p. 120. Available online: https://unesdoc.unesco.org/ark:/48223/pf0000145405.locale=en (accessed on 1 March 2022).
  2. WHO (World Health Organization); UNICEF (United Nations International Children’s Emergency Fund). Progress on Drinking Water, Sanitation and Hygiene, Update and SDG Baselines; WHO: New York, NY, USA, 2017; p. 108. Available online: https://apps.who.int/iris/handle/10665/258617 (accessed on 1 March 2022).
  3. Hoekstra, A.Y. The Global Dimension of Water Governance: Nine Reasons for Global Arrangements in Order to Cope with Local Problems in value of Water Research Report; UNESCO-IHE Institute for Water Education: Delft, The Netherlands, 2006; p. 36. Available online: https://research.utwente.nl/files/5149838/Report_20.pdf (accessed on 1 March 2022).
  4. Angelakis, A.N.; Bontoux, L.; Lazarova, V. Challenges and prospectives for water recycling and reuse in EU countries. Water Sci. Technol. Water Supply 2003, 3, 59–68. [Google Scholar] [CrossRef]
  5. Bixio, D.; Thoeye, C.; Wintgens, T.; Ravazzini, A.; Miska, V.; Muston, M.; Chikurel, H.; Aharoni, A.; Joksimovic, D.; Melin, T. Water reclamation and reuse: Implementation and management issues. Desalination 2008, 218, 13–23. [Google Scholar] [CrossRef]
  6. Voulvoulis, N. Water reuse from a circular economy perspective and potential risks from an unregulated approach. Curr. Opin. Environ. Sci. Health. 2018, 2, 32–45. [Google Scholar] [CrossRef]
  7. Sapkota, A.R. Water reuse, food production and public health: Adopting transdisciplinary, systems-based approaches to achieve water and food security in a changing climate. Environ. Res. 2019, 171, 576–580. [Google Scholar] [CrossRef] [PubMed]
  8. Hagenvoort, J.; Ortega-Reig, M.; Botella, S.; García, C.; de Luis, A.; Palau-Salvador, G. Reusing Treated Waste-Water from a Circular Economy Perspective—The Case of the Real Acequia de Moncada in Valencia (Spain). Water 2019, 11, 1830. [Google Scholar] [CrossRef] [Green Version]
  9. Shevah, Y. Water scarcity, water reuse, and environmental. Saf. Pure Appl. Chem. 2014, 86, 1205–1214. [Google Scholar] [CrossRef]
  10. Al-Othman, A.; Darwish, N.N.; Qasim, M.; Tawalbeh, M.; Darwish, N.A.; Hilal, N. Nuclear desalination: A state-of-the-art review. Desalination 2019, 457, 39–61. [Google Scholar] [CrossRef]
  11. Ungureanu, N.; Vlăduț, V.; Voicu, G. Water Scarcity and Wastewater Reuse in Crop Irrigation. Sustainability 2020, 12, 9055. [Google Scholar] [CrossRef]
  12. Curto, D.; Franzitta, V.; Guercio, A. A Review of the Water Desalination Technologies. Appl. Sci. 2021, 11, 670. [Google Scholar] [CrossRef]
  13. Ghaffour, N.; Missimer, T.M.; Amy, G.L. Technical review and evaluation of the economics of water desalination: Current and future challenges for better water supply sustainability. Desalination 2013, 309, 197–207. [Google Scholar] [CrossRef] [Green Version]
  14. Guo, T.; Englehardt, J.; Wu, T. Review of cost versus scale: Water and wastewater treatment and reuse processes. Water Sci. Technol. 2014, 69, 223–234. [Google Scholar] [CrossRef]
  15. Gao, L.; Yoshikawa, S.; Iseri, Y.; Fujimori, S.; Kanae, S. An Economic Assessment of the Global Potential for Seawater Desalination to 2050. Water 2017, 9, 763. [Google Scholar] [CrossRef]
  16. Palla, A.; Gnecco, I.; Lanza, L.G.; La Barbera, P. Performance analysis of domestic rainwater harvesting systems under various European climate zones. Resour. Conserv. Recycl. 2012, 62, 71–80. [Google Scholar] [CrossRef]
  17. Musayev, S.; Burgess, E.; Mellor, J. A global performance assessment of rainwater harvesting under climate change. Resour. Conserv. Recycl. 2018, 132, 62–70. [Google Scholar] [CrossRef]
  18. Semaan, M.; Day, S.D.; Garvin, M.; Ramakrishnan, N.; Pearce, A. Optimal sizing of rainwater harvesting systems for domestic water usages: A systematic literature review. Resour. Conserv. Recycl. 2020, 6, 100033. [Google Scholar] [CrossRef]
  19. Herrmann, T.; Schmida, U. Rainwater utilisation in Germany: Efficiency dimensioning, hydraulic and environmental aspects. Urban Water 1999, 1, 307–316. [Google Scholar] [CrossRef]
  20. Sazakli, E.; Alexopoulos, A.; Leotsinidis, M. Rainwater harvesting, quality assessment and utilization in Kefalonia Island, Greece. Water Res. 2007, 41, 2039–2047. [Google Scholar] [CrossRef]
  21. Ghisi, E.; Bressan, D.L.; Martini, M. Rainwater tank capacity and potential for potable water savings by using rainwater in the residential sector of southeastern Brazil. Build. Environ. 2007, 42, 1654–1666. [Google Scholar] [CrossRef]
  22. Zhang, Y.; Chen, D.; Chen, L.; Ashbolt, S. Potential for rainwater use in high-rise buildings in Australian cities. J. Environ. Manag. 2009, 91, 222–226. [Google Scholar] [CrossRef]
  23. Abdulla, F.A.; Al-Shareef, A.W. Roof rainwater harvesting systems for household water supply in Jordan? Desalination 2009, 243, 195–207. [Google Scholar] [CrossRef]
  24. Eroksuz, E.; Rahman, A. Rainwater tanks in multi-unit buildings: A case study for three Australian cities. Resour. Conserv. Recycl. 2010, 54, 1449–1452. [Google Scholar] [CrossRef]
  25. Ward, S.; Memon, F.A.; Buttler, D. Performance of a large building rainwater harvesting system. Water Res. 2012, 46, 5127–5134. [Google Scholar] [CrossRef] [PubMed]
  26. Campisano, A.; Butler, D.; Ward, S.; Burns, M.J.; Friedler, E.; De Busk, K.; Fisher-Jeffes, L.N.; Ghisi, E.; Rahman, A.; Furumai, H.; et al. Urban rainwater harvesting systems: Research, implementation and future perspectives. Water Res. 2017, 115, 195–209. [Google Scholar] [CrossRef] [PubMed]
  27. Palermo, S.A.; Talarico, V.C.; Pirouz, B. Optimizing Rainwater Harvesting Systems for Non-potable Water Uses and Surface Runoff Mitigation. In Numerical Computations: Theory and Algorithms: Third International Conference, NUMTA 2019, Crotone, Italy, June 15–21, 2019, Revised Selected Papers, Part I; Springer: Berlin/Heidelberg, Germany, 2019; pp. 570–582. [Google Scholar] [CrossRef]
  28. Rodrigues de Sá Silva, A.C.; Bimbato, A.M.; Balestieri, J.A.P.; Vilanova, M.R.N. Exploring environmental, economic and social aspects of rainwater harvesting systems: A review. Sustain. Cities Soc. 2022, 76, 103475. [Google Scholar] [CrossRef]
  29. Lima, C.A.S.; Schiaveto de Souza, R.; Almeida, A.K.; Kaufmann de Almeida, I. Economic feasibility of a rainwater harvesting system in a residential condominium in the Brazilian Midwest. Int. J. Sustain. Eng. 2021, 14, 1950–1961. [Google Scholar] [CrossRef]
  30. Adugna, D.; Jensen, M.B.; Lemma, B.; Gebrie, G.S. Assessing the potential for rooftop rainwater harvesting from large public institutions. Int. J. Environ. Res. Public Health 2018, 15, 336. [Google Scholar] [CrossRef] [Green Version]
  31. Quinn, R.; Rougé, C.; Stovin, V.R. Quantifying the performance of dual-use rainwater harvesting systems. Water Res. X 2021, 10, 100081. [Google Scholar] [CrossRef]
  32. Oberascher, M.; Zischg, J.; Palermo, S.A.; Kinzel, C.; Rauch, W.; Sitzenfrei, R. Smart Rain Barrels: Advanced LID Management Through Measurement and Control. In New Trends in Urban Drainage Modelling, Series: Green Energy and Technology; Mannina, G., Ed.; Springer International Publishing: Cham, Switzerland, 2019; pp. 777–782. [Google Scholar] [CrossRef]
  33. Harrison, I.; Green, P.; Farrell, T.; Juffe-Bignoli, D.; Saenz, L.; Vörösmarty, C. Protected areas and freshwater provisioning: A global assessment of freshwater provision, threats and management strategies to support human water security: Protected areas and freshwater provisioning. Aquat. Conserv. Mar. Freshw. Ecosyst. 2016, 26, 103–120. [Google Scholar] [CrossRef]
  34. Miah, M.; Sayok, A.; Sarok, A.; Uddin, M.B. Rain Water Harvesting for Sustainable Biodiversity Conservation at Lawachara National Park in Bangladesh: A Study on Policy Challenges. OIDA Int. J. Sustain. Dev. 2017, 10, 11–26. [Google Scholar]
  35. Gutry-Korycka, M.; Sadurski, A.; Kundzewicz, Z.W.; Pociask-Karteczka, J.; Skrzypczyk, L. Water resources and their use. Nauka 2014, 1, 77–98. (In Polish) [Google Scholar]
  36. Buraczyński, J. Roztocze. The Natural Environment; Wydawnictwo Lubelskie: Lublin, Poland, 2002; p. 341. (In Polish) [Google Scholar]
  37. Grabowski, T.; Stachyra, P.; Brusak, V.; Kałamucka, W.; Stanicka, M.; Shevchuk, O.; Zinco, Y.; Krychevska, D. Roztocze Nature and Man. In Roztocze National Park; Grabowski, T., Harasimiuk, M., Kaszewski, B.M., Kravchuk, Y., Lorens, B., Michalczyk, Z., Shabliy, O., Eds.; Roztocze National Park: Zwierzyniec, Poland, 2015; p. 527. (In Polish) [Google Scholar]
  38. Protection Plan of the Roztocze National Park, Regulation of the Minister of the Environment of April 19, J. Laws. 2018, Item 1081. Available online: https://isap.sejm.gov.pl/isap.nsf/DocDetails.xsp?id=WDU20180001081 (accessed on 1 March 2022). (In Polish)
  39. Kondracki, J. Regional Geography of Poland, 3rd ed.; Polish Scientific Publishers PWN: Warszawa, Poland, 2011; p. 440. (In Polish) [Google Scholar]
  40. The Nature Conservation Act of April 16, 2004, as Amended. J. Laws. 2021, Volume 84, Item 1098. Available online: https://isap.sejm.gov.pl/isap.nsf/search.xsp?status=O&year=2021&position=1098 (accessed on 1 March 2022). (In Polish)
  41. Romer, E. Climatic Regions of Poland; Prace Wrocławskiego Towarzystwa Naukowego: Wrocław, Poland, 1949; Seria B, No 16; p. 23. (In Polish) [Google Scholar]
  42. Kaszewski, B.M.; Siwek, K. Climate. In Roztocze National Park—Nature and Man; Reszel, R., Grądziel, T., Eds.; Roztocze National Park: Zwierzyniec, Poland, 2015; pp. 61–65. (In Polish) [Google Scholar]
  43. Bartoszewski, S.; Michalczyk, Z. Water Relations. In Roztocze National Park—Nature and Man; Reszel, R., Grądziel, T., Eds.; Roztocze National Park: Zwierzyniec, Poland, 2015; pp. 53–60. (In Polish) [Google Scholar]
  44. Regulation of the Minister of Environment of 12 January 2011 on Special Bird Protection Areas. J. Laws. 2011, Volume 25, Item 133. Available online: https://isap.sejm.gov.pl/isap.nsf/DocDetails.xsp?id=WDU20110250133 (accessed on 1 March 2022). (In Polish)
  45. Regulation of the Minister of Climate and Environment of October 14, 2021 on the Special Area of Habitat Protection Middle Roztocze (PLH060017). J. Laws. 2021, Item 2085. Available online: https://isap.sejm.gov.pl/isap.nsf/DocDetails.xsp?id=WDU20210002085 (accessed on 1 March 2022). (In Polish)
  46. Zajączkowski, J.; Brzeziecki, B.; Perzanowski, K.; Kozak, I. Impact of potential climate changes on competitive ability of main forest tree species in Poland. Sylwan 2013, 157, 253–261. (In Polish) [Google Scholar]
  47. Kaszewski, B.M.; Siwek, K.; Gluza, A.; Shuber, P. Climate. In Roztocze: Nature and Man; Grabowski, T., Harasimiuk, M., Kaszewski, B.M., Kravchuk, Y., Lorens, B., Michalczyk, Z., Shabliy, O., Eds.; Roztocze National Park: Zwierzyniec, Poland, 2015; pp. 123–133. (In Polish) [Google Scholar]
  48. Lorenc, H.; Prządka, Z. Measurement Programs of the Integrated Environmental Monitoring—Guidelines for the Organization of the Measurement Network. Measurement program A1: Meteorology. In Integrated Monitoring of the Natural Environment. Principles of Organization, Measurement System, Selected Research Methods, 2nd ed.; Kostrzewski, A., Kruszyk, R., Kolander, R., Eds.; Adam Mickiewicz University: Poznań, Poland, 2006; p. 10. (In Polish) [Google Scholar]
  49. TIBCO Software Inc. Data Science Workbench, Version 14. Available online: http://tibco.com (accessed on 1 March 2022).
  50. Radliński, B.; Maciejewski, Z.; Rawiak, A.; Stachyra, P.; Smoła, M.; Gleń, G. Report on the Implementation of the Research and Measurement Program of the Integrated Environmental Monitoring at the Roztocze Base Station in 2020; Roztocze National Park: Zwierzyniec, Poland, 2021; p. 225. (In Polish) [Google Scholar]
  51. Grabowski, T.; Droździel, L.; Kotyła, A.; Stachyra, P.; Maciejewski, Z.; Marczakowski, P.; Radliński, B.; Roztocze National Park. The System of Protected Areas of Roztocze in Poland and Ukraine and the Sustainable Development of the Region; Kałamucka, W., Grabowski, T., Eds.; Roztoczański Park Narodowy: Zwierzyniec, Poland, 2021; pp. 81–95. (In Polish) [Google Scholar]
  52. Kundzewicz, Z.W.; Matczak, P. Climate change regional review: Poland. Wiley Interdiscip. Rev. Clim. Chang. 2012, 3, 297–311. [Google Scholar] [CrossRef]
  53. Krużel, J.; Ziernicka-Wojtaszek, A. Diversity of Air Temperature in Poland in the Years 1971–2010. J. Ecol. Eng. 2016, 17, 227–231. [Google Scholar] [CrossRef] [Green Version]
  54. Michalska, B. Tendencies of air temperature changes in Poland. Pr. I Studia Geogr. 2011, 47, 67–75. (In Polish) [Google Scholar]
  55. Adedeji, O.; Reuben, O.; Olatoye, O. Global Climate Change. J. Geosci. Environ. Prot. 2014, 2, 114–122. [Google Scholar] [CrossRef]
  56. Eensaar, A. Analysis of the spatio-temporal variability of air temperature near the ground surface in the Central Baltic area from 2005 to 2019. Atmosphere 2021, 12, 60. [Google Scholar] [CrossRef]
  57. Ziernicka-Wojtaszek, A.; Kopcińska, J. Variation in Atmospheric Precipitation in Poland in the Years 2001–2018. Atmoshpere 2020, 11, 794. [Google Scholar] [CrossRef]
  58. Szwagrzyk, J.; Bodziarczyk, J. Expertise on the Need to Introduce Changes to the Forest Ecosystem Protection Plan of the Roztocze National Park; Typescript: Kraków, Poland, 2021; p. 90. (In Polish) [Google Scholar]
  59. Council Directive 92/43/EEC of 21 May 1992 on the Conservation of Natural Habitats and of Wild Fauna and Flora. J. Laws. 1992, Volume 206, p. 7. Available online: http://extwprlegs1.fao.org/docs/pdf/eur34772.pdf (accessed on 1 March 2022).
  60. Maciejewski, Z.; Radliński, B.; Stachyra, P. Analysis of the Variability of Selected Meteorological and Hydrological Elements and Their Impact on the Natural Environment at the Base Station of the Integrated Environmental Monitoring in Roztocze in 2012–2019. In The Current State and Changes in the Natural Environment of Geoecosystems as an Indicator Feature of Climate Change. Integrated Monitoring of the Natural Environment; Olszewski, A., Andrzejewska, A., Eds.; Environmental Monitoring Library: Warszawa, Poland, 2020; Volume XXXIII, pp. 107–120. Available online: https://roztoczanskipn.pl/files/monitoring-i-nauka/Art.pdf (accessed on 1 March 2022). (In Polish)
  61. Tittenbrun, A. Protection Plan of the Roztocze National Park with Materials for its Creation; Roztocze National Park: Zwierzyniec, Poland, 2019; p. 237. [Google Scholar]
  62. Regulation of the Minister of Interior and Administration of 24 July 2009 on Firefighting Water Supply and Fire Roads. J. Laws. 2009, Volume 124, p. 1030. Available online: https://isap.sejm.gov.pl/isap.nsf/DocDetails.xsp?id=WDU20091241030 (accessed on 1 March 2022).
  63. Grabowski, T.; Jóźwiakowski, K.; Roczeń, P. Functional and Operational Program of the Installation for the Management of Rainwater at the Animal Breeding Center in Florianka in the Roztocze National Park; Roztocze National Park: Zwierzyniec, Poland, 2022. (In Polish) [Google Scholar]
  64. Micek, A.; Jóźwiakowski, K.; Marzec, M.; Listosz, A. Technological reliability and efficiency of wastewater treatment in two hybrid constructed wetlands in the Roztocze National Park (Poland). Water 2020, 12, 3435. [Google Scholar] [CrossRef]
  65. Regulation of the Polish Minister of Infrastructure of January 14, 2002 on Determining the Average Standards of Water Consumption. J. Laws. 2002, Volume 8, p. 70. Available online: https://isap.sejm.gov.pl/isap.nsf/DocDetails.xsp?id=WDU20020080070 (accessed on 1 March 2022).
  66. Aladenola, O.O.; Adeboye, O. Assessing the potential for rainwater harvesting. Water Resour. Manag. 2010, 24, 2129–2137. [Google Scholar] [CrossRef]
  67. Villar-Navascués, R.; Pérez-Morales, A.; Gil-Guirado, S. Assessment of Rainwater Harvesting Potential from Roof Catchments through Clustering Analysis. Water 2020, 12, 2623. [Google Scholar] [CrossRef]
  68. Farreny, R.; Morales-Pinzón, T.; Guisasola, A.; Tayà, C.; Rieradevall, J.; Gabarrell, X. Roof selection for rainwater harvesting: Quantity and quality assessments in Spain. Water Res. 2011, 45, 3245–3254. [Google Scholar] [CrossRef] [PubMed]
  69. Jędruszkiewicz, J. Projections of Changes in Thermal Conditions for Poland for 2021–2050 Based on Regional Climate Models. In The Climate of Poland against the Background of the Climate of Europe. Changes and Their Consequences; Bednarz, E., Kolendowicz, L., Eds.; Bogucki Wydawnictwo Naukowe: Poznań, Poland, 2010; pp. 65–77. (In Polish) [Google Scholar]
  70. Skwarzyńska, A.; Jóźwiakowski, K.; Sosnowska, B.; Pytka, A.; Marzec, M.; Gizińska, M.; Szyszlak-Bargłowicz, J.; Słowik, T.; Zając, G. The quality of rainwater and evaluation of its use in individual households. Technol. Wody 2014, 6, 20–23. (In Polish) [Google Scholar]
  71. Struk-Sokołowska, J.; Gwoździej-Mazur, J.; Jadwiszczak, P.; Butarewicz, A.; Ofman, P.; Wdowikowski, M.; Kaźmierczak, B. The Quality of Stored Rainwater for Washing Purposes. Water 2020, 12, 252. [Google Scholar] [CrossRef] [Green Version]
  72. Jóźwiakowski, K.; Listosz, A.; Gizińska-Górna, M.; Pytka, A.; Marzec, M.; Sosnowska, B.; Chołody, M.; Dyczko, A. Quality of rainwaters outflowing from roofs of garage buildings of park authority of Roztocze National Park. J. Ecol. Eng. 2016, 17, 208–215. [Google Scholar] [CrossRef]
  73. Davis, F. An Elementary Handbook on Potable Water; Silver, Burdett & Co.: Boston, CA, USA, 1891; p. 118. [Google Scholar]
  74. Huang, Z.; Nya, E.L.; Rahman, M.A.; Mwamila, T.B.; Cao, V.; Gwenzi, W.; Noubactep, C. Integrated Water Resource Management: Rethinking the Contribution of Rainwater Harvesting. Sustainability 2021, 13, 8338. [Google Scholar] [CrossRef]
  75. Jóźwiakowski, K.; Marzec, M.; Słowik, T.; Wałęga, A.; Krzanowski, S.; Skwarzyńska, A.; Pieńko, A. Concept of Building an Installation to be Used Rainwater at the Roztoczański Directorate National Park with a Preliminary Estimate Costs; University of Life Sciences in Lublin: Lublin, Poland, 2013. (In Polish) [Google Scholar]
Figure 1. Physico-geographic regionalization and location of the Roztocze National Park in Roztocze [39].
Water 14 01334 g001
Figure 2. Land-use structure in the Roztocze National Park.
Water 14 01334 g002
Figure 3. The aspects and order of procedures in the research methodology.
Water 14 01334 g003
Figure 4. Simplified water balance of the Świerszcz River catchment area in 2012–2020 (P—rainfall, H—outflow).
Water 14 01334 g004
Figure 5. Changes in precipitation and air temperature in years 2001–2020.
Water 14 01334 g005
Figure 6. Changes in average total precipitation and temperature in the (a) cold and (b) warm season.
Water 14 01334 g006aWater 14 01334 g006b
Figure 7. Diagram of a sustainable rainwater management system in the Animal Breeding Centre in Florianka in the Roztocze National Park. A—stable and B—barn.
Water 14 01334 g007
Figure 8. The amount of rainwater flowing from the roofs of the buildings in the Animal Breeding Centre in the RNP in different months of the year (VMRW), demand for rainwater (D), and the potential to meet the Animal Breeding Centre’s needs (P) in the period 2001–2020.
Water 14 01334 g008
Table 1. Average precipitation trend for the years 2001–2020. Data compiled by the authors from the Reports of the “Roztocze” Base Station of the Integrated Monitoring of Natural Environment.
MonthAverage
(mm)
Min
(mm)
Max
(mm)
SD
(mm)
rp-ValueRegression SlopeChange
Over 20 Years (mm)
January45.219.2104.518.9−0.330.152−1.06−21.3
February34.63.666.916.3−0.220.353−0.60−12.1
March46.39.787.620.4−0.120.602−0.43−8.6
April42.58.475.918.2−0.250.297−0.75−15.1
May89.531.5163.436.10.300.1931.8537.1
June73.425.6170.340.90.040.8790.255.0
July98.430.820744.9−0.320.169−2.43−48.6
August65.86.6144.237.4−0.050.848−0.29−5.8
September61.17.5125.741.40.200.4051.3827.6
October51.77.5119.334.50.150.5220.8917.8
November44.30.49025.3−0.190.420−0.82−16.3
December39.914.885.616.80.170.4780.489.6
Cold season252.8161.1323.349.0−0.320.174−2.62−52.5
Warm season439.9307.3628.585.70.080.7521.0921.9
Year692.7541.1888.684.8−0.110.654−1.53−30.6
Cold season (January–April and November–December) and warm season (May–October).
Table 2. Average air temperature trend for the years 2001–2020. Data compiled by the authors from the Reports of the “Roztocze” Base Station of the Integrated Monitoring of Natural Environment.
MonthAverage
(°C)
Min
(°C)
Max
(°C)
SD
(°C)
rp-ValueRegression SlopeChange
Over 20 Years (°C)
January−2.7−92.62.80.140.5680.071.33
February−1.5−8.63.63.20.320.1670.183.58
March2.3−2.55.72.40.300.2000.122.48
April8.6613.31.50.330.1600.081.68
May13.61116.61.4−0.110.632−0.03−0.55
June17.414.321.51.50.680.001 *0.173.48
July19.317.820.70.9−0.180.442−0.03−0.56
August18.416.621.11.10.71<0.001 *0.132.65
September13.110.9151.30.640.002 *0.152.92
October8.04.410.41.70.270.2560.081.56
November3.90.46.11.50.240.3020.061.30
December−0.6−7.22.92.80.540.014 *0.265.29
Cold season1.70.03.61.20.620.004 *0.132.51
Warm season15.013.916.30.60.79<0.001 *0.081.68
Year8.37.29.80.80.77<0.001 *0.112.10
* A statistically significant correlation. Cold season (January–April and November–December) and warm season (May–October).
Table 3. Monthly demand for rainwater in the RNP’s Animal Breeding Centre in Florianka.
Type of Rainwater UseDemand for Rainwater by Month (m3)
JanuaryFebruaryMarchAprilMayJuneJulyAugustSeptemberOctoberNovemberDecemberTotal
Fire tank1.61.61.61.61.61.61.61.61.61.61.61.619.2
Toilets3.03.03.03.06.06.06.06.03.03.03.03.048.0
Vehicle washing0.910.912.774.023.672.422.422.423.073.071.210.9127.8
Animal watering60.064.569.069.069.069.069.069.069.069.061.561.5799.5
Total65.5170.0176.3777.6280.2779.0279.0279.0276.6776.6767.3167.01894.5
Table 4. Monthly demand for rainwater in the RNP’s Animal Breeding Centre in Florianka.
Settlement NumberSettlement NameName of Facility/Property NumberFacility No.Number of ObjectsTotal Roof Area TRA (m2)Surface Runoff Coefficient (SRC)Type of Roof Covering *The Amount of Rainwater to Be Used (m3)
1FloriankaAnimal Breeding Centre161863.70.911151
Izba Leśna (Forest Chamber)26562.20.73270
Forester’s Lodge “Komanówka”33664.70.91410
Forester’s Lodge “Jawor”43245.70.91152
2ZwierzyniecRybakówka57722.30.91446
RNP Directorate building65907.30.91560
Office of the Protected Area Bukowa Góra75503.00.91311
Property 1D82130.20.9180
Property 2P93214.10.91132
Property 3B101109.70.9168
Museum and Centre for Education1131389.80.82763
Property 4T122378.70.91234
Property 5H135451.80.91279
Property 6B14279.10.9149
Property 7 B155505.10.91312
Office of the Protected Area Florianka163491.30.91303
Brickyard174241.20.91149
Roztocze Centre for Science and Education1861617.90.91999
3Górecko StareRain shelter19117.00.738
ObroczProperty 8F203296.30.91183
Property 9S213340.20.91210
Office of the Protected Area Słupy224300.90.91186
4KosobudyForester’s Lodge “Bezednia”237376.90.91233
Office of the Protected Area Horodzisko/Jarugi246864.30.91534
Property 10P252263.30.91163
Property 11P262309.00.91191
Property 12K273352.30.91218
Rain shelter28117.00.738
5Wólka WieprzeckaProperty 13P293275.10.91170
Rain Shelter “Szewnia Dolna”30117.00.738
6KrzyweForester’s Lodge “Krzywe”314428.60.91265
7WojdaCellar32112.40.918
8Czarny WygonBat Tower33268.70.8238
9GuciówForester’s Lodge34135.20.9122
Total3411515,052.0 9109
* 1—sheet (SRC = 0.9); 2—ceramic tile (SRC = 0.8); 3—wood shingle (SRC = 0.7).
Publisher’s Note: MDPI stays neutral with regard to jurisdictional claims in published maps and institutional affiliations.

