Article

Tuning the Fe(II)/hydroxide Ratio during Synthesis of Magnetite Nanoparticles to Maximize Cr(VI) Uptake Capacity

by
Kyriaki Kalaitzidou
1,
Evangelia Chioti
1,
Theopoula Asimakidou
1,
Dimitrios Karfaridis
2,
George Vourlias
2,
Manassis Mitrakas
1 and
Konstantinos Simeonidis
1,*
1
Analytical Chemistry Laboratory, Department of Chemical Engineering, Aristotle University of Thessaloniki, 54124 Thessaloniki, Greece
2
Advanced Materials and Devices Laboratory, Department of Physics, Aristotle University of Thessaloniki, 54124 Thessaloniki, Greece
*
Author to whom correspondence should be addressed.
Water 2022, 14(9), 1335; https://doi.org/10.3390/w14091335
Submission received: 16 March 2022 / Revised: 17 April 2022 / Accepted: 18 April 2022 / Published: 20 April 2022
(This article belongs to the Special Issue Application of Nanomaterials in Water Treatment)

Abstract

:
The impact of hydroxyl excess as defined by the Fe(II)/hydroxide ratio during the synthesis of Fe3O4 nanoparticles by oxidative precipitation of FeSO4 was examined as a critical parameter determining the potential for Cr(VI) uptake from polluted water. Various samples were prepared by varying the OH excess in the range of −0.10 up to +0.03 M and characterized according to their composition, morphology, and surface configuration. Their efficiency for Cr(VI) removal was evaluated by batch adsorption tests, carried out under similar conditions with drinking water purification in the concentration range below 10 mg/L. Results indicate that near the zero-excess point for hydroxyl balance, the uptake capacity for residual Cr(VI) concentration equal to 25 μg/L remains at very low levels (<0.5 mg/g). However, a small increase above +0.02 M features synthesized nanoparticles with an uptake capacity of 2.5 mg/g owed to the decrease in particles size (28 nm) and enhancement of the reducing potential (Fe2+/Fe3+ = 0.42). In addition, utilizing negative excess values below −0.05 M triggers a similar efficiency rise, although the morphology of the obtained aggregates is rather different. Such finding is attributed to a possible exchange mechanism between adsorbed sulfates and chromate anions that assist approach of Cr(VI) to the material’s surface. Overall, proper tuning of hydroxyl excess offers multiple options for the implementation of monodisperse magnetically responsive nanoparticles or larger aggregates with optimized purification efficiency in water technology.

1. Introduction

With the expansion of the application of nanomaterials into more traditional technology fields with direct impact on daily life and nutrition practices, significant research efforts have been directed towards the development of nanoparticles for water purification during the last twenty years [1,2,3]. Considering the high specific surface area of nanoparticles in comparison to their bulk counterparts, surface adsorption of toxic pollutants present in drinking water or wastewater is commonly proposed as an efficient way to develop their use in water treatment [4]. Various adsorption mechanisms are achieved either by direct interaction of the aqueous pollutant forms with the nanoparticle components or by their uptake on functional groups which are attached on the surface of nanoparticles. Therefore, apart from the tiny dimensions of nanoparticles, parameters such as the surface charge, the chemical activity, and the solubility of participating crystal phases determine the potential applicability and efficiency toward the removal of specific pollutants.
In addition, some other characteristics may affect the implementation of nanoparticles in water treatment approaches. For instance, to preserve the high specific surface area of nanoparticles, aggregation should be kept at minimal levels during their dispersion in water [1]. Unfortunately, common ways to secure particles’ isolation depend on the use of surfactants with limited compatibility with water. One solution is to introduce aqueous-compatible surfactants; however, such molecules must be able to provide good capture affinity with the targeted pollutant at the same time to overcome the fact that direct access to the nanoparticle surface will be blocked [4,5]. Proper tuning of the surface charge during synthesis by applying acidity conditions or electrostatic attachment of ions is another way to improve the monodispersity of nanoparticles. Keeping the effective adsorption surface of nanoparticles at high levels is not favorable in typical packed-bed filters, which use micron-sized granules [6,7]. Therefore, nanoparticles should preferably be dispersed into the polluted water, thus requiring a further sufficient separation process after the treatment stage. Such limitation promotes the application of magnetically-responsive nanoparticles since they can easily be captured by applying an external magnetic field [8,9]. For this reason, single-phase magnetite (Fe3O4) or magnetite-based composites are widely tested in various research endeavors aiming to tackle the presence of water pollutants [10,11]. At the same time, the use of iron oxide nanoparticles is in line with the economic viability of relevant large-scale units due to their low production cost compared to other materials proposed as nano-adsorbents [12,13].
The potential of nanomaterials to operate as efficient adsorbents for the removal of hexavalent chromium, a very toxic and mobile aqueous chromium contaminant in water has been widely demonstrated in recent years. The amount of relevant research works has been expanding according to reports on critical health risks caused by the long-term consumption of drinking water polluted with Cr(VI) [14,15,16,17]. That hazard was previously underestimated by authorities. Only recently, an effort to set new directives has emerged and a separate concentration limit for the hexavalent form of chromium has been established. Particularly, a maximum concentration limit of 10 μg/L is discussed in California State [18], whereas member countries of the European Union agreed to apply a 25 μg/L limit with a 15-year tolerance [19]. Adsorption in nanostructured phases provides significant simplicity in application when compared to the well-known for its efficiency chemical reduction of Cr(VI) by ferrous salts followed by precipitation [12,13]. The ideal adsorbents to capture Cr(VI) are those that can deliver maximum electron donor potential in order to initiate reduction to an insoluble Cr(III) state. In the case of magnetite nanoparticles, the affinity of magnetite to Cr(VI) is attributed to the incompletely oxidized Fe2+ ions in its structure which favor electron transfer and reduction of Cr(VI) to insoluble hydroxides [20,21,22]. Such iron oxide nanoparticles also appear as a potential alternative to zero-valent Fe. The latter iron form theoretically serves as a better Cr(VI) reducing agent, however it displays inherent susceptibility and instability, being prone to air oxidation [23].
Among several available synthesis methods, production of magnetite nanoparticles must be realized under mild redox potential and well-controlled growth conditions to achieve long-term chemical stability and minimum aggregation tendency avoiding the need to use surfactants when possible [24,25]. In this manner, the maximum possible reducing capacity on the surface area of the nanoparticles can be obtained. To this end, the oxidative precipitation of bivalent iron salts by mild oxidizing agents activated at high temperatures appears as a particularly appealing method to combine tuning of the Fe2+ oxidation extent, good crystallinity, and monodispersity of the produced nanoparticles. Furthermore, the aforementioned approach provides nanoparticles sized in the single-domain range where enhanced magnetic properties are obtained [26]. In spite of these advantages, only a few studies have employed oxidative precipitation for the production of nanosized adsorbent for Cr(VI) removal from water [27,28,29], nevertheless none of them is oriented for drinking purposes, although the low cost of magnetite and its non-toxic nature indicate a promising sustainability potential for industrial scale-up.
This study evaluates the uptake efficiency of Fe3O4 nanoparticles prepared via the oxidative precipitation of FeSO4 by nitrates in a water/ethanol solution, focusing on the role of pH of the synthesis medium in the surface configuration and the adsorption mechanism. More specifically, tuning of pH is realized by modifying the hydroxyl anions excess as defined by the added quantities of H2SO4 and NaOH in the reaction mixture. The morphological, structural, and surface properties of the tested nanoparticles are examined to understand the optimum parameters responsible for high Cr(VI) removal rates. To our knowledge, this is the first report which investigates the role of the Fe(II)/hydroxide ratio in the determination of the reducing potential and surface configuration of iron oxide nanoparticles produced by the partial oxidation of FeSO4. Results provide evidence on the significance of such parameter toward Cr(VI) uptake at low concentrations indicating an optimization roadmap with respect to the potential of full-scale application in water treatment systems.

2. Materials and Methods

2.1. Reagents

Reagent grade iron sulfate heptahydrate (FeSO4·7H2O), sulfuric acid 98% (H2SO4), hydrochloric acid 37% (HCl), sodium hydroxide (NaOH), sodium nitrate (NaNO3), absolute ethanol 99%, potassium dichromate (K2Cr2O7), potassium permanganate (KMnO4), sodium bicarbonate (NaHCO3), sodium nitrate (NaNO3), sodium phosphate monohydrate (NaH2PO4·H2O), sodium fluoride (NaF), sodium silicate pentahydrate (NaSiO3·5H2O), calcium chloride dihydrate (CaCl2·2H2O), magnesium sulfate heptahydrate (MgSO4·7H2O) and 1,5-Diphenylcarbazide were purchased from Sigma-Aldrich. All chemicals were used without further purification.

2.2. Synthesis

The synthesis of studied Fe3O4 nanoparticles was carried out through the precipitation of FeSO4 in an alkaline environment which was accompanied by the partial oxidation of the Fe2+ initiated by nitrate ions when the temperature is increased. In a typical experiment, 5.56 g (20 mmol) FeSO4·7H2O were dissolved into 70 mL of degassed 0.01 M H2SO4 solution while 1.84 g (46 mmol) NaOH and 1.70 g (20 mmol) NaNO3 were dissolved separately in a mixture of 50 mL water and 40 mL ethanol (sample S8). The two solutions were immediately mixed to result in a viscous green oxyhydroxide (green rust) which was then placed on a preheated a water bath at 90 °C and kept for 12 h. The final dispersion was cooled down to room temperature, washed several times with distilled water, and eventually it was dried in air to obtain a sample in powder form. The OH excess, defined by the equilibrium of acidic and alkaline compounds, was used as the varying parameter to synthesize a series of samples. Particularly, the amount of NaOH was varied between 0.84–1.84 g (21–46 mmol) to succeed different OH excess values. This parameter was calculated by the following equation:
OH excess = [ NaOH ] 2 · [ FeSO 4 ] 2 · [ H 2 SO 4 ] · V H 2 SO 4 V tot
with [NaOH], [FeSO4], and [H2SO4] representing the concentrations of NaOH, FeSO4, and H2SO4 concentrations in M, respectively, VH2SO4 is the volume of added H2SO4 solution and Vtot refers to the total volume of the reacting mixture. Around 1.2 g of nanoparticles on dry basis were received for positive OH excess values whereas the amount was reduced to around 0.8 g for OH excess values below −0.07 M. Table 1 summarizes the main synthesis and chemical parameters of the samples studied in this work.

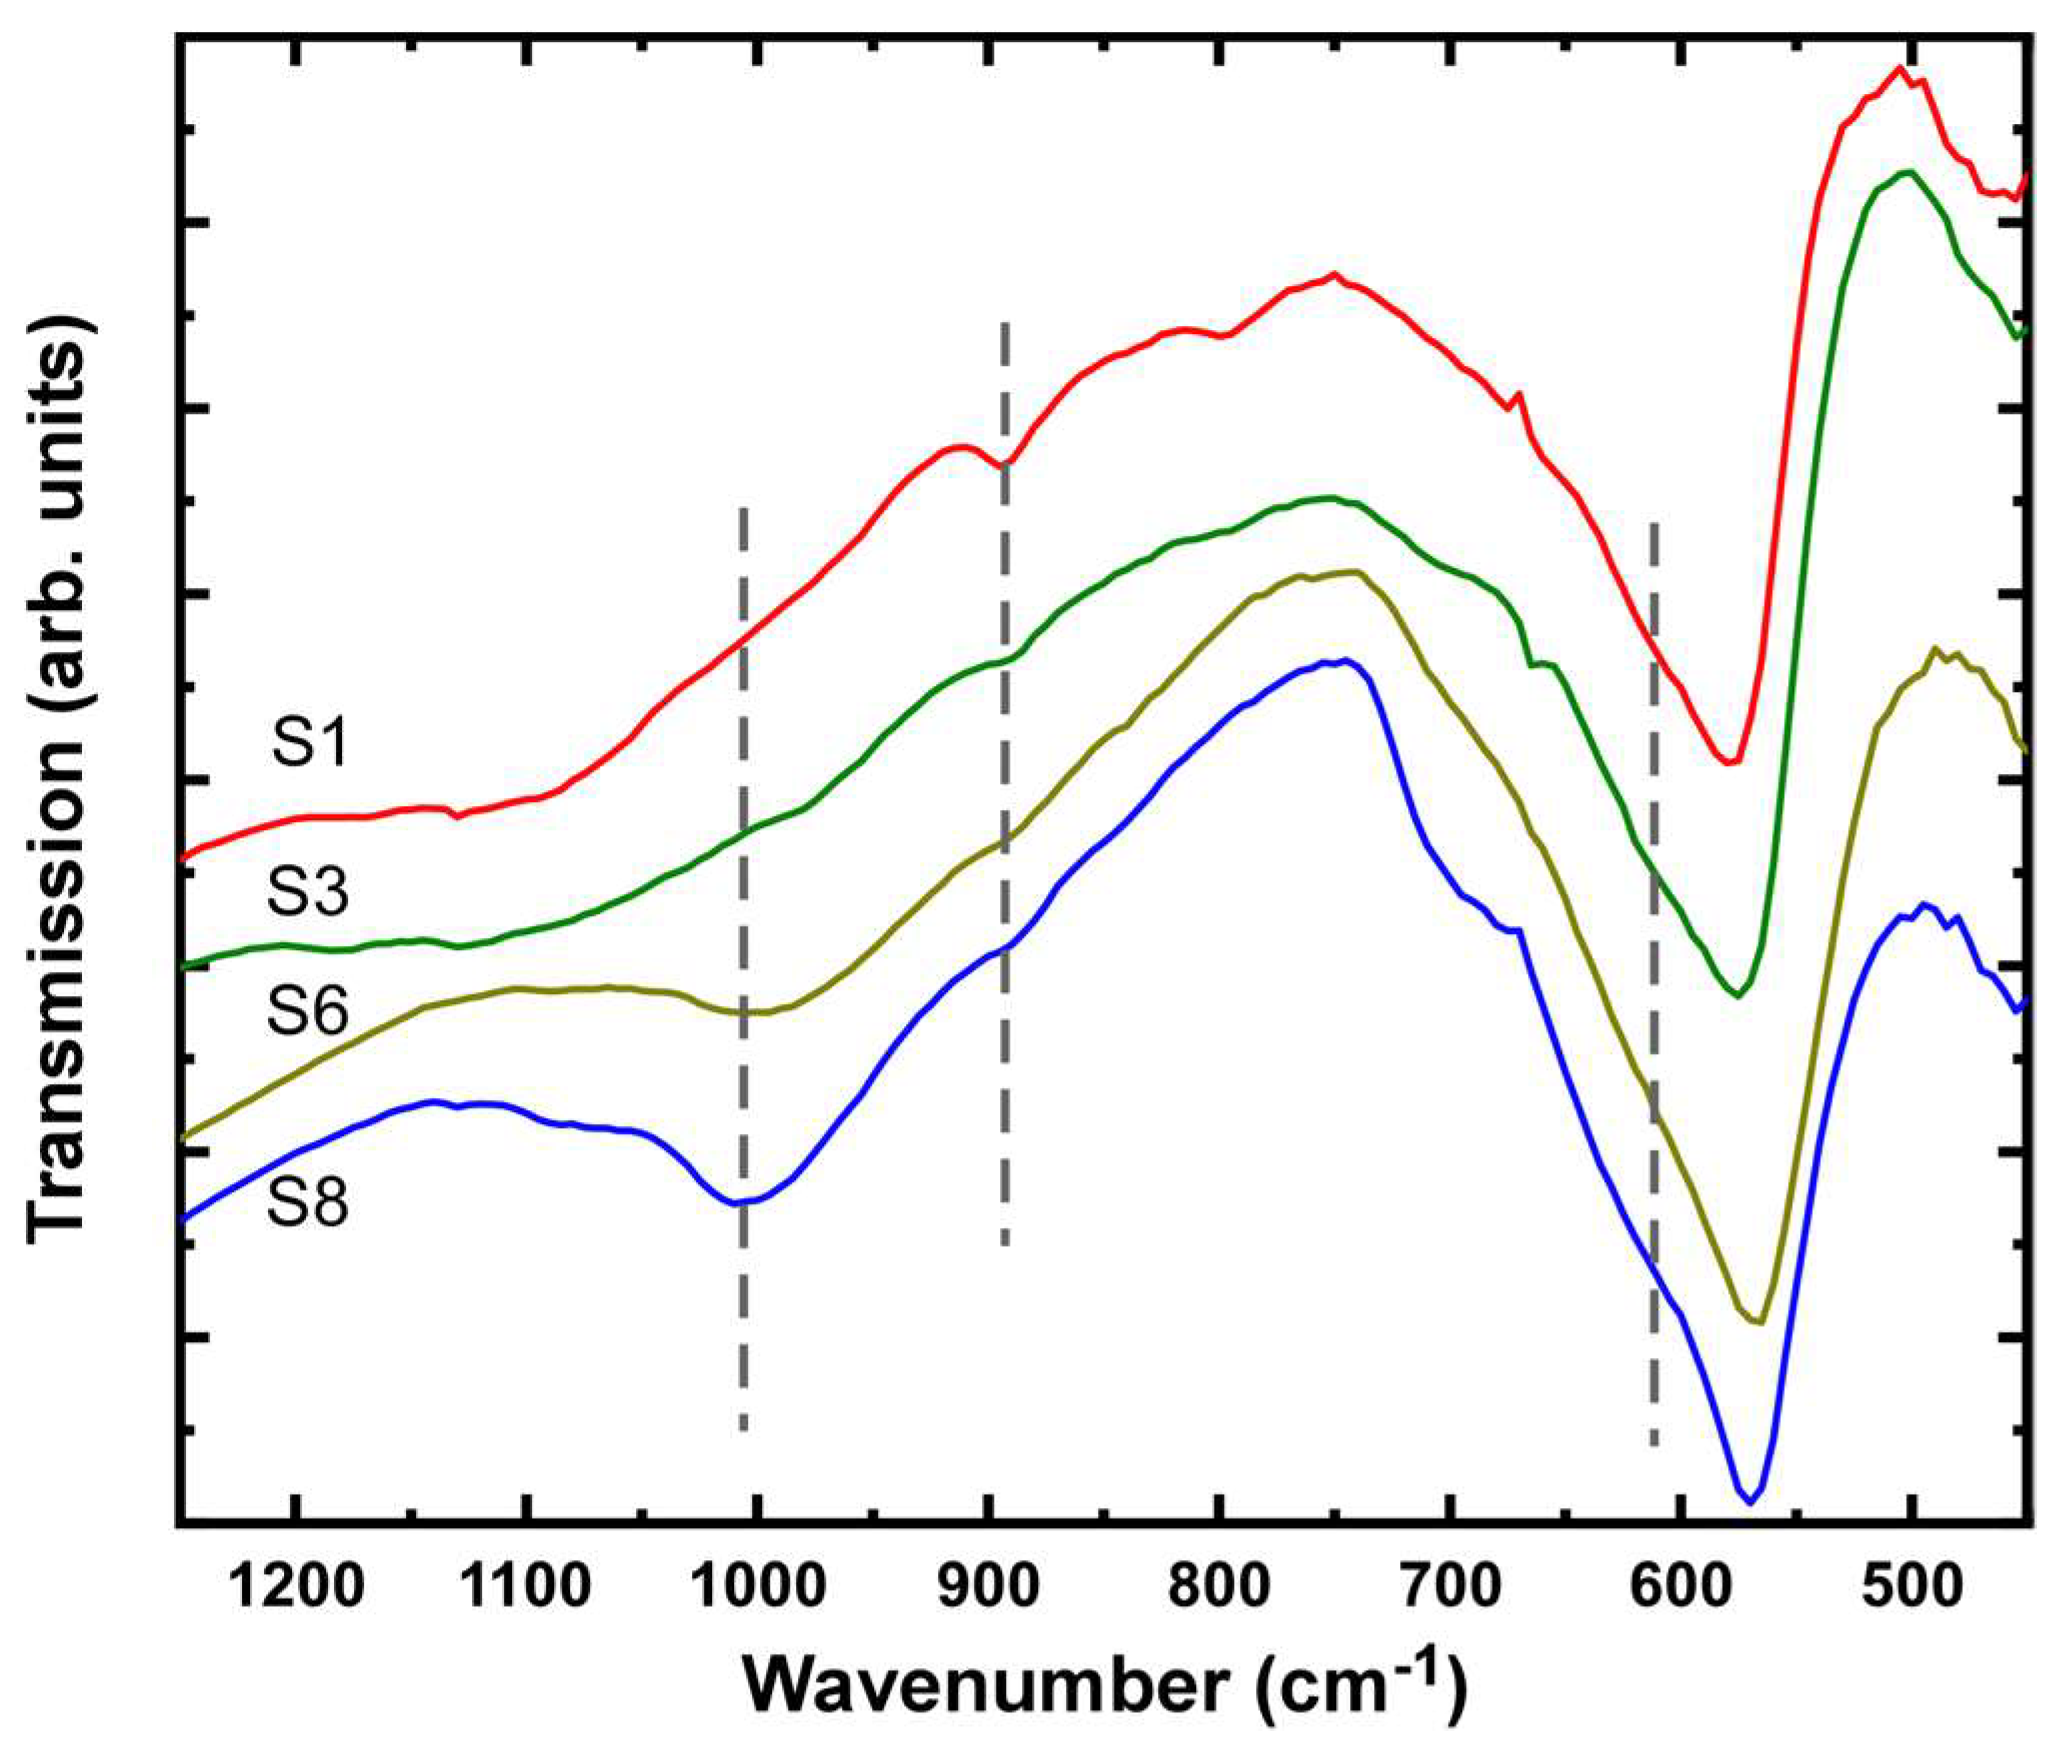
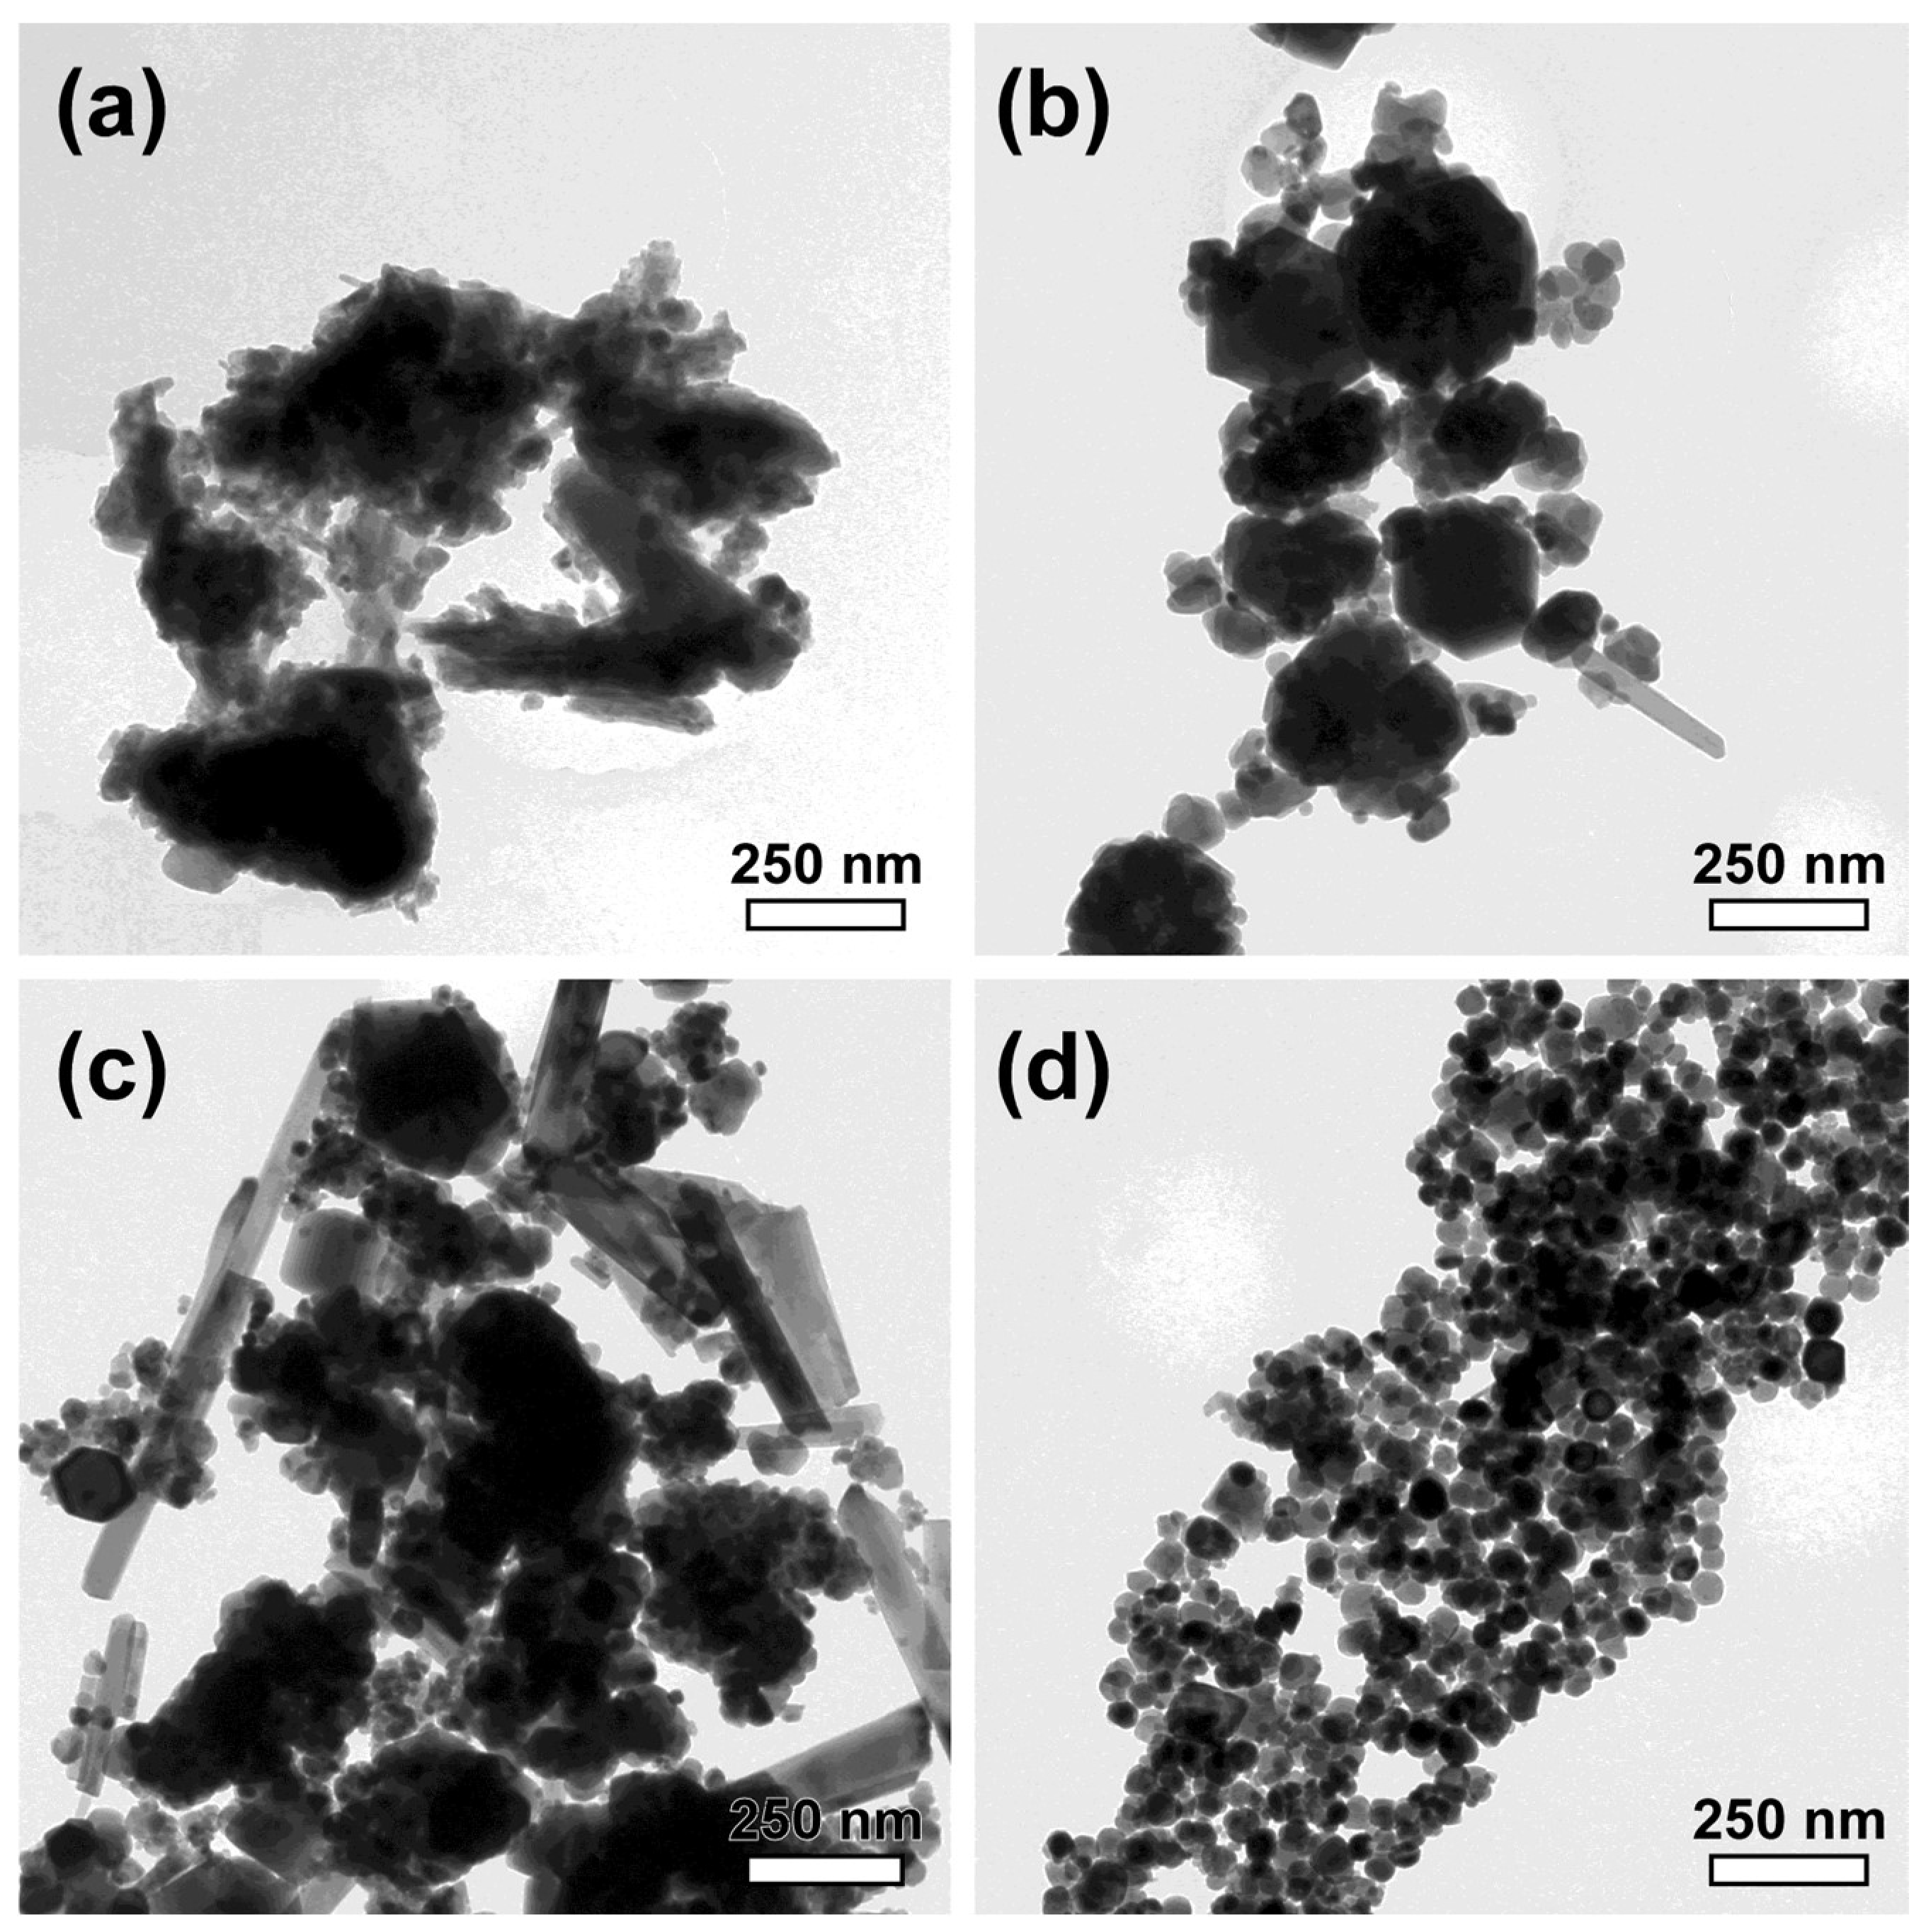
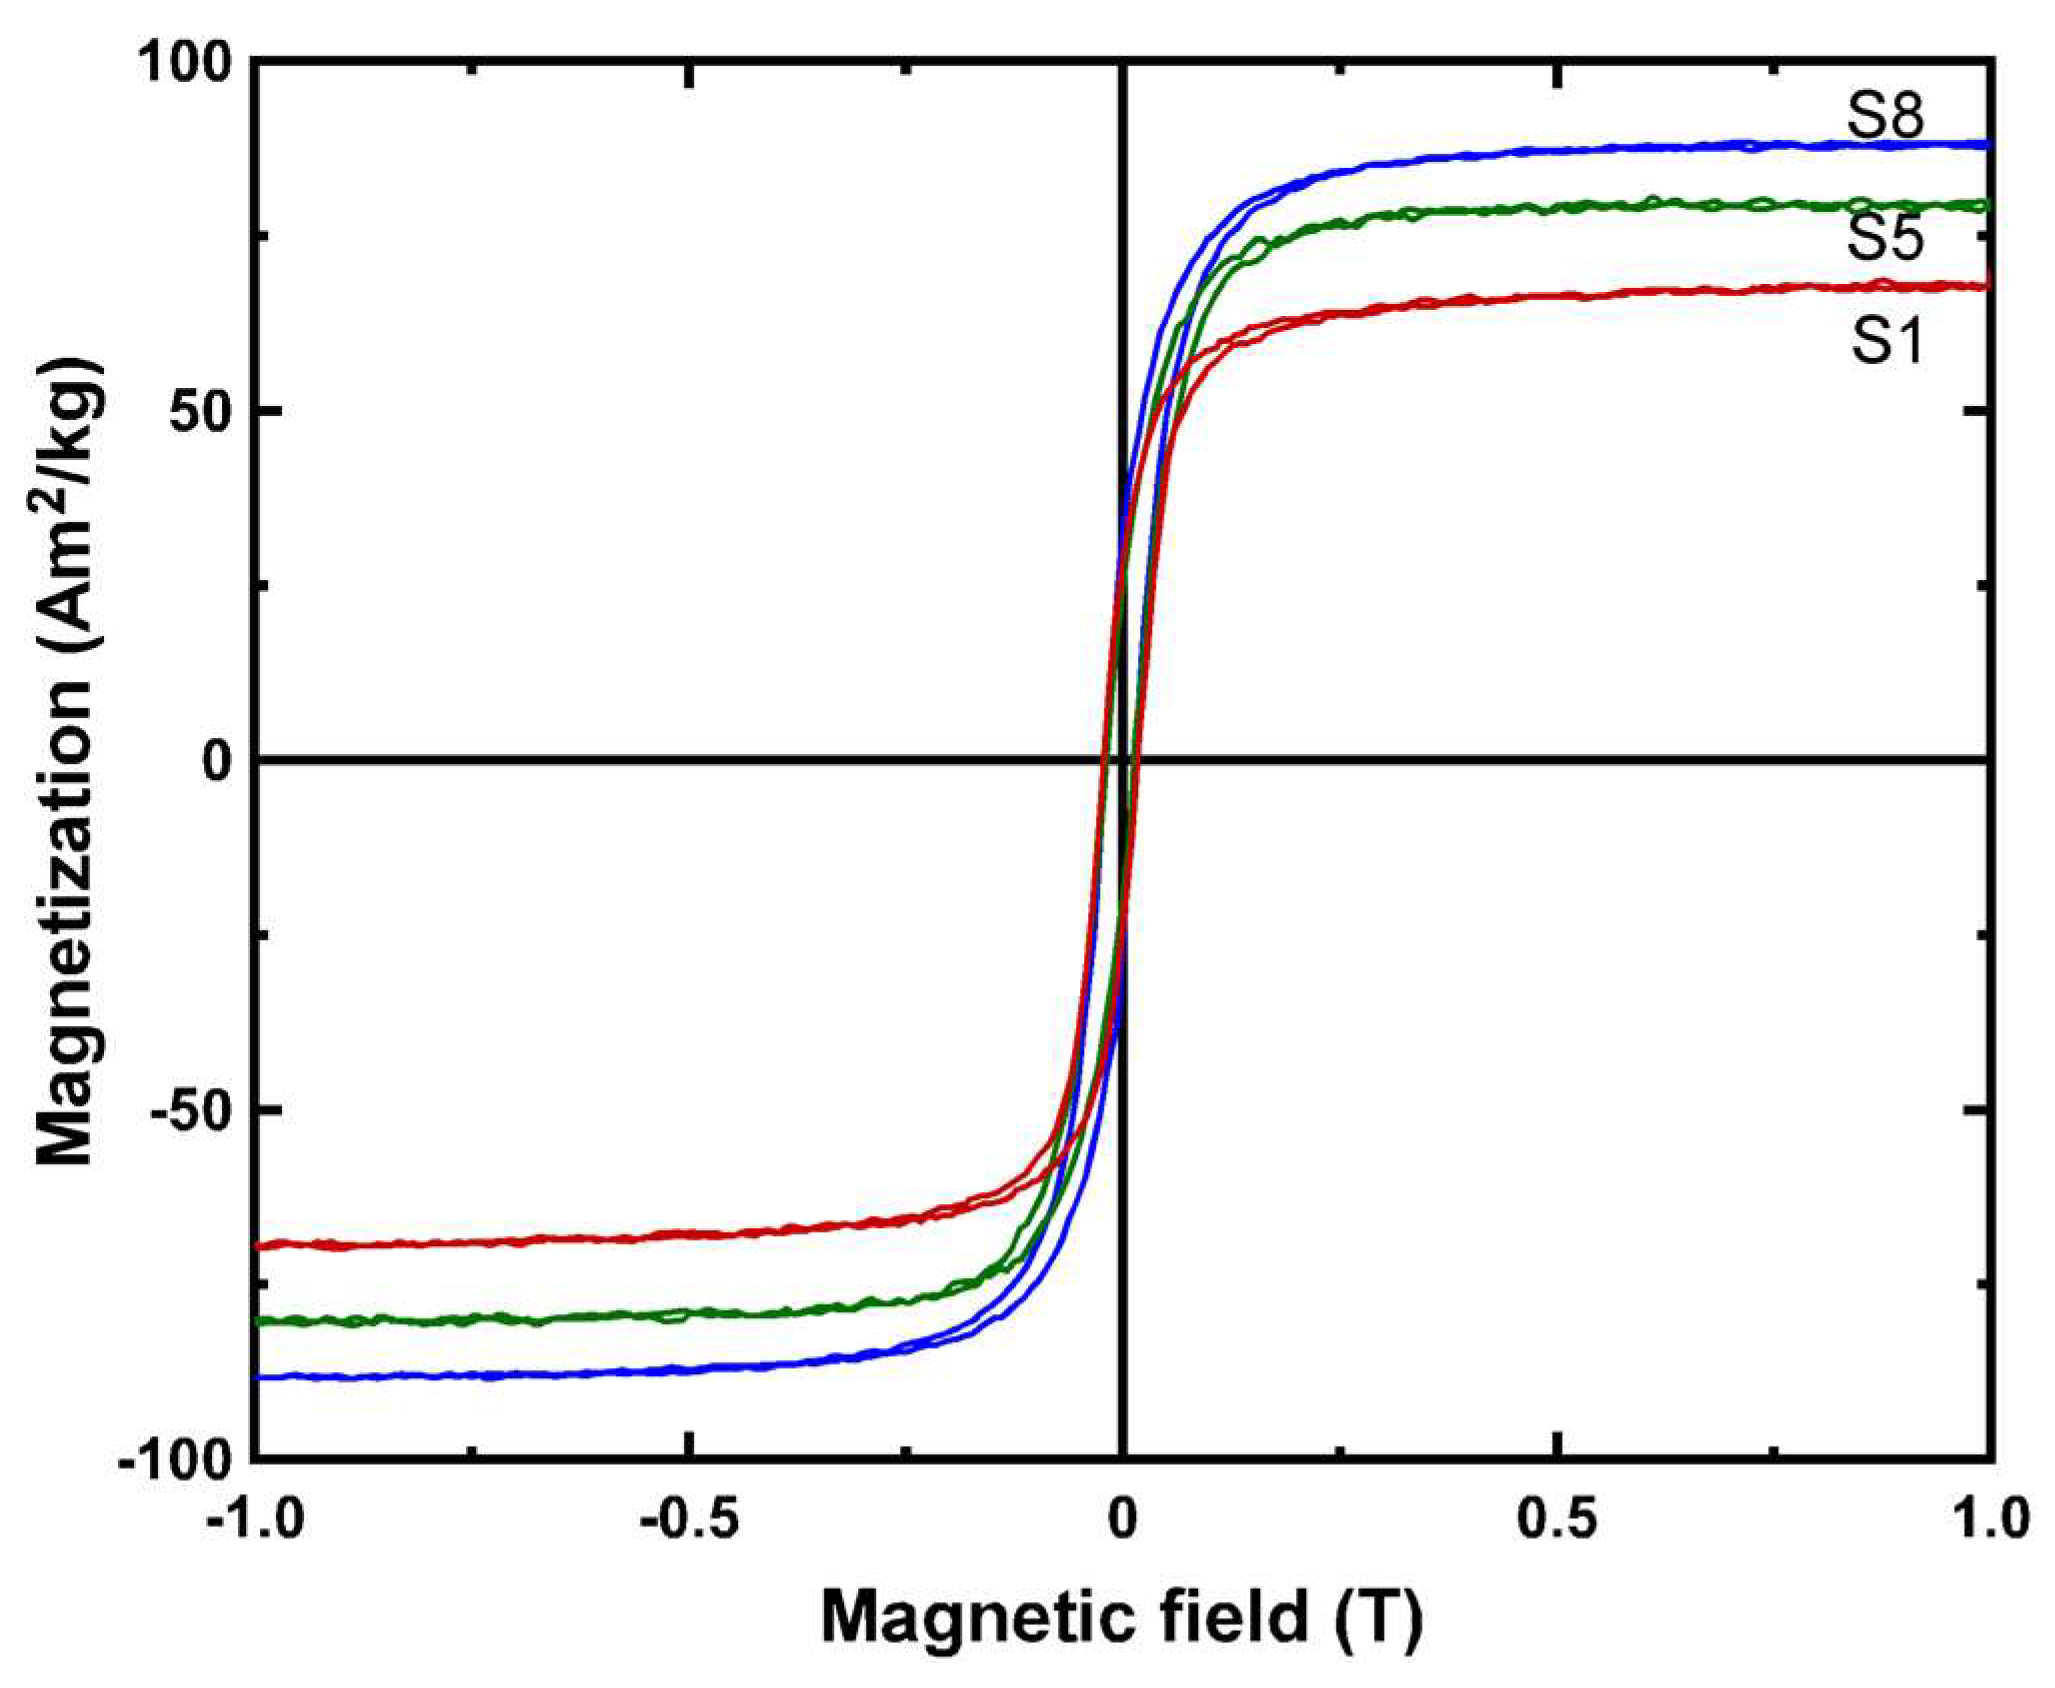
2.3. Characterization

The obtained nanoparticles were first analyzed to investigate their morphology and size using transmission electron microscopy (TEM) (JEM 1010, JEOL, Tokyo, Japan) operating at 100 kV. A drop of nanoparticle suspension in water was deposited onto a carbon-coated copper grid and allowed to dry at room temperature. X-ray diffractometry (XRD) was applied for powder samples using a water-cooled diffractometer (Ultima+, Rigaku, Tokyo, Japan) with Cu-Ka radiation, a step size of 0.05° and a delay step-time of 3 s, operating at 40 kV and 30 mA. Crystalline phases in the measured diffractograms were identified compared to the powder diffraction files (PDF) database [30]. The crystallite grain size D was determined using Scherrer’s equation with input from the geometrical characteristics of the main peaks: D = K·λ/β·cosθ, with K a dimensionless shape factor close to 0.9, λ the XRD wavelength, β the full width half maximum of relevant diffraction, and θ the diffraction angle.
Since the structural characterization employed here cannot distinguish whether Fe3O4 or its oxidation product γ-Fe2O3 is the main constituent in nanoparticles, the percentage of Fe2+ in the solid, which is proportional to Fe3O4 presence, was determined. The procedure involves the acid digestion of 0.1 g of nanoparticles in 50 mL of 7 M H2SO4 under heating and titration using 0.05 M KMnO4 solution. Total iron content was measured after sample dissolution in HCl, by graphite furnace atomic absorption spectrophotometry (AAnalyst 800, Perkin Elmer, Waltham, MA, USA).
The occupation of nanoparticle surface by adsorbed sulfate ions is related to the potential Cr(VI) uptake efficiency considering the similarity of SO42− with the CrO42− ionic forms which occur in the pH range of interest (around 7). Sulfates were quantitatively analyzed after proper dissolution in an Alltech 600 ion chromatography system with a Hichrom AllSep 7 μm Anion IC column using a solution of 0.85 mM NaHCO3/0.9 mM Na2CO3 as eluent. Physically-sorbed sulfates were released after gently stirring 20 mg sample with 100 mL distilled water for 15 min and filtration through a 0.45 mm pore-size membrane filter. Chemically-sorbed sulfates were extracted using 10 mL of 0.005 M NaOH for 15 min and then diluted to 100 mL with distilled water before filtration. The presence of sulfates was also evidenced by the mid-infrared region of Fourier-transformed infrared (FT-IR) spectra of the samples, which was recorded using a FT-IR spectrophotometer (Spectrum 100, Perkin-Elmer, Waltham, MA, USA). For measurement, nanoparticle powder was homogeneously mixed with KBr and pelletized. The spectra were obtained from 10 scans, with a resolution of 4 cm−1. The quasi-static magnetic properties of the samples have been measured using a vibrating sample magnetometer (1.2H/CF/HT, Oxford Instruments, Abingdon, UK) operating at room temperature. Hysteresis loops were recorded for a weighted quantity of nanoparticle powder immobilized in the holder of the instrument. A magnetic field of ±1 T was applied.

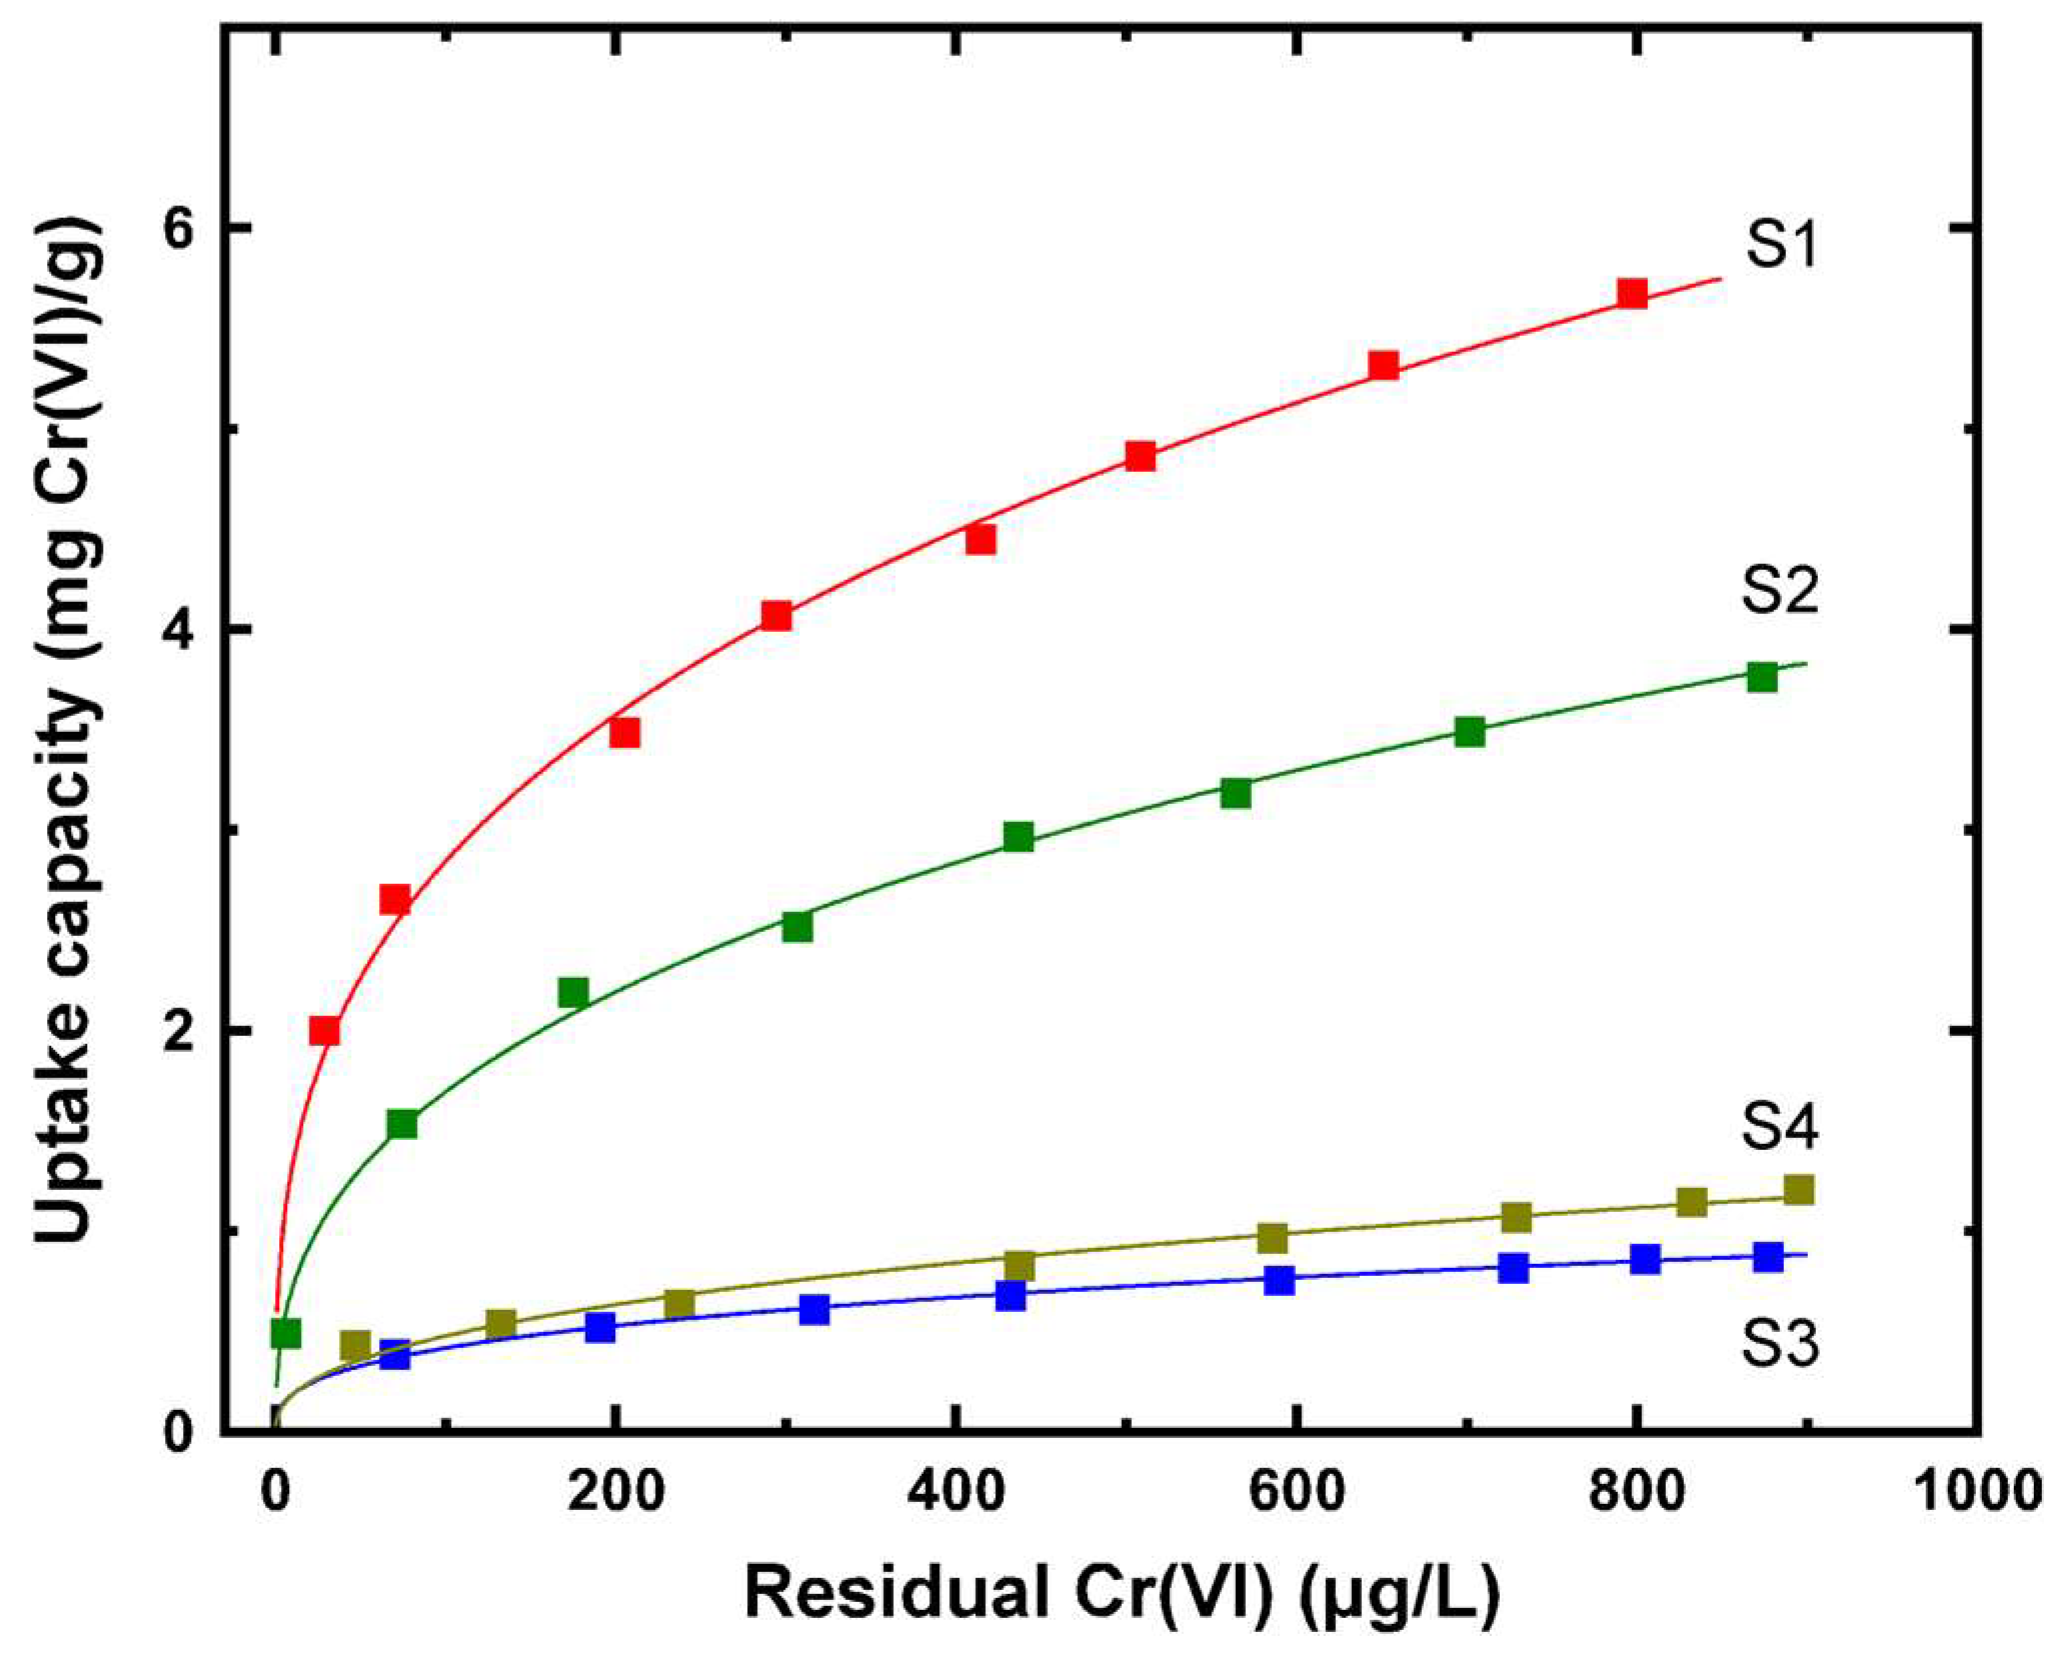
2.4. Cr(VI) Uptake Evaluation

The efficiency of Fe3O4 nanoparticles synthesized with various hydroxyl excess values as Cr(VI) adsorbents was determined through batch adsorption experiments where a quantity of nanoparticles was equilibrated with a Cr(VI) test solution. To acquire more relevant results from the viewpoint of real-world full-scale application in natural water polluted with low concentrations of Cr(VI), experiments involved the use of a water matrix with the presence of all common ions appearing in typical groundwater. The pH was fixed around the value of 7 and initial Cr(VI) concentrations were set below 1 mg/L representing a range close to drinking water regulation limits. The natural-like challenge water was prepared according to the National Sanitation Foundation (NSF) standard [31], as follows. For 10 L, 2.52 g (30 mmol) NaHCO3, 0.1214 g (1.4 mmol) NaNO3, 0.0018 g (0.0013 mmol) NaH2PO4·H2O, 0.0221 g (0.53 mmol) NaF, 0.706 mg (3.7 mmol) NaSiO3·5H2O, 1.47 g (10 mmol) CaCl2·2H2O, and 1.283 g (5.2 mmol) MgSO4·7H2O were diluted in distilled water.
In a typical experiment, a quantity of 20 mg of sample powder was dispersed into 200 mL of aqueous Cr(VI) solution in 300 mL conical flasks. The pH was controlled at 7 by the addition of drops of 0.01 M HCl if required. The dispersion was shaken for 24 h, and then, the solid was separated by filtration using 0.45 μm pore-size membranes. Residual Cr(VI) concentrations were determined by the diphenylcarbazide colorimetric method using a UV-visible spectrophotometer (U-5100, Hitachi, Kagoshima, Japan) adjusted at a wavelength of 540 nm. Adsorption isotherms were fitted by the Freundlich-type function, which better describes the observed trend in the low concentration range:
Qe = KFCe1/n,
where Qe is the amount of Cr(VI) captured per mass of adsorbent, Ce is the equilibrium concentration, while KF and n constants are related to adsorption capacity and affinity, respectively. For the comparison of Cr(VI) uptake efficiency between tested samples, the capacity at a residual Cr(VI) concentration equal to the suggested drinking water regulation limit of 25 μg/L (Q25-index) was applied. For comparison, fitting with a Langmuir function, which is characterized by a plateau formation when adsorption sites are saturated, was also performed:
Qe = Qmax·KL·Ce/(1 + KL·Ce),
where Qmax is the maximum adsorption capacity and KL is the Langmuir constant. Results are shown in the Supplementary Materials (Figures S1 and S2, Table S1).
X-ray photoelectron spectroscopy (XPS) (Axis Ultra DLD, KRATOS, Manchester, UK) was applied to identify the iron oxidation states and the sulfur configuration in the surface of the nanoparticles for representative samples prepared with positive and negative hydroxyl excess. Spectra were acquired using a monochromated Al–Kα1 X-ray beam as the excitation source. Pass energy was 160 eV for survey scans and 40 eV for high-resolution spectra. Calibration was performed in terms of charging induced shifts by assuming the C 1s peak (originating from carbon surface contamination) to be located at 284.6 ± 0.2 eV.

3. Results and Discussion

Figure 1 presents the XRD diagrams of the Fe3O4 samples prepared under increasing OH excess values. Identification indicates magnetite as the primary crystal phase in all samples, whereas under negative values (OHexcess = −0.1 M, S1), the formation of iron oxyhydroxides such as γ-FeOOH is also observed, suggesting that the hydroxyl balance deficiency in the intermediate products to some extent favors the degradation of initially formed green rust to more amorphous structures susceptible to spontaneous oxidation. The determined mean crystal size of Fe3O4, shown in Table 1, follows a decreasing trend with the hydroxyl excess overcoming the 40 nm at negative and near-neutral values but falls below 30 nm for values above +0.02 M. Such difference can be attributed to the fact that the ageing of green rust takes place near the isoelectric point of magnetite. Data from FTIR spectra for various samples (Figure 2) confirm the presence of Fe3O4 as the prevalent phase, considering the characteristic broad band at 570 cm−1 [32], although the shoulders at higher wavenumbers denote a slight degree of oxidation.
Further information on the exact morphology and arrangement of the produced nanoparticles was received from the TEM images of the samples (Figure 3). For hydroxyl excess conditions, well-defined and separate nanoparticles with almost spherical shape are obtained (sample S8). The mean particle diameter is estimated at around 28 nm with a low polydispersity rate and absence of significant agglomeration effects. However, in the presence of more acidic conditions during synthesis, the formation of large agglomerates assembled by the coalescence of smaller particles becomes dominant. The mean dimensions of such agglomerates are around 220 nm, appearing denser close to the zero-excess value (samples S3 and S6) but they seem to be more amorphous for hydroxyl concentration excess around −0.10 M (sample S1). In the last case, constituting nanoparticles are not distinct, suggesting that the nucleation step is very short compared to the growth stage of large granules. On the other hand, though being highly polydisperse, separate nanoparticles are organized to form agglomerates, such as those observed in samples S3 and S6. Another finding from these images is the presence of rod-like formations attributed to the existence of the iron oxyhydroxides when hydroxyl excess values gradually decrease. Although the proportion of such oxy-hydroxides becomes significant only for the extreme negative hydroxyl excess as observed in XRD diagrams, their appearance starts to occur even for samples synthesized with positive hydroxyl excess (sample S6). It should be pointed out that the effect of hydroxyl excess which is translated in a different Fe2+/OH ratio in the intermediate green rust structure modifies the dissociation rate to iron oxide formation and thus, is the key to establish magnetic nanoparticles with different diameter or different agglomeration rates. This point is discussed with details in previous works [33].
The compositional characteristics of the samples are reflected in the magnetic properties, which were derived by recording the corresponding hysteresis loops (Figure 4). The saturation magnetization value of sample S8 is the highest among all studied samples, approaching 88 Am2/kg, which is very close to the magnetization of bulk magnetite. Decreasing the hydroxyl excess results in the gradual decline of magnetization, measured to be 69 Am2/kg for sample S1. This trend is clearly related to the partial oxidation of Fe3O4 to γ-Fe2O3 as the hydroxyl excess decreases, causing a reduction in magnetization by around 10% with respect to magnetite (bulk value is reported around 74 Am2/kg). Additionally, the precipitation of Fe3+ oxyhydroxides also contributes to the decrease of magnetization values. Similar conclusions are extracted by the determination of Fe2+ in the samples, which is a representative indication of Fe3O4 stabilization. Results of titration analysis are summarized in Table 1 in the form of the Fe2+/Fe3+ mass ratio, with the ideal value for Fe3O4 of 0.5. Particularly, a Fe2+/Fe3+ ratio below 0.30 is identified for the samples with hydroxyl deficiency, suggesting that Fe3O4 represents less than 60% of the iron oxide forms. On the contrary, higher hydroxyl excess favors the stabilization of Fe3O4 with Fe2+/Fe3+ ratio overcoming 0.40 for sample S8, i.e., consisting of more than 80% of Fe3O4.
The aim of this work was to optimize the synthesis of Fe3O4 nanoparticles and achieve maximum uptake capacity for Cr(VI) under drinking water treatment conditions. Evaluation was performed by collecting data and plotting the corresponding isotherms in the residual concentration range below 1000 μg/L. Figure 5 presents the uptake isotherms for the samples prepared using negative values of hydroxyl excess. Samples S1 and S2, synthesized under the most acidic conditions, are the best performing systems, showing a significant Cr(VI) adsorption efficiency. Importantly, considering only a very small modification in the hydroxyl balance, the uptake capacity drops to very low levels for samples S3 and S4. A similar trend is observed for samples synthesized with near-zero and positive hydroxyl excess values (Figure 6). Samples S5 and S6, which were prepared by precipitation under conditions of OH/H+ balance, show low efficiency for the capture of Cr(VI). However, a small boost in hydroxyl excess above +0.02 M provides a considerable increase in the ability of nanoparticles to remove Cr(VI) from test water. This is obvious in the uptake isotherms of samples S7 and S8.
The described findings were further analyzed by fitting experimental data using Freundlich-type curves and estimating the Q25 value to obtain a direct index concerning uptake efficiency of each sample with respect to drinking water treatment demands. Corresponding fitting results when applying the Langmuir model for the monolayer coverage of adsorption sites is given in the supporting information, however, the correlation factors were worse than those calculated for the Freundlich isotherm fittings. Thus, the Freundlich model was deemed a better fit for this sorption process. Table 2 summarizes the parameters of Freundlich fitting for the studied samples. The KF values follow a proportional trend to that of the uptake capacity values, whereas parameter n demonstrates its highest values for samples synthesized with positive hydroxyl excess indicating a higher affinity for Cr(VI), captured on the surface of such nanoparticles.
Using the Freundlich equation for each sample, the Q25 index was estimated and plotted as a function of the hydroxyl excess, as depicted in Figure 7. The variation of Q25 suggests a direct correlation of Cr(VI) uptake efficiency with the synthesis conditions defined by the hydroxyl excess during the oxidative precipitation of iron sulfate. The worst performance is observed for hydroxyl excess values around zero, with a capacity dropping to 0.2–0.3 mg/g. Such conditions induce the precipitation of nanoparticles organized in aggregates with limited access to surface sites and moderate surface charge. However, modifying the hydroxyls equilibrium toward excess or deficiency results in significant improvement of removal efficiency. More specifically, when hydroxyl excess overcomes +0.02 M, the Cr(VI) uptake for residual concentration 25 μg/L increases to 1.8 mg/g and approaches 2.5 mg/g for sample S8. The obtained Fe3O4 nanoparticles in this case are characterized by small unit size and a high degree of monodispersity, which implies high specific surface areas available for interaction with the pollutant oxyions. In addition, synthesis with high hydroxyl excess favors an Fe2+/Fe3+ ratio close to stoichiometric for Fe3O4 (Table 1), denoting an improved potential for the reduction of Cr(VI). The reduction mechanism appears to overcome the effect of negative surface charge, which in principle perturbs the approach of CrO42− to the nanoparticles. It should be noted that the enhanced concentration of Na+ in samples prepared with hydroxyl excess partially balances the effective surface charge.
XPS analysis of surface iron and oxygen is indicative of the high Fe2+ content in S8, which illustrates that this sample indeed has a considerable reducing ability toward Cr(VI) transformation. Particularly, compared to the Fe 2p spectra of sample S1 (Figure 8a), S8 shows a noticeable shift of the Fe 2p3/2 below 710 eV and a more prominent contribution of the satellite peak related to Fe2+ below 718 eV, which are characteristic for freshly prepared Fe3O4 [34,35]. The relative ratio of the Fe2+ contribution in the Fe 2p3/2 peak increases from 22.9% to 32.9% with the rest corresponding to peaks attributed to the octahedral and tetrahedral configuration of Fe3+. The enhancement of Fe3+ peaks in sample S1 is in accordance with the presence of iron oxyhydroxides and the partial oxidation of Fe3O4. Similar conclusions are derived by the O 1s spectra of these representative samples. In sample S1 (Figure 8b), the three contributions correspond to the Fe-O bonds (529.5 eV), the O-H bonds (531.5 eV), and the C-O bonds (533 eV). The contribution from iron oxides appears stronger in sample S8 because of the Fe3O4 stabilization on the nanoparticle surface (Figure 8d) whereas the split into two peaks located at 529.5 and 530.3 is evidenced. It can be assumed that such observation can be related to the presence of oxygen atoms in tetrahedral and octahedral sites of Fe3O4 or from another point of view to the coexisting FeO and Fe2O3 substructures in magnetite with high purity. However, in sample S1 the equilibrium shifts to the side of O-H, in agreement with the presence of iron oxyhydroxides, and that is the reason for a significant overlay of the Fe-O peak splitting.
Surprisingly, the efficiency of samples synthesized with hydroxyl deficiency is comparable to that of those prepared with excess. When hydroxyl excess obtains values below −0.05 M, the Q25 increases and gradually approaches 2 mg/g. In this case, a possible explanation stands on the occurrence of an exchange mechanism between the structurally similar adsorbed ions of SO42− and the CrO42− ones [36]. Surface adsorption of sulfates was observed in these samples (Table 1) as a consequence of the higher density of positive charges, whereas the amorphous crystal structure also contributes to this tendency [37]. The attachment of sulfates on the surface of sample S1 is evidenced by the appearance of the v1 and the v4 stretching bands in the FTIR spectrum located around 900 and 620 cm−1, respectively (Figure 2). For samples prepared with hydroxyl excess (sample S8), the broad peak above 1000 cm−1 corresponds to the degenerate asymmetric v3 sulfate band, which originates from the physisorbed ions in the diffuse layer [38]. High-resolution XPS analysis on the S2p photoelectron’s binding energy range may provide a further investigation of chemical environment and developing bonds of sulfur. Figure 9 presents the corresponding spectrum of sample S1 for which a sufficient signal was still detectable after carrying out repeatedly intense washing with distilled water to release physically-sorbed sulfates. The experimental spectrum was deconvoluted using one unresolved doublet corresponding to the S2p1/2 and S2p3/2 photoelectron lines, which have a 1.2 eV spectral separation [39]. The peak at around 169 eV is attributed to the presence of a metal-sulfate configuration such as Fe-SO4 complexes on the surface of the nanostructures [40]. This finding supports the mechanism of Cr(VI) capture through an ion exchange assisted reduction path where iron sulfate complexes provide favorable sites to host chromate anions as a first step of the whole process taking place.

4. Conclusions

Water treatment research has justified the potential of Fe3O4 nanoparticles to function as a promising Cr(VI) removal adsorbent. This study explored the possibility to optimize Cr(VI) uptake capacity for residual concentrations below 25 μg/L by tuning iron oxide nanoparticle synthesis parameters of the oxidative precipitation methodology. Results showed that hydroxyl excess, as defined by the balance of acidic and alkaline compounds in the reaction mixture, may determine the observed efficiency according to the impact in the reducing activity and the surface charge. More specifically, adjusting the hydroxyl excess above +0.02 M multiplied the Cr(VI) uptake by a factor of 9 reaching a value of 2.5 mg/g. Such increase is attributed to the high specific surface area of the isolated nanoparticles and the improved stabilization of Fe2+ species in the crystal structure of Fe3O4. However, a similar increase of efficiency (approximately 2 mg/g) was found when hydroxyl deficiency (<−0.05 M) was applied during synthesis. In this case, despite the high degree of aggregation and lower Fe2+ presence, the activation of an exchange mechanism between adsorbed sulfates and chromate oxyanions seems to assist the capture process. The high magnetic response of the tested samples appears as another significant advantage of this material thanks to its facile removal toward the implementation of magnetic nanoparticles in drinking water purification.

Supplementary Materials

The following supporting information can be downloaded at: https://www.mdpi.com/article/10.3390/w14091335/s1, Figure S1: Langmuir fitting of Cr(VI) uptake isotherms for samples S1, S2, S3, and S4 in the residual concentration range 0–1000 μg/L at equilibrium pH 7, Figure S2: Langmuir fitting of Cr(VI) uptake isotherms for samples S5, S6, S7, and S8 in the residual concentration range 0–1000 μg/L at equilibrium pH 7 Table S1: Langmuir fitting parameters of the uptake isotherms data for studied samples.

Author Contributions

Conceptualization, K.K. and K.S.; methodology, K.K., E.C., T.A. and D.K.; validation, E.C., T.A. and D.K.; data curation, T.A. and D.K.; writing—original draft preparation, K.K. and K.S.; writing—review and editing, K.K., K.S., G.V. and M.M.; supervision, G.V. and M.M. All authors have read and agreed to the published version of the manuscript.

Funding

The research project was supported by the Hellenic Foundation for Research and Innovation (H.F.R.I.) under the “2nd Call for H.F.R.I. Research Projects to support Post-Doctoral Researchers” (project number: 00046 MagnoSorb).

Data Availability Statement

The data presented in this study are available on request from the corresponding author.

Acknowledgments

Authors would like to thank Maria del Puerto Morales from Materials for Medicine and Biotechnology Group of Instituto de Ciencia de Materiales de Madrid for her scientific support in the implementation of this study. Warm thanks to Stefanos Mourdikoudis from the University of Chemistry and Technology Prague for his assistance in the improvement of the revised version.

Conflicts of Interest

The authors declare no conflict of interest.

References

  1. Simeonidis, K.; Martinez-Boubeta, C.; Zamora-Pérez, P.; Rivera-Gil, P.; Kaprara, E.; Kokkinos, E.; Mitrakas, M. Implementing nanoparticles for competitive drinking water purification. Environ. Chem. Lett. 2019, 17, 705–719. [Google Scholar] [CrossRef]
  2. Yadav, N.; Garg, V.K.; Chhillar, A.K.; Rana, J.S. Detection and remediation of pollutants to maintain ecosustainability employing nanotechnology: A review. Chemosphere 2021, 280, 130792. [Google Scholar] [CrossRef] [PubMed]
  3. Ali, I. New generation adsorbents for water treatment. Chem. Rev. 2012, 112, 5073–5091. [Google Scholar] [CrossRef] [PubMed]
  4. Simeonidis, K.; Mourdikoudis, S.; Kaprara, E.; Mitrakas, M.; Polavarapu, L. Inorganic engineered nanoparticles in drinking water treatment: A critical review. Environ. Sci. Water Res. Technol. 2016, 2, 43–70. [Google Scholar] [CrossRef] [Green Version]
  5. Adeleye, A.S.; Conway, J.R.; Garner, K.; Huang, Y.; Su, Y.; Keller, A.A. Engineered nanomaterials for water treatment and remediation: Costs, benefits, and applicability. Chem. Eng. J. 2016, 286, 640–662. [Google Scholar] [CrossRef] [Green Version]
  6. Qu, X.; Alvarez, P.J.J.; Li, Q. Applications of nanotechnology in water and wastewater treatment. Water Res. 2013, 47, 3931–3946. [Google Scholar] [CrossRef]
  7. Karn, B.; Kuiken, T.; Otto, M. Nanotechnology and in situ remediation: A review of the benefits and potential risks. Environ. Health Perspect. 2009, 117, 1823–1831. [Google Scholar] [CrossRef] [Green Version]
  8. Gómez-Pastora, J.; Bringas, E.; Ortiz, I. Recent progress and future challenges on the use of high performance magnetic nano-adsorbents in environmental applications. Chem. Eng. J. 2014, 256, 187–204. [Google Scholar] [CrossRef]
  9. Xu, P.; Zeng, G.M.; Huang, D.L.; Feng, C.L.; Hu, S.; Zhao, M.H.; Lai, C.; Wei, Z.; Huang, C.; Xie, G.X.; et al. Use of iron oxide nanomaterials in wastewater treatment: A review. Sci. Total Environ. 2012, 424, 1–10. [Google Scholar] [CrossRef]
  10. Xu, Y.; Li, C.; Zhu, X.; Huang, W.E.; Zhang, D. Application of magnetic nanoparticles in drinking water purification. Environ. Eng. Manag. J. 2014, 13, 2023–2029. [Google Scholar]
  11. Ahmed, T.; Imdad, S.; Yaldram, K.; Butt, N.M.; Pervez, A. Emerging nanotechnology-based methods for water purification: A review. Desalin. Water Treat. 2014, 52, 4089–4101. [Google Scholar] [CrossRef]
  12. Veintemillas-Verdaguer, S.; Marciello, M.; Morales, M.D.P.; Serna, C.J.; Andrés-Vergés, M. Magnetic nanocrystals for biomedical applications. Prog. Cryst. Growth Charact. Mater. 2014, 60, 80–86. [Google Scholar] [CrossRef]
  13. Asimakidou, T.; Makridis, A.; Veintemillas-Verdaguer, S.; Morales, M.P.; Kellartzis, I.; Mitrakas, M.; Vourlias, G.; Angelakeris, M.; Simeonidis, K. Continuous production of magnetic iron oxide nanocrystals by oxidative precipitation. Chem. Eng. J. 2020, 393, 124593. [Google Scholar] [CrossRef]
  14. Barceloux, D.G. Chromium. J. Toxicol. Clin. Toxicol. 1999, 37, 173–194. [Google Scholar] [CrossRef] [PubMed]
  15. Linos, A.; Petralias, A.; Christophi, C.A.; Christoforidou, E.; Kouroutou, P.; Stoltidis, M.; Veloudaki, A.; Tzala, E.; Makris, K.C.; Karagas, M.R. Oral ingestion of hexavalent chromium through drinking water and cancer mortality in an industrial area of Greece—An ecological study. Environ. Health A Glob. Access Sci. Source 2011, 10, 50. [Google Scholar] [CrossRef] [Green Version]
  16. Costa, M. Potential hazards of hexavalent chromate in our drinking water. Toxicol. Appl. Pharmacol. 2003, 188, 1–5. [Google Scholar] [CrossRef]
  17. Beaumont, J.J.; Sedman, R.M.; Reynolds, S.D.; Sherman, C.D.; Li, L.H.; Howd, R.A.; Sandy, M.S.; Zeise, L.; Alexeeff, G.V. Cancer mortality in a Chinese population exposed to hexavalent chromium in drinking water. Epidemiology 2008, 19, 12–23. [Google Scholar] [CrossRef]
  18. California Office of Administrative Law. Chromium-6 Drinking Water MCL.; California State Water Quality Control Board: Sacramento, CA, USA, 2020.
  19. European Union. Directive (EU) 2020/2184 of the European Parliament and of the Council of 16 December 2020 on the Quality of Water Intended for Human Consumption. Off. J. Eur. Union 2020, 1–62. Available online: https://eur-lex.europa.eu/eli/dir/2020/2184/oj (accessed on 14 March 2022).
  20. Simeonidis, K.; Kaprara, E.; Samaras, T.; Angelakeris, M.; Pliatsikas, N.; Vourlias, G.; Mitrakas, M.; Andritsos, N. Optimizing magnetic nanoparticles for drinking water technology: The case of Cr (VI). Sci. Total Environ. 2015, 535, 61–68. [Google Scholar] [CrossRef]
  21. Lv, X.; Xu, J.; Jiang, G.; Tang, J.; Xu, X. Highly active nanoscale zero-valent iron (nZVI)-Fe 3O 4 nanocomposites for the removal of chromium (VI) from aqueous solutions. J. Colloid Interface Sci. 2012, 369, 460–469. [Google Scholar] [CrossRef]
  22. Tang, S.C.N.; Lo, I.M.C. Magnetic nanoparticles: Essential factors for sustainable environmental applications. Water Res. 2013, 47, 2613–2632. [Google Scholar] [CrossRef]
  23. Wu, Y.; Zhang, J.; Tong, Y.; Xu, X. Chromium (VI) reduction in aqueous solutions by Fe3O4-stabilized Fe0 nanoparticles. J. Hazard. Mater. 2009, 172, 1640–1645. [Google Scholar] [CrossRef] [PubMed]
  24. Salas, G.; Casado, C.; Teran, F.J.; Miranda, R.; Serna, C.J.; Morales, M.P. Controlled synthesis of uniform magnetite nanocrystals with high-quality properties for biomedical applications. J. Mater. Chem. 2012, 22, 21065. [Google Scholar] [CrossRef]
  25. Sugimoto, T.; Matijević, E. Formation of uniform spherical magnetite particles by crystallization from ferrous hydroxide gels. J. Colloid Interface Sci. 1980, 74, 227. [Google Scholar] [CrossRef]
  26. Verges, M.A.; Costo, R.; Roca, A.G.; Marco, J.F.; Goya, G.F.; Serna, C.J.; Morales, M.P.; Andrés Vergés, M.; Costo, R.; Roca, A.G.; et al. Uniform and water stable magnetite nanoparticles with diameters around the monodomain-multidomain limit. J. Phys. D-Appl. Phys. 2008, 41, 134003. [Google Scholar] [CrossRef]
  27. Gallo-Cordova, A.; Morales, M.; Del, P.; Mazarío, E. Effect of the surface charge on the adsorption capacity of chromium (VI) of iron oxide magnetic nanoparticles prepared by microwave-assisted synthesis. Water 2019, 11, 2372. [Google Scholar] [CrossRef] [Green Version]
  28. Nawaz, T.; Iqbal, M.; Zulfiqar, S.; Sarwar, M.I. Trimellitic acid functionalized magnetite nanoparticles for the efficient removal of Pb (II) and Cr (VI) from wastewater streams. Korean J. Chem. Eng. 2019, 36, 860–868. [Google Scholar] [CrossRef]
  29. Peterson, M.L.; White, A.F.; Brown, G.E.; Parks, G.A. Surface passivation of magnetite by reaction with aqueous Cr (VI):  XAFS and TEM results. Environ. Sci. Technol. 1997, 31, 1573–1576. [Google Scholar] [CrossRef]
  30. International Centre for Diffraction Data. Powder Diffraction File; Joint Center for Powder Diffraction Studies, Ed.; International Centre for Diffraction Data: Newtown Square, PA, USA, 2004. [Google Scholar]
  31. Amy, G.; Chen, H.W.; Drizo, A.; Von Gunten, U.; Brandhuber, P.; Hund, R.; Chowdhury, Z.; Kommineni, S.; Sinha, S.; Jekel, M.; et al. Adsorbent Treatment Technologies for Arsenic Removal, 1st ed.; AWWA Research Foundation: Washington, WA, USA, 2005. [Google Scholar]
  32. Cornell, R.M.; Schwertmann, U. The Iron Oxides: Structure, Properties, Reactions, Occurrences, and Uses; John and Wiley and Sons: Hoboken, NJ, USA, 2003; ISBN 9783527302741. [Google Scholar]
  33. Luengo, Y.; Morales, M.P.; Gutiérrez, L.; Veintemillas-Verdaguer, S. Counterion and solvent effects on the size of magnetite nanocrystals obtained by oxidative precipitation. J. Mater. Chem. C 2016, 4, 9482–9488. [Google Scholar] [CrossRef]
  34. Finck, N.; Radulescu, L.; Schild, D.; Rothmeier, M.; Huber, F.; Lützenkirchen, J.; Rabung, T.; Heberling, F.; Schlegel, M.L.; Dideriksen, K.; et al. XAS signatures of Am (III) adsorbed onto magnetite and maghemite. In Journal of Physics: Conference Series, Proceedings of the 16th International Conference on X-ray Absorption Fine Structure (XAFS16), Karlsruhe, Germany, 23–28 August 2015; IOP Publishing: Bristol, UK, 2016; Volume 712, p. 712. [Google Scholar]
  35. Cîrcu, M.; Nan, A.; Borodi, G.; Liebscher, J.; Turcu, R. Refinement of magnetite nanoparticles by coating with organic stabilizers. Nanomaterials 2016, 6, 228. [Google Scholar] [CrossRef] [Green Version]
  36. Al Mamun, A.; Onoguchi, A.; Granata, G.; Tokoro, C. Role of pH in green rust preparation and chromate removal from water. Appl. Clay Sci. 2018, 165, 205–213. [Google Scholar] [CrossRef]
  37. Qiu, L.; Burton, G.R.; Rousseau, S.; Qian, J. Kinetics and thermodynamics of sulfate adsorption on magnetite at elevated temperatures. J. Solut. Chem. 2019, 48, 1488–1502. [Google Scholar] [CrossRef]
  38. Tresintsi, S.; Simeonidis, K.; Pliatsikas, N.; Vourlias, G.; Patsalas, P.; Mitrakas, M. The role of so 4 2—Surface distribution in arsenic removal by iron oxy-hydroxides. J. Solid State Chem. 2014, 213, 145–151. [Google Scholar] [CrossRef]
  39. Bierla, A.; Fromentin, G.; Minfray, C.; Martin, J.M.; Le Mogne, T.; Genet, N. Mechanical and physico-chemical study of sulfur additives effect in milling of high strength steel. Wear 2012, 286, 116–123. [Google Scholar] [CrossRef] [Green Version]
  40. Baltrusaitis, J.; Cwiertny, D.M.; Grassian, V.H. Adsorption of sulfur dioxide on hematite and goethite particle surfaces. Phys. Chem. Chem. Phys. 2007, 9, 5542–5554. [Google Scholar] [CrossRef]
Figure 1. XRD diagrams of studied samples for various values of hydroxyl excess used in the Fe3O4 nanoparticle synthesis. Short black lines indicate the expected angles for Fe3O4 diffraction peaks (PDF#88-0315). The presence of γ-FeOOH is revealed by blue short lines in the diagram of sample S1 (PDF#44-1415).
Water 14 01335 g001
Figure 2. FTIR spectra of samples S1, S3, S6, and S8 synthesized with a sequence of increasing OH excess. Vertical lines indicate band ranges related to different sulfate configurations.
Water 14 01335 g002
Figure 3. TEM images of samples S1 (a), S3 (b), S6 (c), and S8 (d) synthesized with increasing hydroxyl excess from −0.10 to +0.03 M.
Water 14 01335 g003
Figure 4. Magnetic hysteresis loops of samples S1, S5, and S8 synthesized with a sequence of increasing hydroxyl excess used in the Fe3O4 nanoparticle synthesis.
Water 14 01335 g004
Figure 5. Cr(VI) uptake isotherms for samples S1, S2, S3, and S4 in the residual concentration range 0–1000 μg/L at equilibrium pH 7. Continuous line indicates fitting with a Freundlich equation.
Water 14 01335 g005
Figure 6. Cr(VI) uptake isotherms for samples S5, S6, S7, and S8 in the residual concentration range 0–1000 μg/L at equilibrium pH 7. Continuous line indicates fitting with a Freundlich equation.
Water 14 01335 g006
Figure 7. Correlation of uptake capacity for residual Cr(VI) concentration 25 μg/L with the hydroxyl excess used in the Fe3O4 nanoparticle synthesis.
Water 14 01335 g007
Figure 8. High-resolution Fe 2p and O 1s XPS spectra of samples S1 (a,b) and S8 (c,d).
Water 14 01335 g008
Figure 9. High-resolution S 2p XPS spectra of sample S1.
Water 14 01335 g009
Table 1. Summary of the properties of the studied samples corresponding to the various hydroxyl excess values applied during synthesis.
SampleOHexcess
(M)
Fe2+/Fe3+Adsorbed SO42– (%wt.)Na/FeMagnetization (Am2/kg)Mean Crystal Size (nm)
S1−0.100.250.70.0066942
S2−0.070.280.40.0127247
S3−0.040.260.10.0077339
S4−0.020.290.10.0117541
S5−0.010.32-0.0197948
S6+0.010.33-0.0228036
S7+0.020.36-0.0418422
S8+0.030.42-0.0548829
Table 2. Freundlich fitting parameters of the uptake isotherms data for studied samples.
SampleKF
(μg/mg)/(μg/L)1/n
1/nR2
S10.6270.3290.994
S20.4080.3710.996
S30.0870.3410.995
S40.0730.4070.978
S50.0840.4200.996
S60.0730.3330.994
S70.9810.1720.989
S81.1510.2320.986
Publisher’s Note: MDPI stays neutral with regard to jurisdictional claims in published maps and institutional affiliations.

