
The Effects of Different Inlet Configurations on Particles Transport and Residence Time in a Shallow and Narrow Coastal Lagoon: A Numerical Based Investigation


Abstract
1. Introduction
2. Methodology
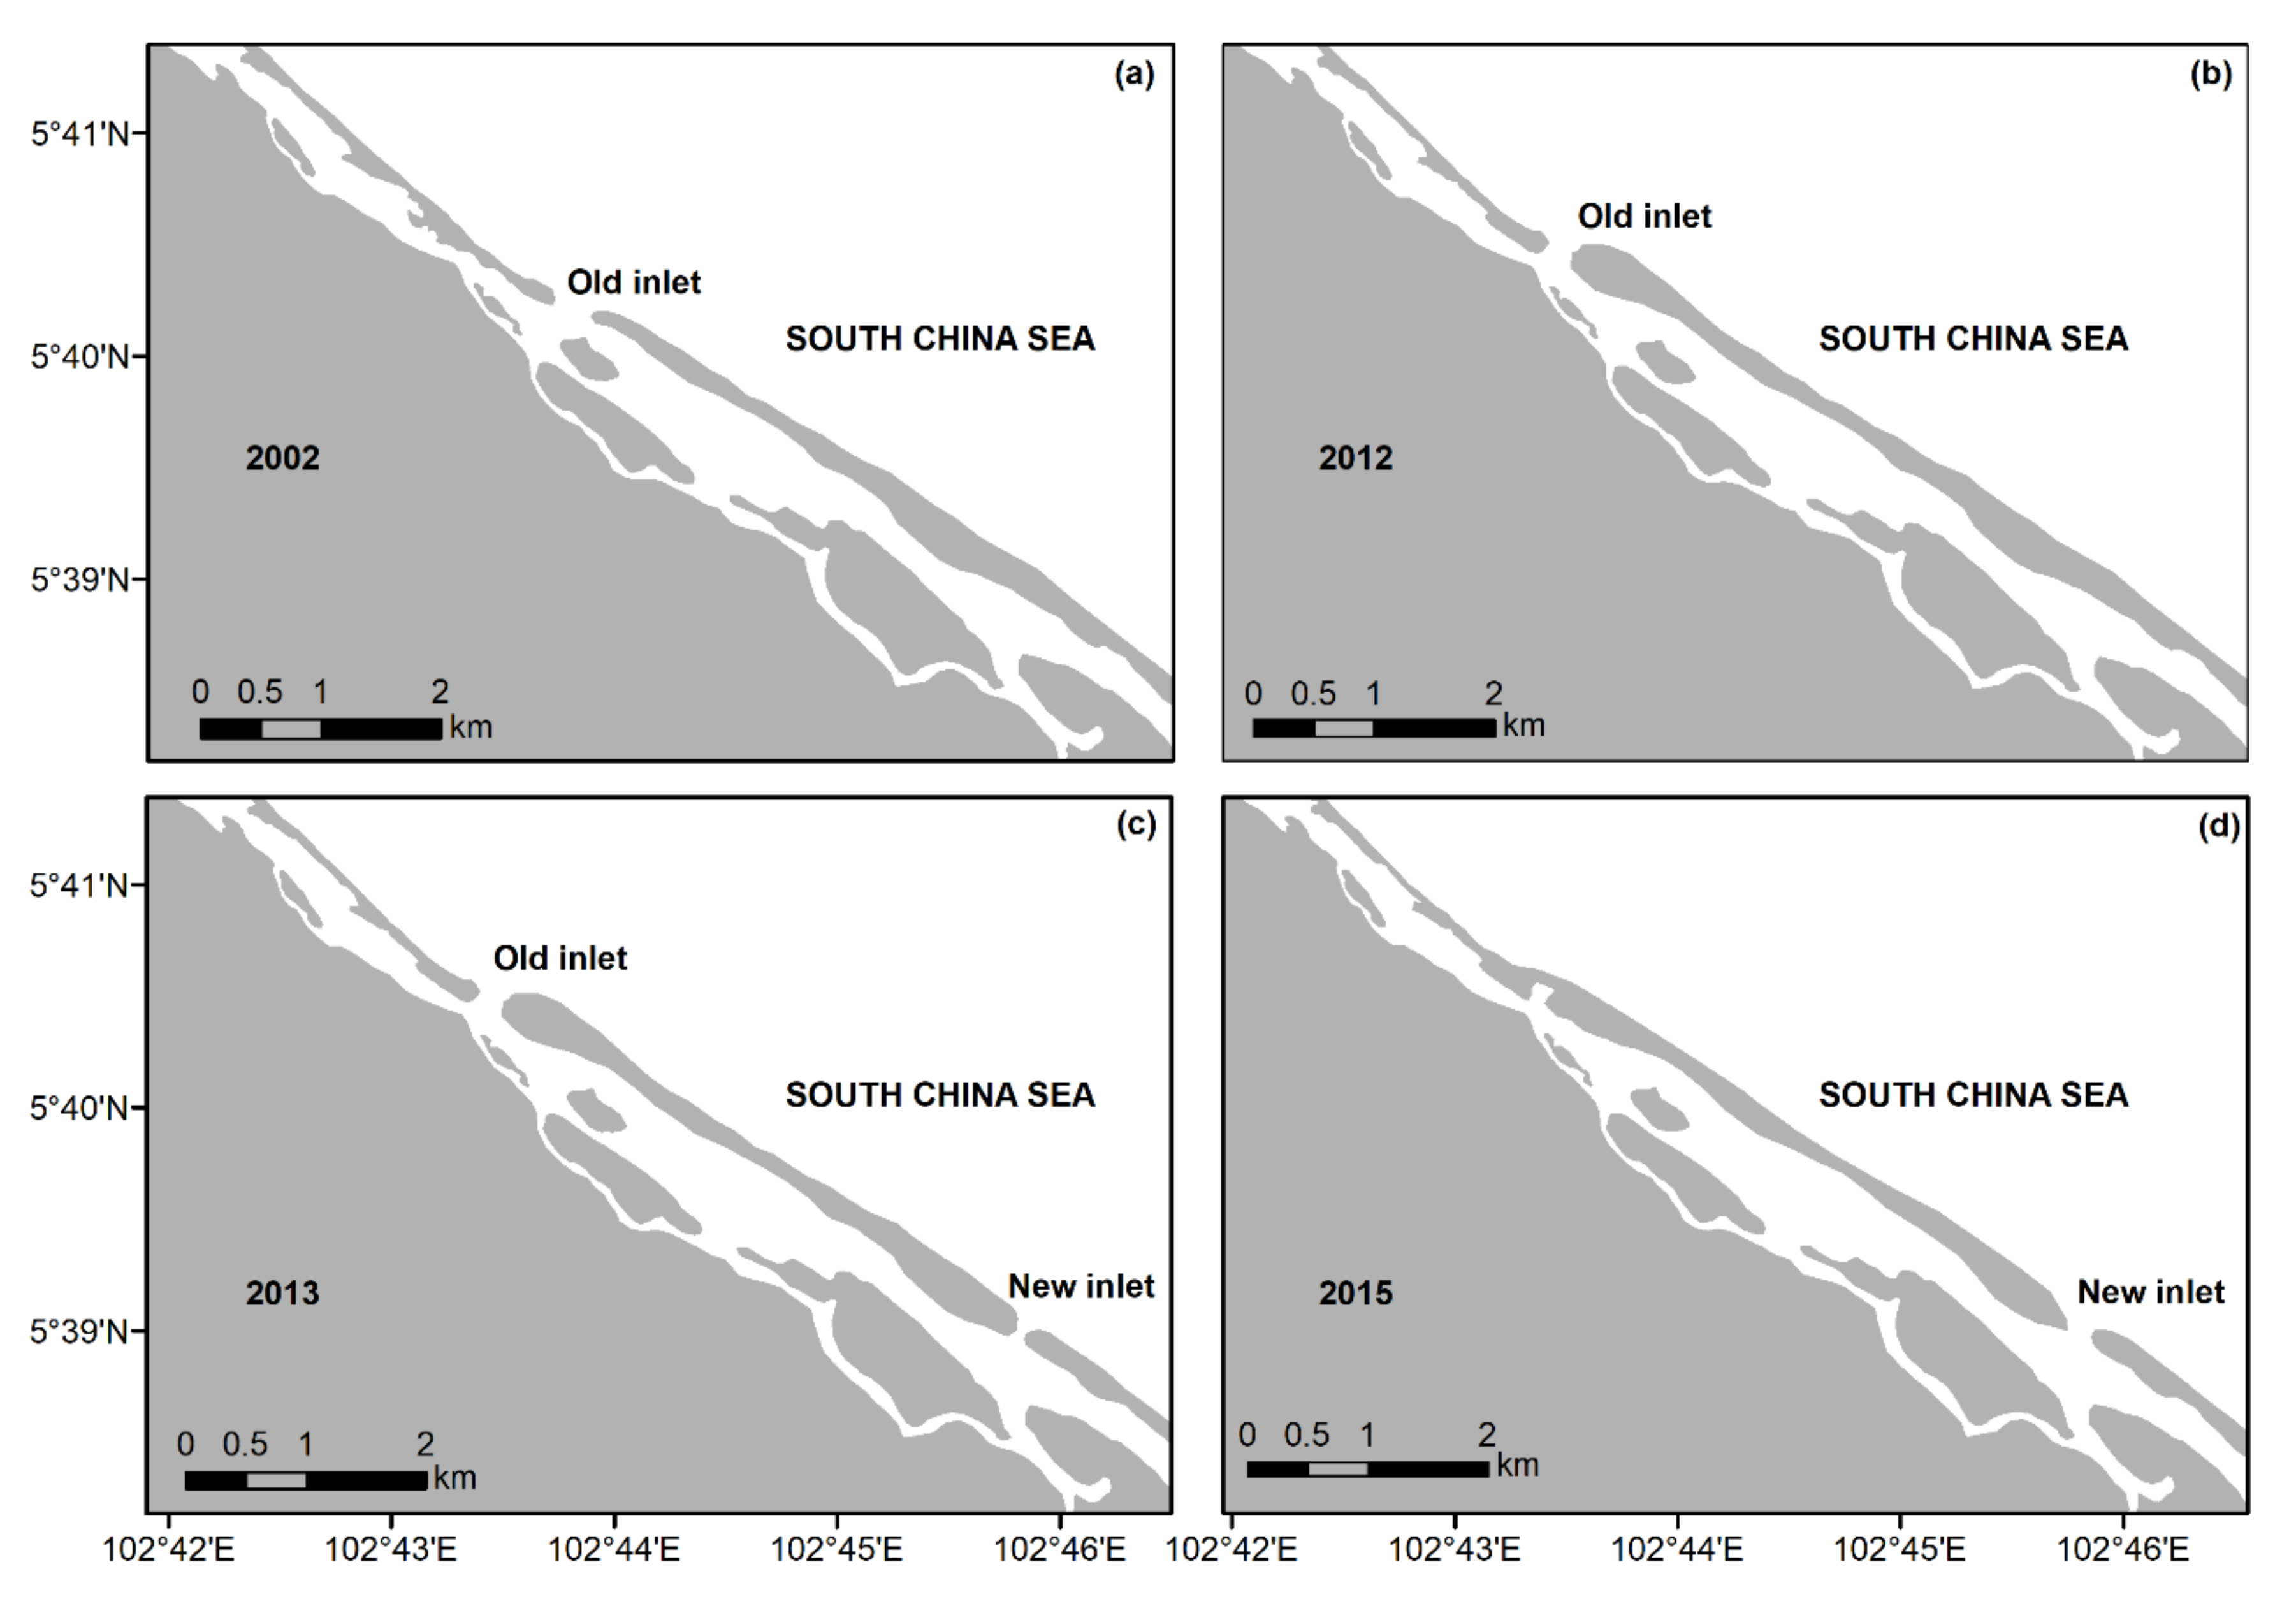
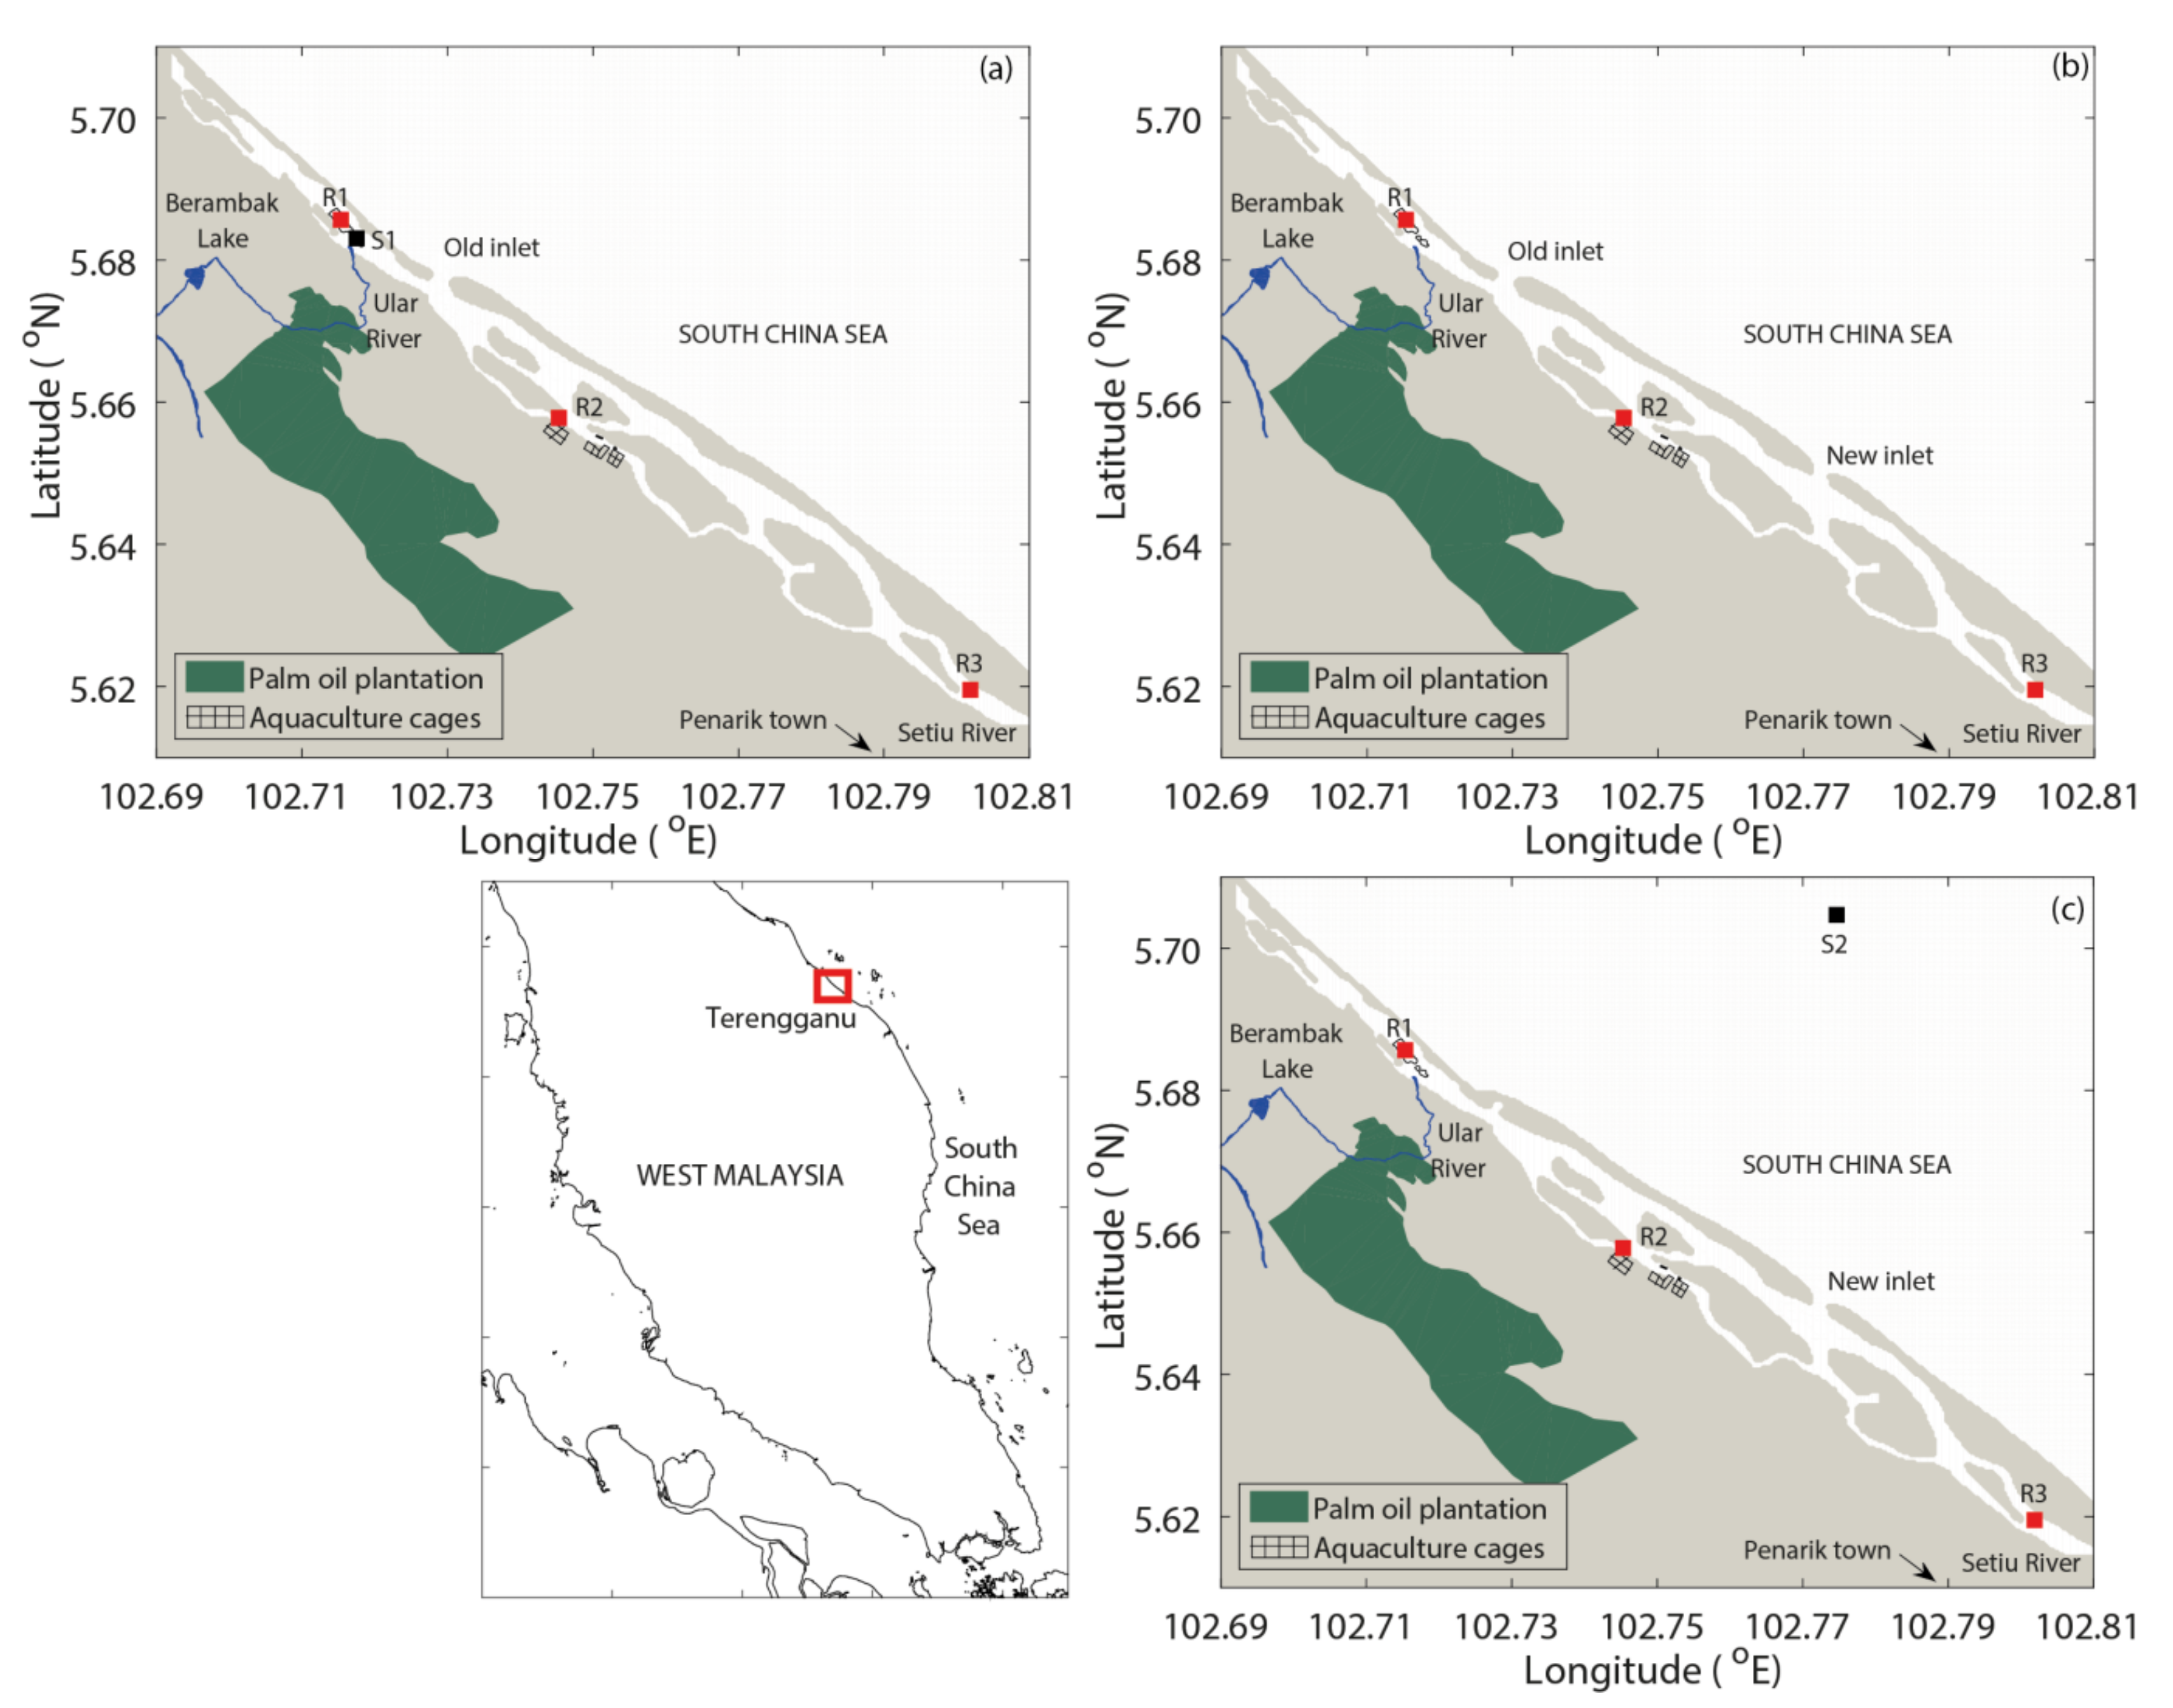
2.1. Study Site
2.2. In Situ Data Collection
2.3. Numerical Model Description
3. Results
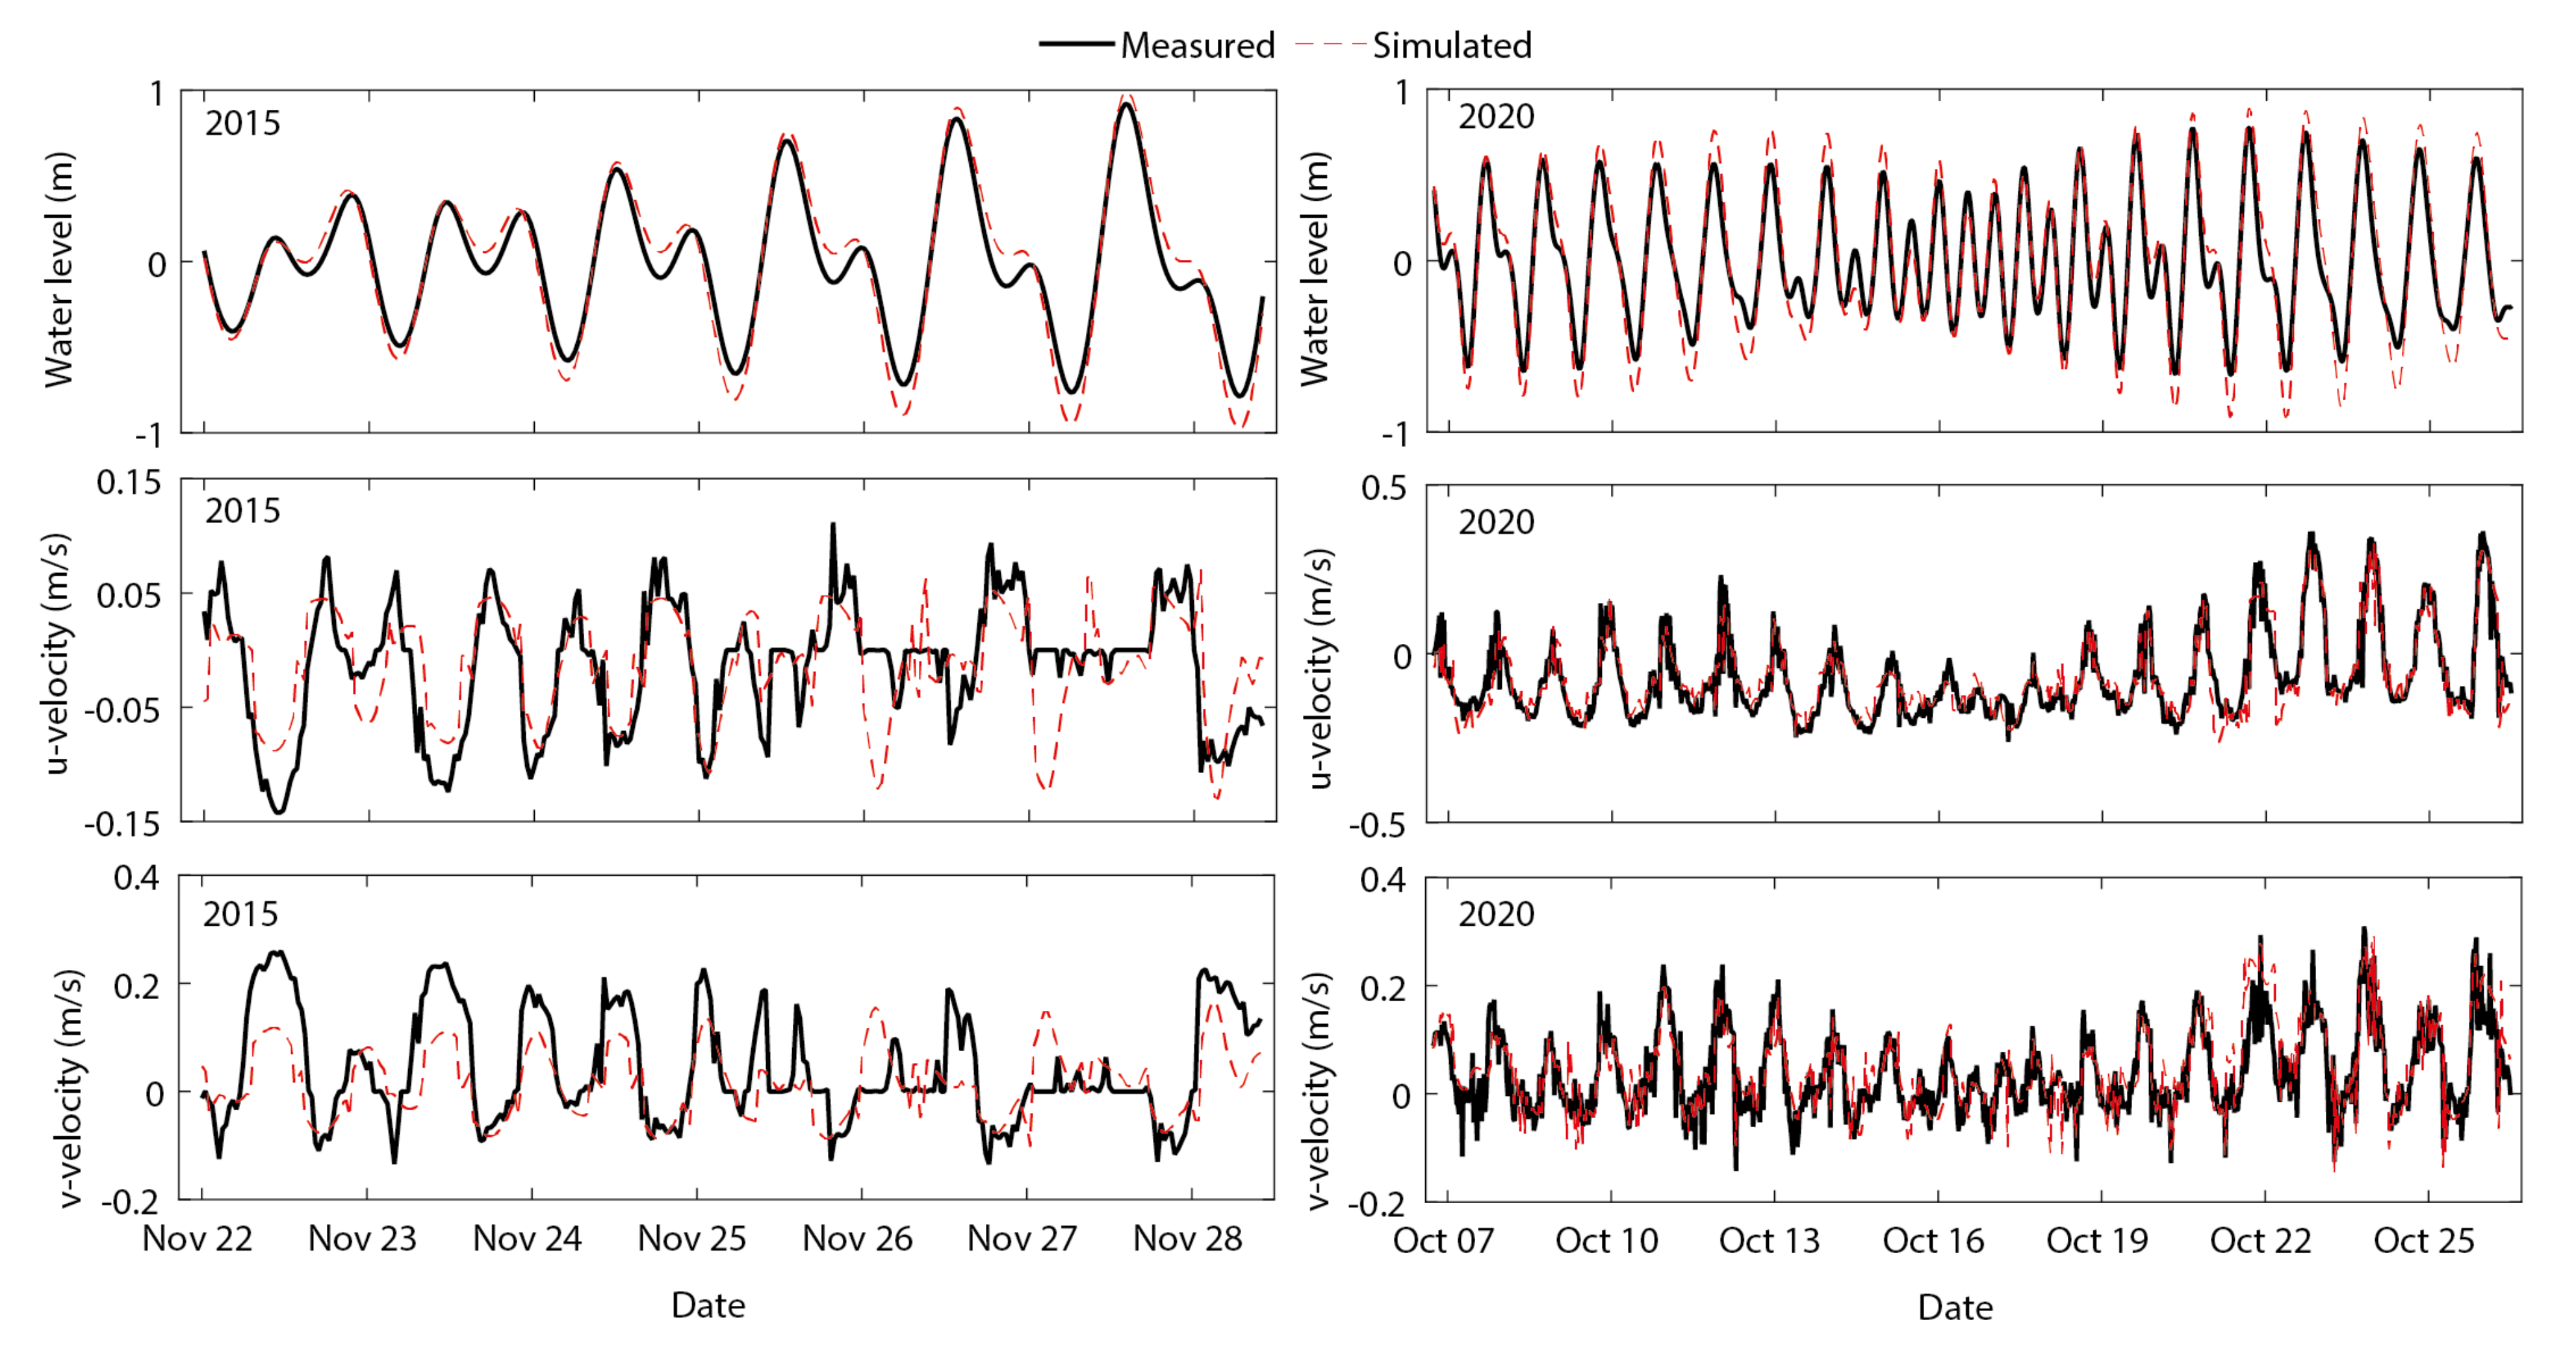
3.1. Accuracy of Hydrodynamic Model Simulations
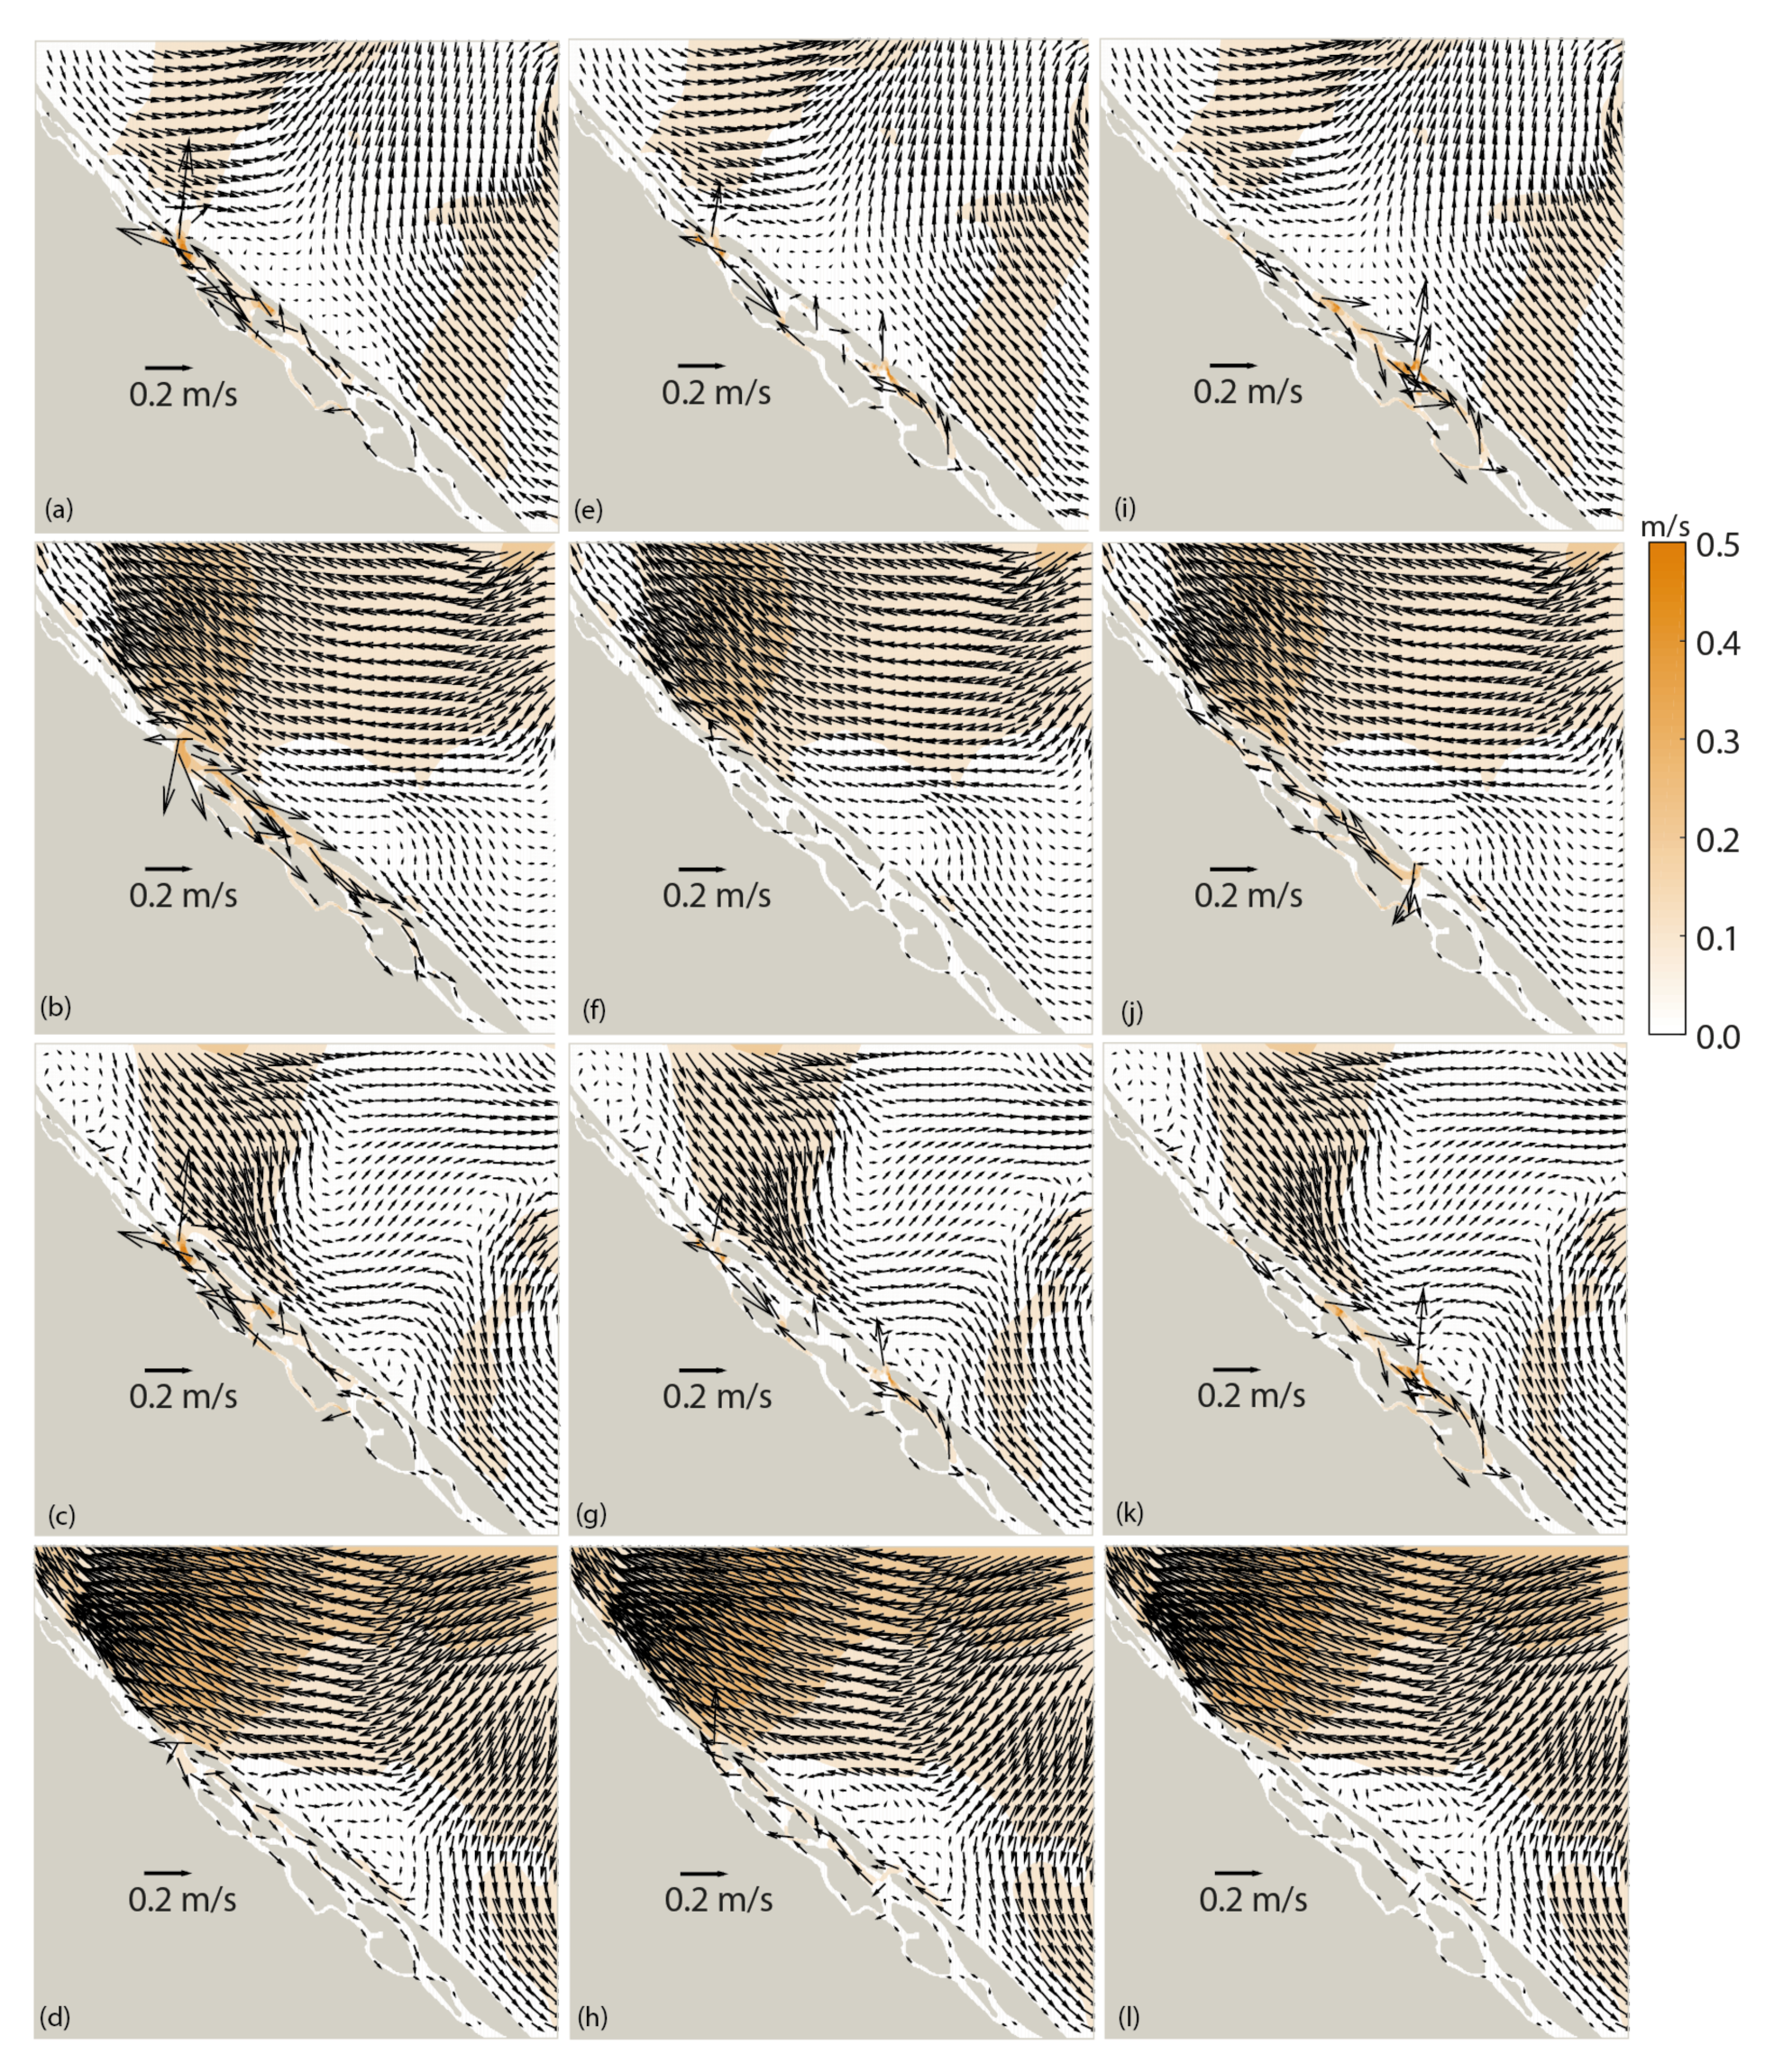
3.2. Water Current Velocity Simulation
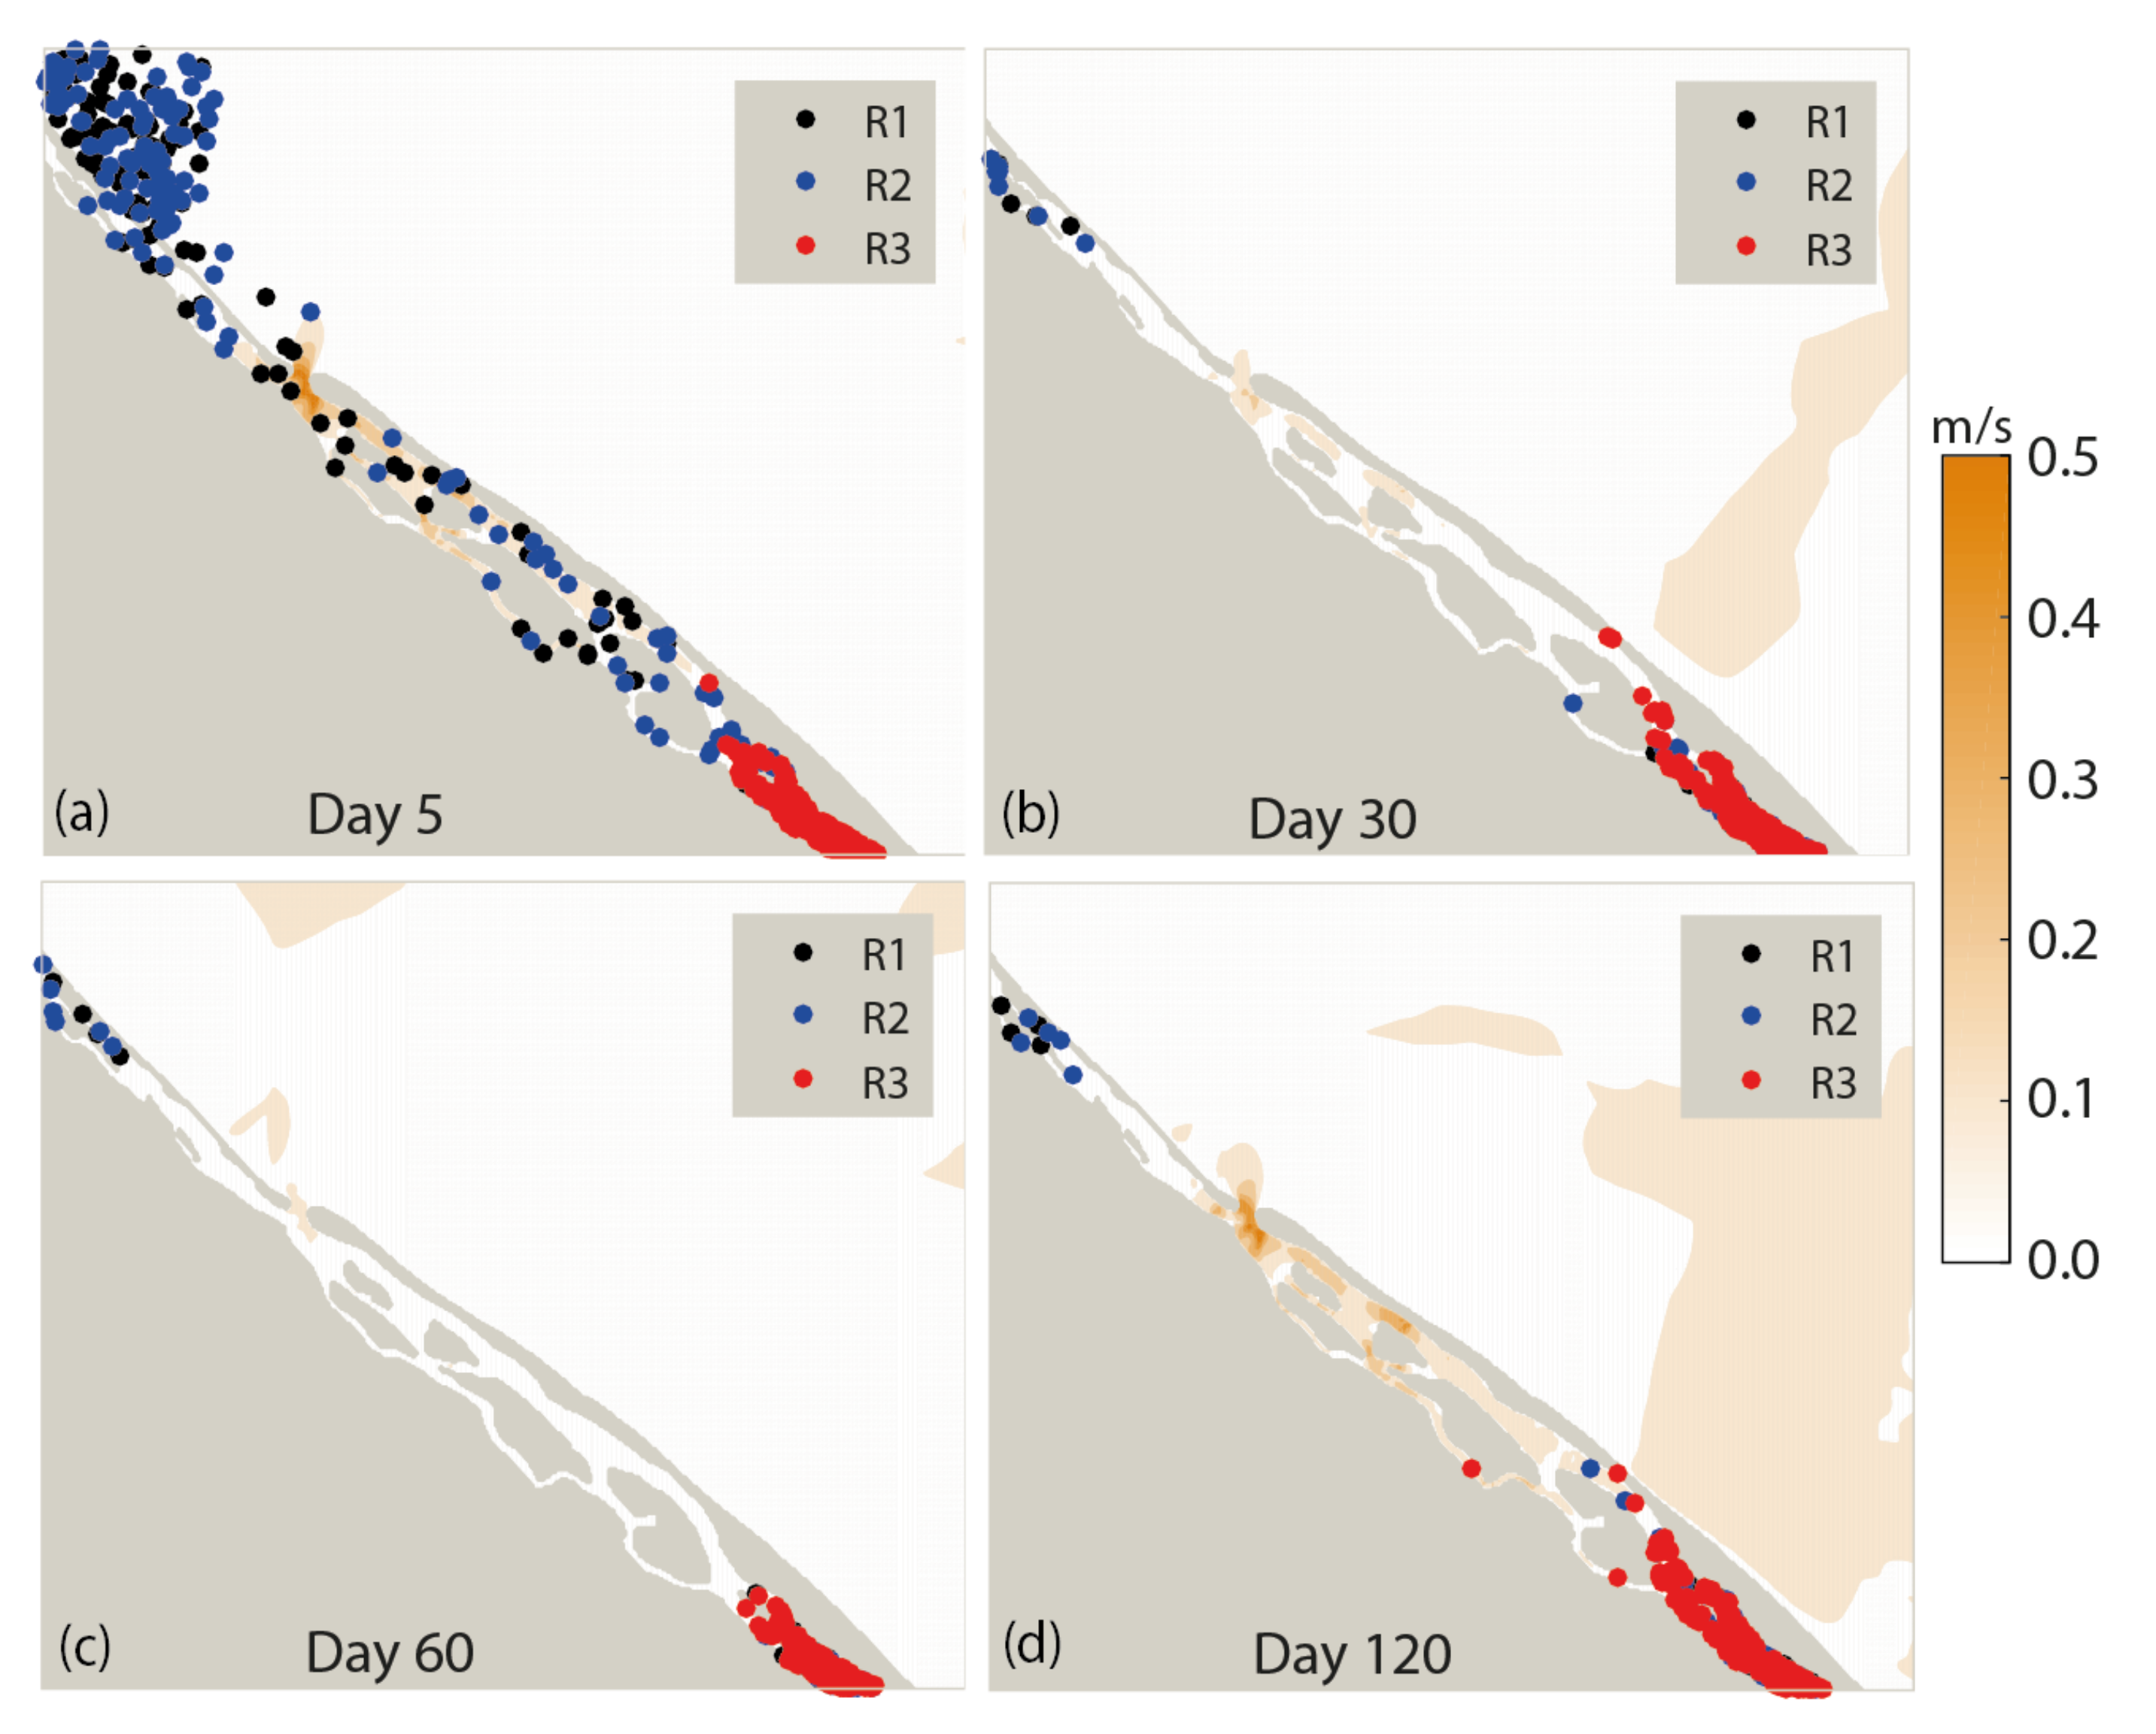
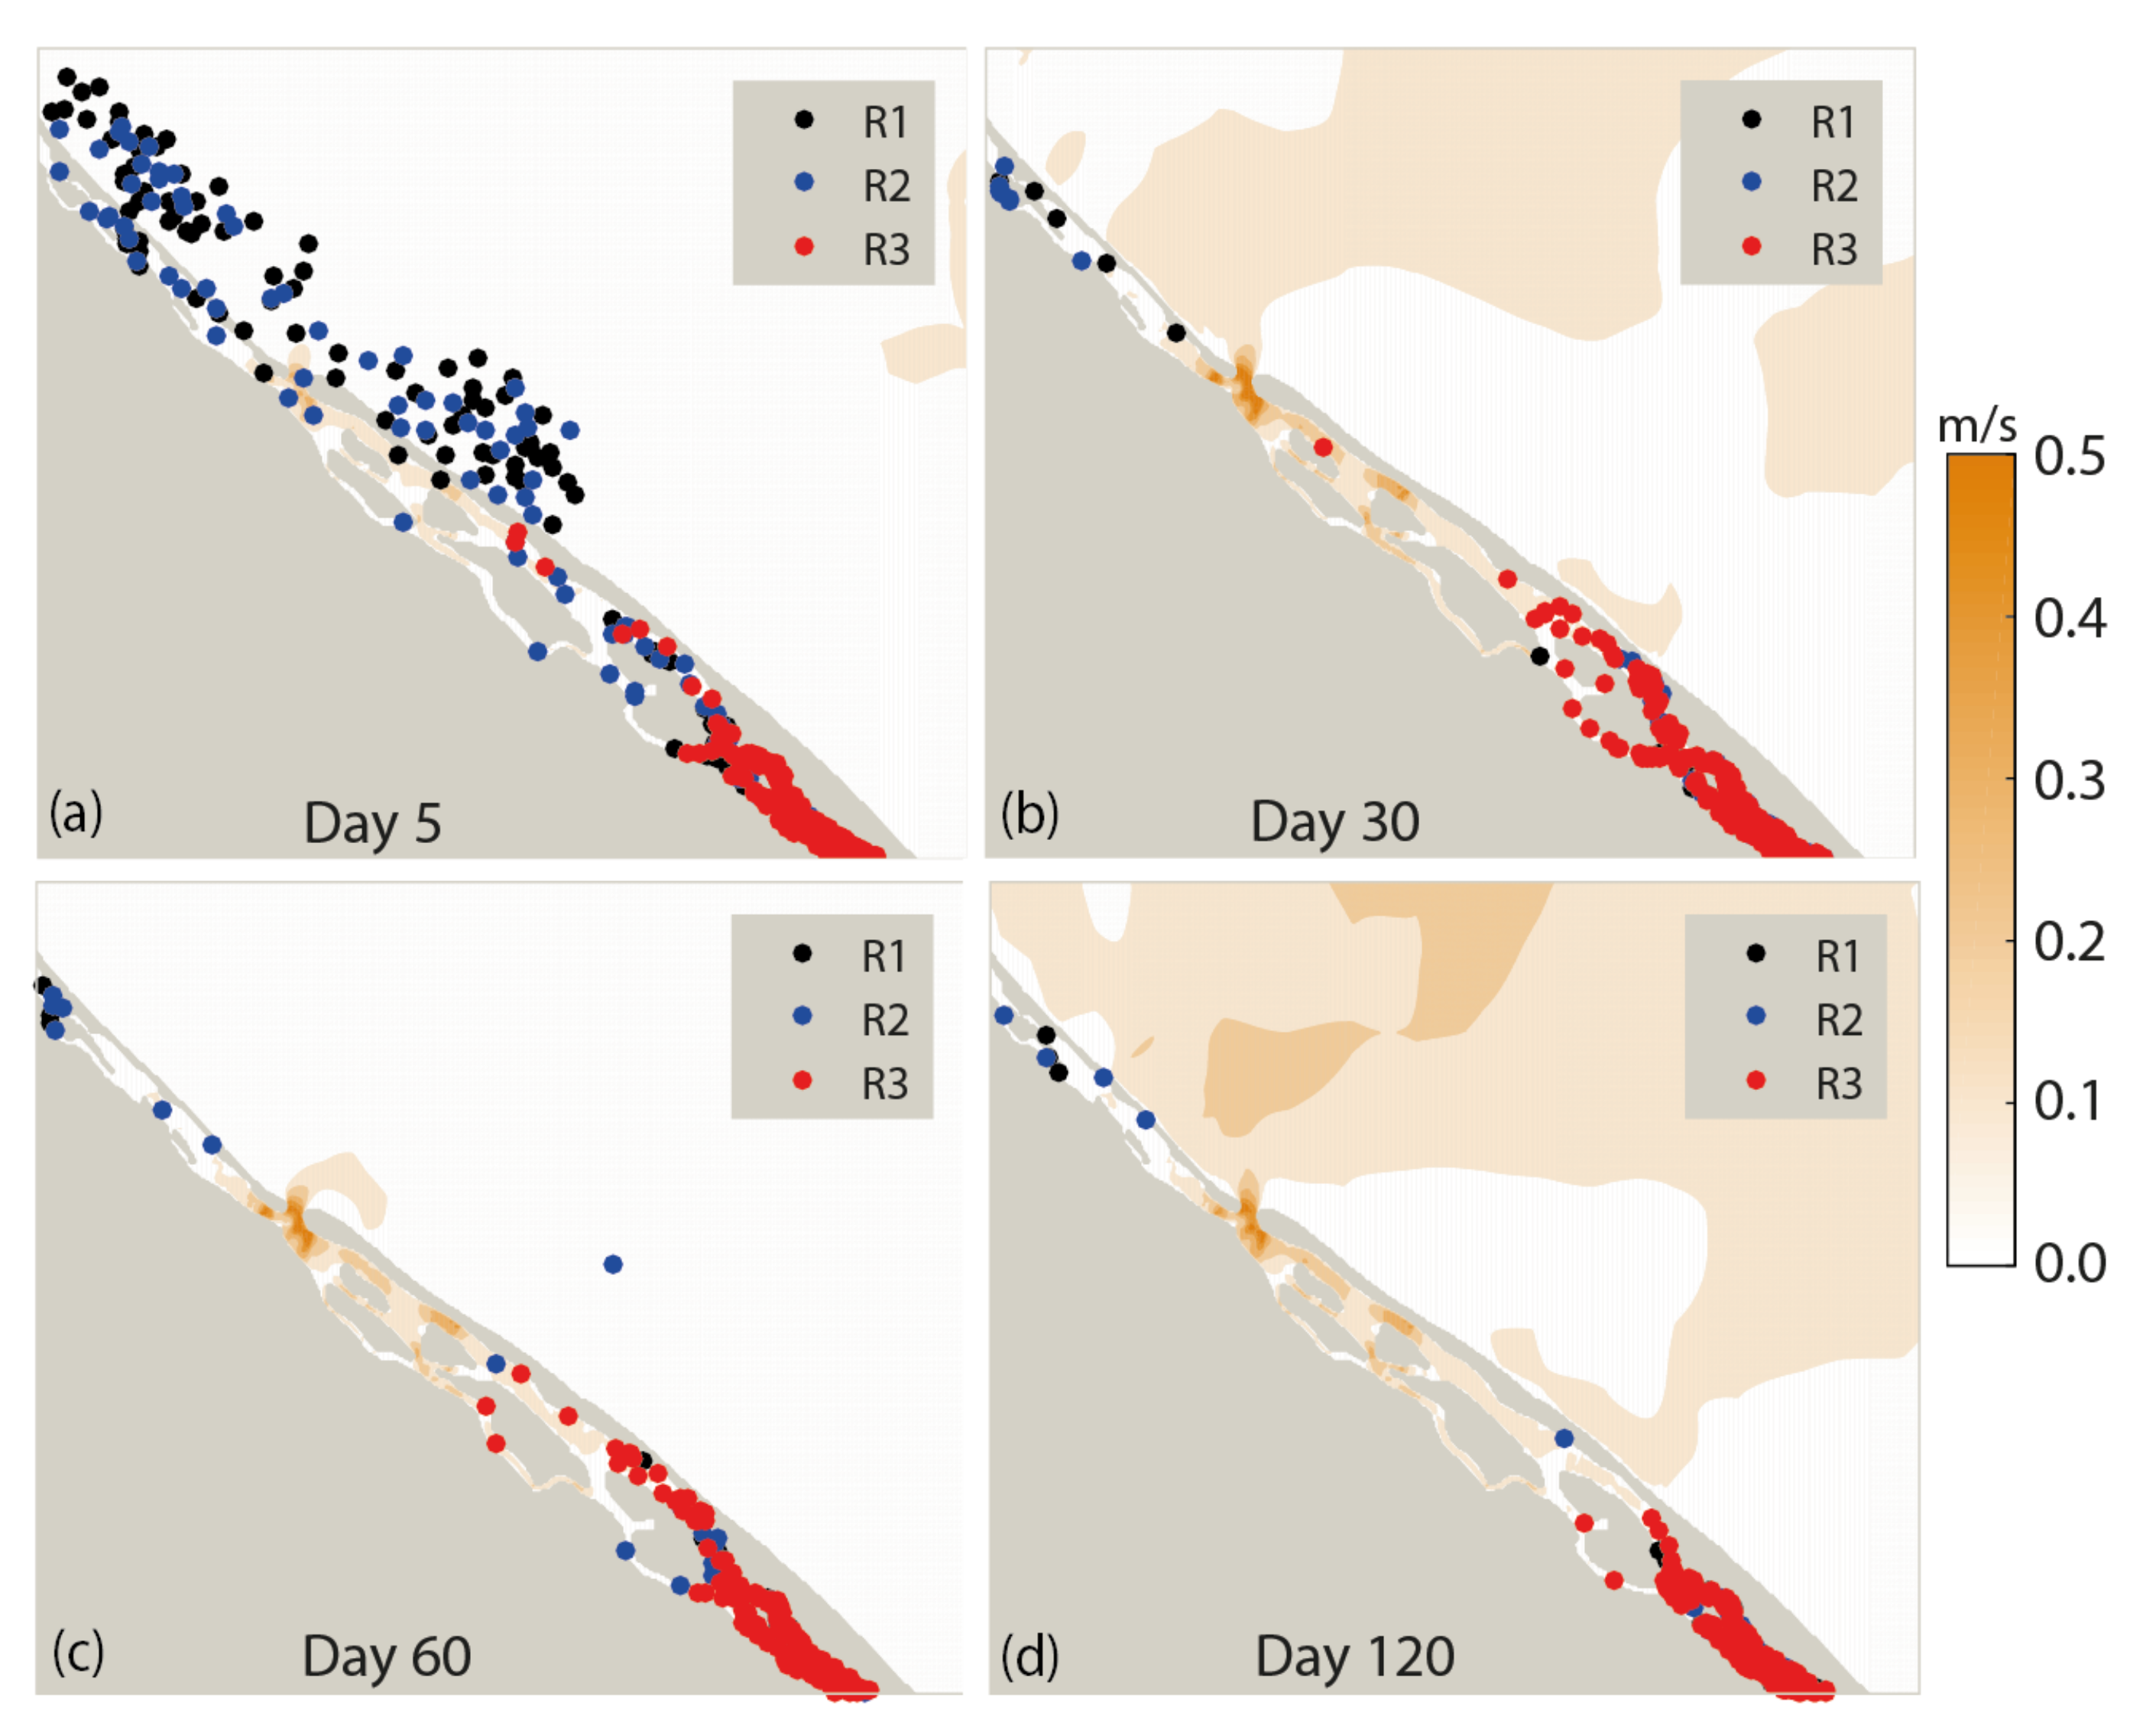
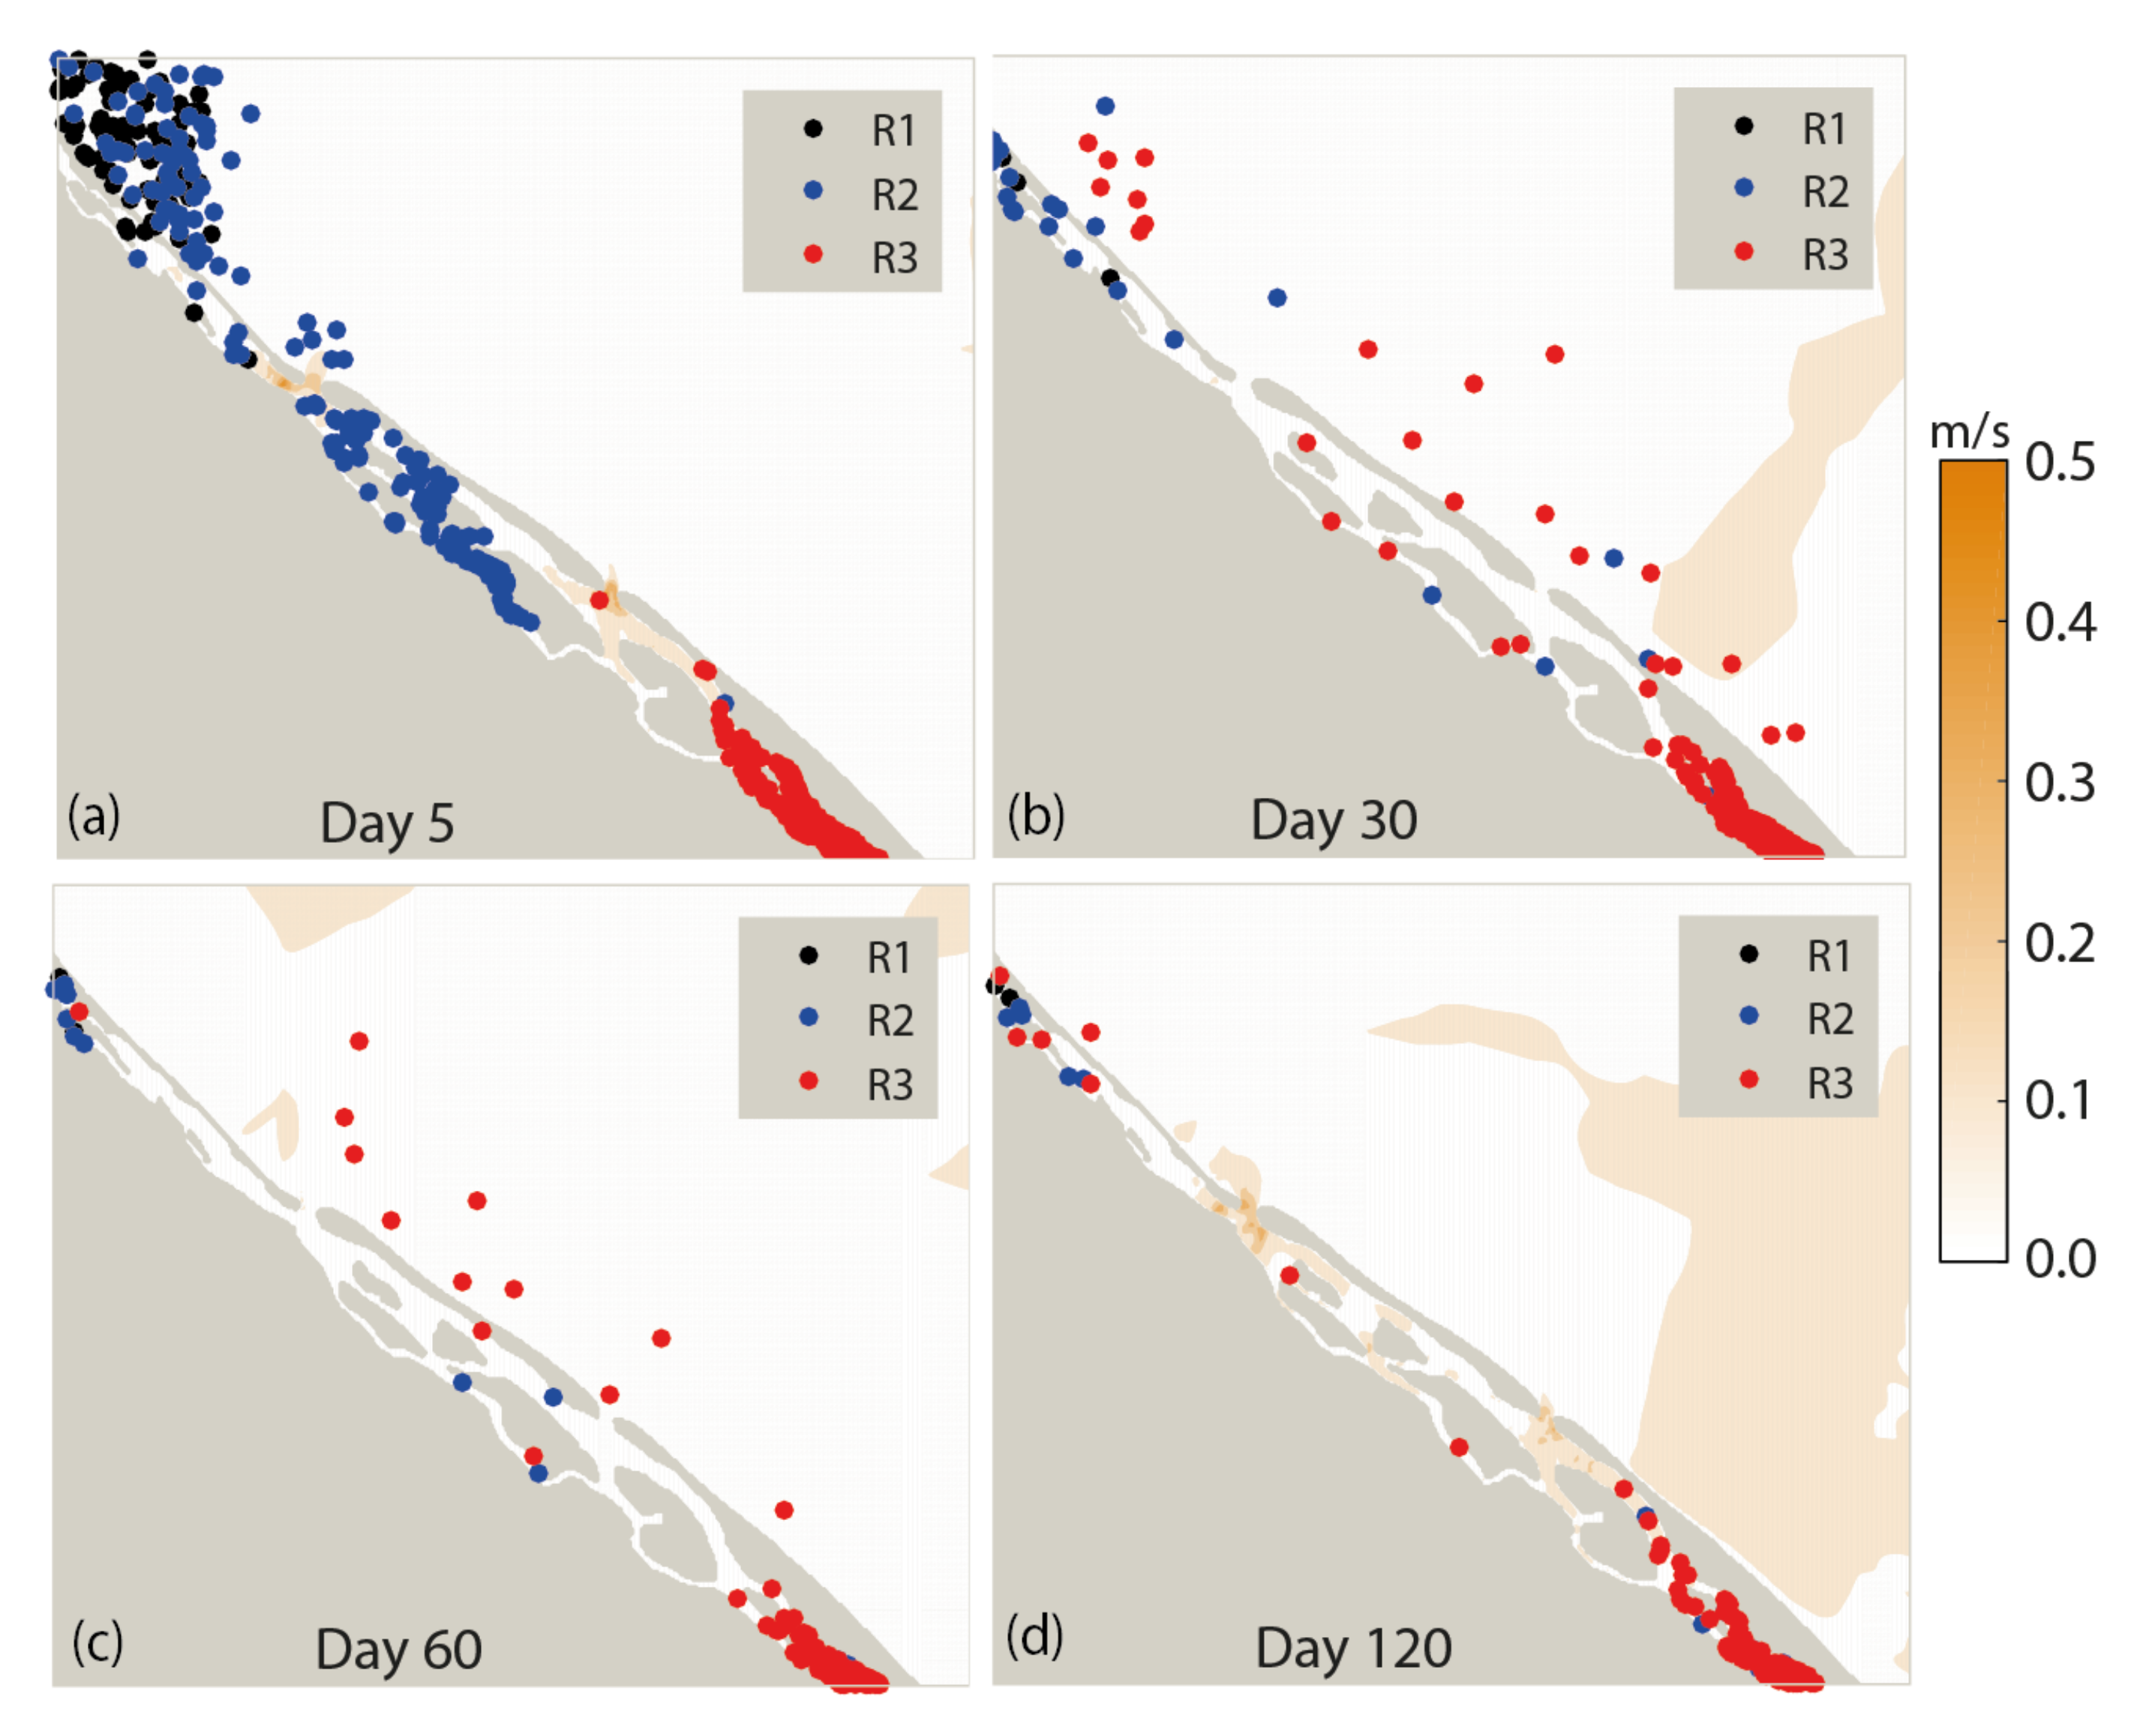
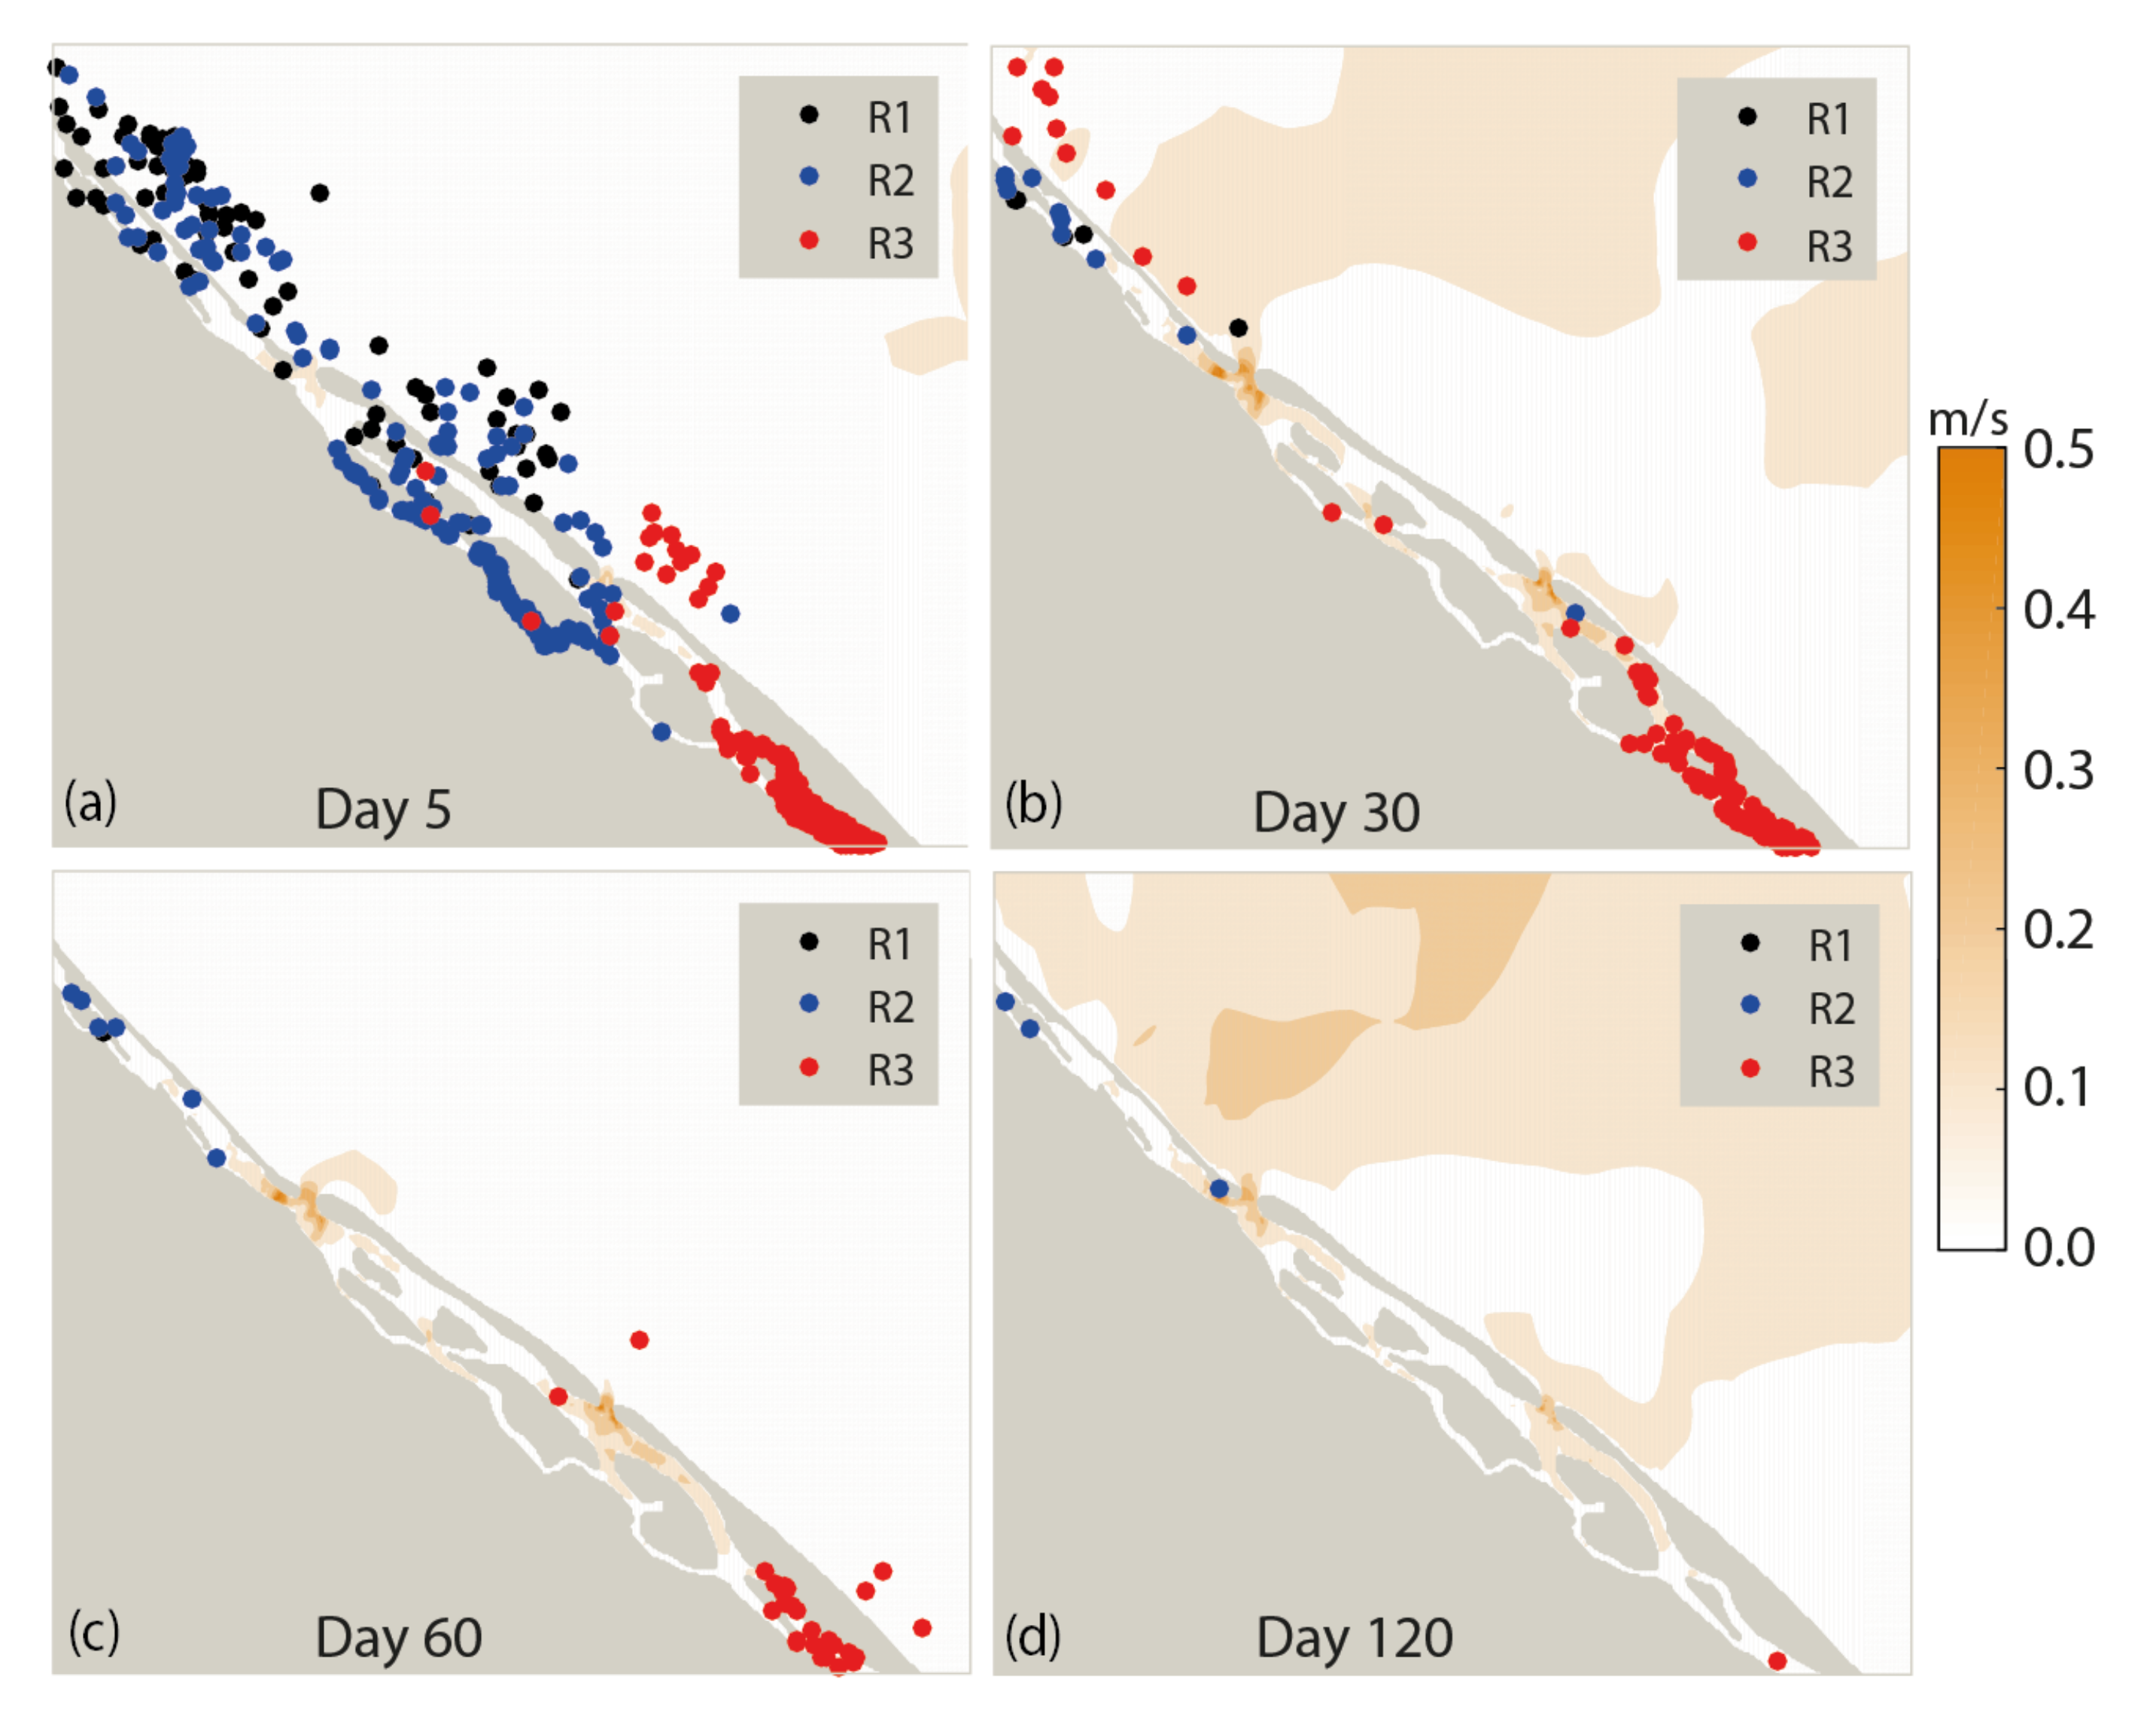
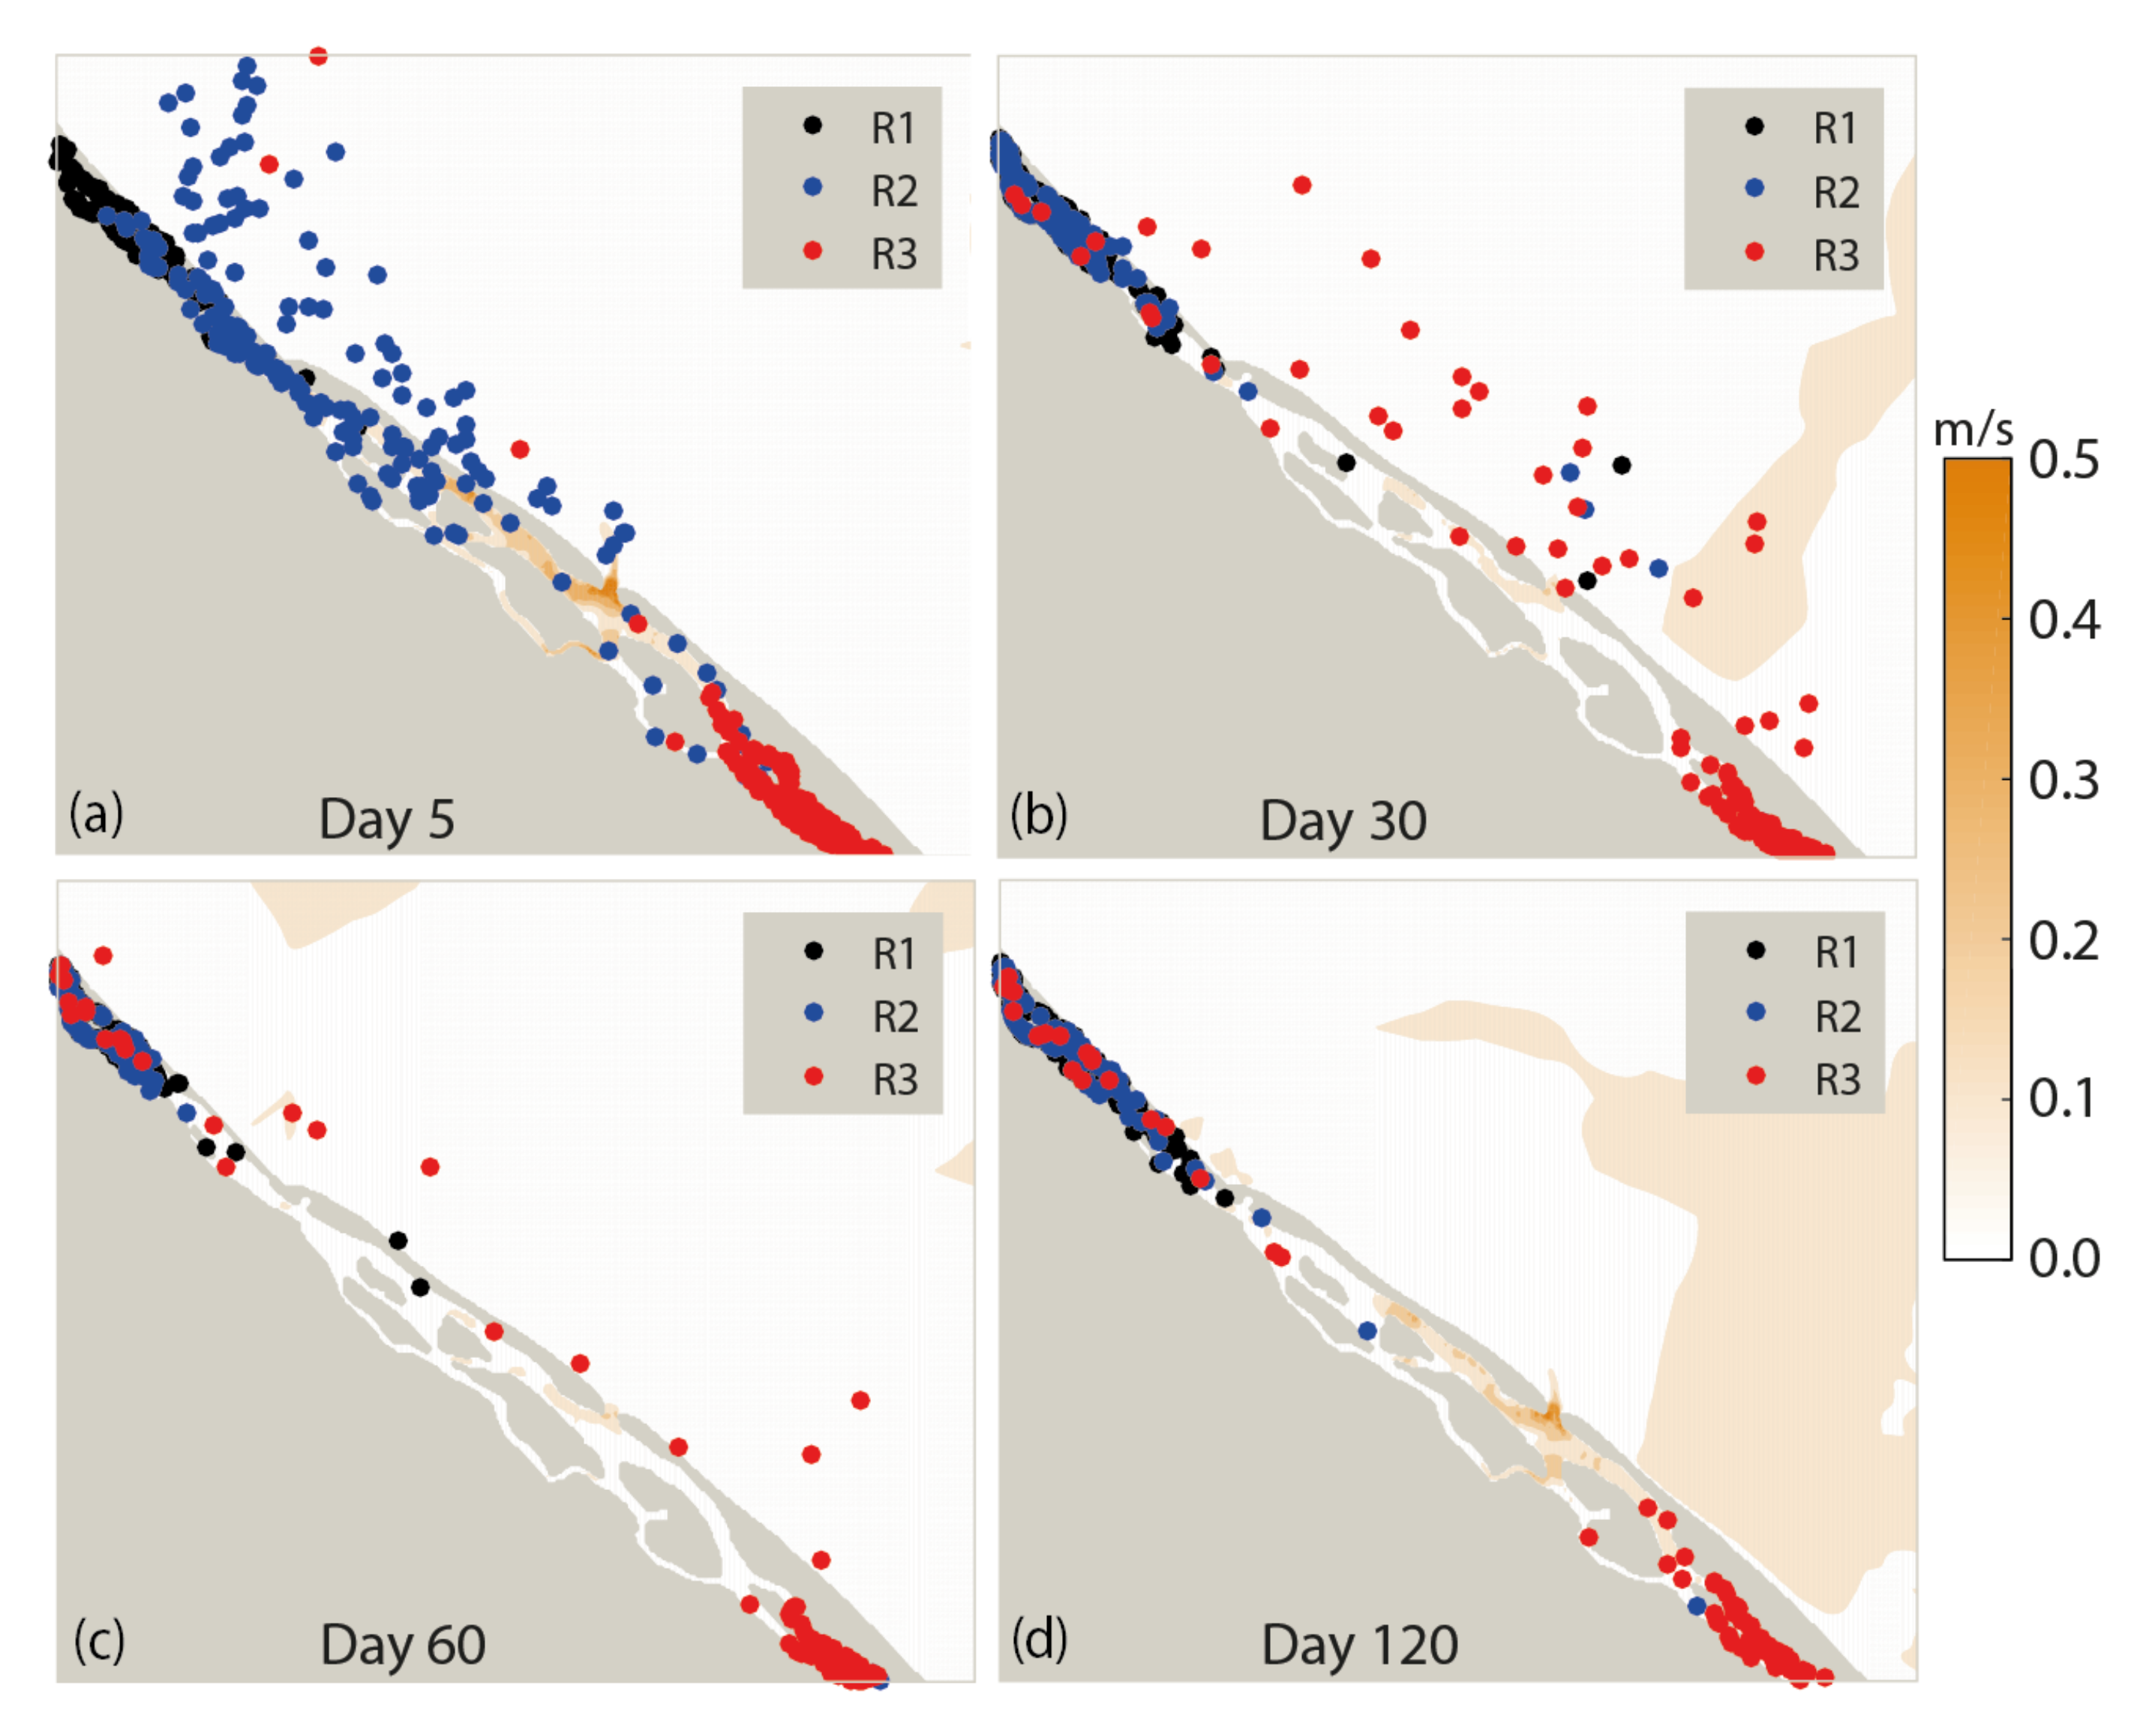
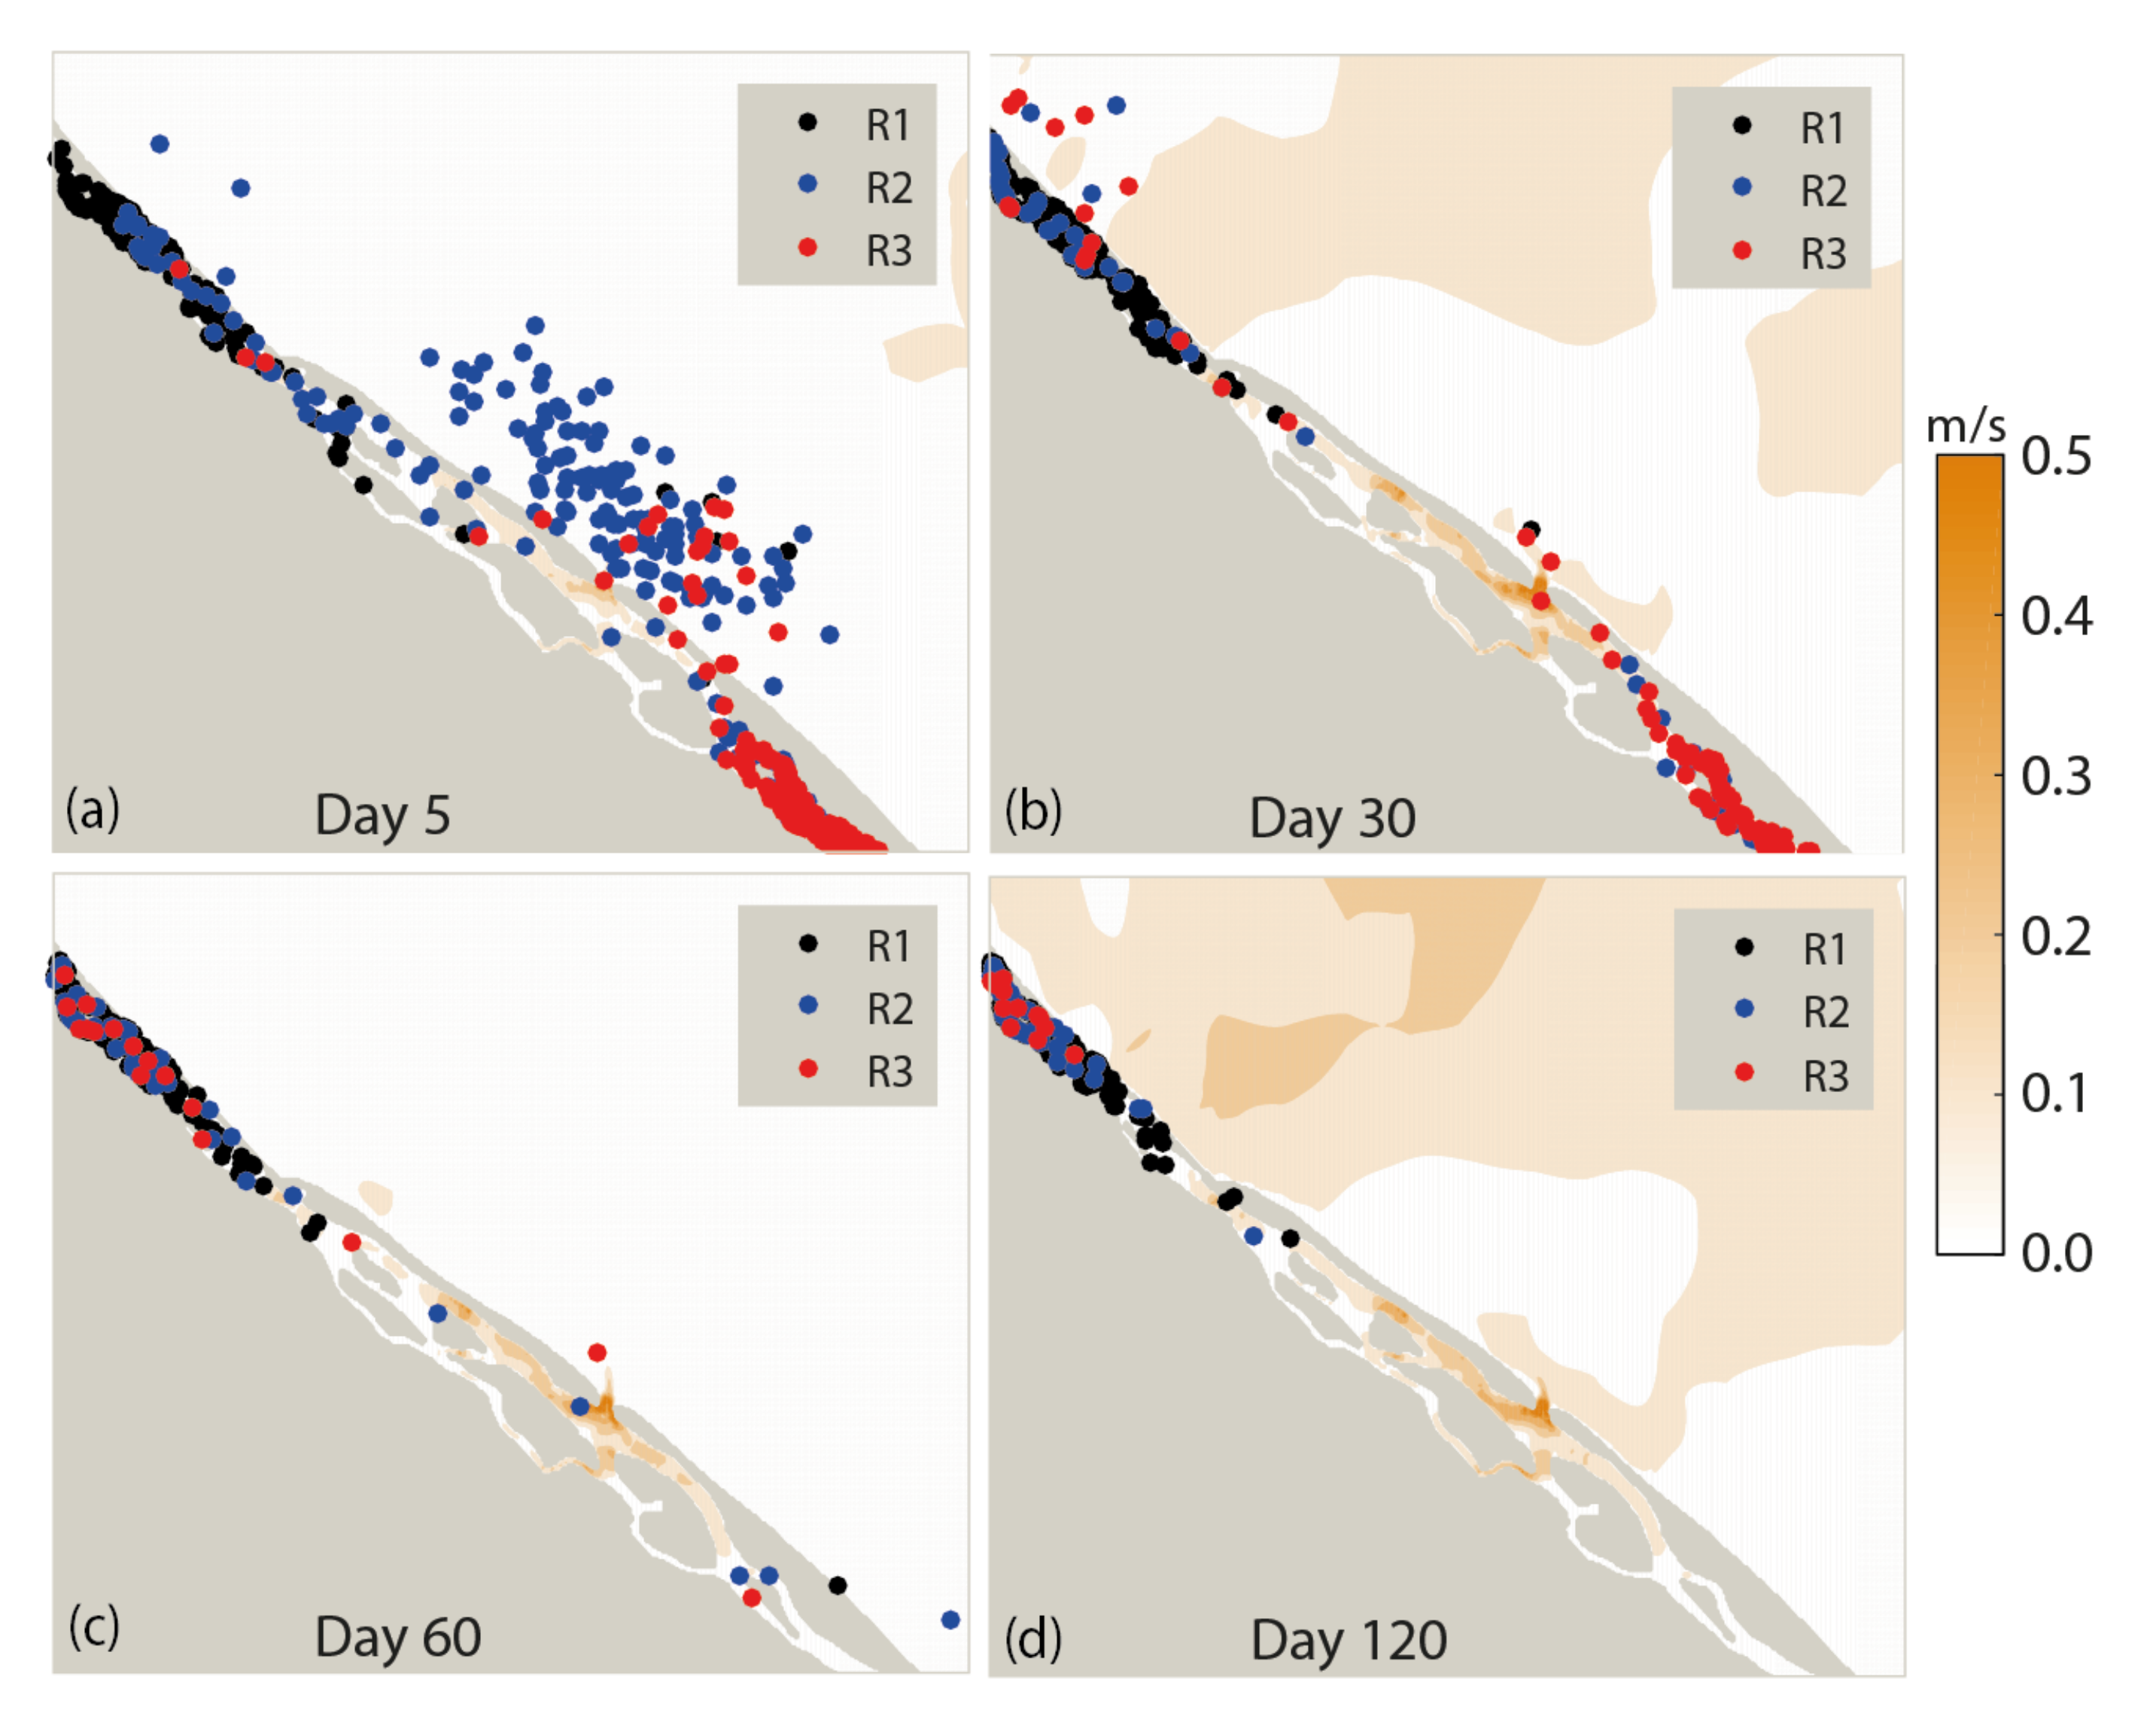
3.3. Particle Trajectories under Different Inlet Configurations
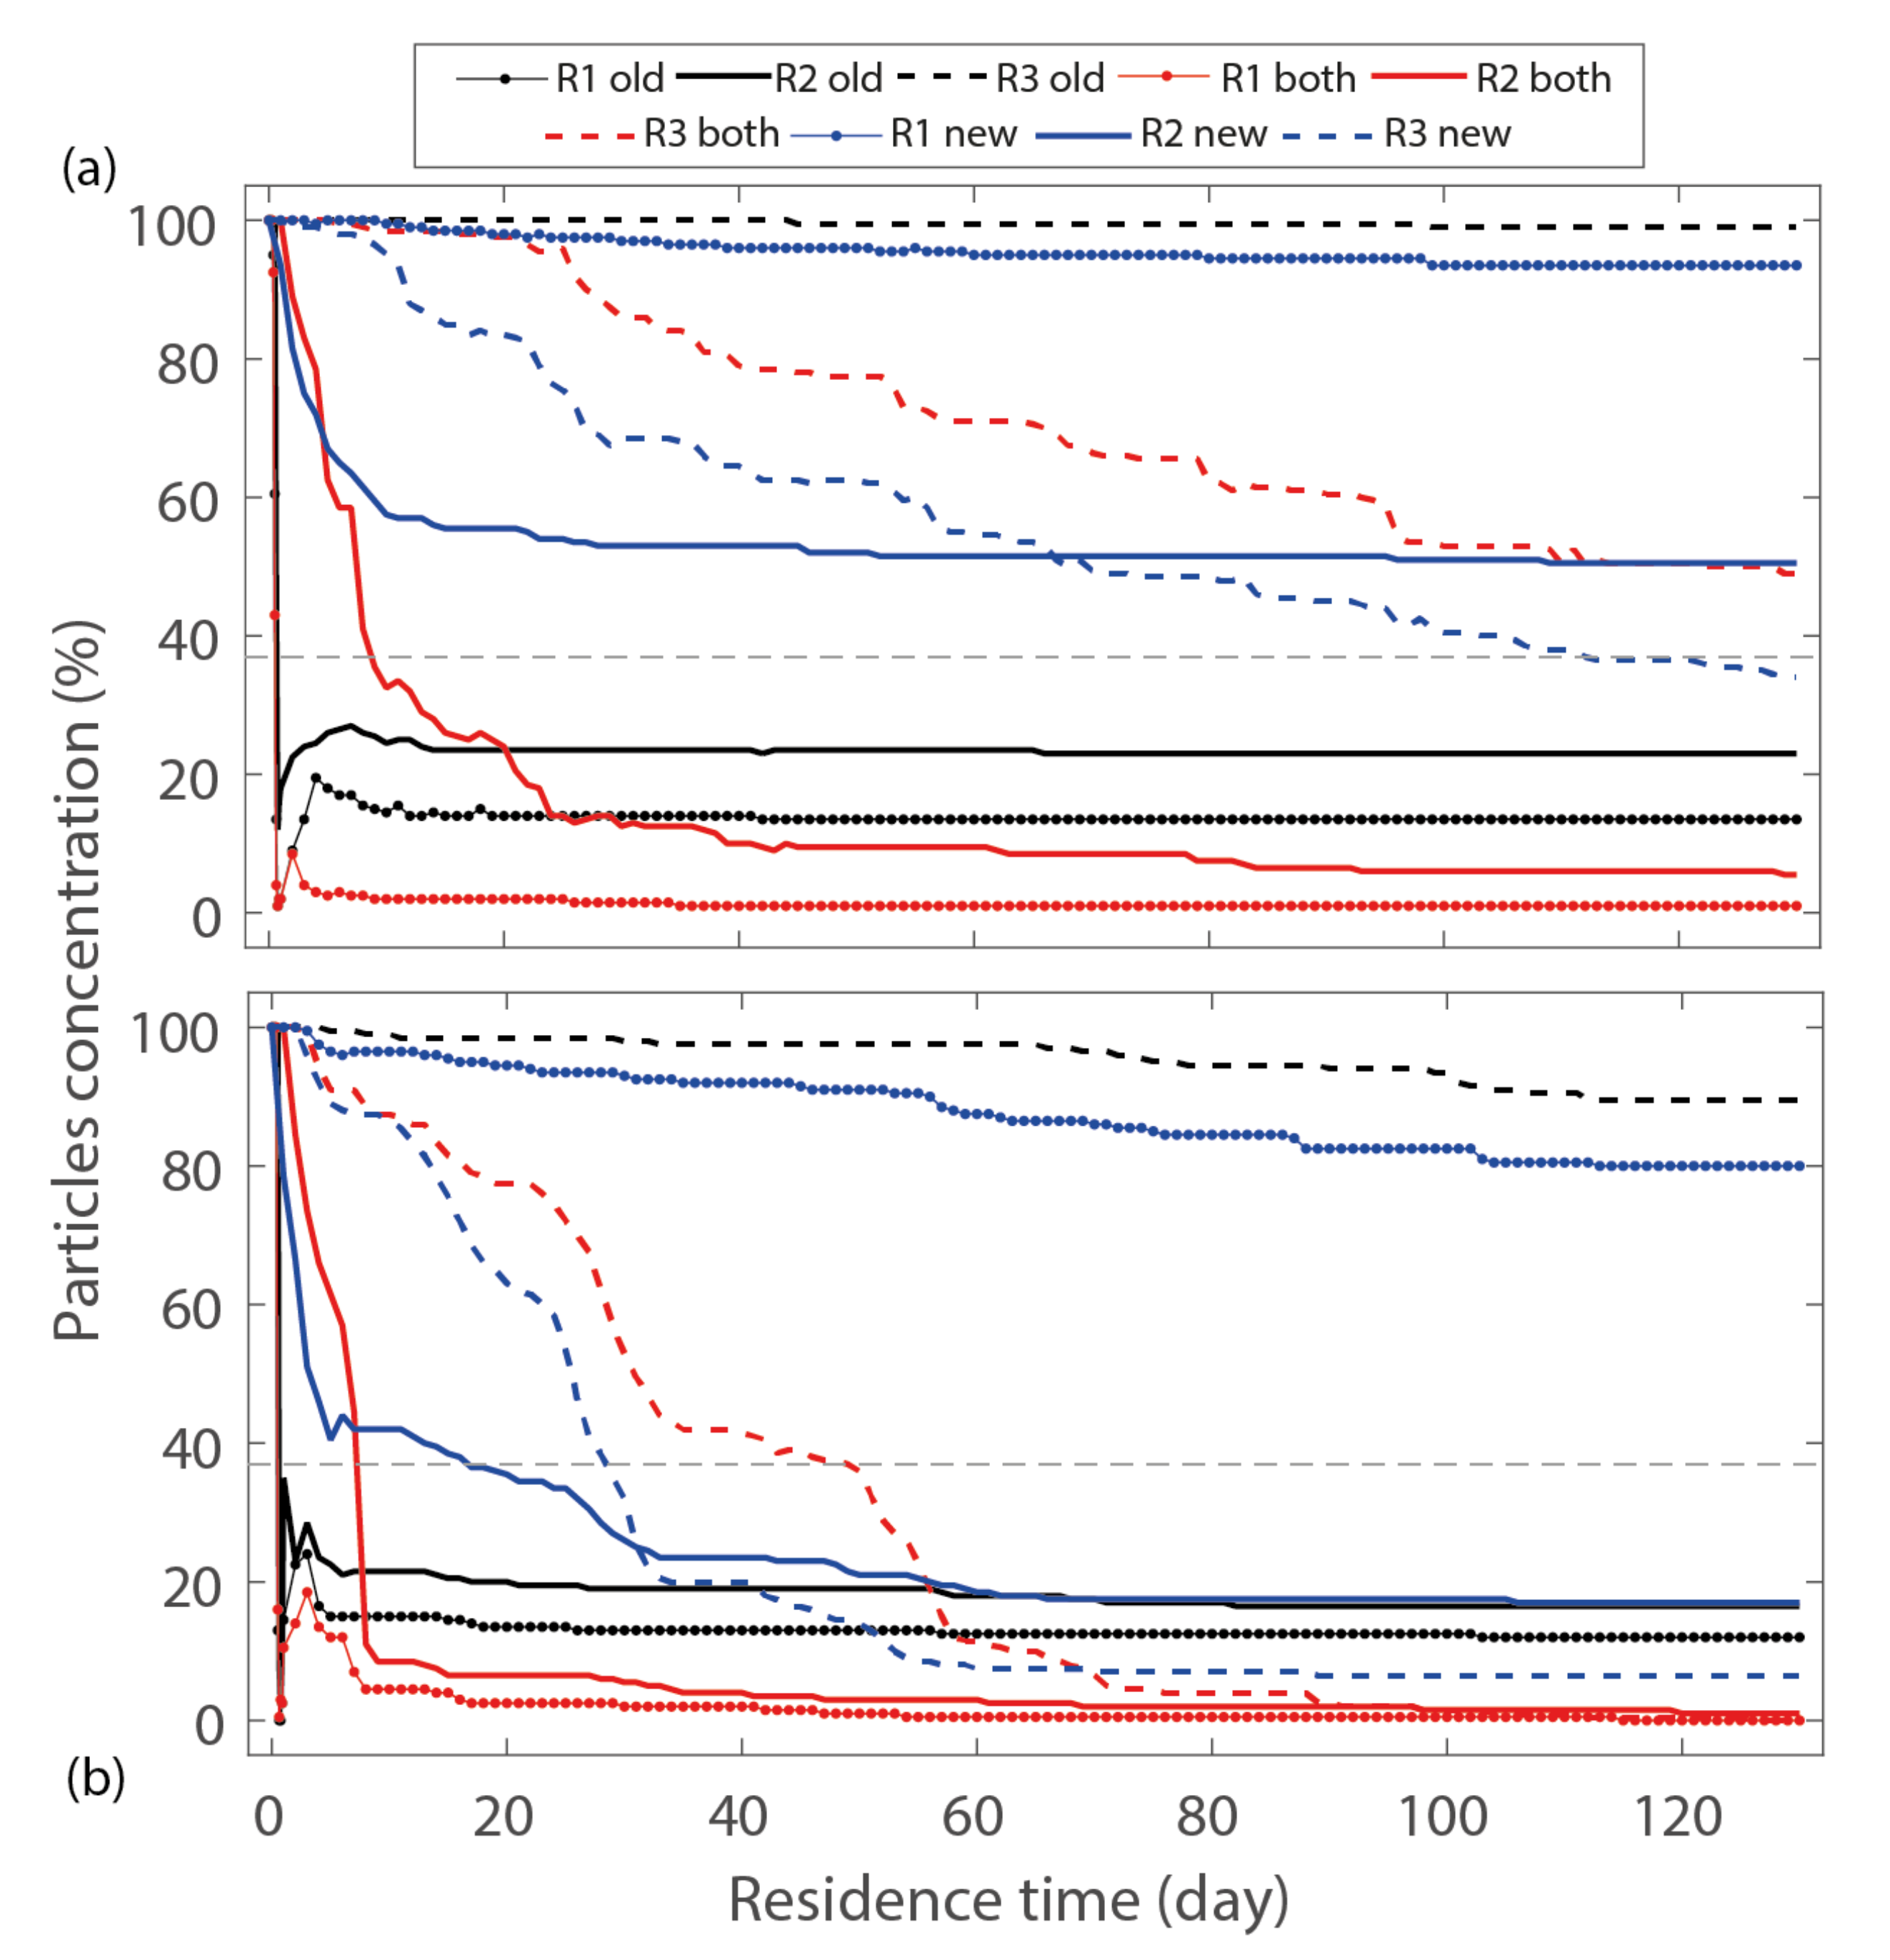
3.4. Residence Time in Setiu Lagoon
4. Discussion
5. Conclusions
Author Contributions
Funding
Institutional Review Board Statement
Informed Consent Statement
Data Availability Statement
Acknowledgments
Conflicts of Interest
References
- Rynne, P.; Reniers, A.; van de Kreeke, J.; MacMahan, J. The effect of tidal exchange on residence time in a coastal embayment. Estuar. Coast. Shelf Sci. 2016, 172, 108–120. [Google Scholar] [CrossRef]
- Zarzuelo, C.; López-Ruiz, A.; Ortega-Sánchez, M. Evaluating the impact of dredging strategies at tidal inlets: Performance assessment. Sci. Total Environ. 2019, 658, 1069–1084. [Google Scholar] [CrossRef] [PubMed]
- Morris, B.D.; Turner, I.L. Morphodynamics of intermittently open-closed coastal lagoon entrances: New insights and a conceptual model. Mar. Geol. 2010, 271, 55–66. [Google Scholar] [CrossRef]
- Nassar, K.; Masria, A.; Mahmod, W.E.; Negm, A.; Fath, H. Hydro-morphological modeling to characterize the adequacy of jetties and subsidiary alternatives in sedimentary stock rationalization within tidal inlets of marine lagoons. Appl. Ocean. Res. 2019, 84, 92–110. [Google Scholar] [CrossRef]
- Pereira Coutinho, M.T.; Brito, A.C.; Pereira, P.; Gonçalves, A.S.; Moita, M.T. A phytoplankton tool for water quality assessment in semi-enclosed coastal lagoons: Open vs closed regimes. Estuar. Coast. Shelf Sci. 2012, 110, 134–146. [Google Scholar] [CrossRef]
- de Brito, A.N.; Fragoso, C.R.; Larson, M. Tidal exchange in a choked coastal lagoon: A study of Mundaú Lagoon in northeastern Brazil. Reg. Stud. Mar. Sci. 2018, 17, 133–142. [Google Scholar] [CrossRef]
- Fourniotis, N.T.; Horsch, G.M.; Leftheriotis, G.A. On the hydrodynamic geometry of flow-through versus restricted lagoons. Water 2018, 10, 237. [Google Scholar] [CrossRef]
- Masria, A.; El-Adawy, A.; Eltarabily, M.G. Simulating mitigation scenarios for natural and artificial inlets closure through validated morphodynamic models. Reg. Stud. Mar. Sci. 2021, 47, 101991. [Google Scholar] [CrossRef]
- Vila-Concejo, A.; Ferreira, Ó.; Morris, B.D.; Matias, A.; Dias, J.M.A. Lessons from inlet relocation: Examples from Southern Portugal. Coast. Eng. 2004, 51, 967–990. [Google Scholar] [CrossRef]
- Bertin, X.; Fortunato, A.B.; Oliveira, A. Morphodynamic modeling of the Ancão Inlet, South Portugal. J. Coast. Res. 2009, 56, 10–14. [Google Scholar]
- Dias, J.M.; Sousa, M.C.; Bertin, X.; Fortunato, A.B.; Oliveira, A. Numerical modeling of the impact of the Ancão Inlet relocation (Ria Formosa, Portugal). Environ. Model. Softw. 2009, 24, 711–725. [Google Scholar] [CrossRef]
- González-gorbeña, E.; Pacheco, A.; Plomaritis, T.A.; Ferreira, Ó. Estimating the optimum size of a tidal array at a multi-inlet system considering environmental and performance constraints. Appl. Energy 2018, 232, 292–311. [Google Scholar] [CrossRef]
- Duc, D.M.; Tung, T.T.; McLaren, P.; Anh, T.N.; Thi Quynh, D. Sediment transport trends and cross-sectional stability of a lagoonal tidal inlet on the Central Coast of Vietnam. Int. J. Sediment Res. 2019, 34, 322–334. [Google Scholar] [CrossRef]
- Hoque, M.A.; Ahad, B.G.; Saleh, E. Hydrodynamics and suspended sediment transport at tidal inlets of Salut Mengkabong Lagoon, Sabah, Malaysia. Int. J. Sediment Res. 2010, 25, 399–410. [Google Scholar] [CrossRef]
- Kasawani, I.; Kim Asbiyallah Shah, A.; Sulong, I.; Mohd Hasmadi, I.; Kamaruzaman, J. Coastal change detection using GIS in Setiu Lagoon, Terengganu, Malaysia. J. GIS Trends 2010, 1, 20–26. [Google Scholar]
- Poh, S.C.; Ng, N.C.W.; Suratman, S.; Mathew, D.; Mohd Tahir, N. Nutrient availability in the Setiu Wetland Lagoon, Malaysia: Trends, possible causes and environmental impacts. Environ. Monit. Assess. 2019, 191, 3. [Google Scholar] [CrossRef]
- Zainol, Z.; Akhir, M.F.; Abdullah, S. Hydrodynamics, nutrient concentrations, and phytoplankton biomass in a shallow and restricted coastal lagoon under different tidal and monsoonal environmental drivers. Reg. Stud. Mar. Sci. 2020, 38, 101376. [Google Scholar] [CrossRef]
- Zainol, Z.; Akhir, M.F.; Zainol, Z. Pollutant transport and residence time of a shallow and narrow coastal lagoon estimated using a numerical model. Mar. Pollut. Bull. 2021, 164, 112011. [Google Scholar] [CrossRef]
- Ortega-Cisneros, K.; Scharler, U.M.; Whitfield, A.K. Inlet mouth phase influences density, variability and standing stocks of plankton assemblages in temporarily open/closed estuaries. Estuar. Coast. Shelf Sci. 2014, 136, 139–148. [Google Scholar] [CrossRef]
- Culver, S.J.; Mallinson, D.J.; Corbett, D.R.; Leorri, E.; Rouf, A.A.; Shazili, N.A.M.; Yaacob, R.; Whittaker, J.E.; Buzas, M.A.; Parham, P.R. Distribution of foraminifera in the Setiu estuary and lagoon, Terengganu, Malaysia. J. Foraminifer. Res. 2012, 42, 109–133. [Google Scholar] [CrossRef]
- Ikhwanuddin, M.; Azmi, W.A.; Borkhanuddin, M.H.; Muhammad, S.R.S.; Idris, I. Improving the health of Setiu Wetlands ecosystems and productivity of crustacean resources for livelihood enhancement. J. Sustain. Sci. Manag. 2017, 3, 1–7. [Google Scholar]
- Suratman, S.; Latif, M.T. Reassessment of nutrient status in Setiu Wetland, Terengganu, Malaysia. Asian J. Chem. 2015, 27, 239–242. [Google Scholar] [CrossRef]
- Suratman, S.; Hussein, A.N.A.R.; Mohd Tahir, N.; Latif, M.T.; Mostapa, R.; Weston, K. Seasonal and spatial variability of selected surface water quality parameters in Setiu Wetland, Terengganu, Malaysia. Sains Malays. 2016, 45, 551–558. [Google Scholar]
- Le, Q.D.; Haron, N.A.; Tanaka, K.; Ishida, A.; Sano, Y.; Dung, L.V.; Shirai, K. Quantitative contribution of primary food sources for a mangrove food web in Setiu lagoon from East coast of Peninsular Malaysia, stable isotopic (δ13C and δ15N) approach. Reg. Stud. Mar. Sci. 2017, 9, 174–179. [Google Scholar] [CrossRef]
- Jamilah, M.S.; Nik Kamil, N.F.; Komoo, I. Managing Setiu Wetlands for ecosystem services. In Setiu Wetlands: Species, Ecosystem and Livelihoods; Penerbit UMT: Terengganu, Malaysia, 2015. [Google Scholar]
- Alipiah, R.M.; Raffaelli, D.; Smart, J.; Nik Kamil, N.F. Modelling the impact of aquaculture on Setiu Wetland ecosystems using Bayesian Belief Network approach. J. Sustain. Sci. Manag. 2017, 12, 183–193. [Google Scholar]
- Yaacob, R.; Mustapa, M.Z. Grain-size distribution and subsurface mapping at the Setiu wetlands, Setiu, Terengganu. Environ. Earth Sci. 2010, 60, 975–984. [Google Scholar] [CrossRef]
- Zainol, Z.; Akhir, M.F. Coastal upwelling at Terengganu and Pahang coastal waters: Interaction of hydrography, current circulation and phytoplankton biomass. J. Teknol. 2016, 78, 11–27. [Google Scholar] [CrossRef][Green Version]
- Johari, A.; Akhir, M.F. Exploring thermocline and water masses variability in southern South China Sea from the World Ocean Database (WOD). Acta Oceanol. Sin. 2019, 38, 38–47. [Google Scholar] [CrossRef]
- Johari, A.; Akhir, M.F.; Satar, M.N.; Zainol, Z.; Jingsong, G. Inter-annual changes of water temperature in the Southern South China Sea’s continental shelf: The influence of ENSO on Malaysian waters. J. Mar. Sci. Technol. 2021, 29, 569–581. [Google Scholar] [CrossRef]
- Akhir, M.F. Surface circulation and temperature distribution of southern South China Sea from global ocean model (OCCAM). Sains Malays. 2012, 41, 701–714. [Google Scholar]
- Zainol, Z.; Akhir, M.F.; Joseph, J. Tidal circulation in Bay of Chagar Hutang, Malaysia. Indian J. Geo-Mar. Sci. 2015, 44, 1–9. [Google Scholar]
- Patgaonkar, R.S.; Vethamony, P.; Lokesh, K.S.; Babu, M.T. Residence time of pollutants discharged in the Gulf of Kachchh, northwestern Arabian Sea. Mar. Pollut. Bull. 2012, 64, 1659–1666. [Google Scholar] [CrossRef] [PubMed]
- Li, Y.; Yao, J. Estimation of transport trajectory and residence time in large river-lake systems: Application to Poyang Lake (China) using a combined model approach. Water 2015, 7, 5203–5223. [Google Scholar] [CrossRef]
- Alosairi, Y.; Pokavanich, T. Residence and transport time scales associated with Shatt Al-Arab discharges under various hydrological conditions estimated using a numerical model. Mar. Pollut. Bull. 2017, 118, 85–92. [Google Scholar] [CrossRef]
- Zarzuelo, C.; López-Ruiz, A.; Díez-Minguito, M.; Ortega-Sánchez, M. Tidal and subtidal hydrodynamics and energetics in a constricted estuary. Estuar. Coast. Shelf Sci. 2017, 185, 55–68. [Google Scholar] [CrossRef]
- Huggett, R.D.; Purdie, D.A.; Haigh, I.D. Modelling the influence of riverine inputs on the circulation and flushing times of small shallow estuaries. Estuaries Coasts 2021, 44, 54–69. [Google Scholar] [CrossRef]
- Cavalcante, G.H.; Kjerfve, B.; Feary, D.A. Examination of residence time and its relevance to water quality within a coastal mega-structure: The Palm Jumeirah Lagoon. J. Hydrol. 2012, 468–469, 111–119. [Google Scholar] [CrossRef]
- Safak, I.; Wiberg, P.L.; Richardson, D.L.; Kurum, M.O. Controls on residence time and exchange in a system of shallow coastal bays. Cont. Shelf Res. 2015, 97, 7–20. [Google Scholar] [CrossRef]
- Fourniotis, N.T.; Leftheriotis, G.A.; Horsch, G.M. Towards enhancing tidally-induced water renewal in coastal lagoons. Environ. Fluid Mech. 2021, 21, 343–360. [Google Scholar] [CrossRef]
- Van der Stocken, T.; De Ryck, D.J.R.; Vanschoenwinkel, B.; Deboelpaep, E.; Bouma, T.J.; Dahdouh-Guebas, F.; Koedam, N. Impact of landscape structure on propagule dispersal in mangrove forests. Mar. Ecol. Prog. Ser. 2015, 524, 95–106. [Google Scholar] [CrossRef]
- Sun, J.; Lin, B.; Li, K.; Jiang, G. A modelling study of residence time and exposure time in the Pearl River Estuary, China. J. Hydro-Environ. Res. 2014, 8, 281–291. [Google Scholar] [CrossRef]
- Mahanty, M.M.; Mohanty, P.K.; Pattnaik, A.K.; Panda, U.S.; Pradhan, S.; Samal, R.N. Hydrodynamics, temperature/salinity variability and residence time in the Chilika lagoon during dry and wet period: Measurement and modeling. Cont. Shelf Res. 2016, 125, 28–43. [Google Scholar] [CrossRef]


| Parameter | Observation | Model Simulation | RMSE | Correlation Coefficient | Index of Agreement | ||
|---|---|---|---|---|---|---|---|
| Mean | Std. Dev. | Mean | Std. Dev. | ||||
| Water level (m) | −0.03 | 0.38 | −0.02 | 0.46 | 0.11 | 0.98 | 0.98 |
| u-component of the water current (m/s) | −0.01 | 0.05 | −0.01 | 0.06 | 0.04 | 0.65 | 0.79 |
| v-component of the water current (m/s) | 0.04 | 0.10 | 0.02 | 0.06 | 0.08 | 0.67 | 0.73 |
| Parameter | Observation | Model Simulation | RMSE | Correlation Coefficient | Index of Agreement | ||
|---|---|---|---|---|---|---|---|
| Mean | Std. Dev. | Mean | Std. Dev. | ||||
| Water level (m) | 0.00 | 0.35 | 0.00 | 0.46 | 0.14 | 0.97 | 0.97 |
| u-component of the water current (m/s) | −0.07 | 0.12 | −0.07 | 0.12 | 0.05 | 0.93 | 0.96 |
| v-component of the water current (m/s) | 0.04 | 0.08 | 0.05 | 0.08 | 0.05 | 0.83 | 0.90 |
| Inlet Configuration | Release Point | Monsoon | Day 5 | Day 30 | Day 60 | Day 120 |
|---|---|---|---|---|---|---|
| Old inlet | R1 | SW | 36 | 28 | 27 | 27 |
| NE | 30 | 26 | 25 | 24 | ||
| R2 | SW | 52 | 47 | 47 | 46 | |
| NE | 45 | 38 | 36 | 33 | ||
| R3 | SW | 200 | 200 | 199 | 198 | |
| NE | 199 | 196 | 195 | 179 | ||
| Both inlets | R1 | SW | 5 | 3 | 2 | 2 |
| NE | 24 | 4 | 1 | 0 | ||
| R2 | SW | 125 | 25 | 19 | 12 | |
| NE | 123 | 11 | 6 | 3 | ||
| R3 | SW | 200 | 172 | 142 | 101 | |
| NE | 182 | 106 | 23 | 1 | ||
| New inlet | R1 | SW | 200 | 194 | 190 | 187 |
| NE | 193 | 186 | 175 | 160 | ||
| R2 | SW | 134 | 106 | 103 | 101 | |
| NE | 81 | 52 | 37 | 34 | ||
| R3 | SW | 197 | 137 | 109 | 73 | |
| NE | 178 | 64 | 15 | 13 |
| Inlet Configuration | Release Point | Monsoon | Residence Time |
|---|---|---|---|
| Old inlet | R1 | Southwest | 15 h |
| Northeast | 12 h | ||
| R2 | Southwest | 18 h | |
| Northeast | 15 h | ||
| R3 | Southwest | >130 days | |
| Northeast | >130 days | ||
| Both inlets | R1 | Southwest | 15 h |
| Northeast | 12 h | ||
| R2 | Southwest | 9 days | |
| Northeast | 8 days | ||
| R3 | Southwest | >130 days | |
| Northeast | 49 days | ||
| New inlet | R1 | Southwest | >130 days |
| Northeast | >130 days | ||
| R2 | Southwest | >130 days | |
| Northeast | 17 days | ||
| R3 | Southwest | 112 days | |
| Northeast | 29 days |
Publisher’s Note: MDPI stays neutral with regard to jurisdictional claims in published maps and institutional affiliations. |
© 2022 by the authors. Licensee MDPI, Basel, Switzerland. This article is an open access article distributed under the terms and conditions of the Creative Commons Attribution (CC BY) license (https://creativecommons.org/licenses/by/4.0/).
Share and Cite
Zainol, Z.; Akhir, M.F. The Effects of Different Inlet Configurations on Particles Transport and Residence Time in a Shallow and Narrow Coastal Lagoon: A Numerical Based Investigation. Water 2022, 14, 1333. https://doi.org/10.3390/w14091333
Zainol Z, Akhir MF. The Effects of Different Inlet Configurations on Particles Transport and Residence Time in a Shallow and Narrow Coastal Lagoon: A Numerical Based Investigation. Water. 2022; 14(9):1333. https://doi.org/10.3390/w14091333
Chicago/Turabian StyleZainol, Zuraini, and Mohd Fadzil Akhir. 2022. "The Effects of Different Inlet Configurations on Particles Transport and Residence Time in a Shallow and Narrow Coastal Lagoon: A Numerical Based Investigation" Water 14, no. 9: 1333. https://doi.org/10.3390/w14091333
APA StyleZainol, Z., & Akhir, M. F. (2022). The Effects of Different Inlet Configurations on Particles Transport and Residence Time in a Shallow and Narrow Coastal Lagoon: A Numerical Based Investigation. Water, 14(9), 1333. https://doi.org/10.3390/w14091333