
Post-Treatment of Reclaimed Municipal Wastewater through Unsaturated and Saturated Porous Media in a Large-Scale Experimental Model

Abstract
:1. Introduction
2. Materials and Methods
2.1. Facilities
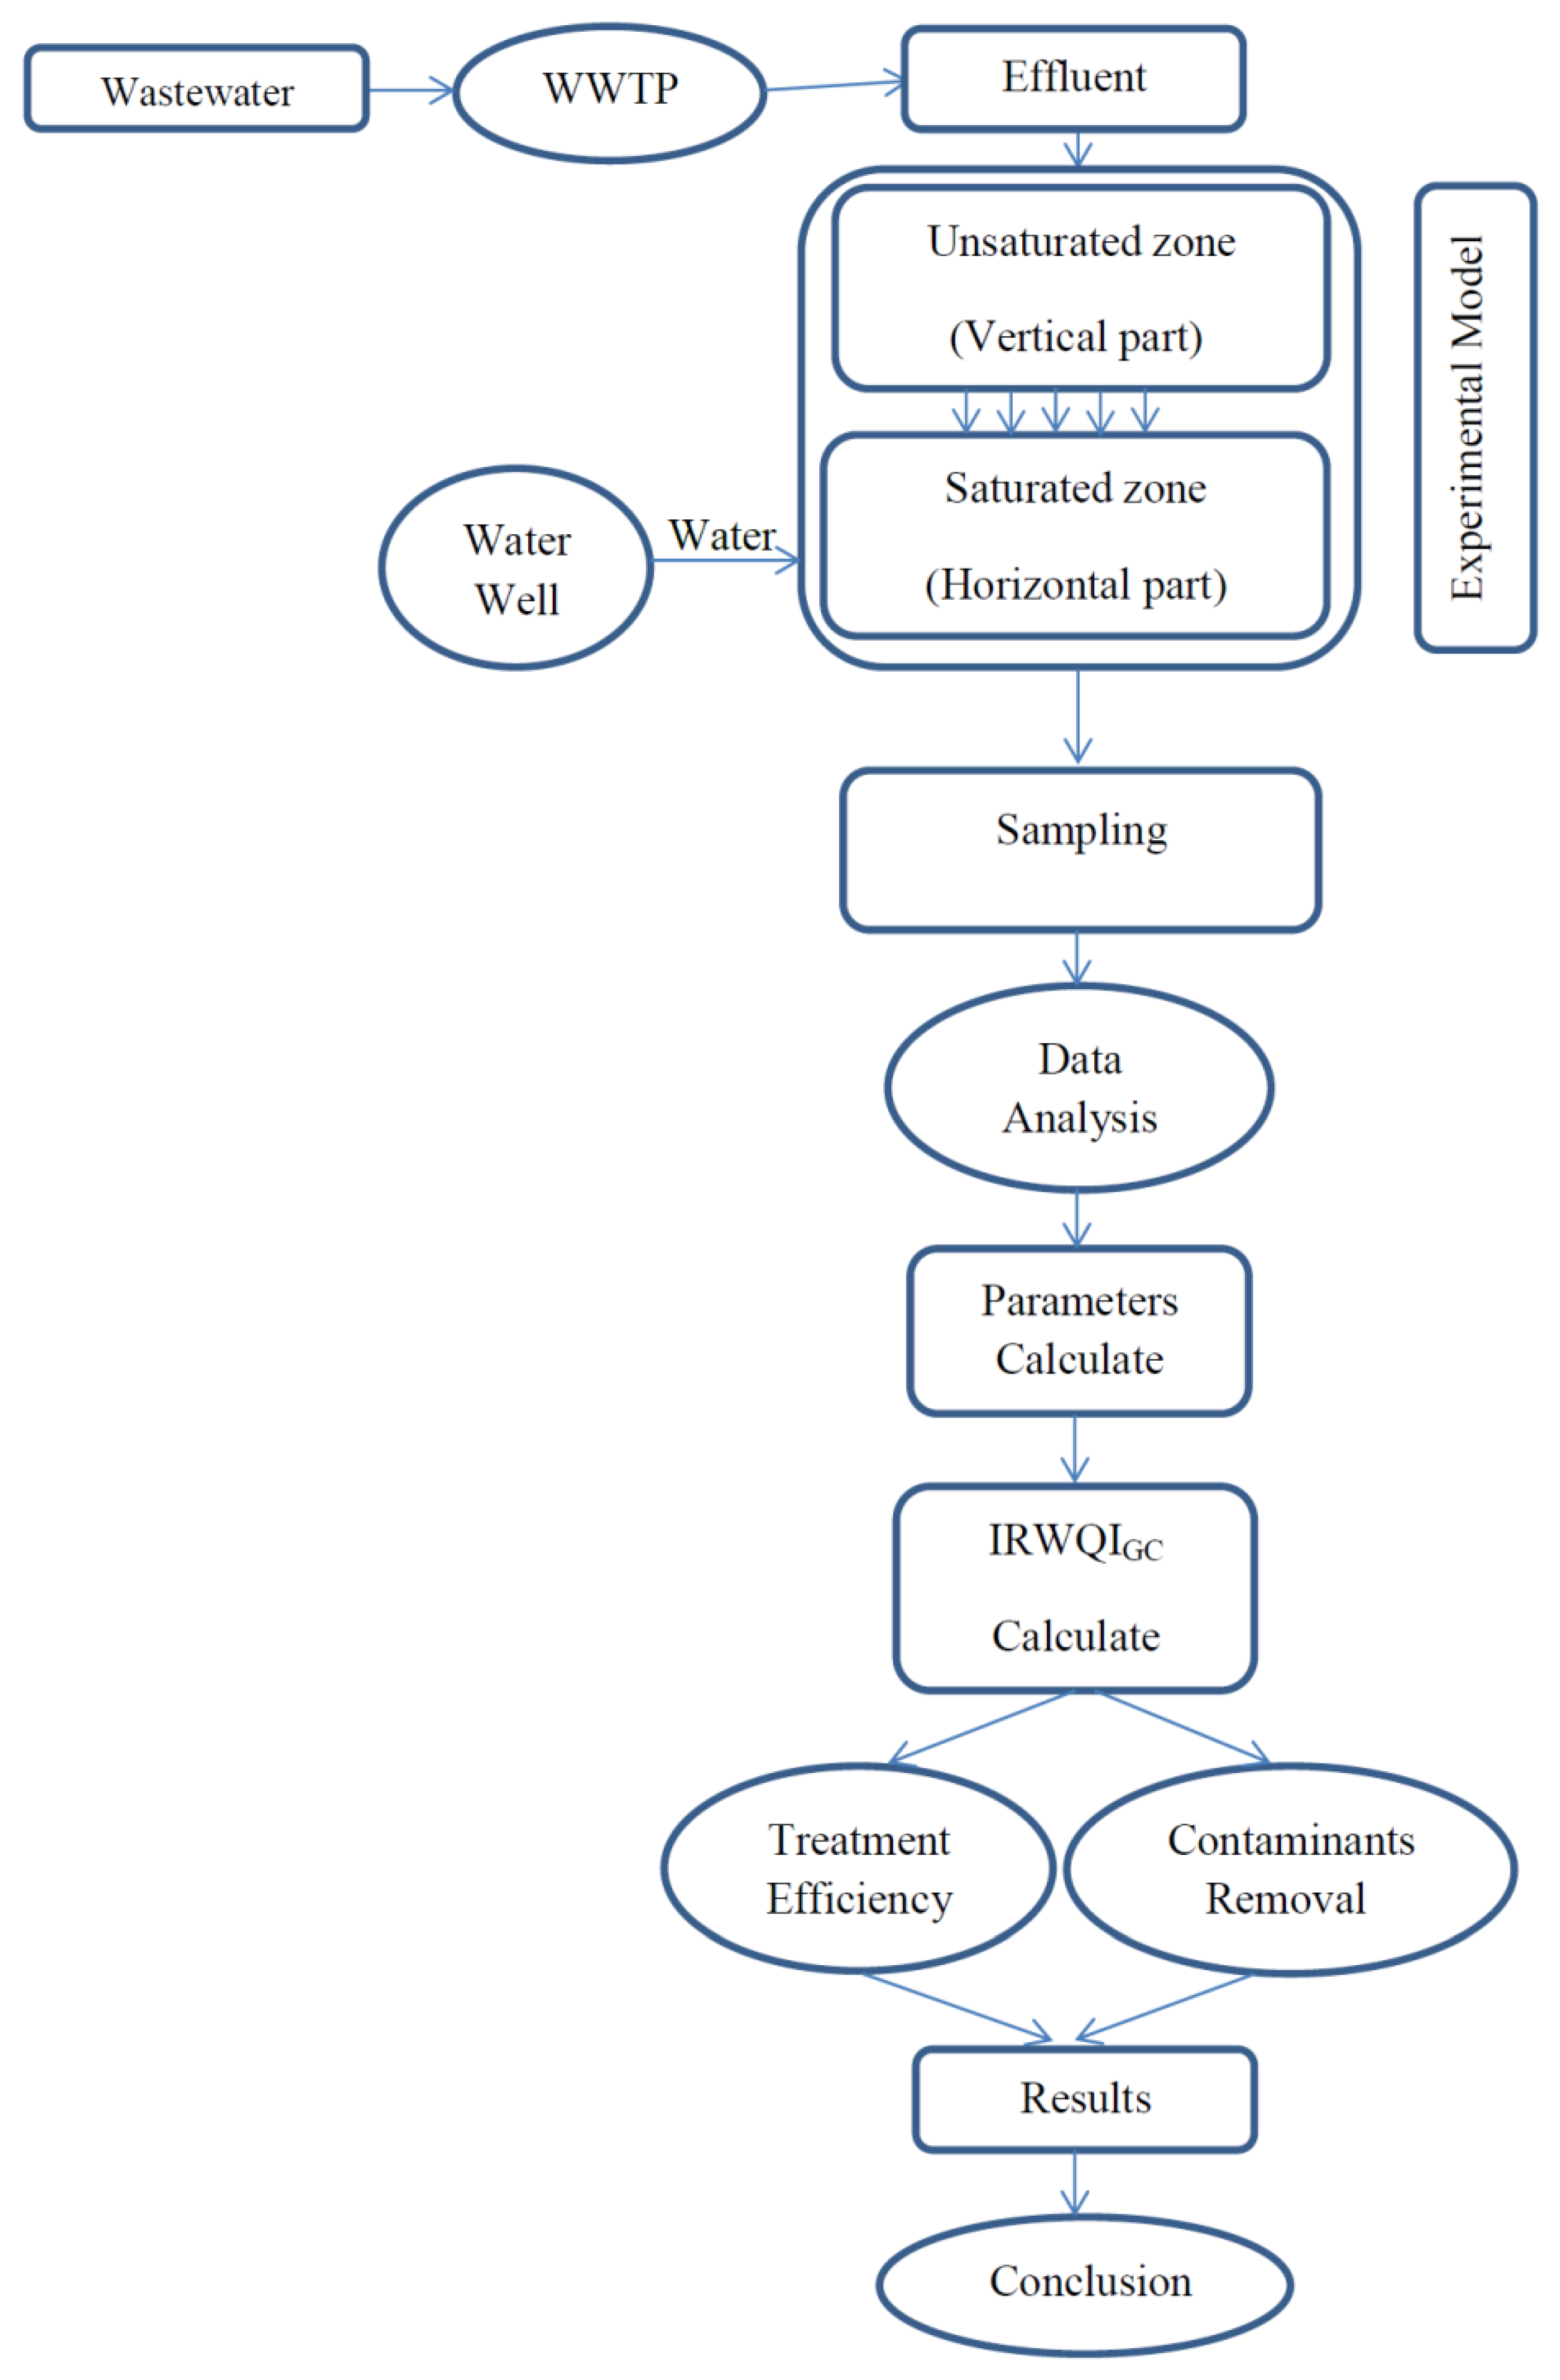
2.2. Experimental Model
2.2.1. Model Installation Site and Wastewater Treatment Plant (WWTP)
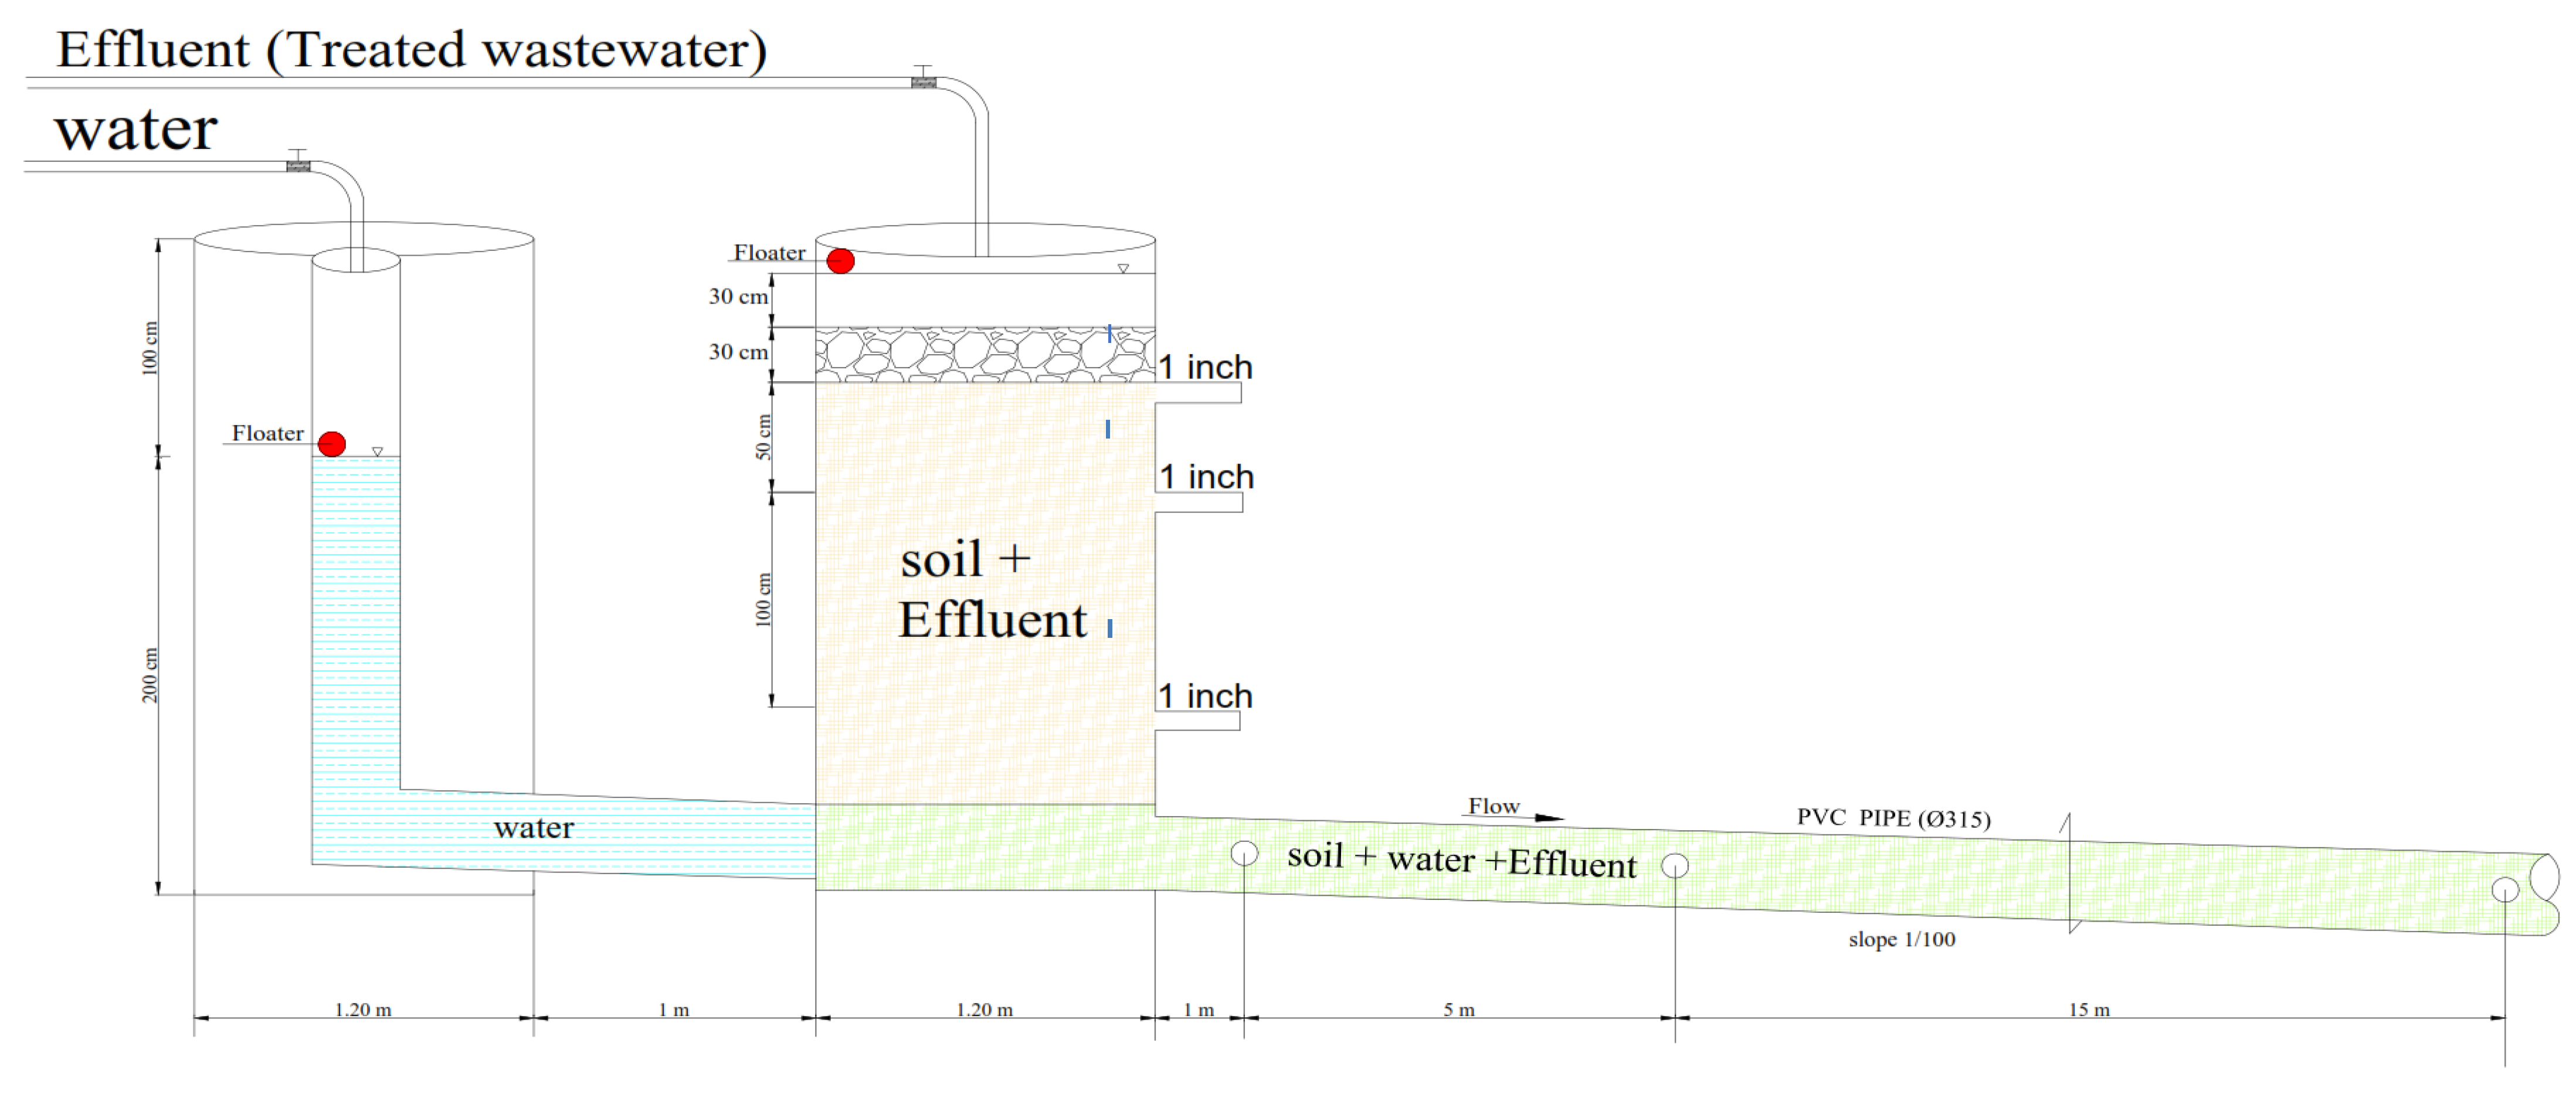
2.2.2. Experimental Model Design
2.3. The Hydraulic Conditions
2.4. Collection and Analysis of Water Samples
3. Results and Discussion
4. Conclusions
Author Contributions
Funding
Acknowledgments
Conflicts of Interest
References
- Esteller, M.V.; Diaz-Delgado, C. Environmental Effects of Aquifer Overexploitation: A Case Study in the Highlands of Mexico. Environ. Manag. 2002, 29, 266–278. [Google Scholar] [CrossRef] [Green Version]
- Kavuri, M.; Boddu, M.; Annamdas, V.G.M. New Methods of Artificial Recharge of Aquifers: A Review” IPWE 2011. In Proceedings of the 4th International Perspective on Water Resources & the Environment, National University of Singapore (NUS), Singapore, 4–6 January 2011; pp. 1–9. [Google Scholar]
- Bhattacharya, A.K. Artificial Ground Water Recharge with a Special Reference To India. Int. J. Res. Rev. Appl. Sci. IJRRAS 2010, 4, 214–221. [Google Scholar]
- Dadakis, J.; Patel, M.; Fitzsimmons, S. Orange County’s Groundwater Replenishment System: Water Quality Monitoring and Facility Expansion in the Face of Changing Regulations. Proc. Water Environ. Fed. 2012, 2011, 1355–1366. [Google Scholar] [CrossRef] [Green Version]
- Tyagi, S.; Sharma, B.; Singh, P.; Dobhal, R. Water Quality Assessment in Terms of Water Quality Index. Am. J. Water Resour. 2014, 1, 34–38. [Google Scholar] [CrossRef]
- Vanderzalm, J.L.; Page, D.W.; Barry, K.E.; Dillon, P.J. Application of a probabilistic modelling approach for evaluation of nitrogen, phosphorus and organic carbon removal efficiency during four successive cycles of aquifer storage and recovery (ASR) in an anoxic carbonate aquifer. Water Res. 2013, 47, 2177–2189. [Google Scholar] [CrossRef]
- Dillon, P.; Toze, S.; Page, D.; Vanderzalm, J.; Bekele, E.; Sidhu, J.; Rinck-Pfeiffer, S. Managed aquifer recharge: Rediscovering nature as a leading edge technology. Water Sci. Technol. 2010, 62, 2338–2345. [Google Scholar] [CrossRef]
- Fatta, D.; Kythreotou, N. Wastewater as valuable water resource-concerns, constraints and requirements related to reclamation, recycling and reuse. In Proceedings of the IWA International Conference on Water Economics, Statistics and Finance, Lisbon, Portugal, 8–10 July 2005. [Google Scholar]
- Hahn, W.; Thompson, H.; Ankeny, M.; Forbes, J. Comparison of Alternative Methods for Recharge of a Deep Aquifer; American Water Works Association: Denver, CO, USA, 2003; 236p. [Google Scholar]
- Page, D.; Bekele, E.; Vanderzalm, J.; Sidhu, J. Managed Aquifer Recharge (MAR) in Sustainable Urban Water Management. Water 2018, 10, 239. [Google Scholar] [CrossRef] [Green Version]
- Fichtner, T.; Barquero, F.; Sallwey, J.; Stefan, C. Assessing Managed Aquifer Recharge Processes under Three Physical Model Concepts. Water 2019, 11, 107. [Google Scholar] [CrossRef] [Green Version]
- Bekele, E.; Page, D.; Vanderzalm, J.; Kaksonen, A.; Gonzalez, D. Water Recycling via Aquifers for Sustainable Urban Water Quality Management: Current Status, Challenges and Opportunities. Water 2018, 10, 457. [Google Scholar] [CrossRef] [Green Version]
- Samanta, S.; Sheng, Z.; Munster, C.; Houtte, E. Seasonal variation of infiltration rates through pond bed in a managed aquifer recharge system in St-André, Belgium. Hydrol. Process 2020, 34, 3807–3823. [Google Scholar] [CrossRef]
- Pescod, M.B. Wastewater Treatment and Use in Agriculture—FAO Irrigation and Drainage; Food and Agriculture Organization of the United Nations: Rome, Italy, 1992; Volume 47. [Google Scholar]
- Hammer, M.J. Water and Waste-Water Technology, 7th ed.; U.S. Geological Survey: Reston, VA, USA, 2016.
- Peavy, H.S.; Rowe, D.R.; Tchobanoglous, G. Environmental Engineering; McGraw Hill: New York, NY, USA, 1984; 719p. [Google Scholar]
- Wintgens, T.; Hochstrat, R.; Kazner, C.; Jeffrey, P.; Jefferson, B.; Melin, T. Managed Aquifer Recharge as a Component of Sustainable Water Strategies; IWA Publishing: London, UK, 2009; Chapter 8; 17p. [Google Scholar]
- Bekele, E.; Toze, S.; Patterson, B.; Higginson, S. Managed aquifer recharge of treated wastewater: Water quality changes resulting from infiltration through the vadose zone. Water Res. 2011, 45, 5764–5772. [Google Scholar] [CrossRef]
- Du, X.; Fang, Y.; Wang, Z.; Hou, J.; Ye, X. The Prediction Methods for Potential Suspended Solids Clogging Types during Managed Aquifer Recharge. Water 2014, 6, 961–975. [Google Scholar] [CrossRef] [Green Version]
- Thangarajan, M. Groundwater: Resource Evaluation, Augmentation, Contamination, Restoration, Modeling and Management; Springer: Dordrecht, The Netherlands, 2007; p. 357. [Google Scholar]
- Alam, S.; Borthakur, A.; Ravi, S.; Gebremichael, M.; Mohanty, S.K. Managed aquifer recharge implementation criteria to achieve water sustainability. Sci. Total Environ. 2021, 768, 144992. [Google Scholar] [CrossRef]
- Schäfer, A.; Ustohal, P.; Harms, H.; Stauffer, F.; Dracos, T.; Zehnder, A.J. Transport of bacteria in unsaturated porous media. J. Contam. Hydrol. 1998, 33, 149–169. [Google Scholar] [CrossRef]
- Schaffer, M.; Kröger, K.F.; Nödler, K.; Ayora, C.; Carrera, J.; Hernández, M.; Licha, T. Influence of a compost layer on the attenuation of 28 selected organic micropollutants under realistic soil aquifer treatment conditions: Insights from a large scale column experiment. Water Res. 2015, 74, 110–121. [Google Scholar] [CrossRef]
- El Arabi, N. Environmental Management of Groundwater in Egypt via Artificial Recharge Extending the Practice to Soil Aquifer Treatment (SAT). Int. J. Environ. Sustain. 2012, 1, 66–82. [Google Scholar] [CrossRef]
- Amy, G.; Drewes, J.E. Soil Aquifer Treatment (SAT) as a Natural and Sustainable Wastewater Reclamation/Reuse Technology: Fate of Wastewater Effluent Organic Matter (EfOM) and Trace Organic Compounds. Environ. Monit. Assess. 2007, 129, 19–26. [Google Scholar] [CrossRef]
- Voudouris, K. Artificial Recharge via Boreholes Using Treated Wastewater: Possibilities and Prospects. Water 2011, 3, 964–975. [Google Scholar] [CrossRef]
- Ollivier, P.; Surdyk, N.; Azaroual, M.; Besnard, K.; Casanova, J.; Rampnoux, N. Linking water quality changes to geochemical processes occurring in a reactive soil column during treated wastewater infiltration using a large-scale pilot experiment: Insights into Mn behavior. Chem. Geol. 2013, 356, 109–125. [Google Scholar] [CrossRef]
- Reese, R.S. Inventory and Review of Aquifer Storage and Recovery in Southern Florida; U.S. Geological Survey Water-Resources Investigations Report; U.S. Department of the Interior, U.S. Geological Survey: Reston, VA, USA, 2002. [CrossRef]
- Dillon, P.; Pavelic, P.; Toze, S.; Rinck-Pfeiffer, S.; Martin, R.; Knapton, A.; Pidsley, D. Role of aquifer storage in water reuse. Desalination 2006, 188, 123–134. [Google Scholar] [CrossRef]
- Castro, J.E. Aquifer Storage and Recovery: A Water Resources Management Altern. J. Contemp. Water Res. Educ. 1997, 106, 109–115. [Google Scholar]
- Asano, T. International Review for Environmental Strategies Water Reuse via Groundwater Recharge. Int. Rev. Environ. Strateg. 2006, 6, 205–216. [Google Scholar]
- Sheng, Z. An aquifer storage and recovery system with reclaimed wastewater to preserve native groundwater resources in El Paso, Texas. J. Environ. Manag. 2005, 75, 367–377. [Google Scholar] [CrossRef]
- Rinck-Pfeiffer, S.; Dillon, P.; Ragusa, S.; Hutson, J.; Fallowfield, H.; Marsily, G.; Pavelic, P. Reclaimed water for ASR: A cloumn study of well clogging. In Clogging Issues Associated with Managed Aquifer Recharge Methods; International Association of Hydrogeologists: Richmond, VIC, Australia, 2013; pp. 26–33. [Google Scholar]
- Stuyfzand, P.J.; Wakker, J.C.; Putters, B. Water quality changes during Aquifer Storage and Recovery (ASR): Results from pilot Herten (Netherlands), and their implications for modeling. In Proceedings of the 5th International Symposium, ISMAR 2005, Berlin, Germany, 10–16 June 2005. [Google Scholar]
- Abdalrahman, G.A.; Lai, S.H.; Snounu, I.; Kumar, P.; Sefelnasr, A.; Sherif, M.; El-Shafie, A. Review on wastewater treatment ponds clogging under artificial recharge: Impacting factors and future modelling. J. Water Process Eng. 2021, 40, 101848. [Google Scholar] [CrossRef]
- Pavelic, P.; Dillon, P.J.; Barry, K.E.; Vanderzalm, J.L.; Correll, R.L.; Rinck-Pfeiffer, S.M. Water quality effects on clogging rates during reclaimed water ASR in a carbonate aquifer. J. Hydrol. 2007, 334, 1–16. [Google Scholar] [CrossRef]
- Händel, F.; Liu, G.; Dietrich, P.; Liedl, R.; Butler, J.J. Numerical assessment of ASR recharge using small-diameter wells and surface basins. J. Hydrol. 2014, 517, 54–63. [Google Scholar] [CrossRef]
- Eslami, F.; Shokoohi, R.; Mazloomi, S.; Darvish Motevalli, M.; Salari, M. Evaluation of Water Quality Index (WQI) of Groundwater Supplies in Kerman Province in 2015. J. Occup. Environ. Health 2017, 3, 48–58. [Google Scholar]
- Naubi, I.; Zardari, N.H.; Shirazi, S.M.; Ibrahim, F.B.; Baloo, L. Effectiveness of Water Quality Index for Monitoring Malaysian River Water Quality. Pol. J. Environ. Stud. 2016, 25, 231–239. [Google Scholar] [CrossRef]
- Iran, E.P.A. The Guideline to Calculating Iran Water Quality Index; Technical Report; 2010; p. 42. (In Persian) [Google Scholar]


| Sample No. | Unified Soil Classification | Description | Liquid Limit (%) | Plasticity Index (%) |
|---|---|---|---|---|
| S1 | ML | Silt with Sand Cc = 1.242 and Cu > 10 | 23 | NP |
| S2 | ML | Silt with Sand Cc = 1.120 and Cu > 10 | 24 | NP |
| Parameter | PH | Total Hardness. (CaCo3) (ppm) | EC (micromhos/cm) | Total N (T.K.N) (ppm) | Na (Saturated Extract) (ppm) | Total Phosphorus (ppm) | Mgo (%) | Cao (%) | Chloride (%) |
|---|---|---|---|---|---|---|---|---|---|
| Amount | 7.15 | 195 | 222 | 0.1 | 66.7 | 0.046 | 2.1 | 7.99 | 0.009 |
| Parameters | PH | Turbidity | TH | Alkalinity | EC | TDS | CL | SO4 | NO3 | NO2 | PO4 | Ca | Mg | Na | K | NH3 |
|---|---|---|---|---|---|---|---|---|---|---|---|---|---|---|---|---|
| (NTU) | (mg/L) | (mg/L) | (µs/cm) | (mg/L) | (mg/L) | (mg/L) | (mg/L) | (mg/L) | (mg/L) | (mg/L) | (mg/L) | (mg/L) | (mg/L) | (mg/L) | ||
| Amount | 7.7–7.8 | 0.2–0.5 | 326–392 | 104–110 | 922–1100 | 525–605 | 156–178 | 85–105 | 26–43 | 0.003–0.007 | 0.37–0.38 | 102–121 | 16.7–18.2 | 55.1–57.5 | 0.5–0.6 | 0.05–0.07 |
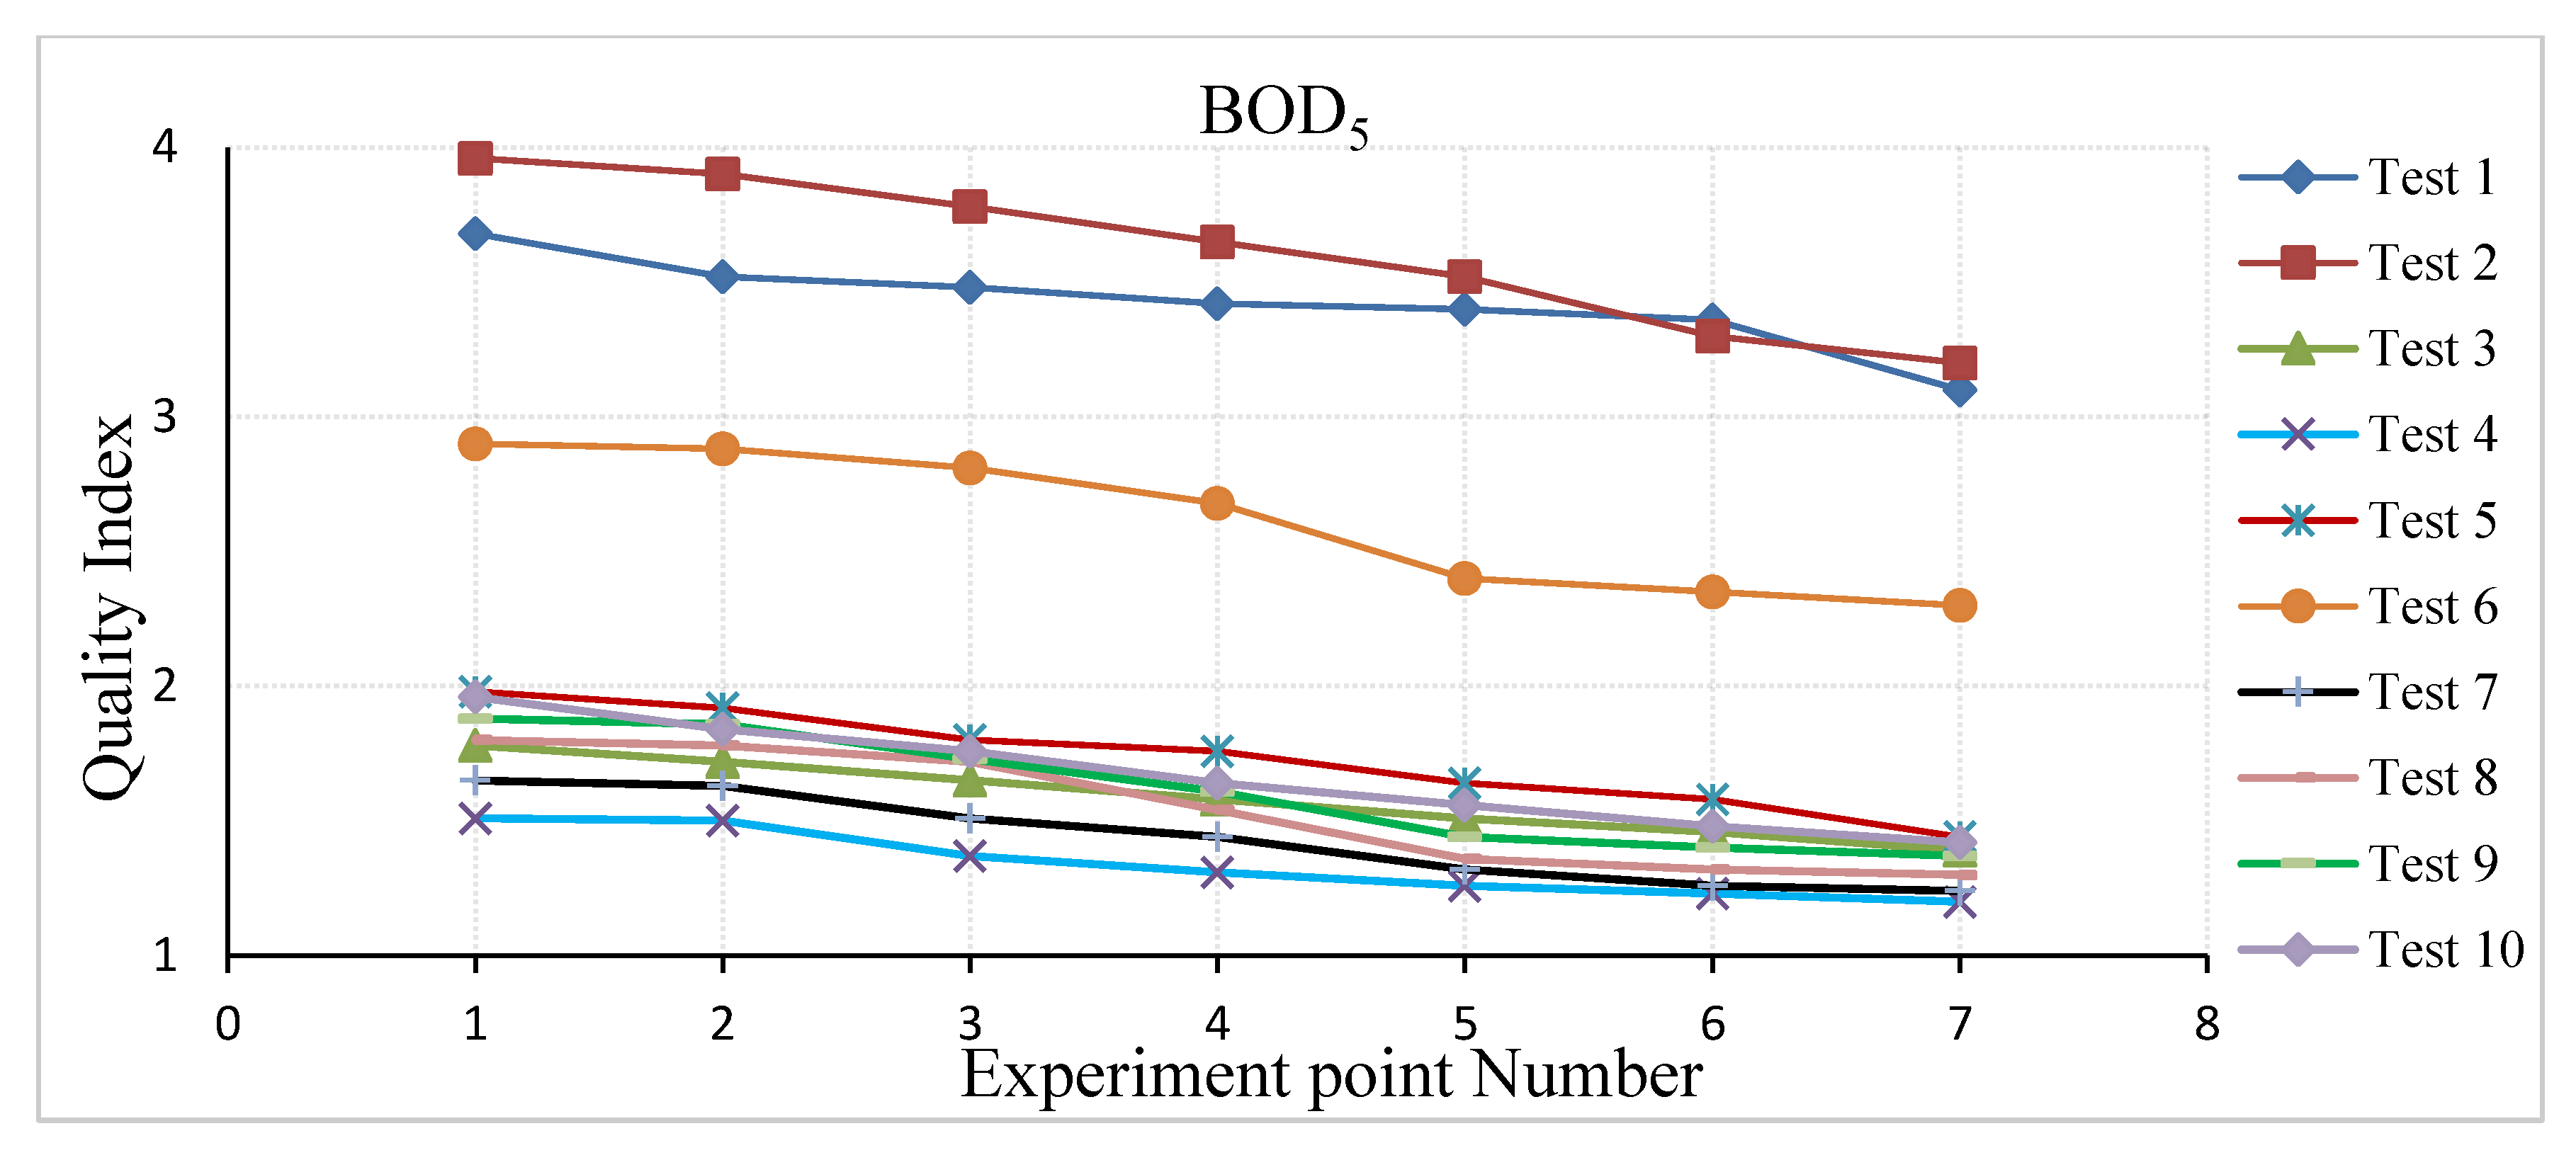
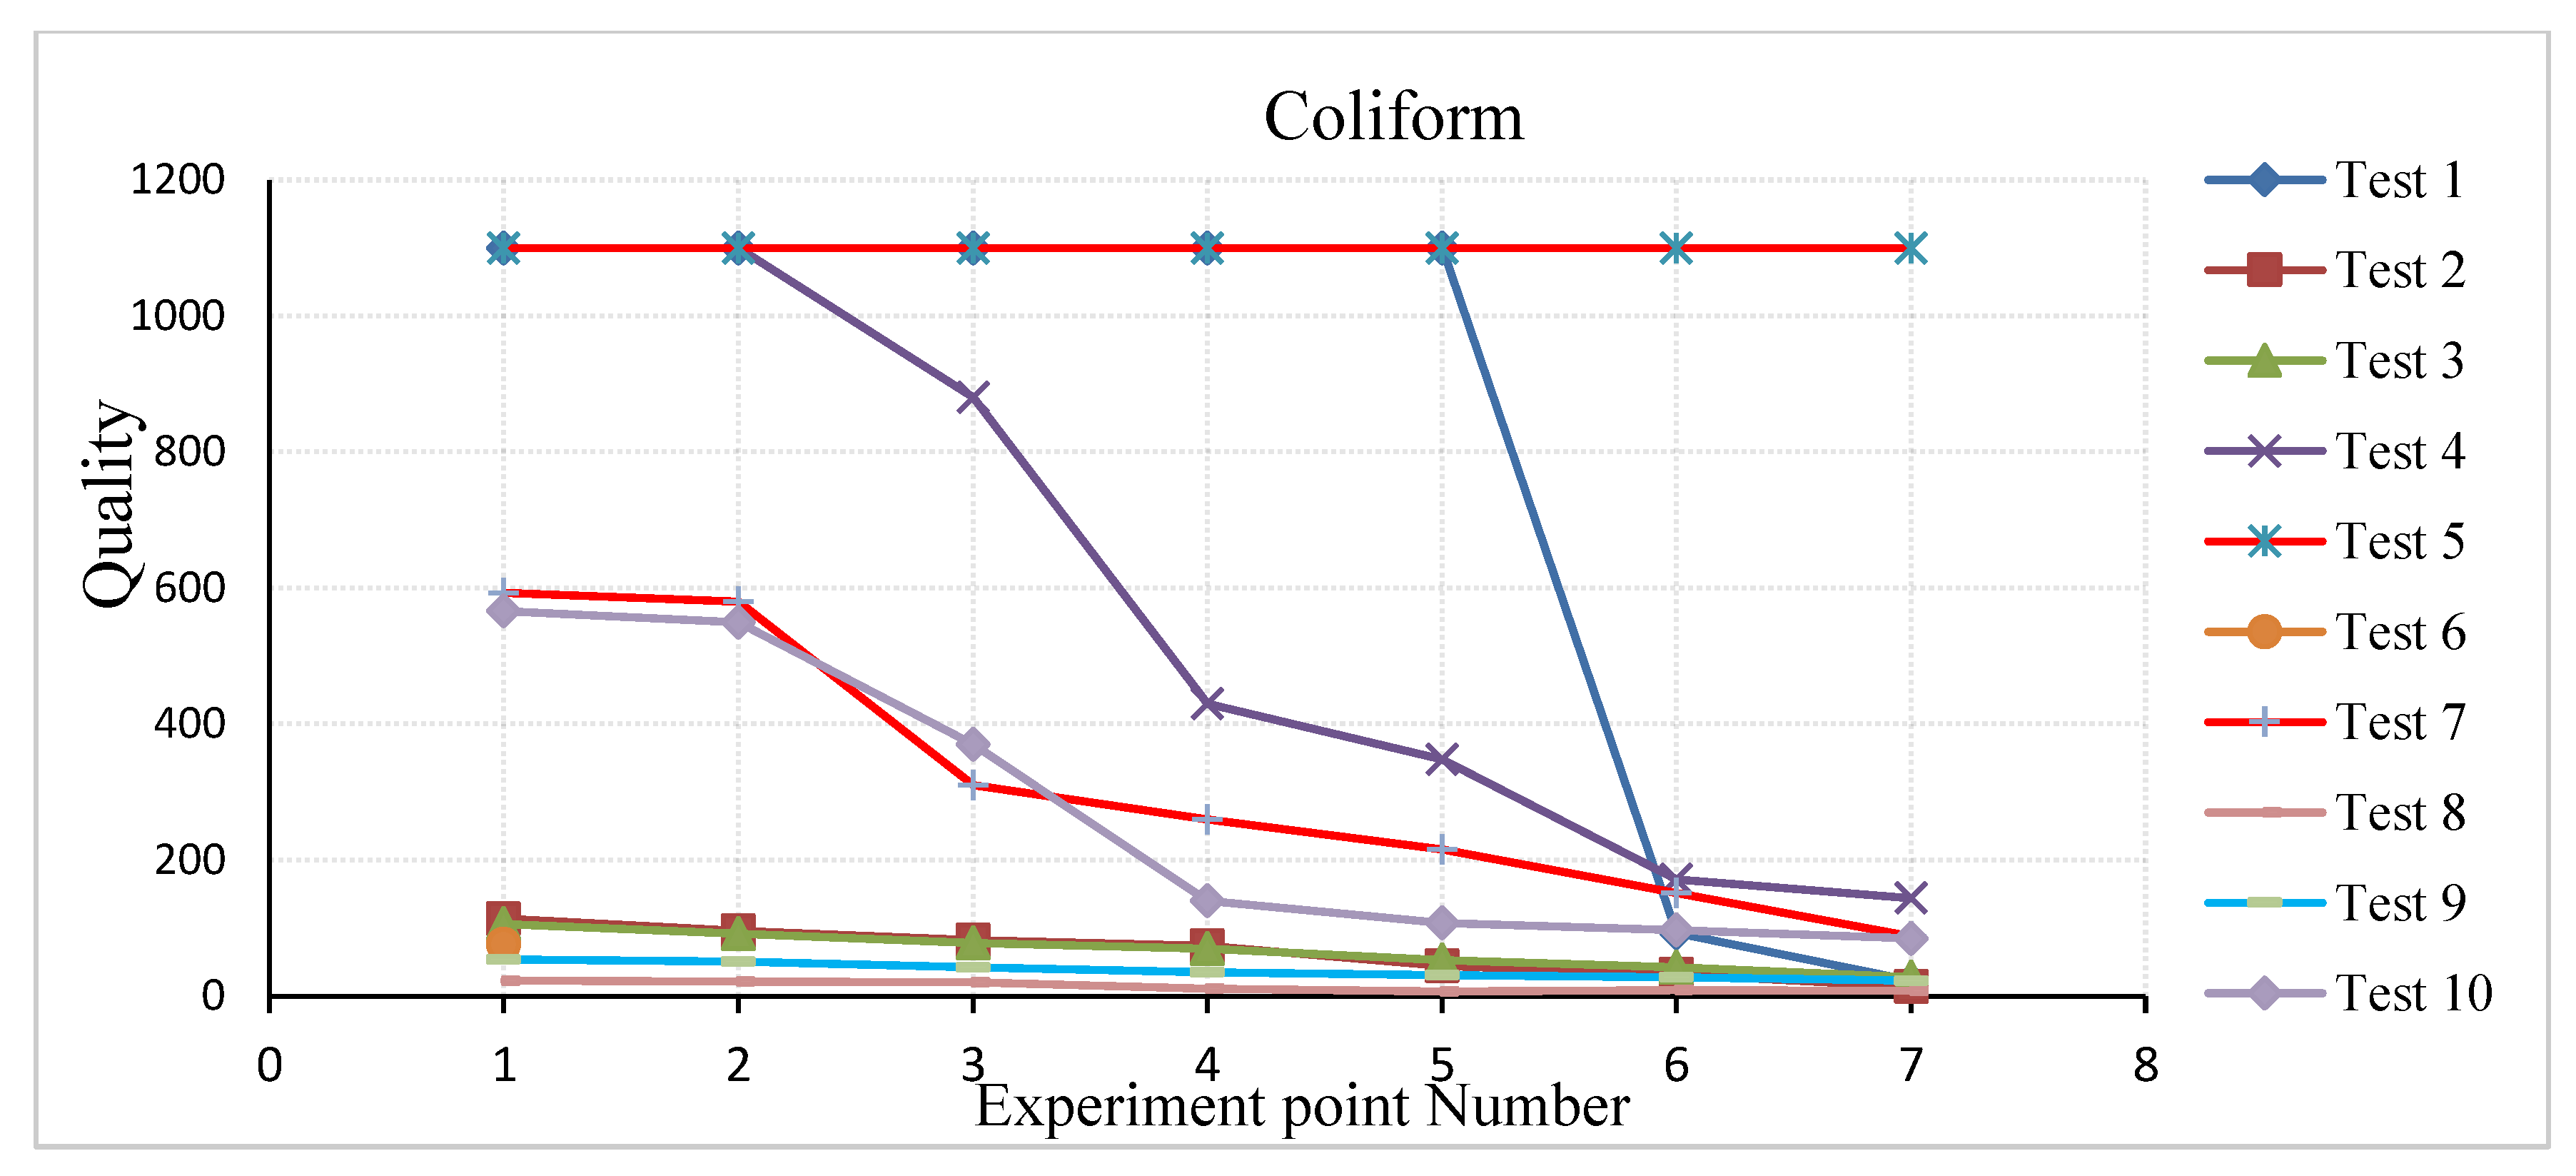
| Parameters | BOD5 (mg/L) | COD (mg/L) | TSS (mg/L) | TDS (mg/L) | NO3 (mg/L) | TP (mg/L) as P | TN (mg/L) as N | Total Coliform | PH | T (°C) |
|---|---|---|---|---|---|---|---|---|---|---|
| Range | 4.3–7.10 | 18.0–28.0 | 5.0–9.0 | 827–908 | 4.4–24.7 | 1.15–3.13 | 10.0–15.6 | 110–1600 | 7.4–8.2 | 12.7–24.7 |
| Parameters | Weight of Each Parameter |
|---|---|
| T (°C) | - |
| PH (Standard unit) | 0.074 |
| BOD5 (mg/L) | 0.09 |
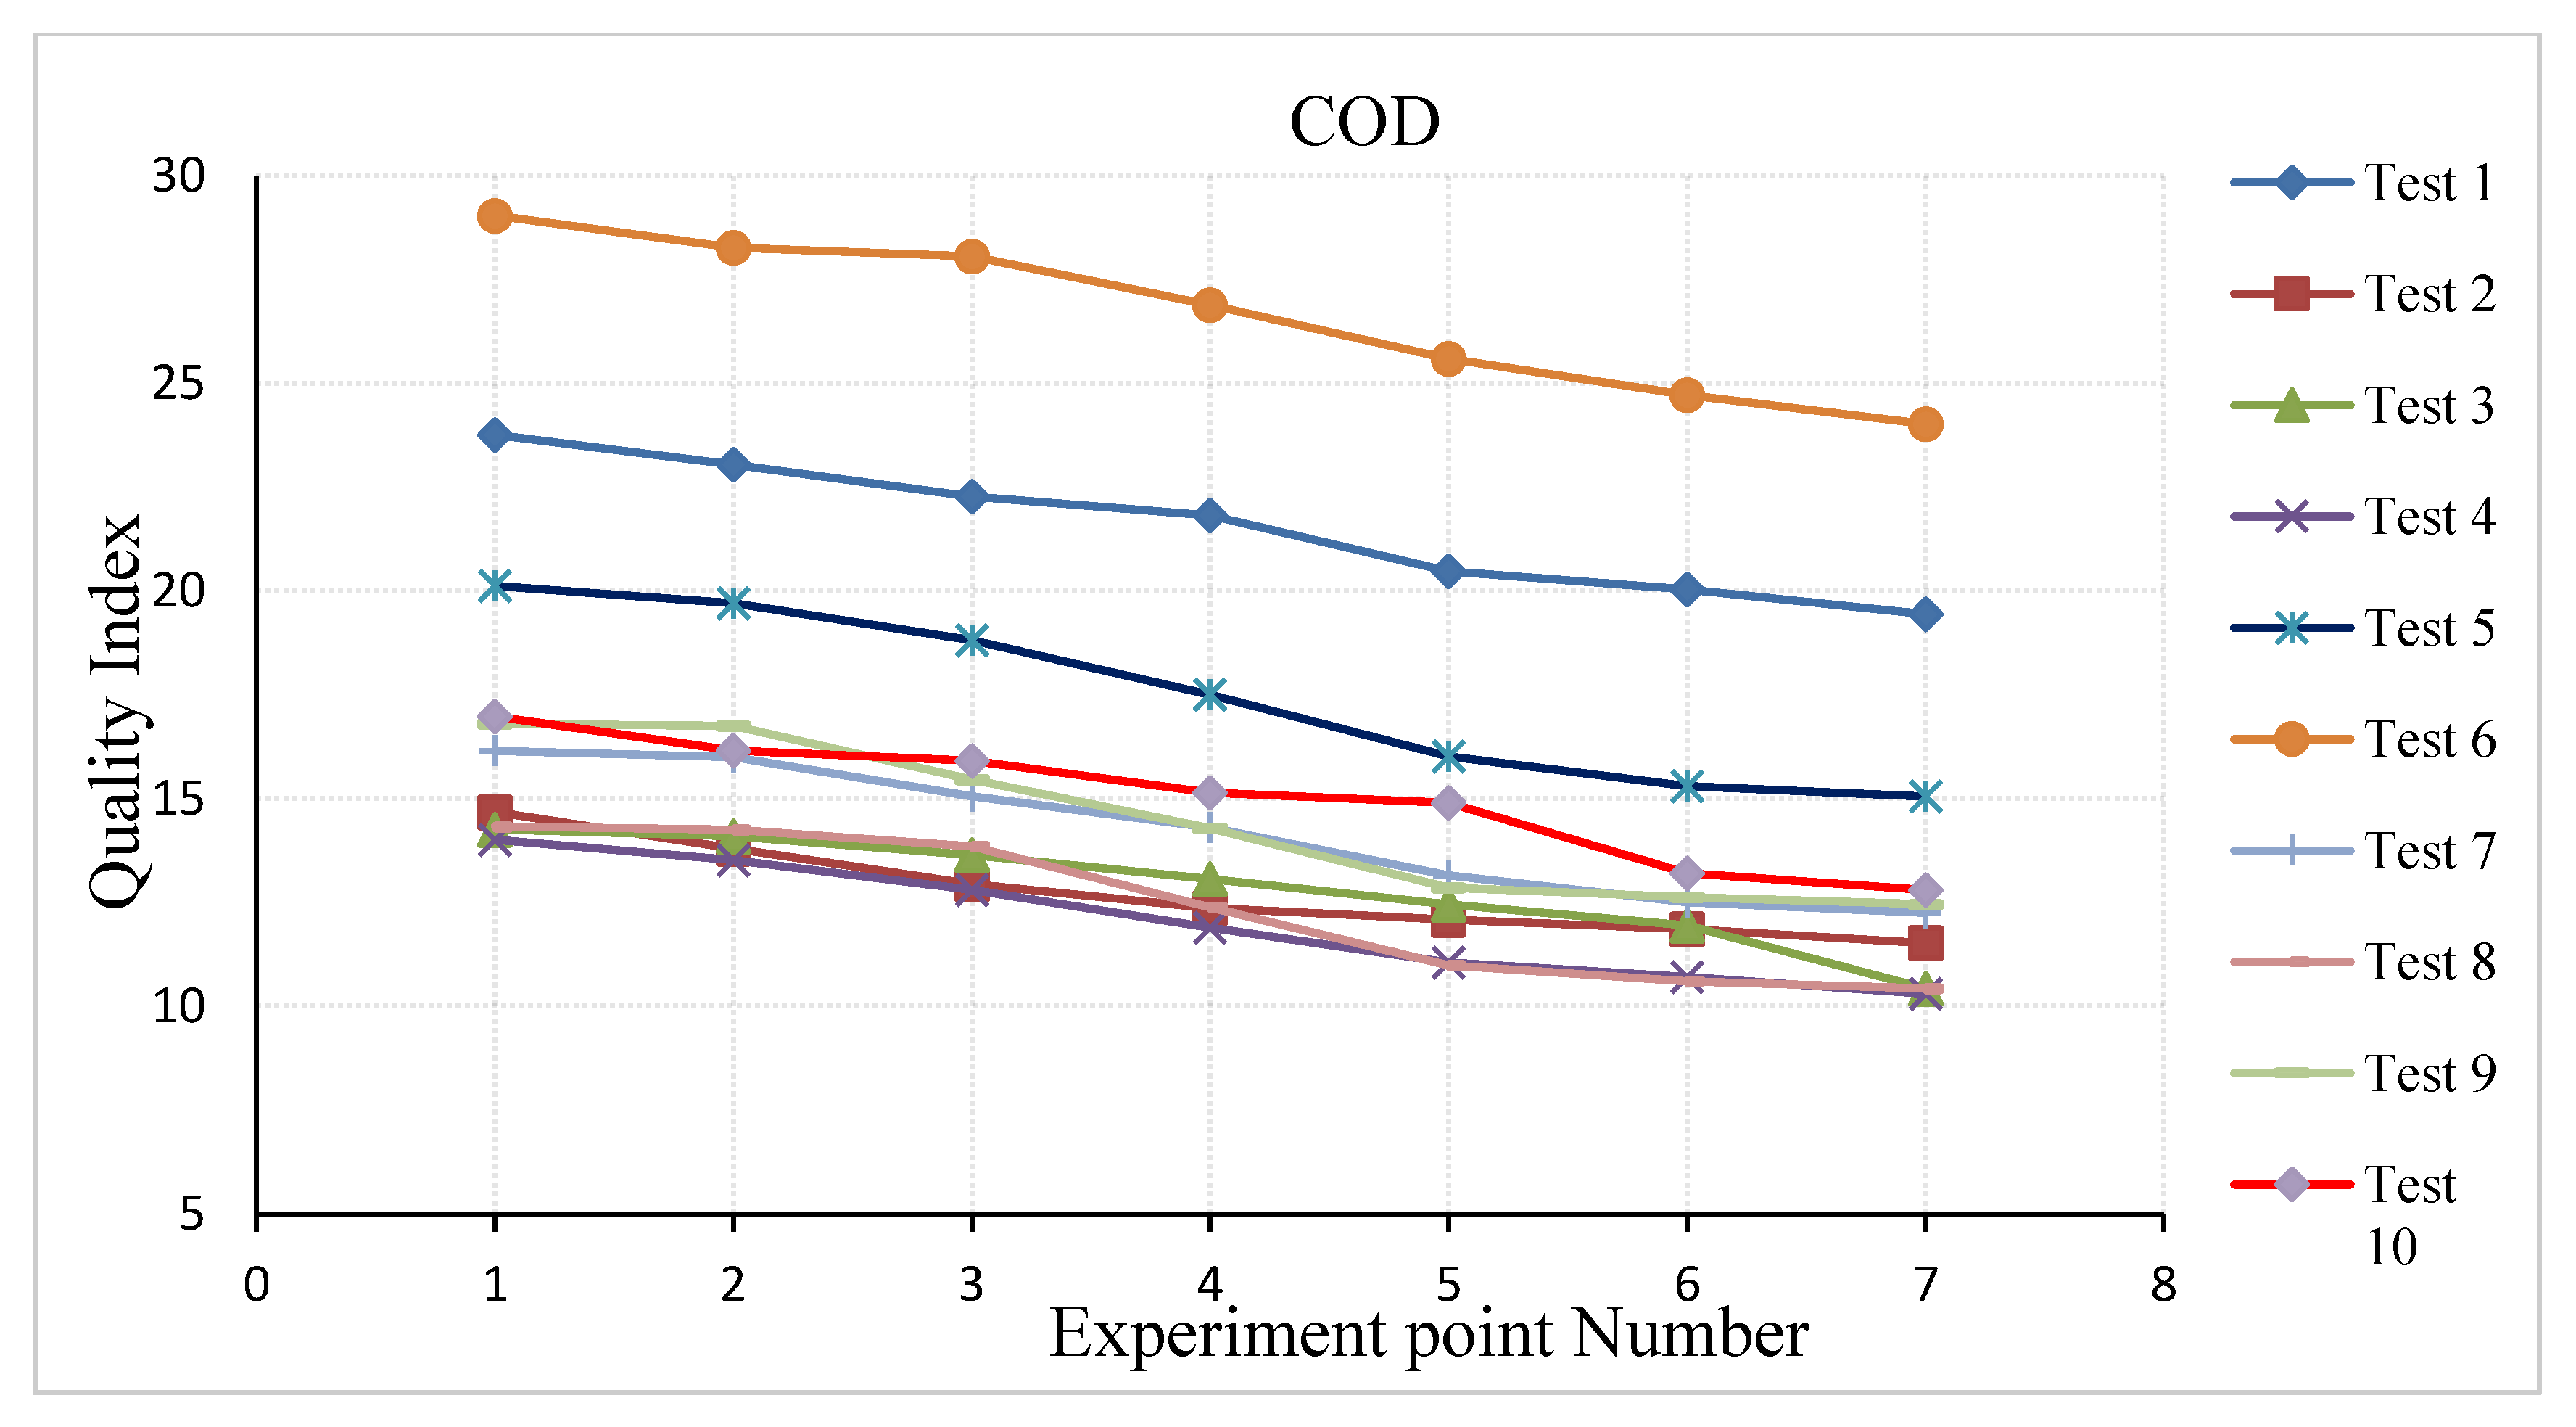
| COD (mg/L) | 0.08 |
| DO (Saturation %) | 0.067 |
| SAR | 0.089 |
| Cl− (PPM) | - |
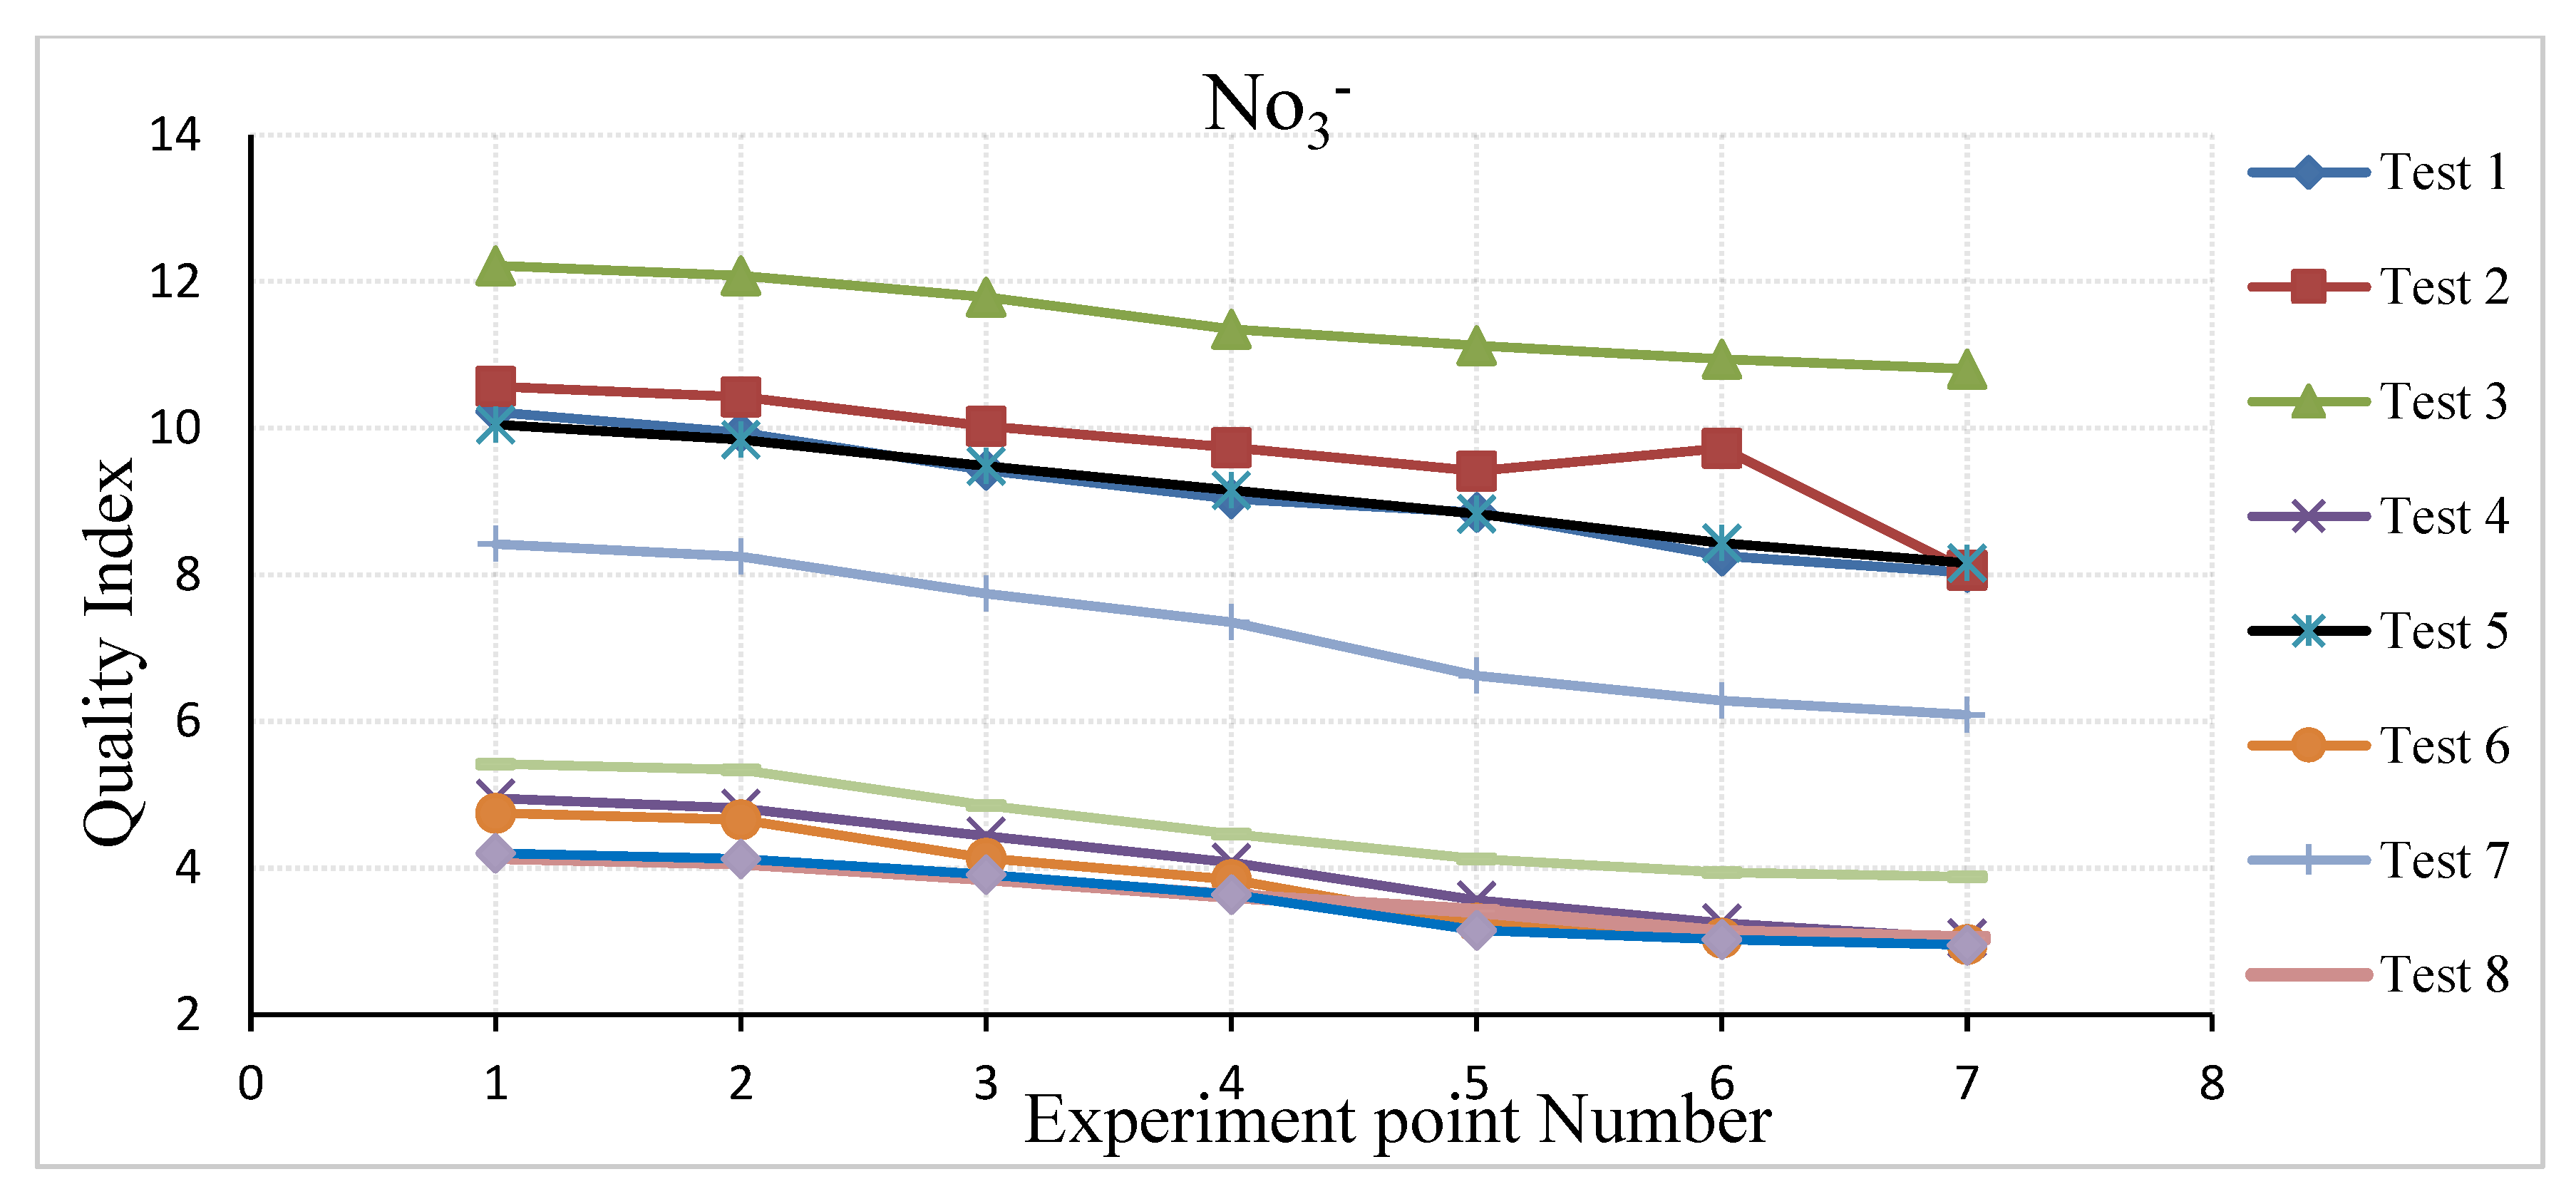
| NO3− (mg/L) | 0.151 |
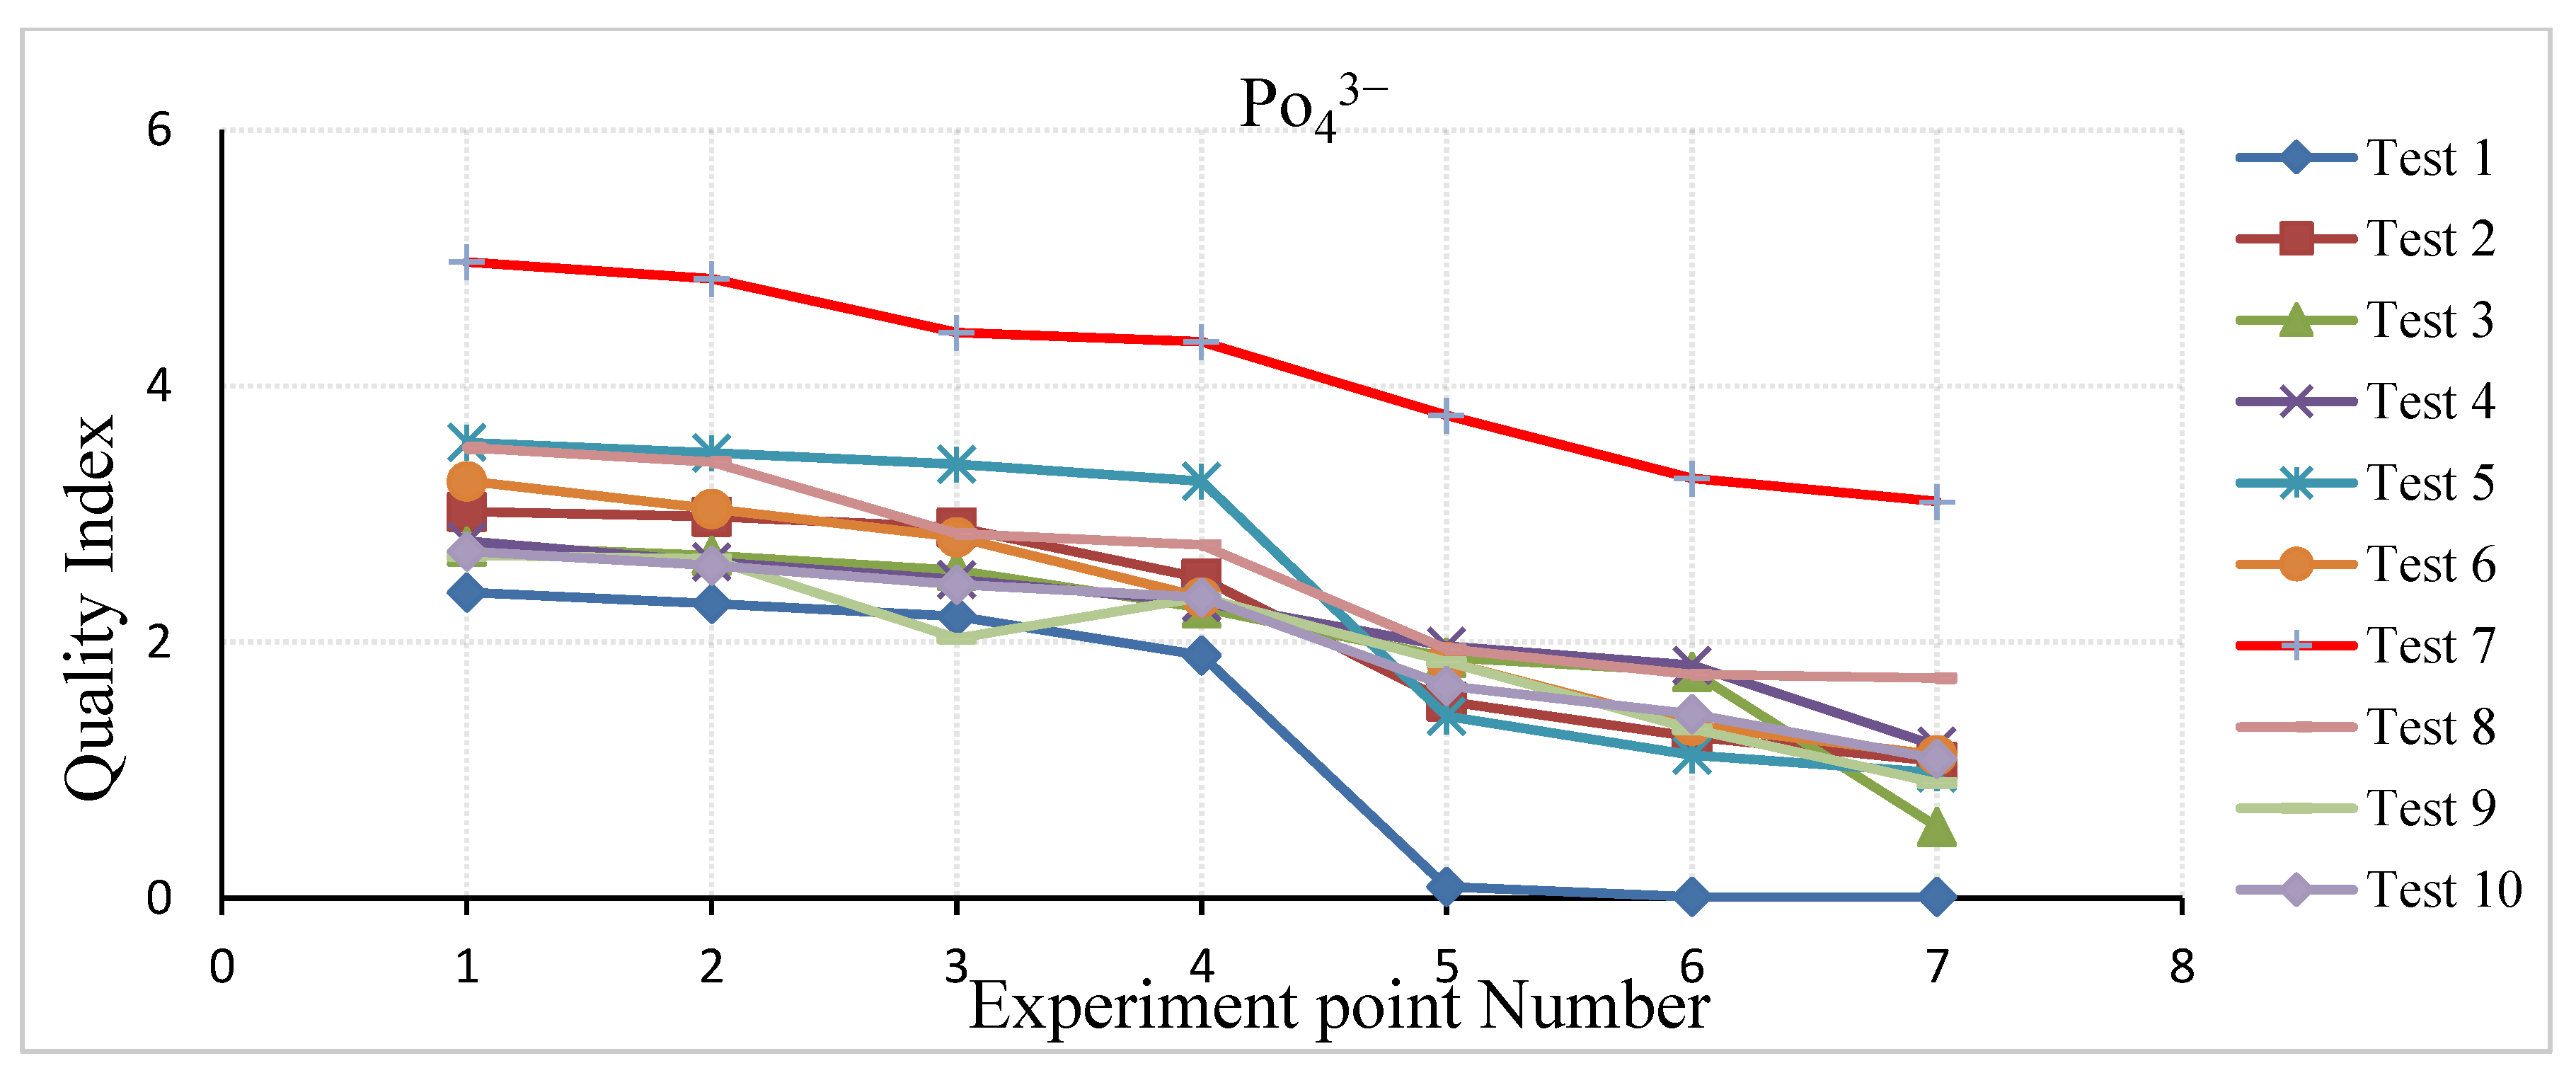
| PO42− (mg/L) | 0.085 |
| EC(µ Siemens/cm) | 0.129 |
| Total Hardness (mg/L CaCo3) | 0.103 |
| Fecal Coliform (MPN/100 mL) | 0.134 |
| The Amount of Index (IRWQIGC) | The Descriptive Equivalent of Water Quality |
|---|---|
| <15 | Very Poor |
| 15–29.9 | Poor |
| 30–44.9 | Fairly Poor |
| 45–55 | Medium |
| 55.1–70 | Fairly Good |
| 70.1–85 | Good |
| <85 | Excellent |
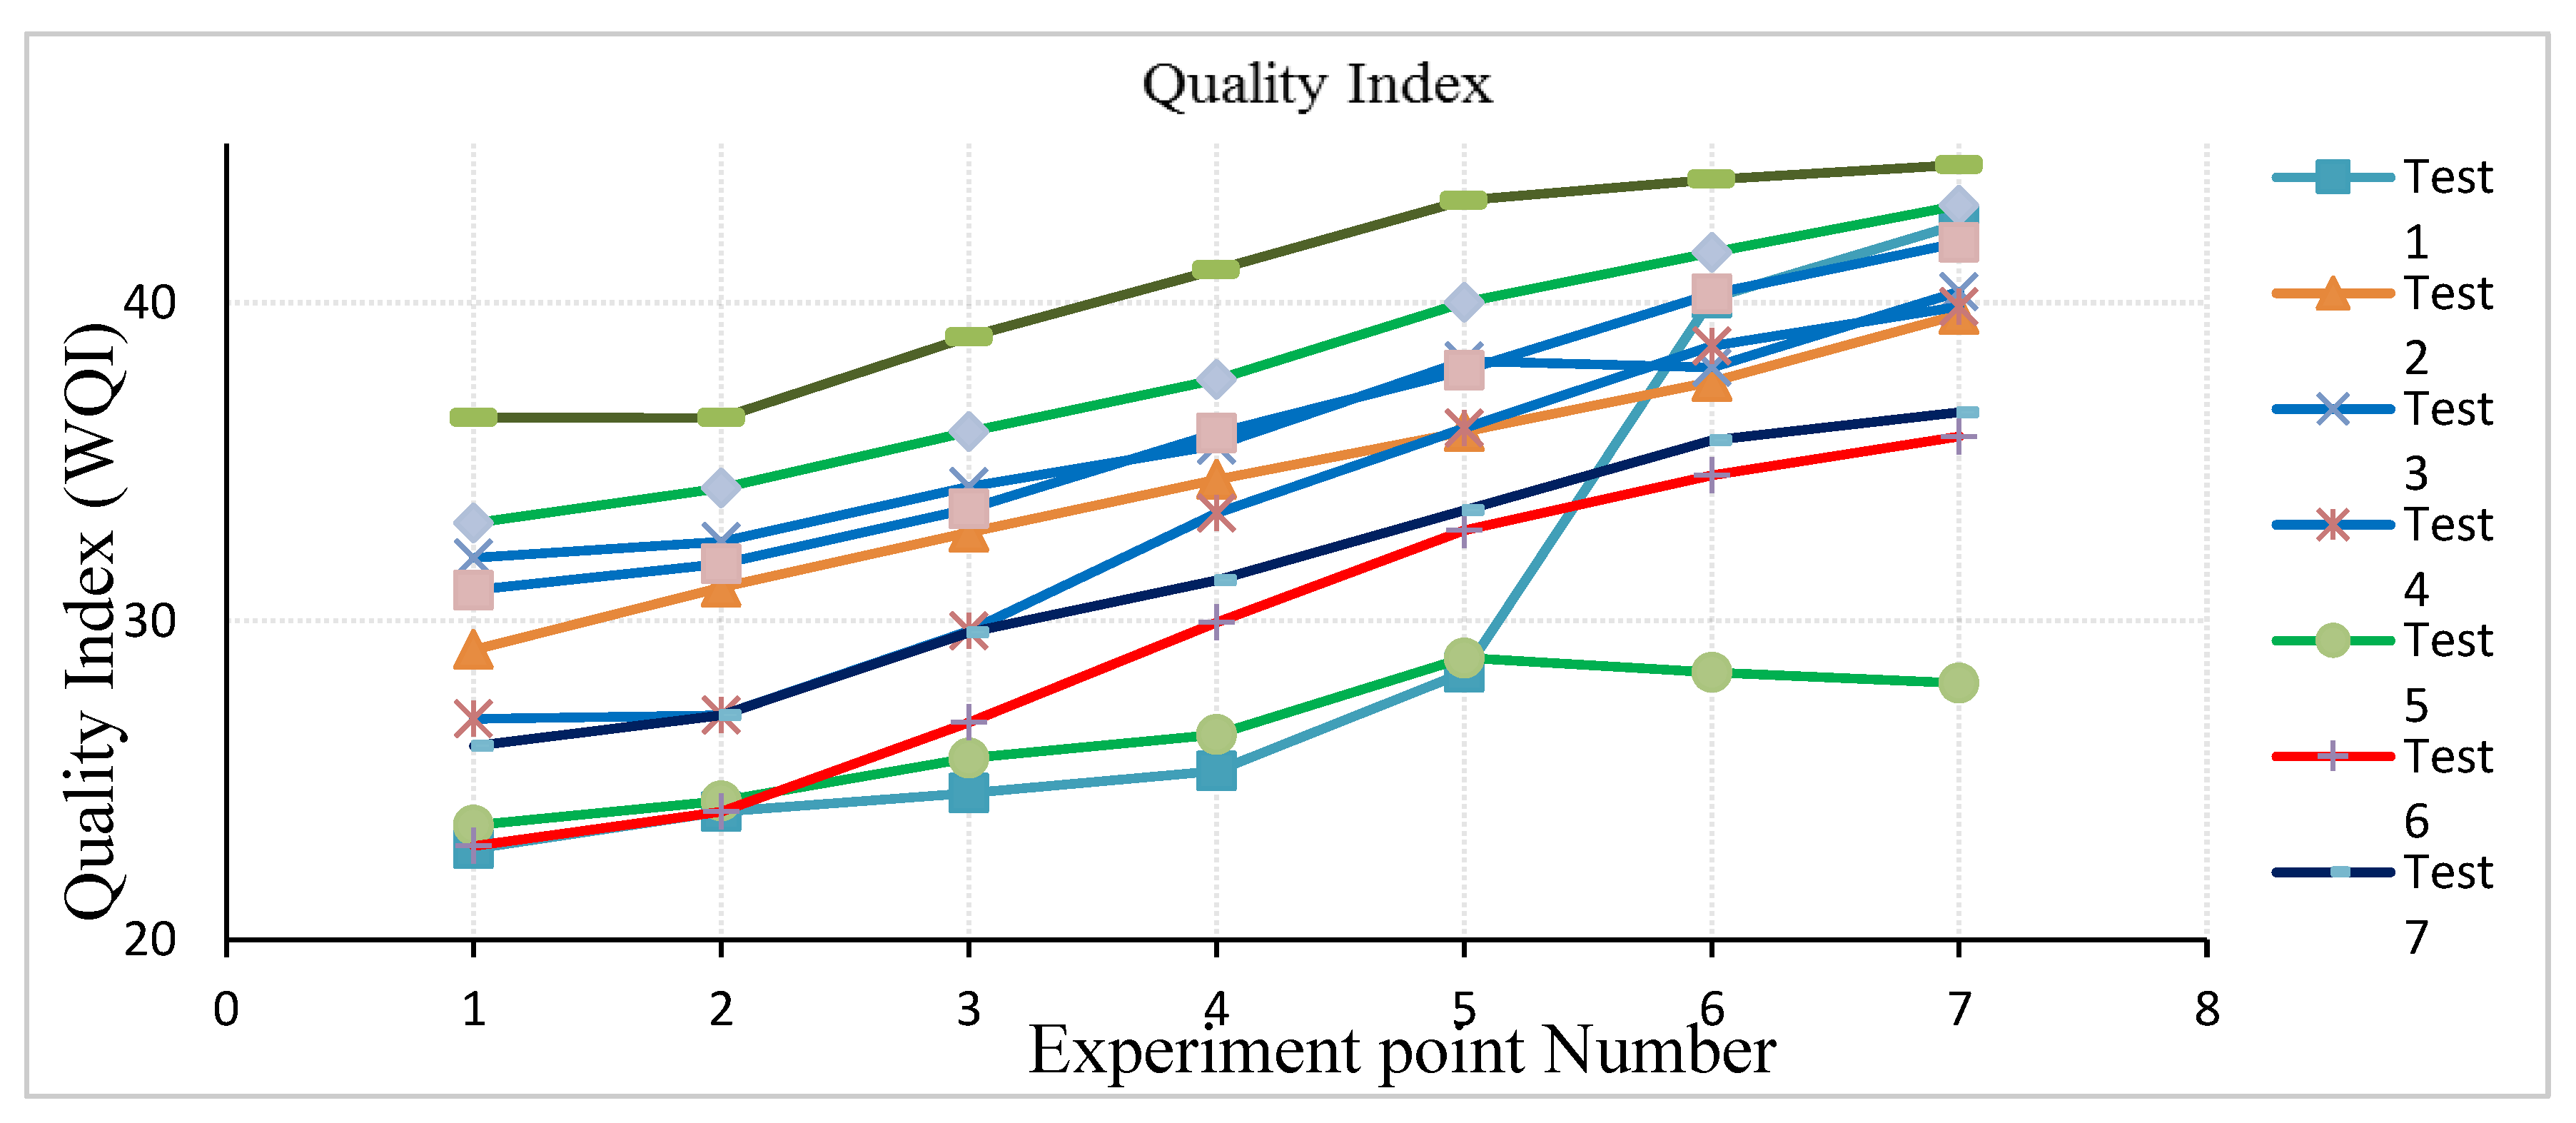
| IRWQI of the Test Samples | |||||||||||
|---|---|---|---|---|---|---|---|---|---|---|---|
| First Recharge Period (1st Wet Cycle) | Second Recharge Period (2nd Wet Cycle) | ||||||||||
| Descriptions | Points | Test1 | Test2 | Test3 | Test4 | Test5 | Test6 | Test7 | Test8 | Test9 | Test10 |
| Effluent | 1 | 22.85 | 29.1 | 31.99 | 26.93 | 23.59 | 22.94 | 26.08 | 36.39 | 33.08 | 30.98 |
| Filter Effects | 2 | 24.01 | 31.07 | 32.5 | 27.04 | 24.36 | 24.01 | 27.04 | 36.38 | 34.18 | 31.8 |
| Unsaturated Zone Effects in 0.5 m | 3 | 24.61 | 32.79 | 34.23 | 29.69 | 25.71 | 26.82 | 29.64 | 38.93 | 35.94 | 33.52 |
| Unsaturated Zone Effects in 1.5 m | 4 | 25.29 | 34.45 | 35.53 | 33.4 | 26.44 | 29.95 | 31.28 | 41.04 | 37.58 | 35.91 |
| Saturated Zone Effects in 1 m | 5 | 28.38 | 35.95 | 38.18 | 36.07 | 28.85 | 32.85 | 33.48 | 43.21 | 40.02 | 37.87 |
| Saturated Zone Effects in 5 m | 6 | 40.15 | 37.53 | 37.96 | 38.64 | 28.38 | 34.57 | 35.68 | 43.87 | 41.57 | 40.27 |
| Saturated Zone Effects in 20 m | 7 | 42.47 | 39.63 | 40.35 | 39.88 | 28.05 | 35.8 | 36.56 | 44.33 | 43.06 | 41.89 |
| Efficiency in First Recharge Period (1st Wet Cycle) | Efficiency in Second Recharge Period (2nd Wet Cycle) | Average | |||||||||
|---|---|---|---|---|---|---|---|---|---|---|---|
| Filter Efficiency | 1.36 | 2.32 | 0.6 | 0.13 | 0.91 | 1.26 | 1.13 | −0.01 * | 1.29 | 0.96 | 0.98 |
| Unsaturated Zone Efficiency | 1.51 | 3.98 | 3.56 | 7.48 | 2.45 | 6.99 | 4.99 | 5.48 | 4 | 4.84 | 4.53 |
| Saturated Zone Efficiency | 20.21 | 6.09 | 5.67 | 7.62 | 1.89 | 6.88 | 6.21 | 3.87 | 6.45 | 7.04 | 7.19 |
| Total Efficiency | 23.08 | 12.39 | 9.84 | 15.24 | 5.25 | 15.13 | 12.33 | 9.34 | 11.74 | 12.84 | 12.7 |
| Layers or Zones | Treatment Efficiency (%) | Average Treatment Efficiency (%) |
|---|---|---|
| Filter Effect | 0.13–2.32 | 0.98 |
| Unsaturated Zone Effect | 1.51–7.48 | 4.53 |
| Saturated Zone Effect | 1.89–20.21 | 7.19 |
| Total Layers Effects | 5.25–23.08 | 12.7 |
| Parameter Index | COD | BOD5 | SAR | TH | NO3− | PO43− | EC | Fecal Coliform |
|---|---|---|---|---|---|---|---|---|
| Range | 21.1–42.7 | 4.8–17.9 | 15.0–26.9 | 23.3–37.5 | 3.6–10.6 | 40.8–91.8 | 10.3–20.0 | 15.5–88.9 |
| Average | 36.3 | 10.6 | 19.7 | 31.5 | 6.9 | 55.4 | 14.2 | 48.0 |
Publisher’s Note: MDPI stays neutral with regard to jurisdictional claims in published maps and institutional affiliations. |
© 2022 by the authors. Licensee MDPI, Basel, Switzerland. This article is an open access article distributed under the terms and conditions of the Creative Commons Attribution (CC BY) license (https://creativecommons.org/licenses/by/4.0/).
Share and Cite
Tahmasbi, R.; Kholghi, M.; Najarchi, M.; Liaghat, A.; Mastouri, R. Post-Treatment of Reclaimed Municipal Wastewater through Unsaturated and Saturated Porous Media in a Large-Scale Experimental Model. Water 2022, 14, 1137. https://doi.org/10.3390/w14071137
Tahmasbi R, Kholghi M, Najarchi M, Liaghat A, Mastouri R. Post-Treatment of Reclaimed Municipal Wastewater through Unsaturated and Saturated Porous Media in a Large-Scale Experimental Model. Water. 2022; 14(7):1137. https://doi.org/10.3390/w14071137
Chicago/Turabian StyleTahmasbi, Reza, Majid Kholghi, Mohsen Najarchi, Abdolmajeed Liaghat, and Reza Mastouri. 2022. "Post-Treatment of Reclaimed Municipal Wastewater through Unsaturated and Saturated Porous Media in a Large-Scale Experimental Model" Water 14, no. 7: 1137. https://doi.org/10.3390/w14071137
APA StyleTahmasbi, R., Kholghi, M., Najarchi, M., Liaghat, A., & Mastouri, R. (2022). Post-Treatment of Reclaimed Municipal Wastewater through Unsaturated and Saturated Porous Media in a Large-Scale Experimental Model. Water, 14(7), 1137. https://doi.org/10.3390/w14071137