
Assessment of an Alternative Climate Product for Hydrological Modeling: A Case Study of the Danjiang River Basin, China

 ,
, 
 and
and
Abstract
:1. Introduction
2. Materials and Methods
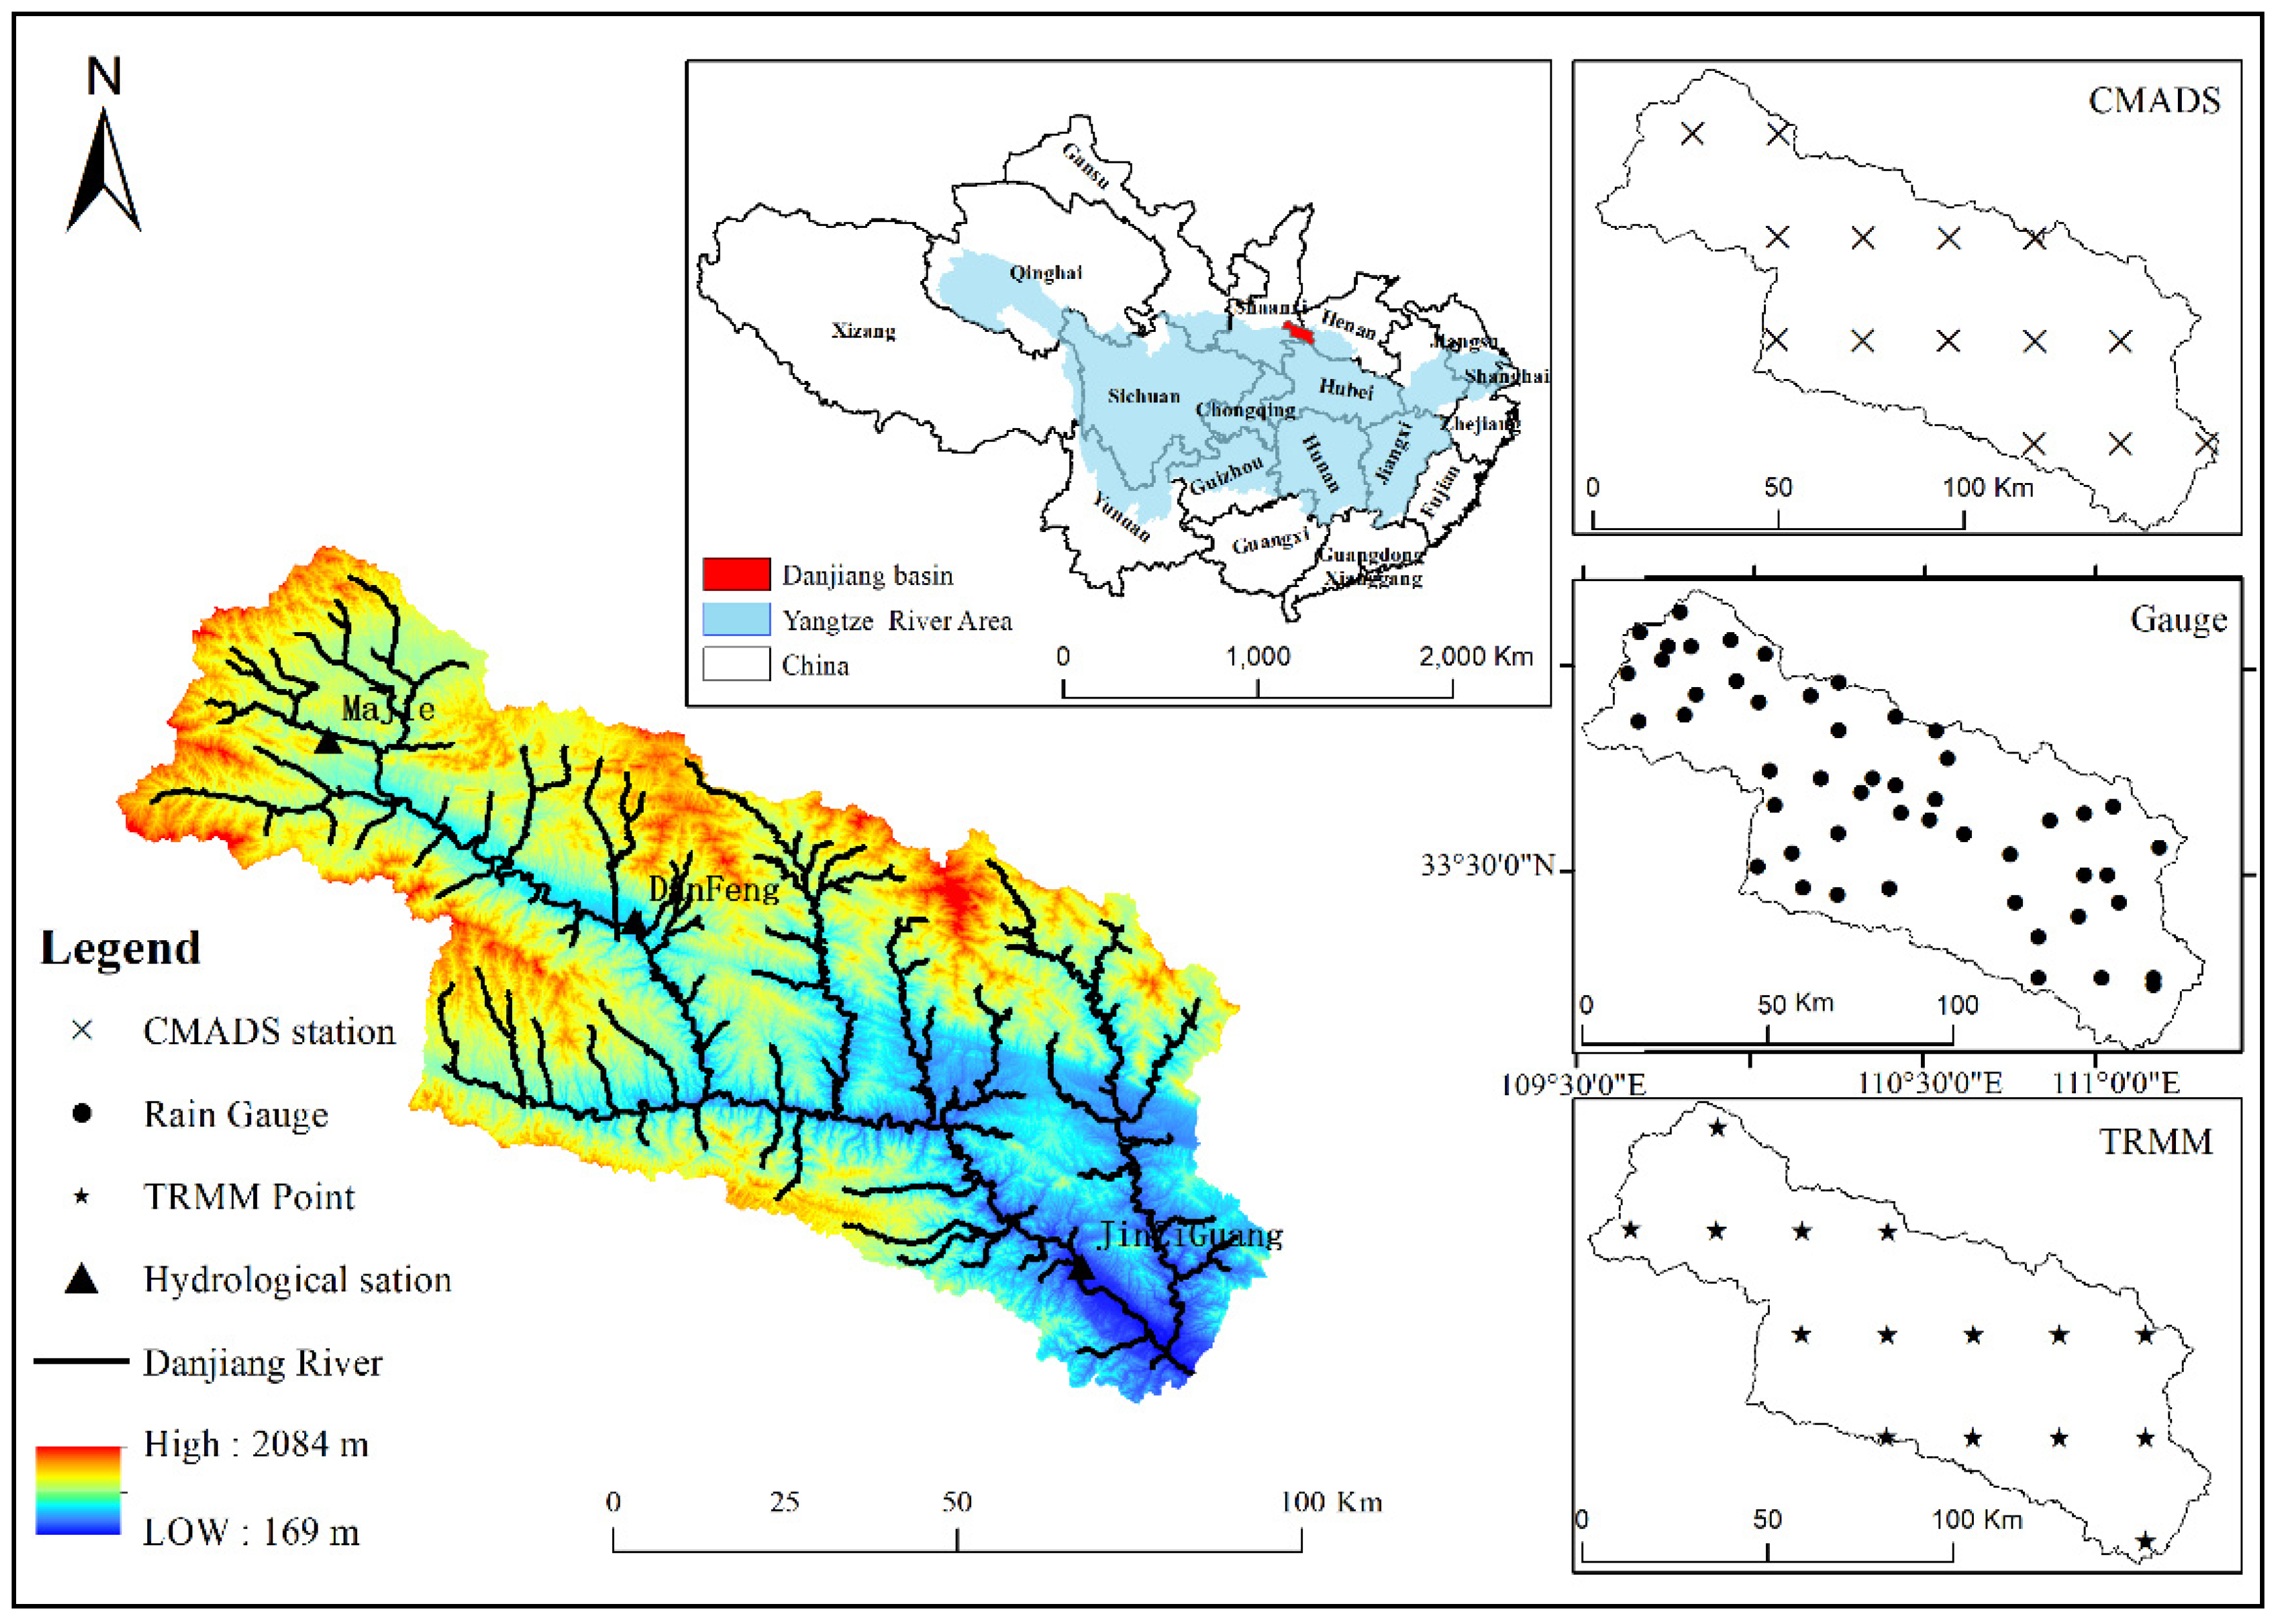
2.1. Study Area
2.2. Hydrological Model and Data Sources
2.3. Model Calibration and Evaluation
3. Results
3.1. Evaluation of the Three Precipitation Products
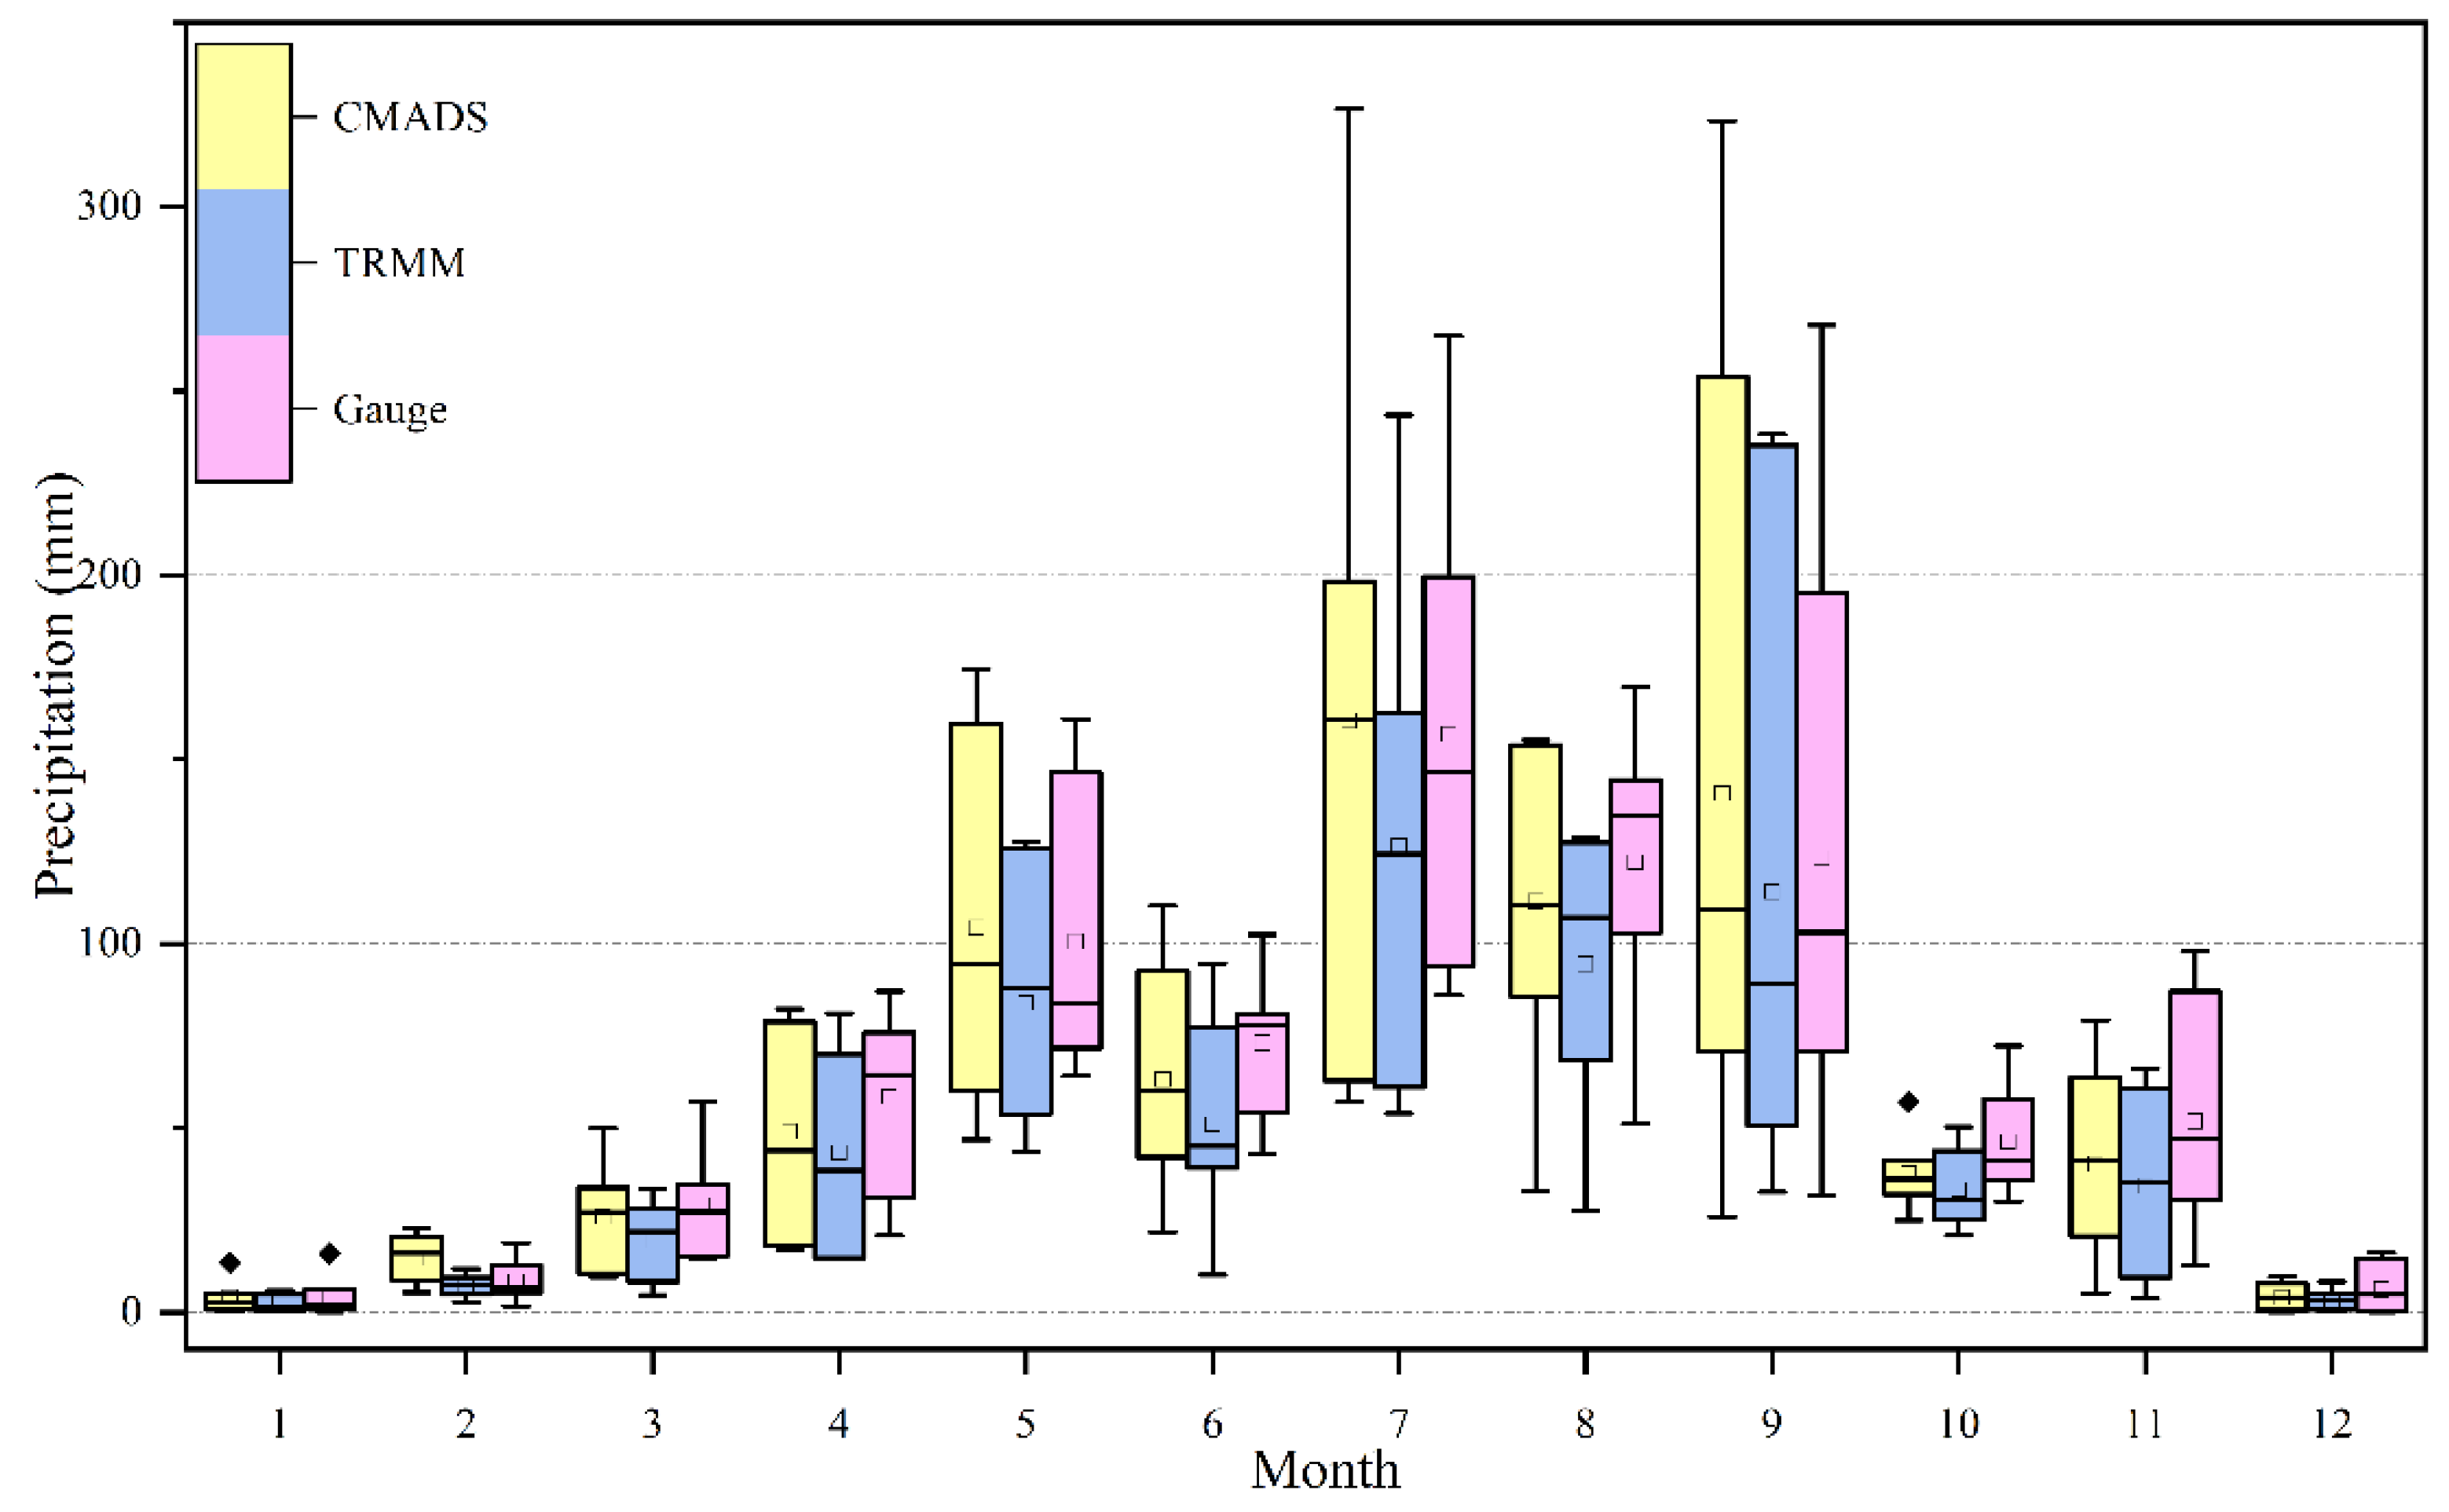
3.1.1. Monthly Scale
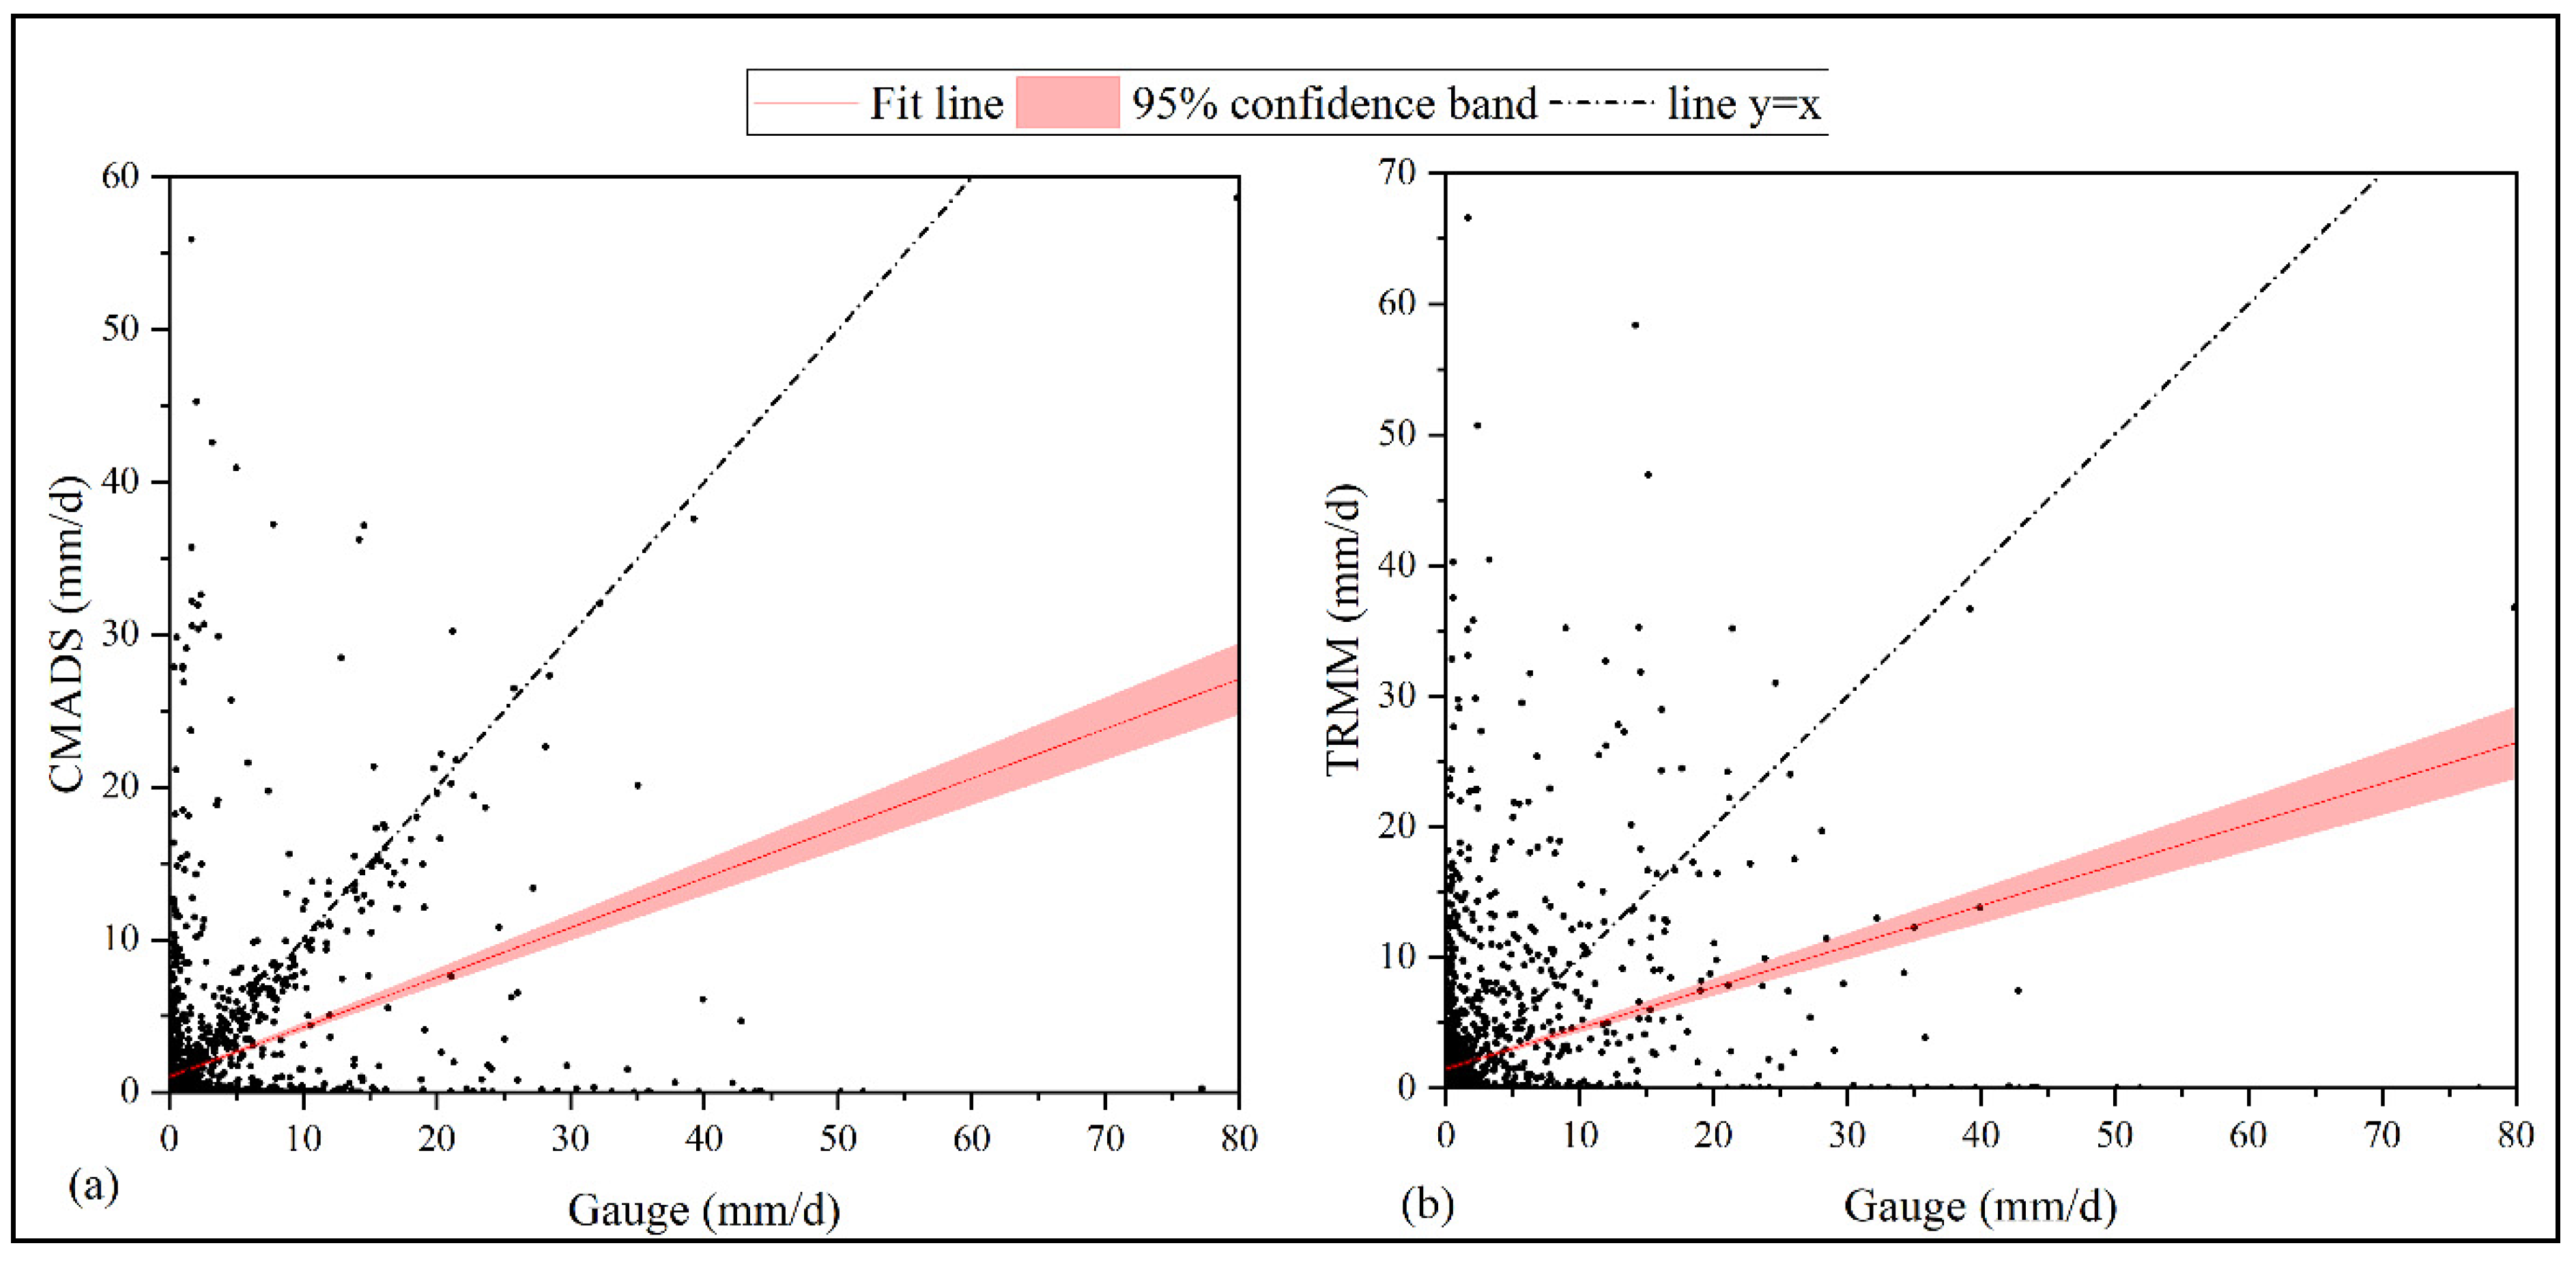
3.1.2. Daily Scale
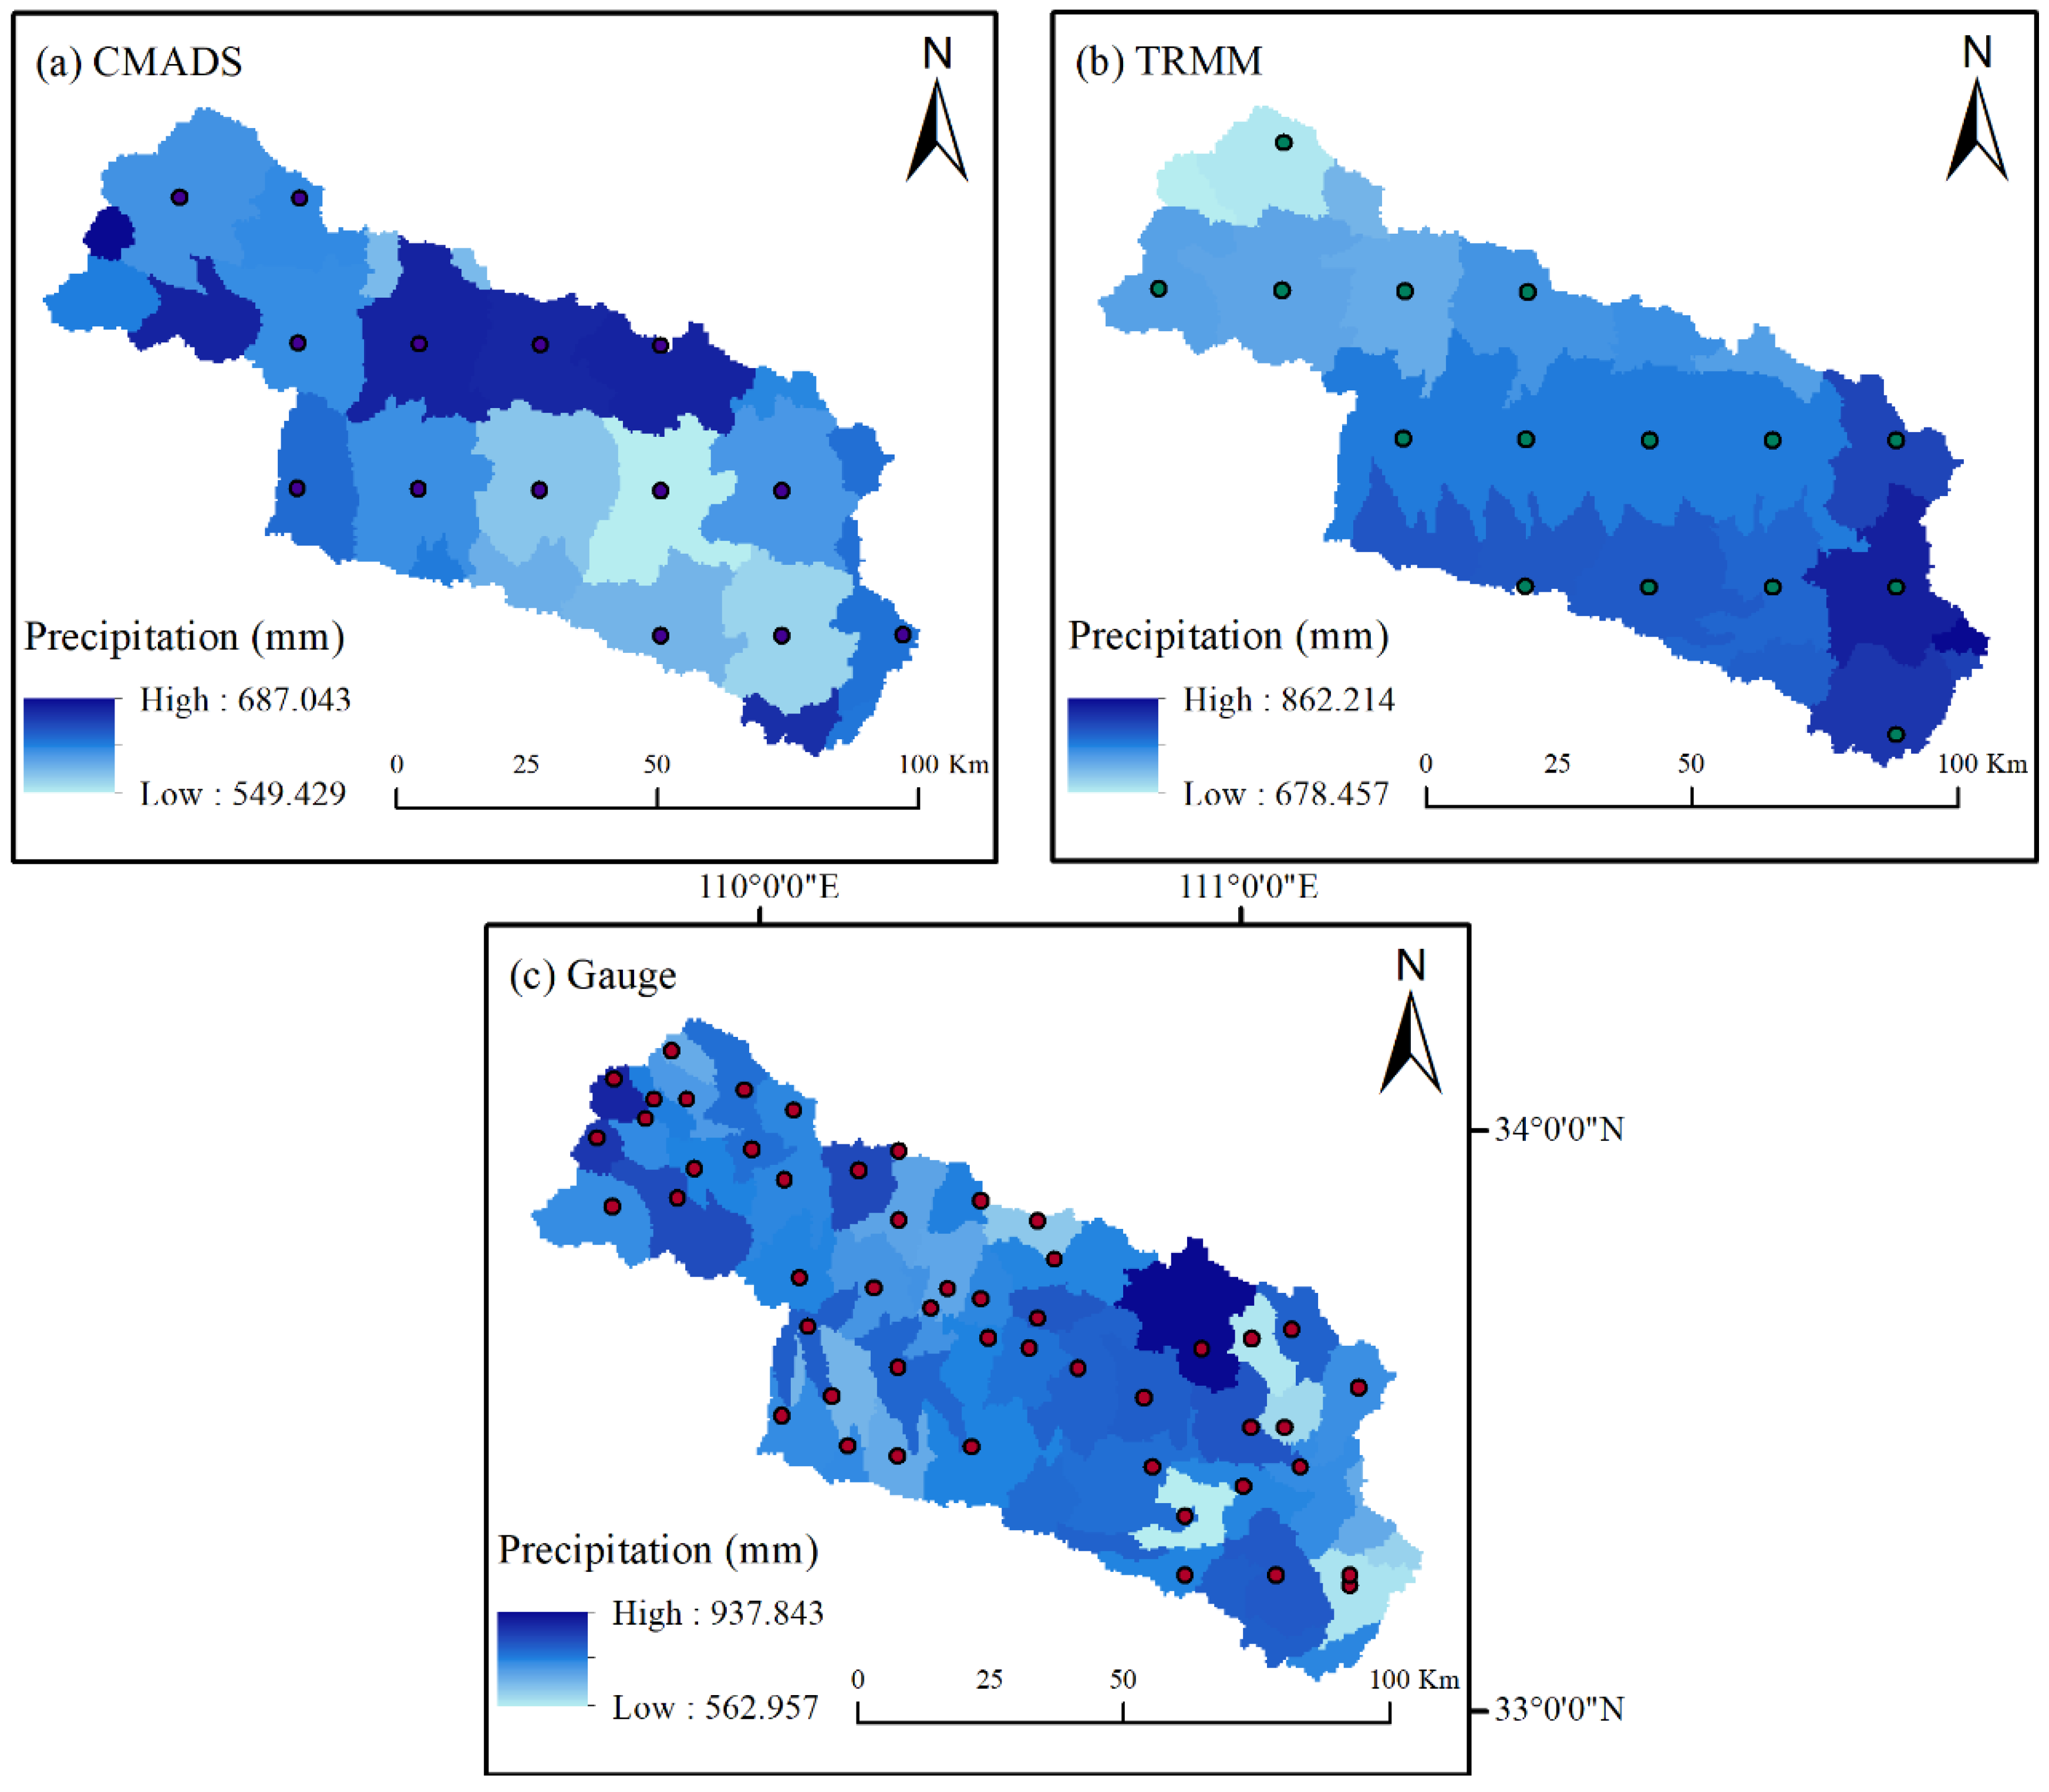
3.1.3. Spatial Scale
3.2. The Performance of Different Precipitation Products in Simulating Runoff
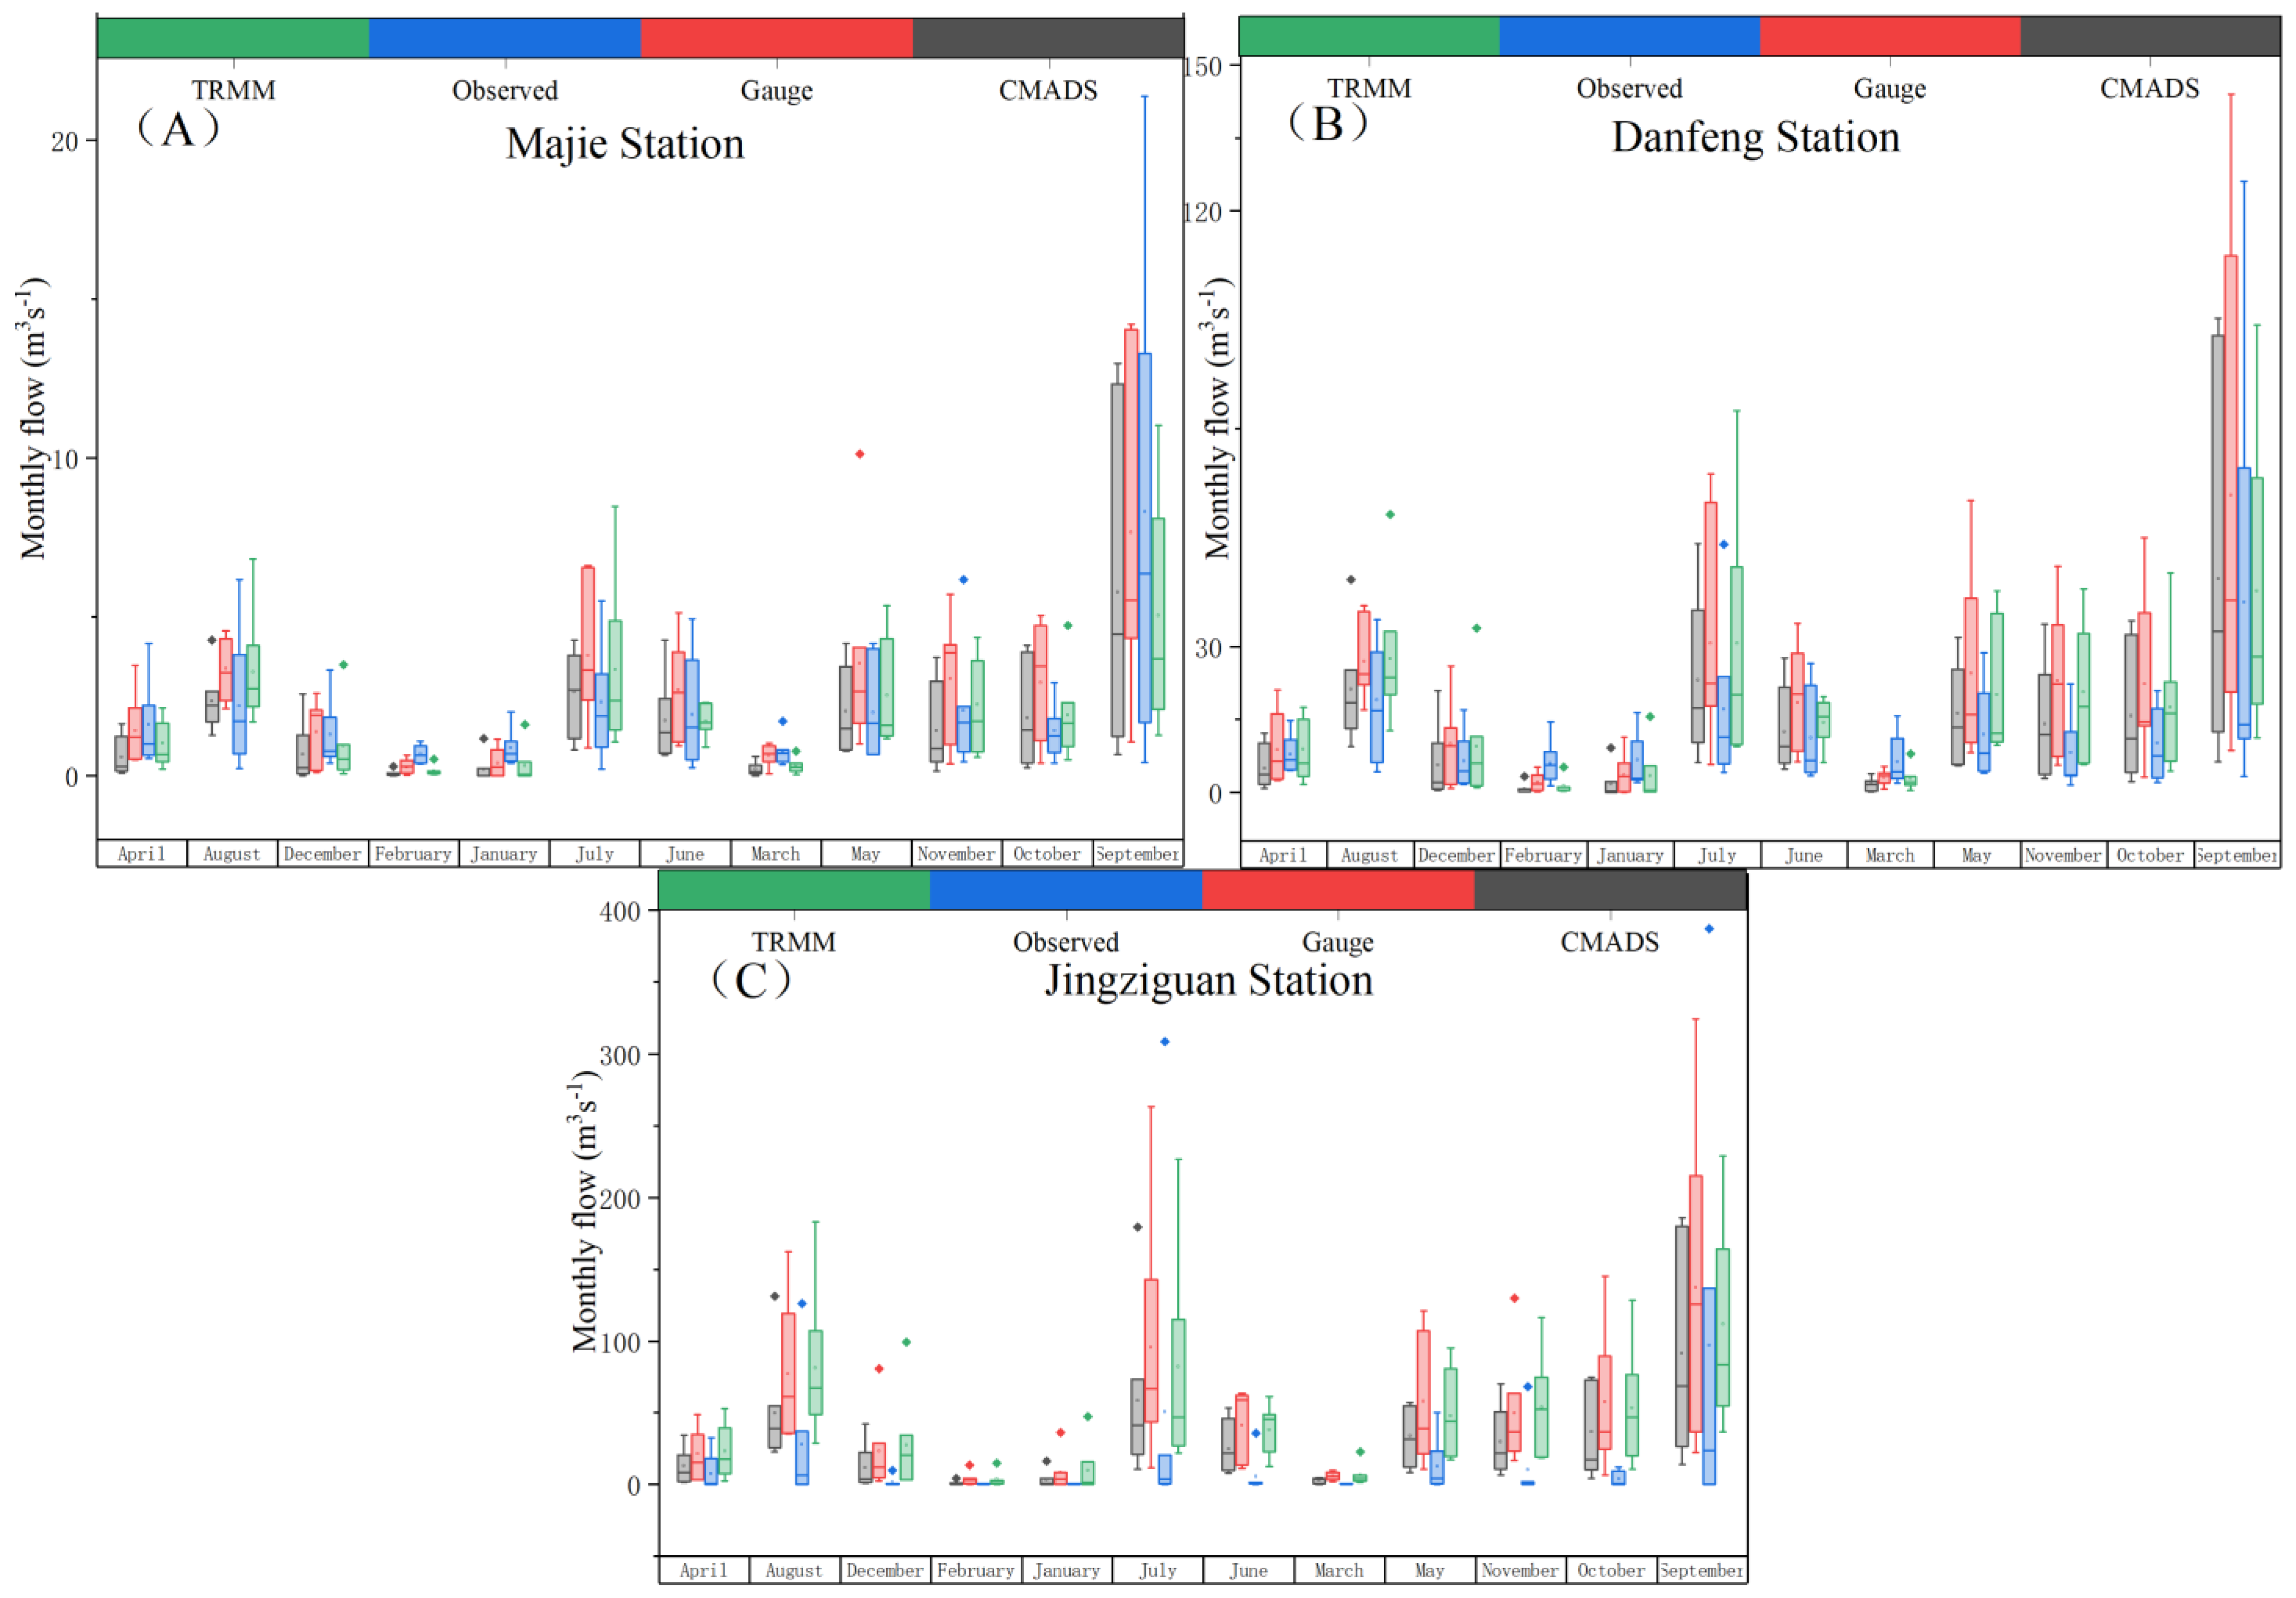
3.2.1. Pre-Calibration Model Results
3.2.2. Post-Calibration Model Results
4. Discussion
5. Conclusions
- (1)
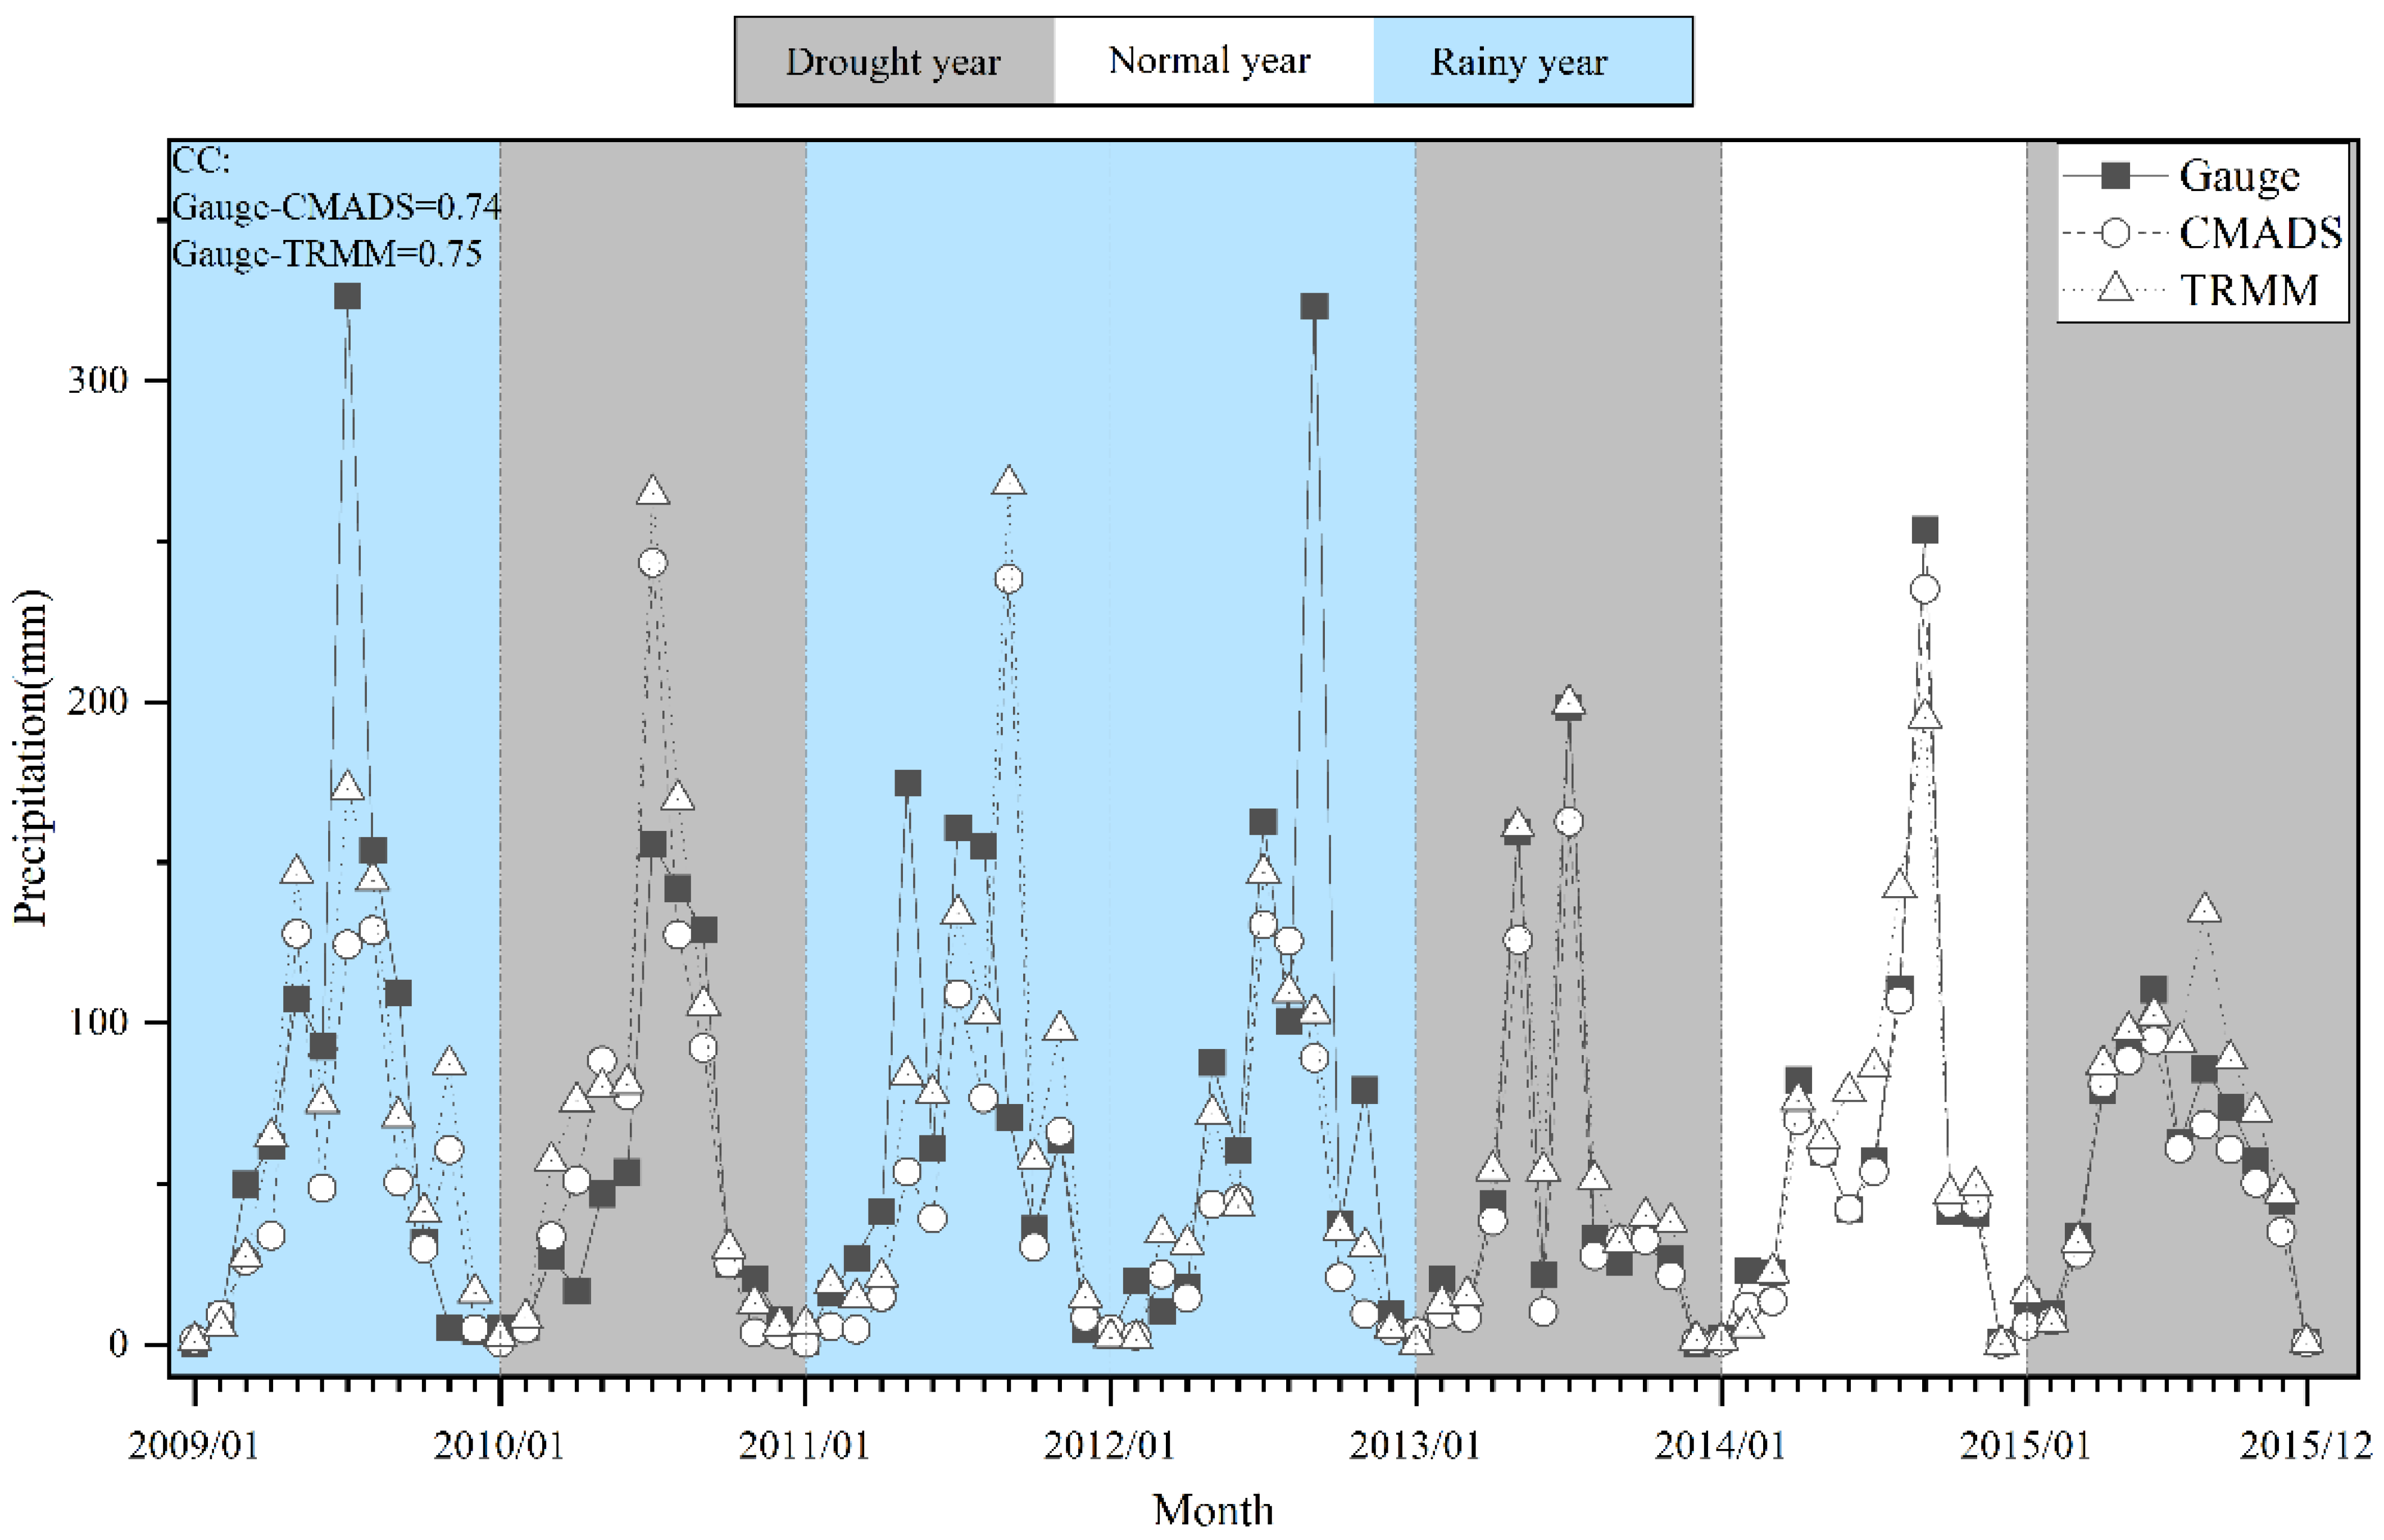
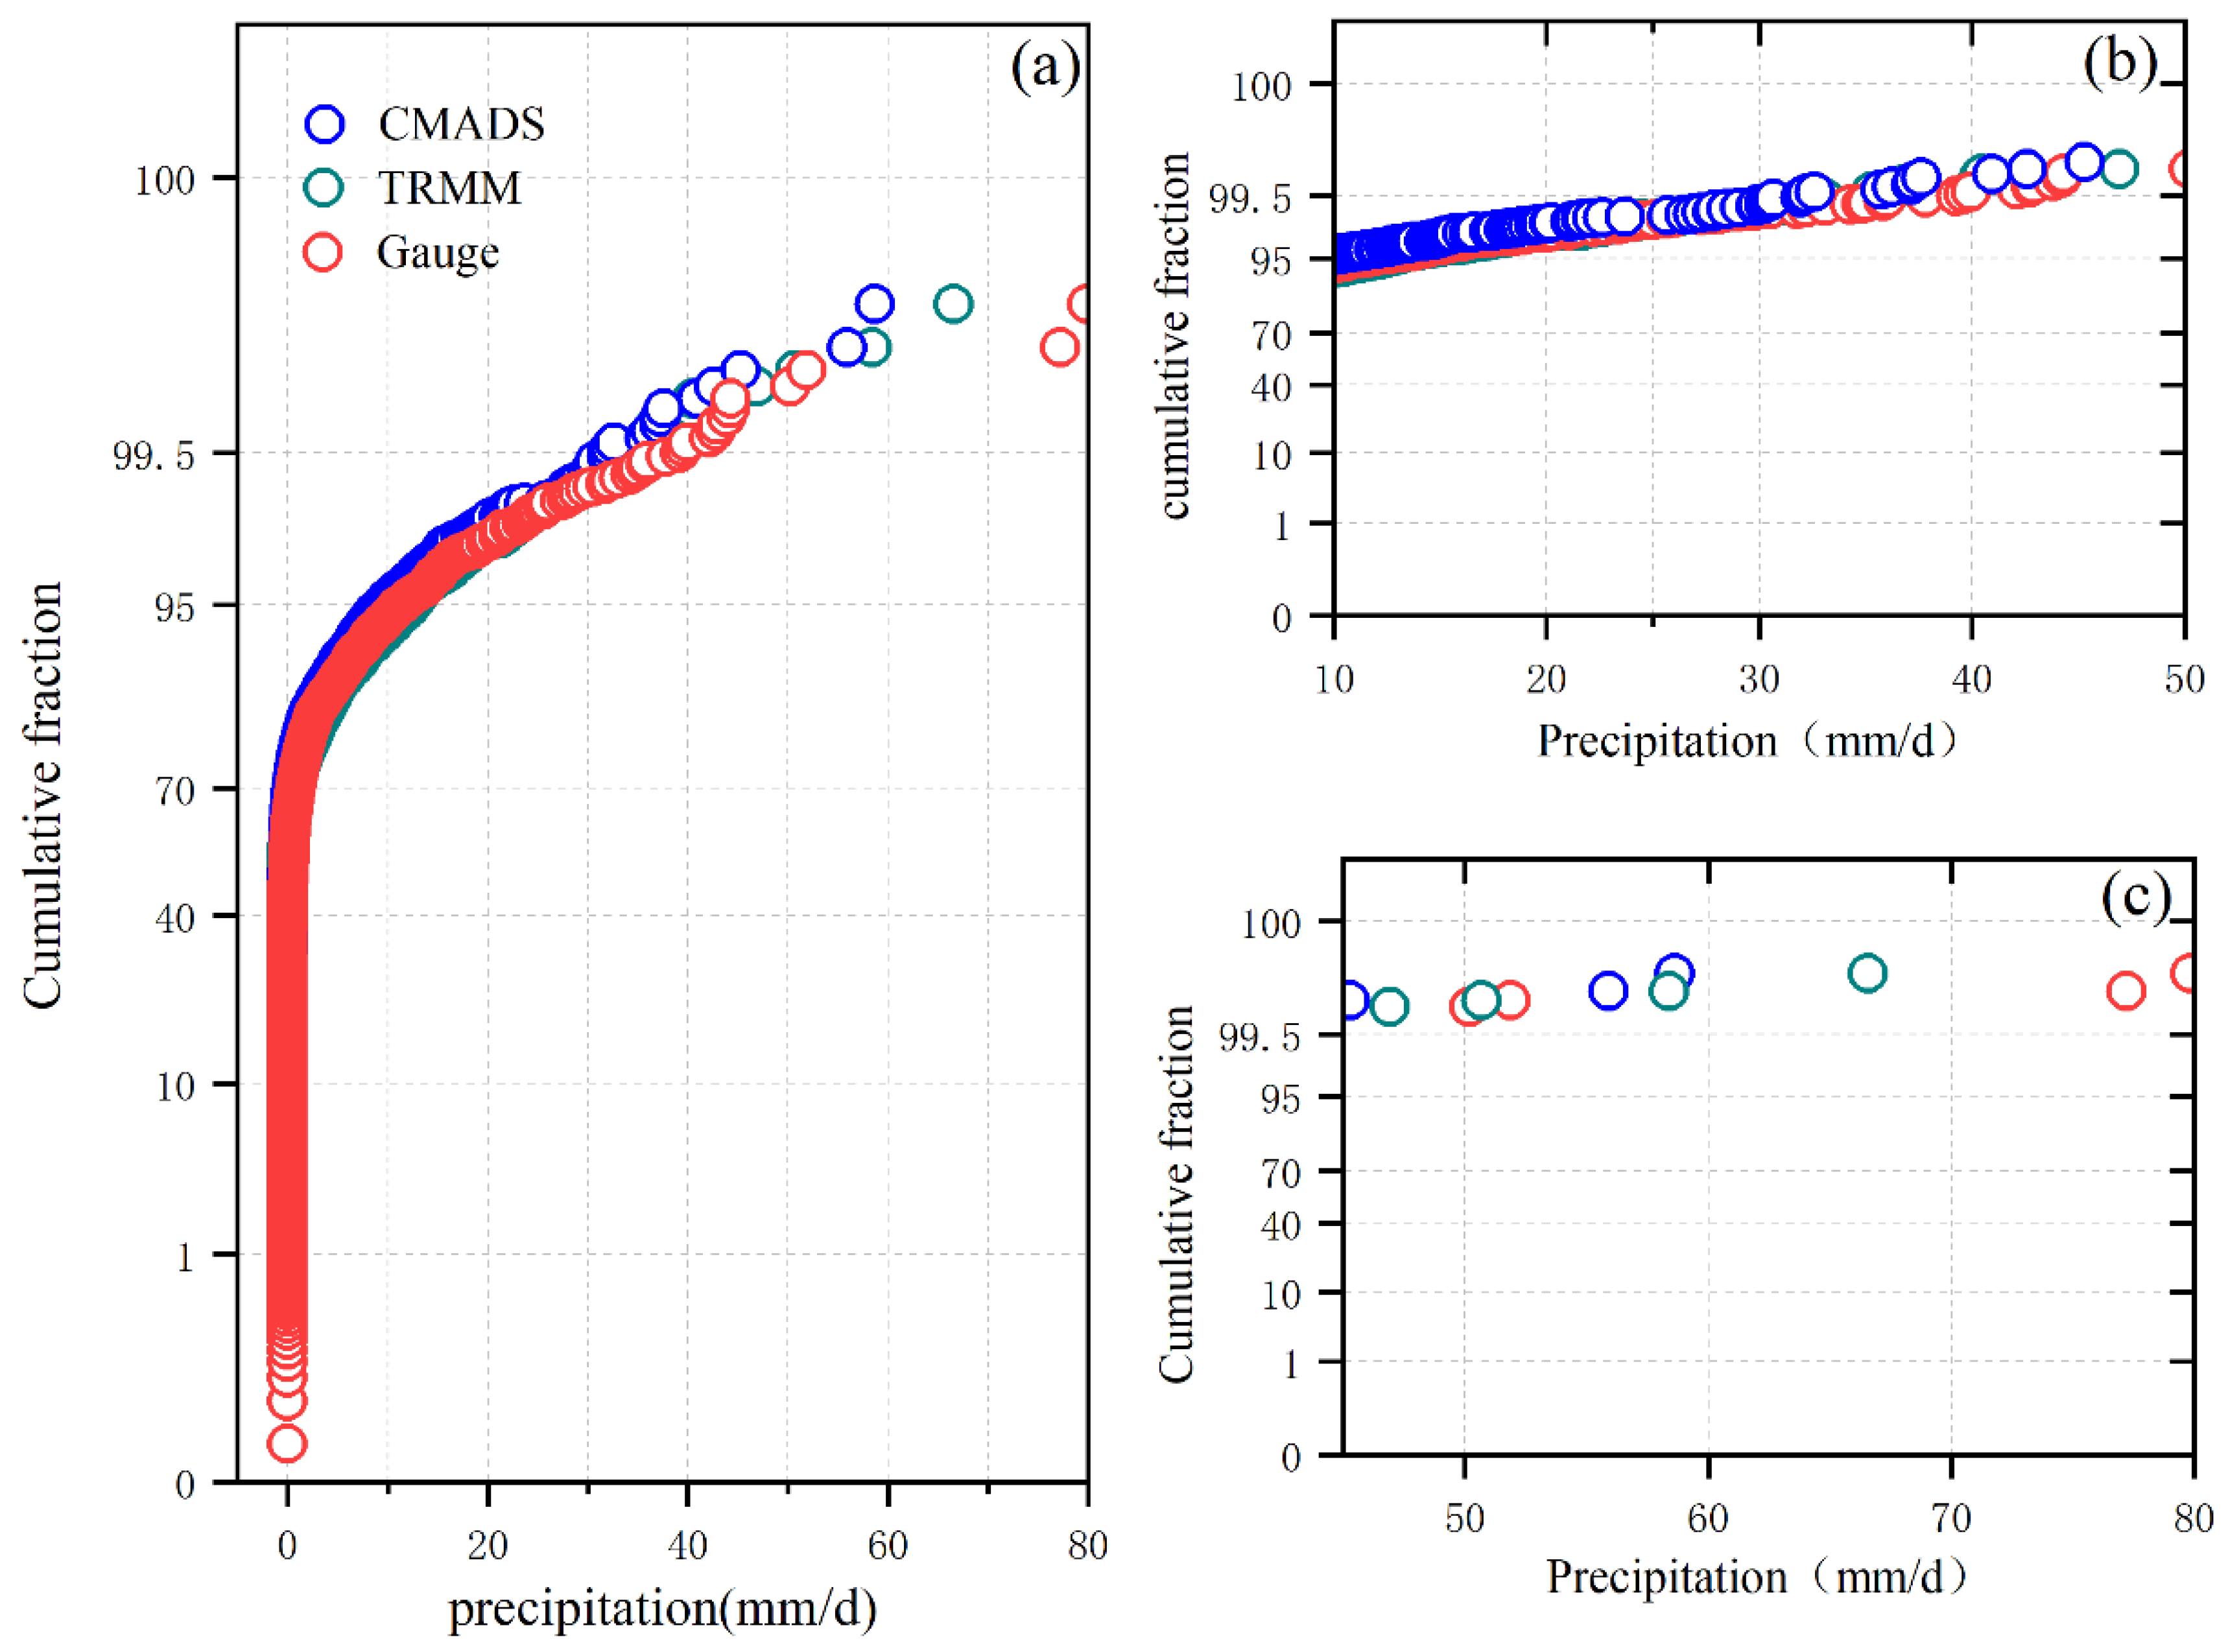
- On the monthly scale, the precipitation measurements of CMADS and TRMM are similar to the rain gauge data. However, the rainfall data derived from TRMM and CMADS have a different pattern from the precipitation of Gauge at the daily scale. Both TRMM and CMADS underestimate the precipitation, especially TRMM data. Moreover, the ability of CMADS and TRMM to simulate extreme precipitation (e.g., torrential rain) is worse than that of Gauge. The CMADS and TRMM data are also different from the Gauge data on the spatial scale. The rainfall data derived from CMADS tend to increase from the middle to the surroundings and the rainfall data derived from TRMM tend to decrease from upstream to downstream, while the precipitation of Gauge has no clear pattern.
- (2)
- The performance of CMADS-SWAT and TRMM-SWAT is consistent with the observed data from upstream to downstream at a monthly scale, while they both underestimate the runoff. However, Gauge-SWAT only performs satisfactorily in the upstream and its performance in the midstream and downstream is unsatisfactory. The ability of Gauge-SWAT to simulate extreme floods is poor, and the runoff is underestimated by Guage-SWAT as well. However, only CMADS-SWAT performs satisfactorily in the whole basin at a daily scale, while both TRMM-SWAT and Gauge-SWAT performed unsatisfactorily in the middle and lower reaches. CMADS-SWAT, TRMM-SWAT, and Gauge-SWAT have all underestimated the runoff at a daily scale.
- (3)
- Among the three precipitation products, the performance of CMADS-SWAT is the best, followed by TRMM-SWAT. Gauge-SWAT had the worst performance, whether on the monthly scale or the daily scale.
Author Contributions
Funding
Institutional Review Board Statement
Informed Consent Statement
Data Availability Statement
Acknowledgments
Conflicts of Interest
References
- Lobligeois, F.; Andréassian, V.; Perrin, C.; Tabary, P.; Loumagne, C. When does higher spatial resolution rainfall information improve streamflow simulation: An evaluation using 3620 flood events. Hydrol. Earth Syst. Sci. 2014, 18, 575–594. [Google Scholar] [CrossRef] [Green Version]
- Galván, L.; Olías, M.; Izquierdo, T.; Cerón, J.C.; Fernández de Villarán, R. Rainfall estimation in SWAT: An alternative method to simulate orographic precipitation. J. Hydrol. 2014, 509, 257–265. [Google Scholar] [CrossRef]
- Roth, V.; Lemann, T. Comparing CFSR and conventional weather data for discharge and sediment loss modelling with SWAT in small catchments in the Ethiopian Highlands. Hydrol. Earth Syst. Sci. Discuss. 2015, 12, 2113–2153. [Google Scholar] [CrossRef]
- Cornelissen, T.; Diekkrüger, B.; Bogena, H.R. Using high-resolution data to test parameter sensitivity of the distributed hydrological model HydroGeoSphere. Water 2016, 8, 202. [Google Scholar] [CrossRef] [Green Version]
- Mileham, L.; Taylor, R.; Thompson, J.; Todd, M.; Tindimugaya, C. Impact of rainfall distribution on the parameterisation of a soil-moisture balance model of groundwater recharge in equatorial Africa. J. Hydrol. 2008, 359, 46–58. [Google Scholar] [CrossRef]
- Remesan, R.; Holman, I.P. Effect of baseline meteorological data selection on hydrological modelling of climate change scenarios. J. Hydrol. 2015, 528, 631–642. [Google Scholar] [CrossRef] [Green Version]
- Bohnenstengel, S.I.; Schlünzen, K.H.; Beyrich, F. Representativity of in situ precipitation measurements – A case study for the LITFASS area in North-Eastern Germany. J. Hydrol. 2011, 400, 387–395. [Google Scholar] [CrossRef]
- Liu, J.; Kummerow, C.D.; Elsaesser, G.S. Identifying and analysing uncertainty structures in the TRMM microwave imager precipitation product over tropical ocean basins. Int. J. Remote Sens. 2016, 38, 23–42. [Google Scholar] [CrossRef]
- Zhu, H.; Li, Y.; Liu, Z.; Shi, X.; Fu, B.; Xing, Z. Using SWAT to simulate streamflow in Huifa River basin with ground and Fengyun precipitation data. J. Hydroinf. 2015, 17, 834–844. [Google Scholar] [CrossRef] [Green Version]
- Musie, M.; Sen, S.; Srivastava, P. Comparison and evaluation of gridded precipitation datasets for streamflow simulation in data scarce watersheds of Ethiopia. J. Hydrol. 2019, 579, 124168. [Google Scholar] [CrossRef]
- Belete, M.; Deng, J.; Wang, K.; Zhou, M.; Zhu, E.; Shifaw, E.; Bayissa, Y. Evaluation of satellite rainfall products for modeling water yield over the source region of Blue Nile Basin. Sci. Total Environ. 2020, 708, 134834. [Google Scholar] [CrossRef] [PubMed]
- Oreggioni Weiberlen, F.; Báez Benítez, J. Assessment of satellite-based precipitation estimates over Paraguay. Acta Geophys. 2018, 66, 369–379. [Google Scholar] [CrossRef]
- Duan, Z.; Liu, J.; Tuo, Y.; Chiogna, G.; Disse, M. Evaluation of eight high spatial resolution gridded precipitation products in Adige Basin (Italy) at multiple temporal and spatial scales. Sci. Total Environ. 2016, 573, 1536–1553. [Google Scholar] [CrossRef] [Green Version]
- Luo, X.; Wu, W.; He, D.; Li, Y.; Ji, X. Hydrological Simulation Using TRMM and CHIRPS Precipitation Estimates in the Lower Lancang-Mekong River Basin. Chinese Geogr. Sci. 2019, 29, 13–25. [Google Scholar] [CrossRef] [Green Version]
- Cecinati, F.; Moreno-Ródenas, A.M.; Rico-Ramirez, M.A.; ten Veldhuis, M.C.; Langeveld, J.G. Considering Rain Gauge Uncertainty Using Kriging for Uncertain Data. Atmosphere 2018, 9, 446. [Google Scholar] [CrossRef] [Green Version]
- Peleg, N.; Ben-Asher, M.; Morin, E. Radar subpixel-scale rainfall variability and uncertainty: Lessons learned from observations of a dense rain-gauge network. Hydrol. Earth Syst. Sci. 2013, 17, 2195–2208. [Google Scholar] [CrossRef] [Green Version]
- Hwang, Y.; Clark, M.P.; Rajagopalan, B. Use of daily precipitation uncertainties in streamflow simulation and forecast. Stoch. Environ. Res. Risk Assess. 2011, 25, 957–972. [Google Scholar] [CrossRef]
- Alijanian, M.; Rakhshandehroo, G.R.; Mishra, A.K.; Dehghani, M. Evaluation of satellite rainfall climatology using CMORPH, PERSIANN-CDR, PERSIANN, TRMM, MSWEP over Iran. Int. J. Climatol. 2017, 37, 4896–4914. [Google Scholar] [CrossRef]
- Sun, Q.; Miao, C.; Duan, Q.; Ashouri, H.; Sorooshian, S.; Hsu, K.L. A Review of Global Precipitation Data Sets: Data Sources, Estimation, and Intercomparisons. Rev. Geophys. 2018, 56, 79–107. [Google Scholar] [CrossRef] [Green Version]
- Hur, J.; Raghavan, S.V.; Nguyen, N.S.; Liong, S.Y. Evaluation of High-resolution Satellite Rainfall Data over Singapore. Procedia Eng. 2016, 154, 158–167. [Google Scholar] [CrossRef] [Green Version]
- Jiang, S.; Ren, L.; Hong, Y.; Yang, X.; Ma, M.; Zhang, Y.; Yuan, F. Improvement of Multi-Satellite Real-Time Precipitation Products for Ensemble Streamflow Simulation in a Middle Latitude Basin in South China. Water Resour. Manag. 2014, 28, 2259–2278. [Google Scholar] [CrossRef]
- Duncan, J.M.A.; Biggs, E.M. Assessing the accuracy and applied use of satellite-derived precipitation estimates over Nepal. Appl. Geogr. 2012, 34, 626–638. [Google Scholar] [CrossRef]
- Yan, R.; Gao, J.; Huang, J. WALRUS-paddy model for simulating the hydrological processes of lowland polders with paddy fields and pumping stations. Agric. Water Manag. 2016, 169, 148–161. [Google Scholar] [CrossRef]
- Gokhan Yilmaz, A.; Alam Imteaz, M.; Ogwuda, O. Accuracy of HEC-HMS and LBRM Models in Simulating Snow Runoffs in Upper Euphrates Basin. J. Hydrol. Eng. 2011, 17, 342–347. [Google Scholar] [CrossRef]
- Wu, J.; Chen, X.; Yu, Z.; Yao, H.; Li, W.; Zhang, D. Assessing the impact of human regulations on hydrological drought development and recovery based on a ‘simulated-observed’ comparison of the SWAT model. J. Hydrol. 2019, 577, 123990. [Google Scholar] [CrossRef]
- Bhuiyan, M.A.E.; Nikolopoulos, E.I.; Anagnostou, E.N.; Polcher, J.; Albergel, C.; Dutra, E.; Fink, G.; Martínez-De La Torre, A.; Munier, S. Assessment of precipitation error propagation in multi-model global water resource reanalysis. Hydrol. Earth Syst. Sci. 2019, 23, 1973–1994. [Google Scholar] [CrossRef] [Green Version]
- Solakian, J.; Maggioni, V.; Lodhi, A.; Godrej, A. Investigating the use of satellite-based precipitation products for monitoring water quality in the Occoquan Watershed. J. Hydrol. Reg. Stud. 2019, 26, 100630. [Google Scholar] [CrossRef]
- Price, K.; Purucker, S.T.; Kraemer, S.R.; Babendreier, J.E.; Knightes, C.D. Comparison of radar and gauge precipitation data in watershed models across varying spatial and temporal scales. Hydrol. Process. 2014, 28, 3505–3520. [Google Scholar] [CrossRef]
- Wang, H.; Sun, F.; Xia, J.; Liu, W. Impact of LUCC on streamflow based on the SWAT model over the Wei River basin on the Loess Plateau in China. Hydrol. Earth Syst. Sci. 2017, 21, 1929–1945. [Google Scholar] [CrossRef] [Green Version]
- Qiu, J.; Yang, Q.; Zhang, X.; Huang, M.; Adam, J.C.; Malek, K. Implications of water management representations for watershed hydrologic modeling in the Yakima River basin. Hydrol. Earth Syst. Sci. 2019, 23, 35–49. [Google Scholar] [CrossRef] [Green Version]
- Li, D.; Christakos, G.; Ding, X.; Wu, J. Adequacy of TRMM satellite rainfall data in driving the SWAT modeling of Tiaoxi catchment (Taihu lake basin, China). J. Hydrol. 2018, 556, 1139–1152. [Google Scholar] [CrossRef]
- Huang, Y.; Bárdossy, A.; Zhang, K. Sensitivity of hydrological models to temporal and spatial resolutions of rainfall data. Hydrol. Earth Syst. Sci. 2019, 23, 2647–2663. [Google Scholar] [CrossRef] [Green Version]
- Dhanesh, Y.; Bindhu, V.M.; Senent-Aparicio, J.; Brighenti, T.M.; Ayana, E.; Smitha, P.S.; Fei, C.; Srinivasan, R. A Comparative Evaluation of the Performance of CHIRPS and CFSR Data for Different Climate Zones Using the SWAT Model. Remote Sens. 2020, 12, 3088. [Google Scholar] [CrossRef]
- Al-Falahi, A.H.; Saddique, N.; Spank, U.; Gebrechorkos, S.H.; Bernhofer, C. Evaluation the performance of several gridded precipitation products over the highland region of yemen for water resources management. Remote Sens. 2020, 12, 2984. [Google Scholar] [CrossRef]
- Mararakanye, N.; Le Roux, J.J.; Franke, A.C. Using satellite-based weather data as input to SWAT in a data poor catchment. Phys. Chem. Earth, Parts A/B/C 2020, 117, 102871. [Google Scholar] [CrossRef]
- Dao, D.M.; Lu, J.; Chen, X.; Kantoush, S.A.; Van Binh, D.; Phan, P.; Tung, N.X. Predicting tropical monsoon hydrology using CFSR and CMADS data over the Cau river basin in Vietnam. Water 2021, 13, 1314. [Google Scholar] [CrossRef]
- Gao, Z.; Long, D.; Tang, G.; Zeng, C.; Huang, J.; Hong, Y. Assessing the potential of satellite-based precipitation estimates for flood frequency analysis in ungauged or poorly gauged tributaries of China’s Yangtze River basin. J. Hydrol. 2017, 550, 478–496. [Google Scholar] [CrossRef]
- Guo, M.; Zhang, T.; Li, J.; Li, Z.; Xu, G.; Yang, R. Reducing nitrogen and phosphorus losses from different crop types in the water source area of the Danjiang river, China. Int. J. Environ. Res. Public Health 2019, 16, 3442. [Google Scholar] [CrossRef] [PubMed] [Green Version]
- Gu, W.; Shao, D.; Jiang, Y. Risk Evaluation of Water Shortage in Source Area of Middle Route Project for South-to-North Water Transfer in China. Water Resour. Manag. 2012, 26, 3479–3493. [Google Scholar] [CrossRef]
- Dong, Z.; Yan, Y.; Duan, J.; Fu, X.; Zhou, Q.; Huang, X.; Zhu, X.; Zhao, J. Computing payment for ecosystem services in watersheds: An analysis of the Middle Route Project of South-to-North Water Diversion in China. J. Environ. Sci. 2011, 23, 2005–2012. [Google Scholar] [CrossRef]
- Hu, S.; Qiu, H.; Yang, D.; Cao, M.; Song, J.; Wu, J.; Huang, C.; Gao, Y. Evaluation of the applicability of climate forecast system reanalysis weather data for hydrologic simulation: A case study in the Bahe River Basin of the Qinling Mountains, China. J. Geogr. Sci. 2017, 27, 546–564. [Google Scholar] [CrossRef] [Green Version]
- Shan, Z.B.Z.Z.R. The Impact of Land Use and Agricultural Management on Non-point Source Nitrogen Pollution in Dan River Watershed. J. Soil Water Conserv. 2020, 34, 135–141. [Google Scholar]
- Meng, X.; Sun, Z.; Zhao, H.; Ji, X.; Wang, H.; Xue, L.; Wu, H.; Zhu, Y. Spring flood forecasting based on the WRF-TSRM mode. Teh. Vjesn. 2018, 25, 141–151. [Google Scholar] [CrossRef] [Green Version]
- Meng, X.; Wang, H.; Wu, Y.; Long, A.; Wang, J.; Shi, C.; Ji, X. Investigating spatiotemporal changes of the land-surface processes in Xinjiang using high-resolution CLM3.5 and CLDAS: Soil temperature. Sci. Rep. 2017, 7, 1–14. [Google Scholar] [CrossRef] [PubMed]
- Keikhosravi Kiany, M.S.; Masoodian, S.A.; Balling, R.C.; Montazeri, M. Evaluation of the TRMM 3B42 product for extreme precipitation analysis over southwestern Iran. Adv. Sp. Res. 2020, 66, 2094–2112. [Google Scholar] [CrossRef]
- Huffman, G.J.; Adler, R.F.; Bolvin, D.T.; Nelkin, E.J. The TRMM Multi-Satellite Precipitation Analysis (TMPA). Satell. Rainfall Appl. Surf. Hydrol. 2010, 3–22. [Google Scholar] [CrossRef] [Green Version]
- Jiang, S.; Liu, R.; Ren, L.; Wang, M.; Shi, J.; Zhong, F.; Duan, Z. Evaluation and Hydrological Application of CMADS Reanalysis Precipitation Data against Four Satellite Precipitation Products in the Upper Huaihe River Basin, China. J. Meteorol. Res. 2020, 34, 1096–1113. [Google Scholar] [CrossRef]
- Duan, Z.; Tuo, Y.; Liu, J.; Gao, H.; Song, X.; Zhang, Z.; Yang, L.; Mekonnen, D.F. Hydrological evaluation of open-access precipitation and air temperature datasets using SWAT in a poorly gauged basin in Ethiopia. J. Hydrol. 2019, 569, 612–626. [Google Scholar] [CrossRef] [Green Version]
- Pang, J.; Zhang, H.; Xu, Q.; Wang, Y.; Wang, Y.; Zhang, O.; Hao, J. Hydrological evaluation of open-access precipitation data using SWAT at multiple temporal and spatial scales. Hydrol. Earth Syst. Sci. 2020, 24, 3603–3626. [Google Scholar] [CrossRef]
- Zhang, B.; Xu, X.; Liu, W.; Chen, T. Dynamic changes of soil moisture in loess hilly and gully region under effects of different yearly precipitation patterns. Chinese J. Appl. Ecol. 2008, 19, 1234–1240. [Google Scholar]
- Azarnivand, A.; Camporese, M.; Alaghmand, S.; Daly, E. Simulated response of an intermittent stream to rainfall frequency patterns. Hydrol. Process. 2020, 34, 615–632. [Google Scholar] [CrossRef]
- Knoche, M.; Fischer, C.; Pohl, E.; Krause, P.; Merz, R. Combined uncertainty of hydrological model complexity and satellite-based forcing data evaluated in two data-scarce semi-arid catchments in Ethiopia. J. Hydrol. 2014, 519, 2049–2066. [Google Scholar] [CrossRef]
- Bai, P.; Liu, X. Evaluation of Five Satellite-Based Precipitation Products in Two Gauge-Scarce Basins on the Tibetan Plateau. Remote Sens. 2018, 10, 1316. [Google Scholar] [CrossRef] [Green Version]
- Zhou, Z.; Gao, X.; Yang, Z.; Feng, J.; Meng, C.; Xu, Z. Evaluation of hydrological application of CMADS in Jinhua River Basin, China. Water 2019, 11, 138. [Google Scholar] [CrossRef] [Green Version]
- Sun, R.; Yuan, H.; Liu, X.; Jiang, X. Evaluation of the latest satellite–gauge precipitation products and their hydrologic applications over the Huaihe River basin. J. Hydrol. 2016, 536, 302–319. [Google Scholar] [CrossRef]
- Wang, Q.; Xia, J.; Zhang, X.; She, D.; Liu, J.; Li, P. Multi-scenario integration comparison of cmads and tmpa datasets for hydro-climatic simulation over ganjiang river basin, china. Water 2020, 12, 3243. [Google Scholar] [CrossRef]
- Liu, S.; Yan, D.; Qin, T.; Weng, B.; Li, M. Correction of TRMM 3B42V7 Based on Linear Regression Models over China. Adv. Meteorol. 2016, 2016, 3103749. [Google Scholar] [CrossRef]
- Chen, S.; Hong, Y.; Cao, Q.; Gourley, J.J.; Kirstetter, P.E.; Yong, B.; Tian, Y.; Zhang, Z.; Shen, Y.; Hu, J.; et al. Similarity and difference of the two successive V6 and V7 TRMM multisatellite precipitation analysis performance over China. J. Geophys. Res. Atmos. 2013, 118, 13060–13074. [Google Scholar] [CrossRef]
- Song, Y.; Zhang, J.; Meng, X.; Zhou, Y.; Lai, Y.; Cao, Y. Comparison study of multiple precipitation forcing data on hydrological modeling and projection in the qujiang river basin. Water 2020, 12, 2626. [Google Scholar] [CrossRef]
- Vu, T.T.; Li, L.; Jun, K.S. Evaluation of multi-satellite precipitation products for streamflow simulations: A case study for the Han River Basin in the Korean Peninsula, East Asia. Water 2018, 10, 642. [Google Scholar] [CrossRef] [Green Version]
- Hromadka, T.V.; McCuen, R.H. Uncertainty estimates for surface runoff models. Adv. Water Resour. 1988, 11, 2–14. [Google Scholar] [CrossRef]
- Maskey, S.; Guinot, V.; Price, R.K. Treatment of precipitation uncertainty in rainfall-runoff modelling: A fuzzy set approach. Adv. Water Resour. 2004, 27, 889–898. [Google Scholar] [CrossRef]
- Jones, P.D.; Lister, D.H.; Wilby, R.L.; Kostopoulou, E. Extended riverflow reconstructions for England and Wales, 1865-2002. Int. J. Climatol. 2006, 26, 219–231. [Google Scholar] [CrossRef]
- Andréassian, V.; Perrin, C.; Michel, C.; Usart-Sanchez, I.; Lavabre, J. Impact of imperfect rainfall knowledge on the efficiency and the parameters of watershed models. J. Hydrol. 2001, 250, 206–223. [Google Scholar] [CrossRef]
- Solano-Rivera, V.; Geris, J.; Granados-Bolaños, S.; Brenes-Cambronero, L.; Artavia-Rodríguez, G.; Sánchez-Murillo, R.; Birkel, C. Exploring extreme rainfall impacts on flow and turbidity dynamics in a steep, pristine and tropical volcanic catchment. CATENA 2019, 182, 104118. [Google Scholar] [CrossRef]
- Xu, Q.W.Y.C.X.Z. Influence of Rain Gauges Network Configuration on the Accuracy of Rainfall Spatial Interpolation and Hydrological Modeling. J. Yangtze River Sci. Res. Inst. 2019, 4, 19–26. [Google Scholar]
- Fuka, D.R.; Walter, M.T.; Macalister, C.; Degaetano, A.T.; Steenhuis, T.S.; Easton, Z.M. Using the Climate Forecast System Reanalysis as weather input data for watershed models. Hydrol. Process. 2014, 28, 5613–5623. [Google Scholar] [CrossRef]
- Tuo, Y.; Duan, Z.; Disse, M.; Chiogna, G. Evaluation of precipitation input for SWAT modeling in Alpine catchment: A case study in the Adige river basin (Italy). Sci. Total Environ. 2016, 573, 66–82. [Google Scholar] [CrossRef] [PubMed] [Green Version]
- Nash, J.E.; Sutcliffe, J.V. River flow forecasting through conceptual models part I — A discussion of principles. J. Hydrol. 1970, 10, 282–290. [Google Scholar] [CrossRef]


| Parameters | Dataset | Developed Organization | Resolution | Data Source (Accessed on 1 August 2021) |
|---|---|---|---|---|
| DEM | Shuttle Radar Topography Mission (SRTM) | National Aeronautics and Space Administration (NASA) | 30 m | https://earthexplorer.usgs.gov/ |
| Land cover | 30 m-resolution Global Land Cover (GLC30) | The National Geomatics Center of China (NGCC) | 30 m | http://www.globallandcover.com/ |
| Soil type | World Soil Database (HWSD) | The Food and Agriculture Organization of the United Nations (FAO) | 1000 m | http://www.fao.org/soils-portal/soil-survey/soil-maps-and-databases/harmonized-world-soil-database-v12/en/ |
| Full Name | Abbreviation | Coverage | Spatiotemporal Resolution Used | Data Source (Accessed on 1 August 2021) |
|---|---|---|---|---|
| The China Meteorological Assimilation Driving Datasets for the SWAT model Version 1.1 | CMADS V1.1 | 0–65° N 60–160° E | Daily, 0.25° | http://www.cmads.org/ |
| Tropical Rainfall Measuring Mission Multi-satellite Precipitation Analysis 3B42 Version 7 | TRMM 3B42 V7 | 50° S–50° N | Daily, 0.25° | https://disc.gsfc.nasa.gov/ |
| Performance Ratings | R2 | NSE | PBIAS |
|---|---|---|---|
| Very Good | 0.7~1 | 0.75~1 | <±10 |
| Good | 0.6~0.7 | 0.65~0.75 | ±10~±15 |
| Satisfactory | 0.5~0.6 | 0.50~0.65 | ±15~±25 |
| Unsatisfactory | ≤0.5 | ≤0.5 | ≥±25 |
| Station | R2 | NSE | PBIAS | ||||||
|---|---|---|---|---|---|---|---|---|---|
| CMADS | Gauge | TRMM | CMADS | Gauge | TRMM | CMADS | Gauge | TRMM | |
| Majie Station | 0.79 | 0.5 | 0.68 | 0.74 | 0.43 | 0.66 | 23.4 | −22.38 | 10.44 |
| Danfeng Station | 0.04 | 0.05 | 0.05 | −0.7 | −1.52 | −7.24 | −7.67 | −56.43 | −32.1 |
| Jingziguan Station | 0.7 | 0.06 | 0.63 | 0.63 | −0.82 | 0.51 | −63.35 | −164.97 | −164.7 |
| Station | R2 | NSE | PBIAS | ||||||
|---|---|---|---|---|---|---|---|---|---|
| CMADS | Gauge | TRMM | CMADS | Gauge | TRMM | CMADS | Gauge | TRMM | |
| Majie Station | 0.39 | 0.18 | 0.22 | 0.38 | 0.11 | 0.18 | 22.98 | −23.02 | 9.83 |
| Danfeng Station | 0.32 | 0.05 | 0.2 | 0.16 | −1.24 | −0.23 | 1.65 | −47.57 | −24.83 |
| Jingziguan Station | 0.26 | 0.02 | 0.16 | 0.25 | −0.57 | 0.03 | 60.82 | −160.86 | −143 |
| Paraments | Description | Monthly Scale | Daily Scale | ||||
|---|---|---|---|---|---|---|---|
| CMADS | Gauge | TRMM | CMADS | Gauge | TRMM | ||
| r__SOL_AWC().sol | Available water capacity of the soil layer (mm HzO/mm soil) | −0.06 | −0.26 | −0.06 | 0.52 | −0.76 | −0.22 |
| r__CN2.mgt | scS runoff curve number | 0.14 | −0.04 | 0.17 | −0.21 | −0.03 | 0.32 |
| v__ALPHA_BF.gw | Baseflow alpha factor (days) | 0.6 | 0.98 | 0.51 | 1.01 | 1.04 | 0.62 |
| v__GW_DELAY.gw | Groundwater delay (days) | −139.76 | 234.5 | −198.89 | −216.84 | 209.46 | 481.86 |
| r__GWQMN.gw | Threshold depth of water in the shallow aquifer required for return | −0.07 | 0.46 | −0.64 | −0.11 | 2.01 | 0.21 |
| v__CH_K2.rte | Effective hydraulic conductivity (mm/h) | −367.12 | 175.49 | −12.96 | 232.1 | 249.42 | 131.99 |
| v__CH_N2.rte | Manning’s n value for main channel | 0 | 0.04 | 0.13 | 0.03 | 0.15 | 0.13 |
| v__REVAPMN.gw | Threshold depth of water in the shallow aquifer for “revamp” to occur | 81.71 | 326.5 | 421.85 | 387.87 | 481.2 | 571.41 |
| r__GW_REVAP.gw | Groundwater “revap” coefficient | −0.39 | −0.38 | −0.23 | 0.44 | −0.34 | 0.21 |
| r__OV_N.hru | Manning’s “n” value for overland flow | 0.32 | 0.05 | 0.39 | 0.21 | 0.06 | −1.11 |
| r__SLSUBBSN.hru | Average slope length (m) | 0.9 | 0.45 | 1.12 | 0.84 | 0.7 | −0.52 |
| r__HRU_SLP.hru | Average slope steepness (m/m) | −0.1 | −0.38 | −0.18 | 0.02 | 0.08 | −0.47 |
| v__EPCO.hru | Plant uptake compensation factor | 0.34 | 0.59 | −0.47 | 0.07 | 0.26 | 0.43 |
| v__ESCO.hru | Soil evaporation compensation factor | 0.15 | 0.05 | 0.02 | 0.89 | 0.15 | 0.37 |
| r__SOL_BD().sol | Moist bulk density (g/cm3) | 2.19 | 1.5 | 1.22 | 1.31 | 1.79 | 1.64 |
| r__SOL_K().sol | Saturated hydraulic conductivity (mm/h) | −0.55 | −0.35 | −0.56 | −0.68 | −0.75 | −0.98 |
| v__PLAPS.sub | Precipitation lapse rate (mm) | −716.86 | 690 | −368.75 | −867.07 | 615.05 | −660.12 |
| Station | R2 | NSE | PBIAS | ||||||
|---|---|---|---|---|---|---|---|---|---|
| CMADS | Gauge | TRMM | CMADS | Gauge | TRMM | CMADS | Gauge | TRMM | |
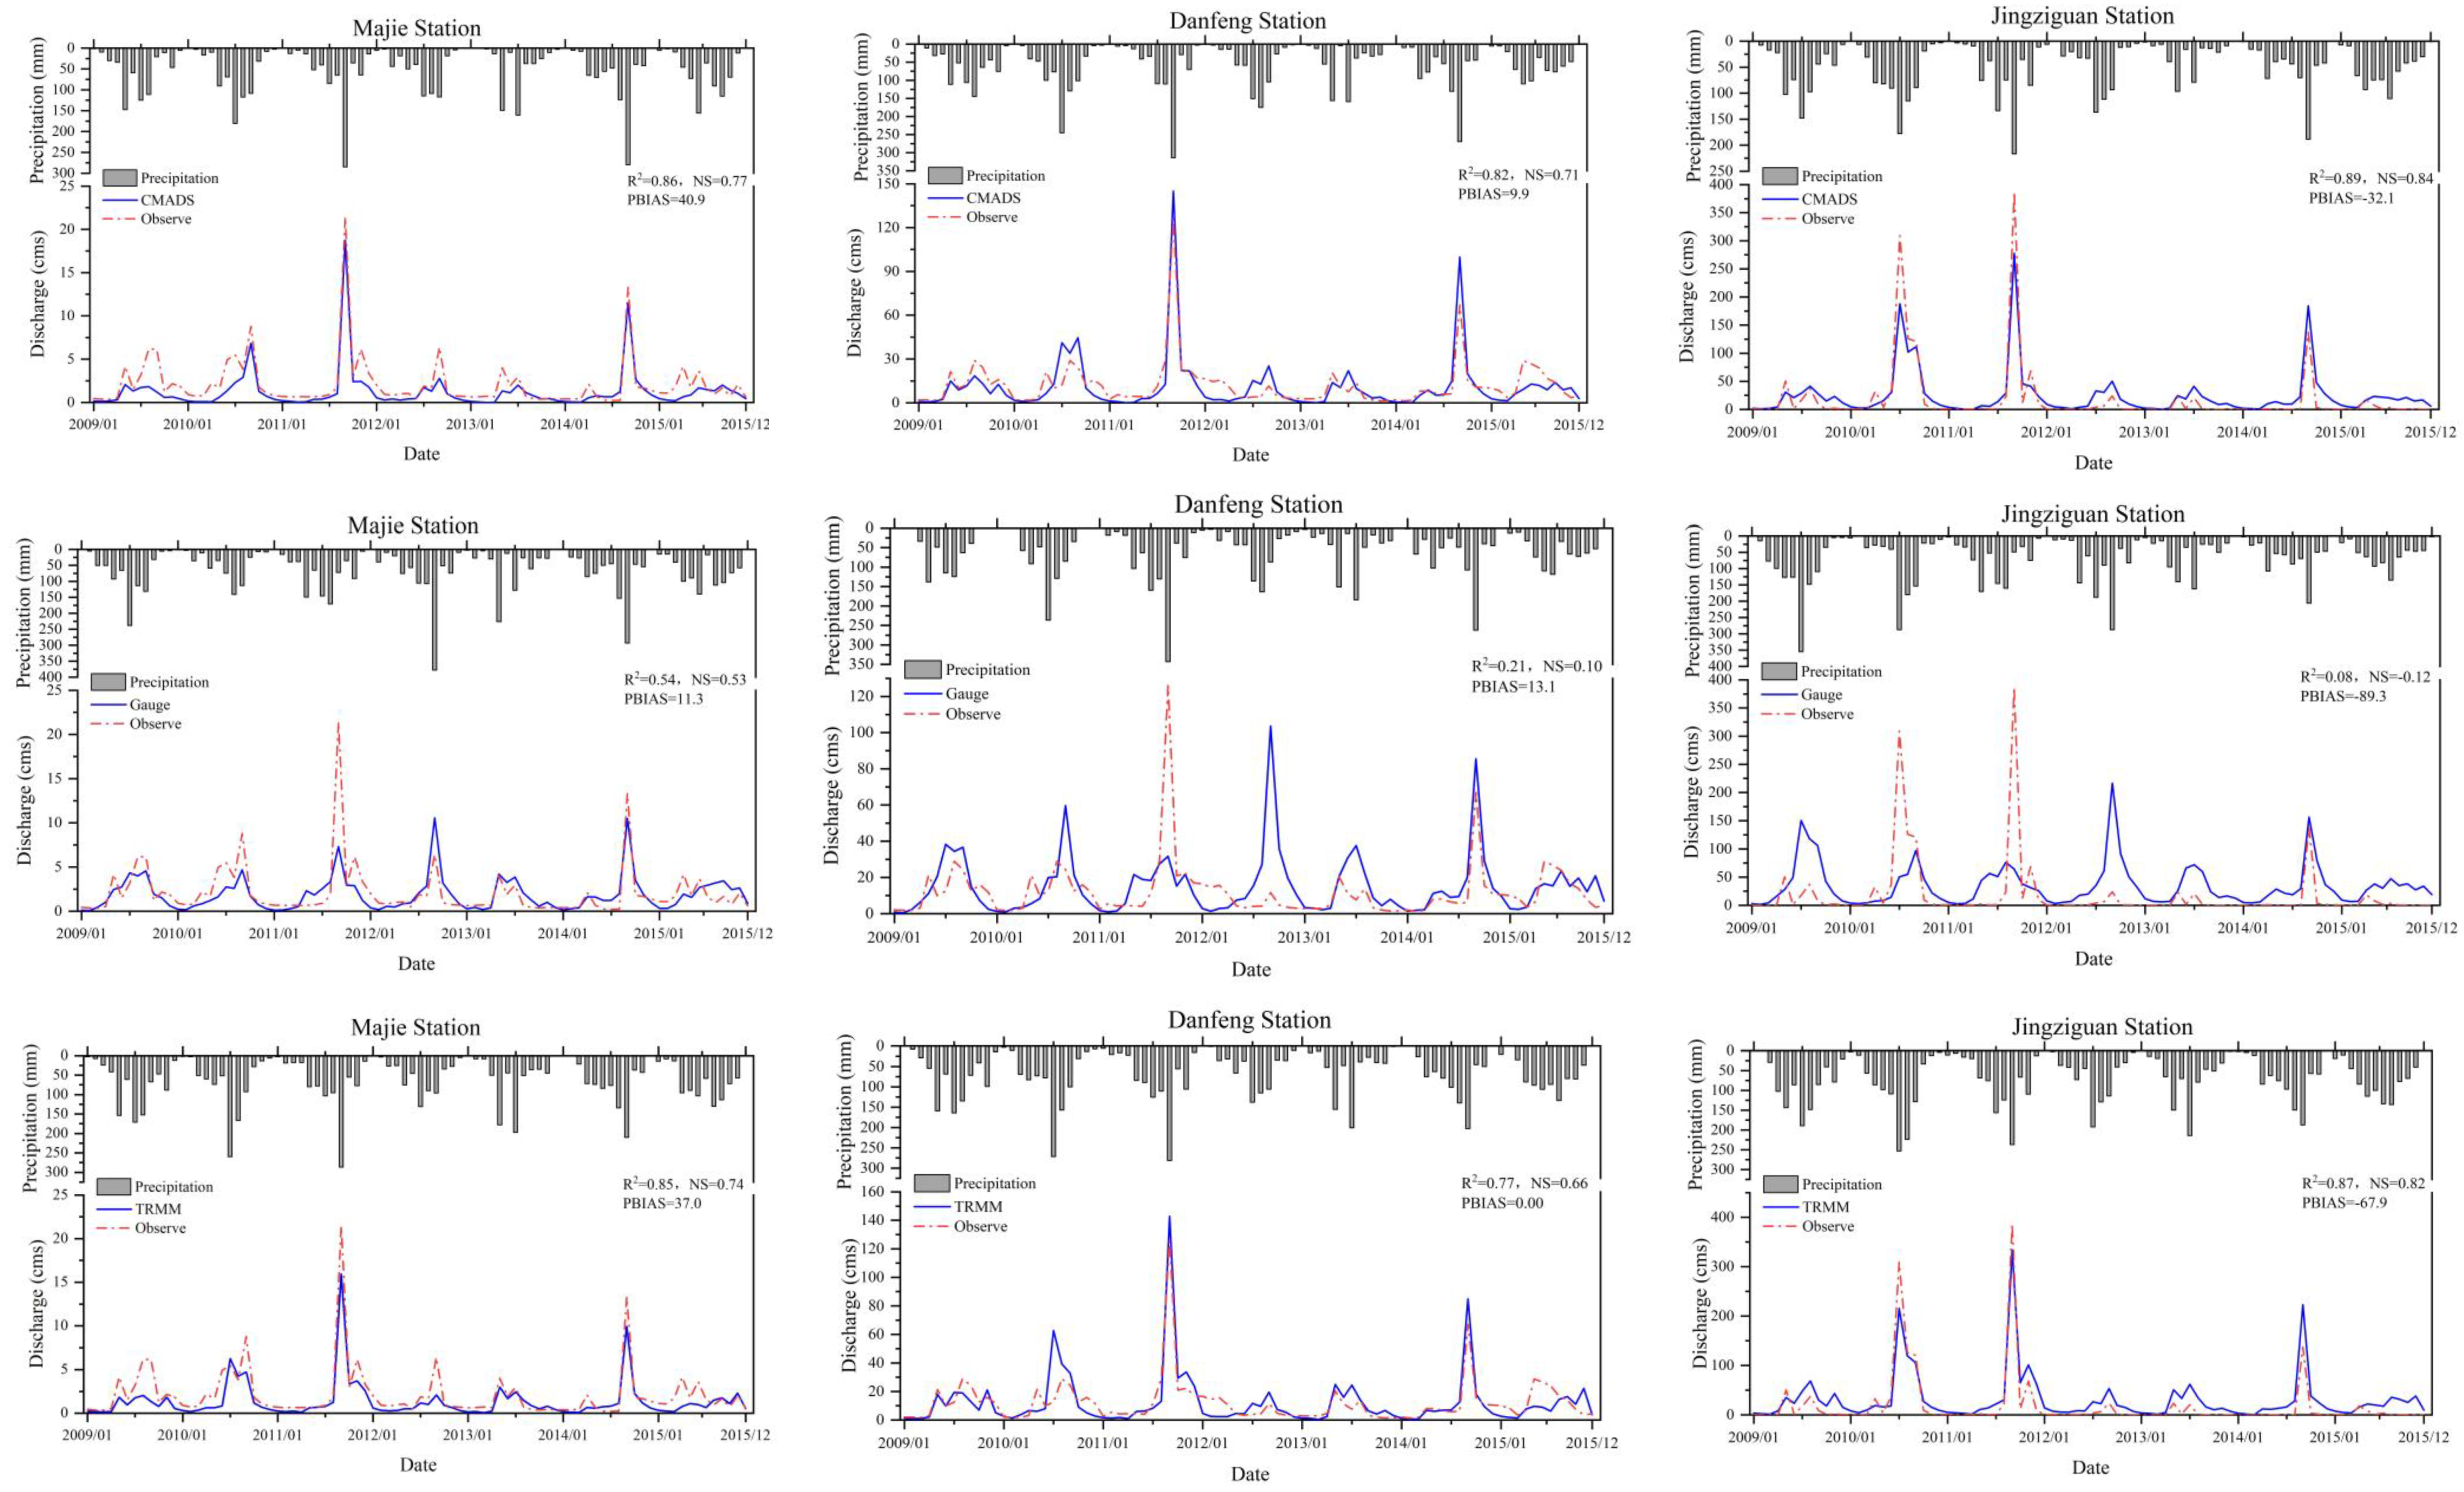
| Majie Station | 0.86 | 0.54 | 0.85 | 0.77 | 0.53 | 0.74 | 40.09 | 11.3 | 37 |
| Danfeng Station | 0.82 | 0.21 | 0.77 | 0.71 | 0.1 | 0.66 | 9.9 | 13.1 | 0 |
| Jingziguan Station | 0.89 | 0.08 | 0.87 | 0.84 | 0.12 | 0.82 | −32.1 | −89.3 | −67.9 |
| Station | R2 | NSE | PBIAS | ||||||
|---|---|---|---|---|---|---|---|---|---|
| CMADS | Gauge | TRMM | CMADS | Gauge | TRMM | CMADS | Gauge | TRMM | |
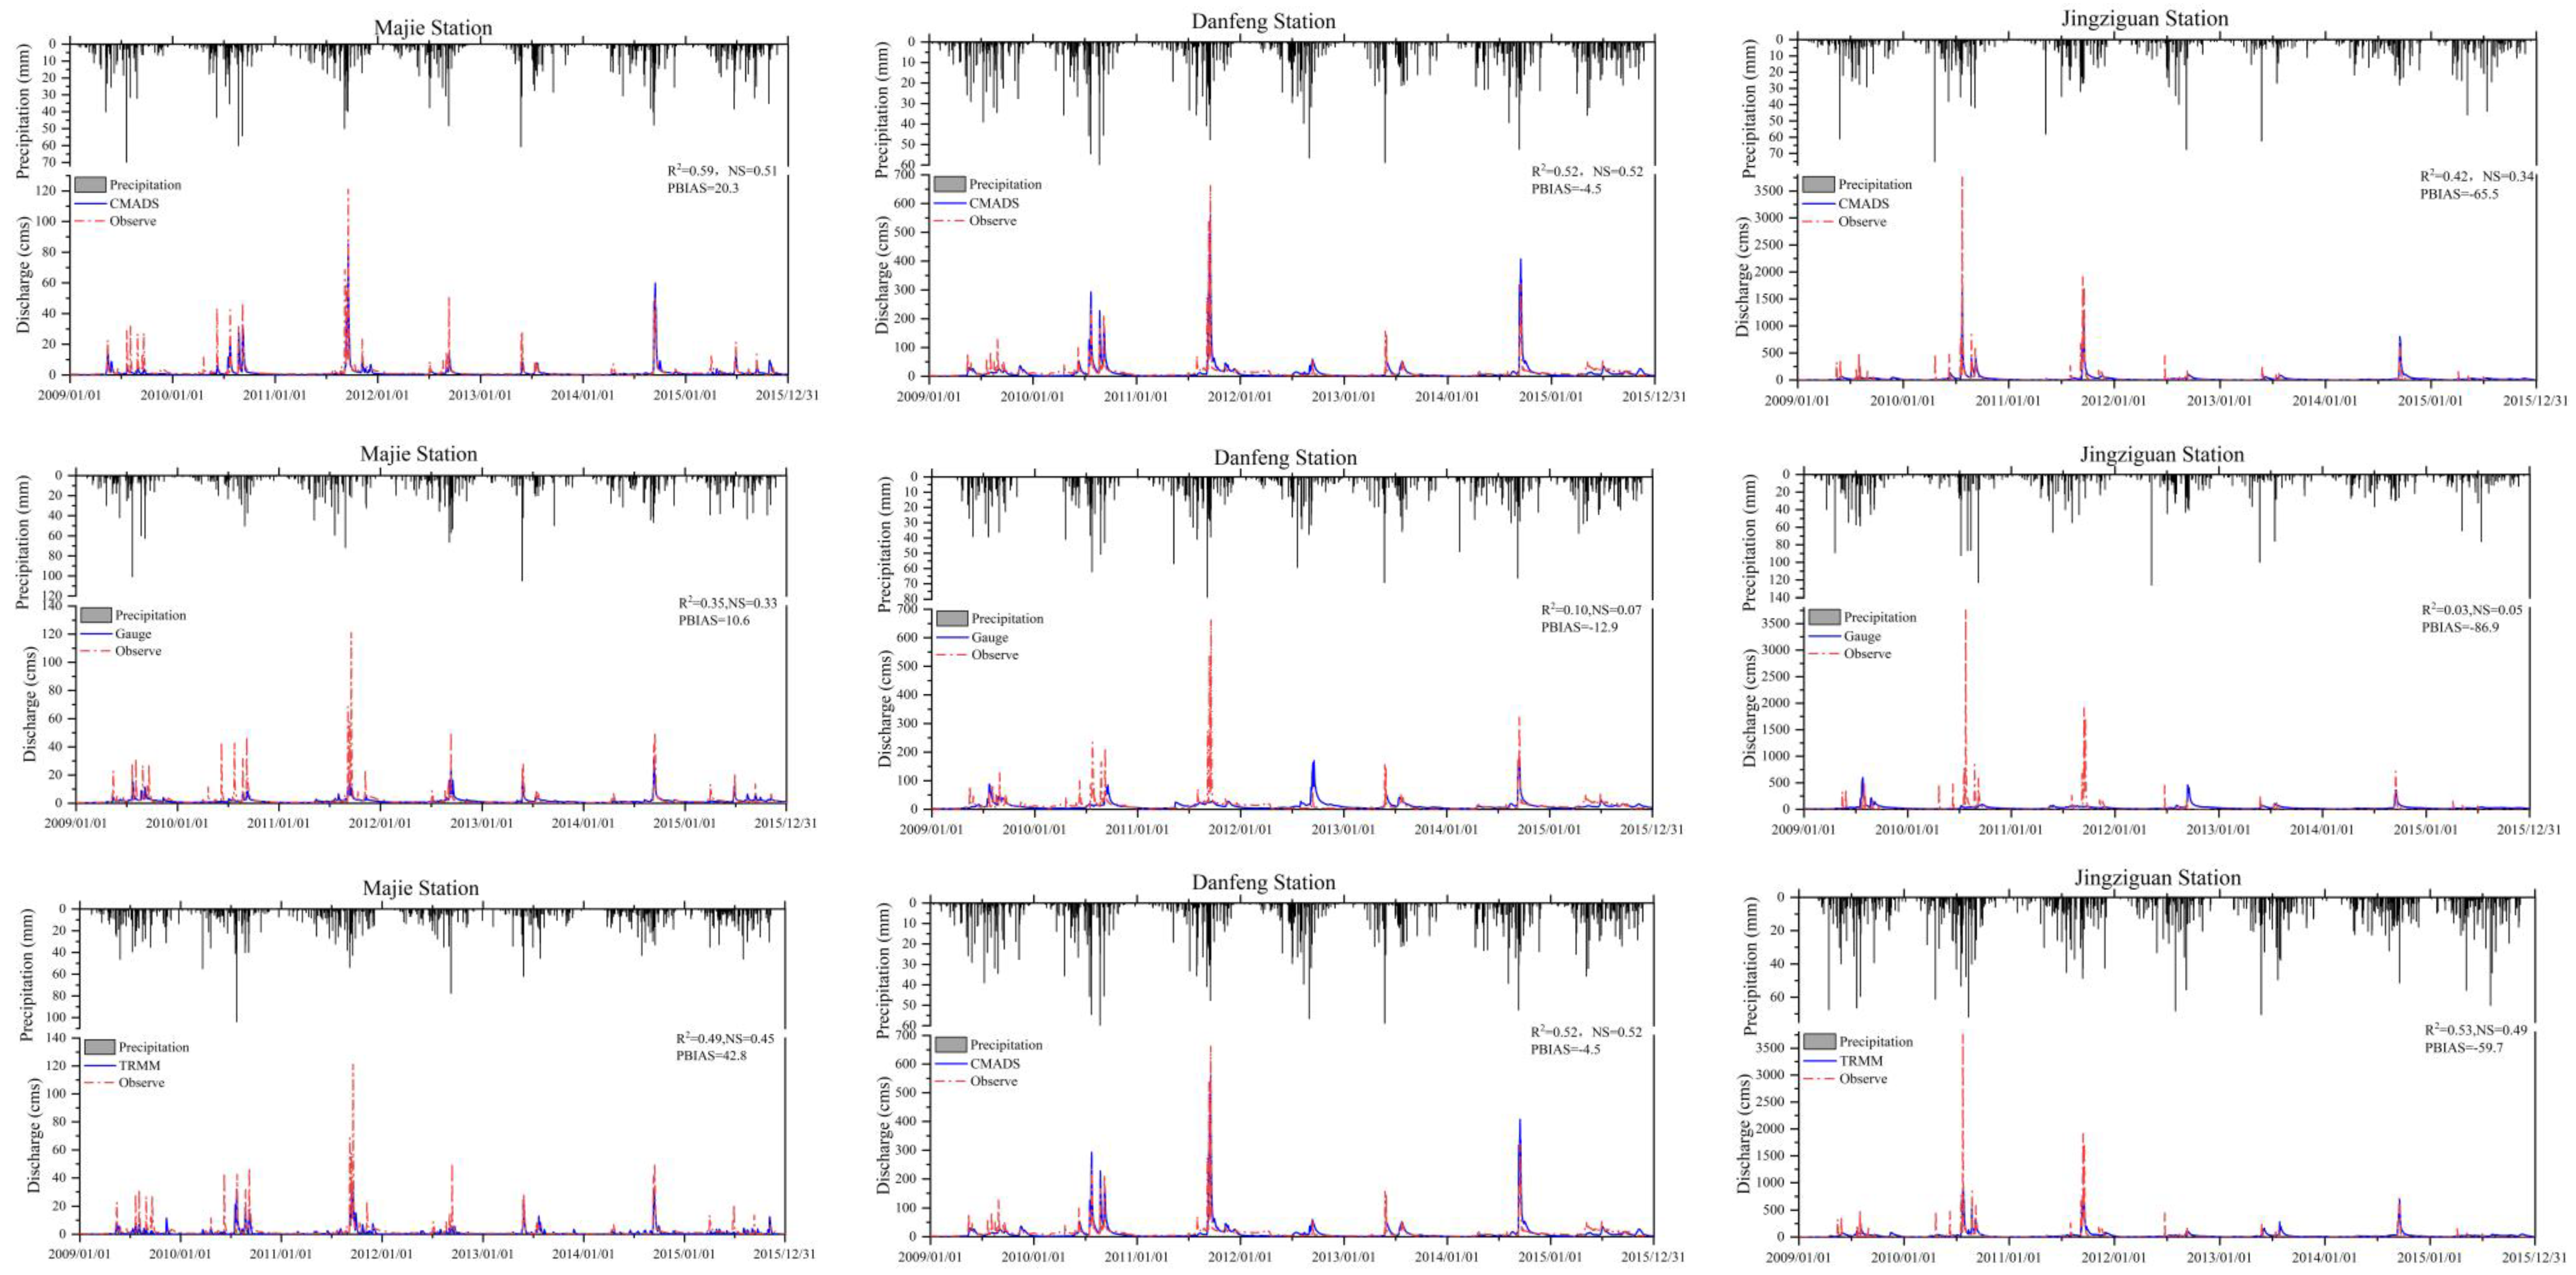
| Majie Station | 0.59 | 0.35 | 0.49 | 0.51 | 0.33 | 0.45 | 20.3 | 10.6 | 42.8 |
| Danfeng Station | 0.52 | 0.1 | 0.54 | 0.52 | 0.07 | 0.52 | −4.5 | −12.9 | −20.4 |
| Jingziguan Station | 0.42 | 0.03 | 0.53 | 0.34 | 0.05 | 0.49 | −65.5 | −86.9 | −59.7 |
Publisher’s Note: MDPI stays neutral with regard to jurisdictional claims in published maps and institutional affiliations. |
© 2022 by the authors. Licensee MDPI, Basel, Switzerland. This article is an open access article distributed under the terms and conditions of the Creative Commons Attribution (CC BY) license (https://creativecommons.org/licenses/by/4.0/).
Share and Cite
Guo, Y.; Ding, W.; Xu, W.; Zhu, X.; Wang, X.; Tang, W. Assessment of an Alternative Climate Product for Hydrological Modeling: A Case Study of the Danjiang River Basin, China. Water 2022, 14, 1105. https://doi.org/10.3390/w14071105
Guo Y, Ding W, Xu W, Zhu X, Wang X, Tang W. Assessment of an Alternative Climate Product for Hydrological Modeling: A Case Study of the Danjiang River Basin, China. Water. 2022; 14(7):1105. https://doi.org/10.3390/w14071105
Chicago/Turabian StyleGuo, Yiwei, Wenfeng Ding, Wentao Xu, Xiudi Zhu, Xiekang Wang, and Wenjian Tang. 2022. "Assessment of an Alternative Climate Product for Hydrological Modeling: A Case Study of the Danjiang River Basin, China" Water 14, no. 7: 1105. https://doi.org/10.3390/w14071105
APA StyleGuo, Y., Ding, W., Xu, W., Zhu, X., Wang, X., & Tang, W. (2022). Assessment of an Alternative Climate Product for Hydrological Modeling: A Case Study of the Danjiang River Basin, China. Water, 14(7), 1105. https://doi.org/10.3390/w14071105