Article

The Effect of Soil Texture on the Conversion Factor of 1:5 Soil/Water Extract Electrical Conductivity (EC1:5) to Soil Saturated Paste Extract Electrical Conductivity (ECe)

by
George Kargas
1,
Paraskevi Londra
1,* and
Kyriaki Sotirakoglou
2
1
Laboratory of Agricultural Hydraulics, Department of Natural Resources Management and Agricultural Engineering, Agricultural University of Athens, 75 Iera Odos, 11855 Athens, Greece
2
Laboratory of Mathematics and Theoretical Mechanics, Department of Natural Resources Management and Agricultural Engineering, Agricultural University of Athens, 75 Iera Odos, 11855 Athens, Greece
*
Author to whom correspondence should be addressed.
Water 2022, 14(4), 642; https://doi.org/10.3390/w14040642
Submission received: 27 January 2022 / Revised: 15 February 2022 / Accepted: 17 February 2022 / Published: 18 February 2022
(This article belongs to the Special Issue Study of the Soil Water Movement in Irrigated Agriculture Ⅱ)

Abstract

:
The electrical conductivity of soil saturated paste extract (ECe) is used as an indicator for estimating soil salinity. This method is time consuming and laborious and therefore, easier and faster methods are usually used with different soil/water ratios, such as 1:5 (EC1:5), for estimating the ECe. Usually, the relationship between ECe and EC1:5 is described by a simple linear empirical equation. The value of the conversion factor (CF) of EC1:5 to ECe is affected by the particular characteristics of the soil, such as its texture. The objective of this study is to investigate models that allow the inclusion of soil texture in the calculation of the CF, in order to improve the prediction of the ECe. A total of 148 soil samples with different soil texture and salinity levels were selected from three regions of Greece, and ECe, EC1:5, as well as clay and sand contents were determined. The results show that the CF can be estimated from an equation which incorporates the clay and sand contents through the soil saturation percentage (SP) and can give a fairly good prediction of ECe from EC1:5 (R2 = 0.9887 and RMSE = 1.39 dSm−1).

1. Introduction

Soil salinity is now one of the most important limiting factors in food production due to its impact on the degradation of soils, especially in arid and semi-arid regions. It is estimated that, worldwide, approximately one billion hectares have salinity problems [1]. Nowadays, the intensity of these problems become even greater by both the increase of the irrigated areas and the consequent increase of groundwater for irrigation in arid and semi-arid areas. Especially in coastal areas, the quality of irrigation water is degraded in aquifers. Therefore, the monitoring and evaluation of soil salinity is of vital importance for the rational management of degraded soils and sustainable food production.
Soil salinity is conventionally estimated by measurement of the soil-saturated paste extract’s electrical conductivity (ECe) [2]. Saline soils are characterized by high concentration of soluble salts and therefore by high ECe values (ECe > 4 dSm−1), while sodic soils are characterized by the composition of soluble salts with higher proportion of Na relative to Ca and Mg. Specifically, soils are classified as saline soils when ECe > 4 dSm−1 and the exchangeable sodium percentage ESP < 15% and classified as sodic soils when ECe < 4 dSm−1 and ESP > 15%. However, it is worth noting that the preparation of the soil-saturated paste is a laborious and time-consuming process, especially in the case of clay soils where the extract collection takes longer than four hours. Thus, in the case of soil salinity mapping at field scale where the collection of many soil samples is required, the laboratory work for the measurement of ECe becomes very difficult and intensive [3].
For these reasons, many researchers have suggested easier methods to determine EC in various soil-over-water extract mass ratios instead of determining ECe. The most widely used soil-over-water mass ratios (soil:water) are 1:1 (EC1:1) and 1:5 (EC1:5). The 1:5 method is mainly applied in Australia and China, while the 1:1 method is used in the USA [4,5,6]. These methods are easier to handle due to the fixed water amount used, require shorter time for preparation and extraction, and have lower costs than the ECe.
Many researchers have proposed different empirical linear relationships between ECe and EC for various soil/water extract ratios [6,7,8,9,10,11,12,13]. In the case of the conversion of EC1:5 to ECe, the value of conversion factor (CF) referred by various researchers ranged from 5.05 to 11.7 [12]. The different values of CF, especially in the case of the conversion of EC1:5 to ECe, in the different regions, have been attributed to many factors. Among these is the soil texture, the gypsum and calcium carbonate content, the chemical composition of the soil solution, as well as the equilibration time and the preparation and extraction process of EC1:5 determination. It has been documented that in coarse-textured soils the conversion factor has a higher value compared with fine-textured soils [7,12]. Also, the gypsum presence in soil, which has a relatively low solubility, affects the coefficients of the linear relationship, since the greater dilution that results from the 1:5 method leads to both a decrease in the concentration of certain ions and the increase in some others.
The abovementioned wide range of CF values (i.e., 5.05–11.7) makes it clear that the conversion factor derived from the data of one region cannot be used to determine another with different soil characteristics because significant errors in the ECe prediction will occur. Therefore, it is important to develop new approaches and models that enable the quantitative incorporation of such factors which affect the CF for each area. Thus, the role of those factors on the CF could be better investigated. As already mentioned, the soil texture is one such factor.
Slavich and Petterson [14] and Gharaibeh et al. [15] presented empirical equations between the conversion factor and soil moisture at saturation (θSP grgr−1) or soil saturation percentage (SP%). The CF was inversely proportional to θSP or SP as given by the following equation
C F = m + k θ S P   or   C F = m + k S P
where m and k are regression parameters.
The values of those parameters are m = 2.46 and k = 3.03 for soils of Australia [14], and m = 1.054 and k = 283.4 for soils of Jordan [15]. However, the soil saturation percentage can be empirically correlated with the soil texture, and consequently the SP can be used as a substitute for soil texture [15].
Slavich and Petterson [14] presented a non-linear relationship between SP and clay content from 344 soil samples and, using the range of clay content of Australian soils presented by Northcote [16], calculated the range of SP for each soil category. Then, they calculated the range of CF by applying Equation (1) and its mean value for each soil texture group. Slavich and Petterson [14] stated that using the mean value of CF for each soil texture group classified by clay percentage, the ECe can be adequately predicted by EC1:5. However, they pointed out that in the case of sandy soils, the ECe prediction errors can be large enough because the value of CF changes significantly when θSP < 0.4 grgr−1 according to Equation (1).
On the other hand, Gharaibeh et al. [15] studied 177 soil samples in the Jordan Valley and found that there was a strong negative correlation between the SP and the sand content, and a moderate to strong correlation between the SP and the clay content. Specifically, by using the multiple linear regression method, the relationship between the SP and the clay and sand content was
S P % = 43.83 + 0.313 C l a y % 0.303 S a n d %
In this way, the effect of the soil texture, through the SP parameter, can be included in the calculation of the CF when Equation (1) is used, improving the prediction of ECe from EC1:5 for the studied soils. Thus, the oversimplification which is observed when a universal CF is used for a region, resulting in significant ECe prediction errors, can be overcome. From the comparison between the predicted CF values and the actual values (ECe/EC1:5), it seems that the model gave good predictions of CF. However, in the case of sandy soils, as in the case of Slavich and Petterson [14], the ability to make a reliable prediction was lower compared with medium and fine-textured soils.
Overall, there is an open field for further research on the effect of soil parameters on CF prediction using the method of multiple linear regression in various soil types and regions.
The objective of this study is to develop prediction models of the conversion factor (CF) using the soil texture through the SP index, to more reliably predict ECe from EC1:5 in the case of Greek soils and to compare these models with other ones. For this, 148 soil samples were collected from three regions of Greece and the ECe, EC1:5, the texture of the soils and the calcium carbonate content were measured.

2. Materials and Methods
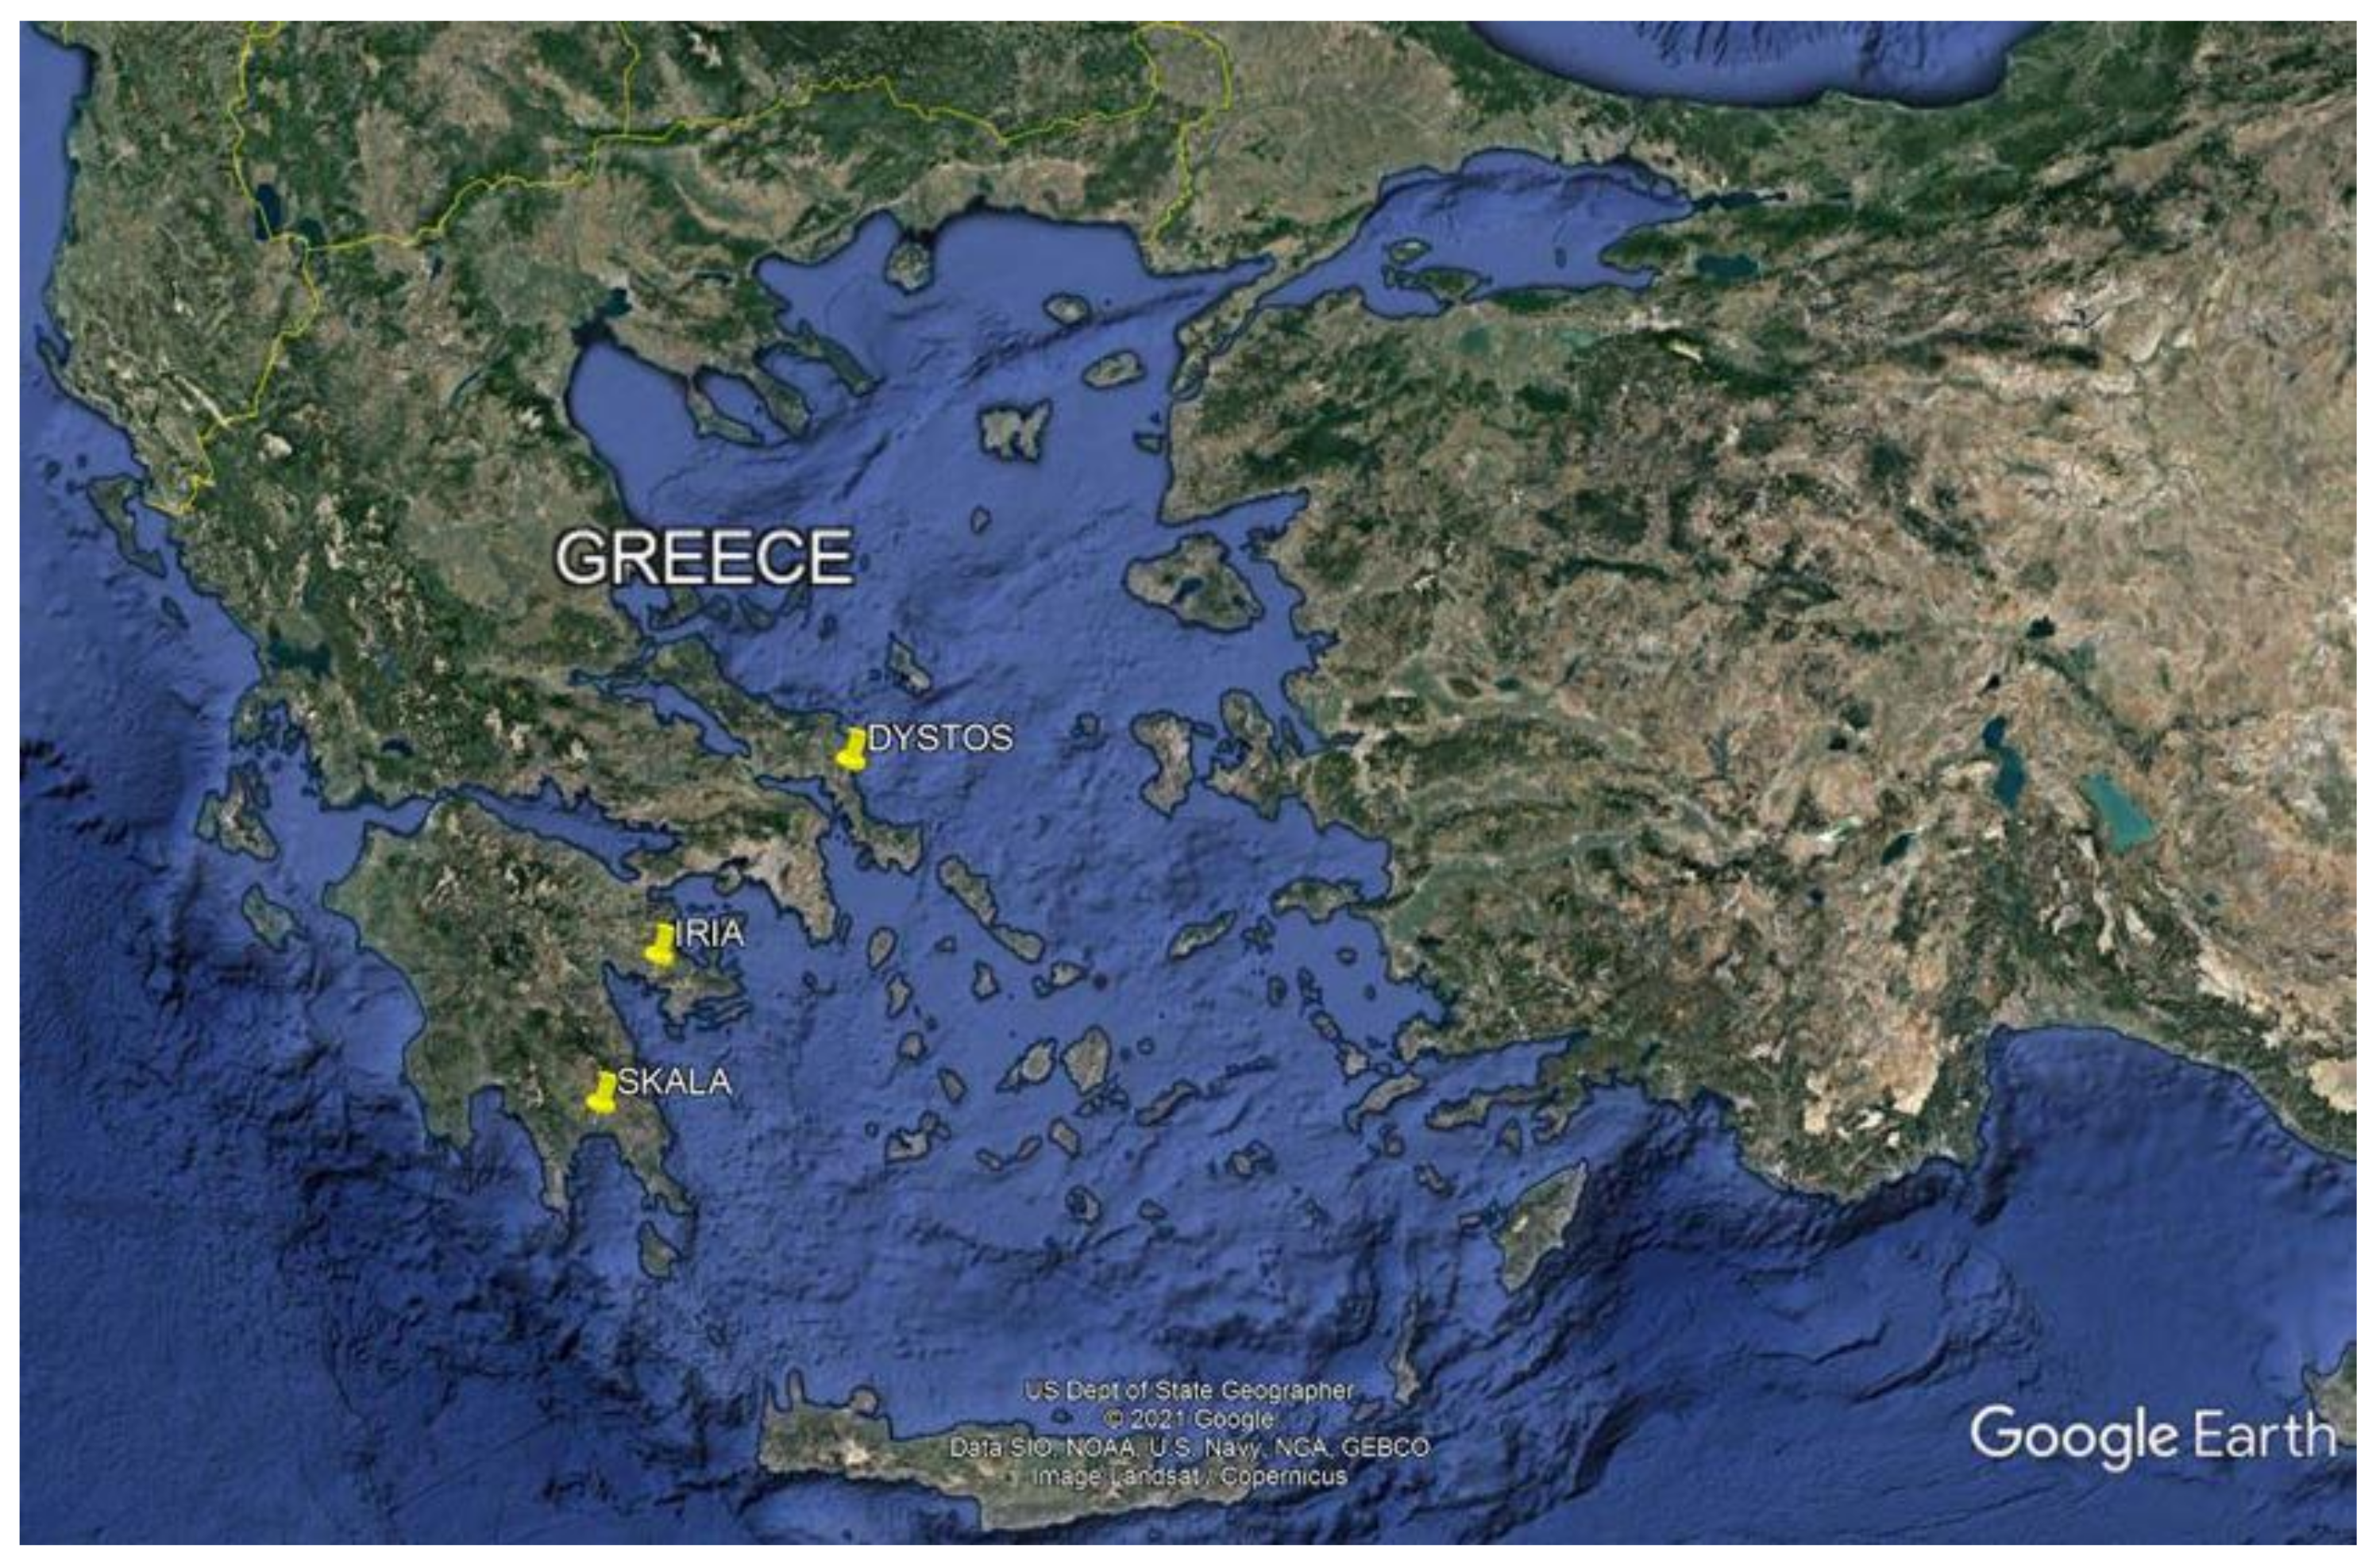
2.1. Case Studies

Soil samples were collected from three regions of Greece, i.e., Dystos, Iria and Skala, with intensive irrigated agriculture (Figure 1).
The cultivated area of each region is approximately 1000–1100 ha. The sampling areas are coastal with low altitude (1–15 m) and the crops are irrigated with groundwater (boreholes or wells) or water from the public irrigation network.
In Iria, soil salinity problems have appeared since the 1960’s, while in Skala and Dystos these have appeared over the last two decades. The soil salinity in those regions, due to the use of low-quality irrigation water, fertilizers and intensive agriculture, is likely to increase in the coming years.
The climate of the studied areas is characterized as arid and semi-arid with warm and dry summer and mild winter. The mean annual rainfall is approximately 500 mm, in all studied areas. Approximately 70–80% of rainfall falls during the period of October-March.
Vegetables are the main crops in Iria and Dystos, while Skala is covered by citrus trees.
Two soil samplings were performed in Iria. The first one at the end of irrigation period (August) and the second one at the end of rainy period (March). Soil sample collection from the other two areas was performed after the end of the rainy period. The sampling depth was 0–30 cm. A total of 148 soil samples were collected (20 soil samples from Skala, 43 from Dystos and 75 from Iria). After sampling, the soil samples were transported to a laboratory, air-dried and sieved by 2 mm sieve. Soil texture was determined by applying the Bouyoucos hydrometer method [17]. The CaCO3 equivalent percentage was estimated by measuring the eluted CO2 following the addition of HCl (calcimeter Bernard method) [18].

2.2. Determination of Electrical Conductivity

The soil saturated pastes were prepared using the standard method USDA [2]. An amount of distilled water was gradually added to a 350 g air-dried soil sample by stirring until a saturation point is reached. The amount of distilled water which was added to each soil sample depends on the particular combination of soil physical attributes, such as texture, specific surface, clay content and cation exchange capacity. At saturation, the soil pastes glistened as they reflected light and flowed slightly when the plastic container was tipped. The soil pastes were left for 24 h to reach equilibrium. Then, they were placed on a Buchner funnel with a filter paper at its bottom and the extract was collected in a 250 mL bottle by applying vacuum with a vacuum pump (VACUMBRAND GMBH type MZ 2). The ECe of extracts were measured at 25 °C using a conductivity meter (WTW, Cond 315i).
For the determination of EC1:5, 100 mL of distilled water was added in 20 g of air-dried soil sample and the suspension was agitated in a mechanical shaker for 15 min. After that, it was allowed to stand for 1 h and was then agitated again for 5 min [2]. The suspension was placed on a Buchner funnel, and following the abovementioned process, the extract was obtained and the EC1:5 was measured.

2.3. Statistical Analysis

Statistical analysis was performed using Statgraphics Centurion statistical package (version 17). For all tests, the significance level was set at 5%. Soil ECe, EC1:5, SP, clay and sand content are described by various statistical parameters, i.e., average value, standard deviation, coefficient of variation, standard error, minimum value, maximum value, coefficient of skewness and coefficient of kurtosis. Shapiro–Wilk test and graphical methods (Q–Q plots) to assess normality of the soil parameters ECe, EC1:5, SP, clay and sand content were used. The test revealed that SP, clay and sand content followed normal distributions, while ECe and EC1:5 did not follow normal distributions. In order to investigate if there were significant correlations between the variables, the Spearman correlations were computed, instead of the more common Pearson correlations, because some of the variables did not follow the normal distribution. The Spearman coefficients range from −1 to +1 and are computed from the ranks of the data values rather than from the values themselves. Consequently, they are less sensitive to outliers than the Pearson coefficients.
Additionally, multiple linear regression (MLR) models were used to estimate the relationship between the dependent variable SP and the independent variables clay and sand content. The coefficient of determination R2 and the mean absolute error (MAE) were determined to evaluate the MLR models. Moreover, the assumptions of the multiple regression (linearity, normality and homoscedasticity) were checked with the help of the studentized residual plot. Studentized residuals measure how many standard deviations of each observed value of the dependent variable deviate from the fitted model using all the data except that observation. Observations that have studentized residuals greater than 3 (in absolute value) are called unusual or outliers and should be checked for their validity. Additionally, if studentized residuals are not uniformly distributed throughout the range of the predicted values of the dependent variable, the assumption of homoscedasticity is violated.

3. Results and Discussion

3.1. Soil Properties

Statistics of studied parameters of examined soil samples are presented in Table 1. From 148 soil samples examined, only 9 had SP values ranging between 30% and 40%. The rest had SP > 40% indicating that these are mainly fine-textured soils [8]. More specific, 44.5% of the samples are characterized as clay loam soils (CL), 16.2% clay (C) and 13.5% loam (L). The vast majority of CL and C soils came from Iria region. From 148 soil samples, 115 of them (77.7%) had ECe < 4 dSm−1. The average value of ECe is approx. 6.6 times higher than that one of EC1:5.

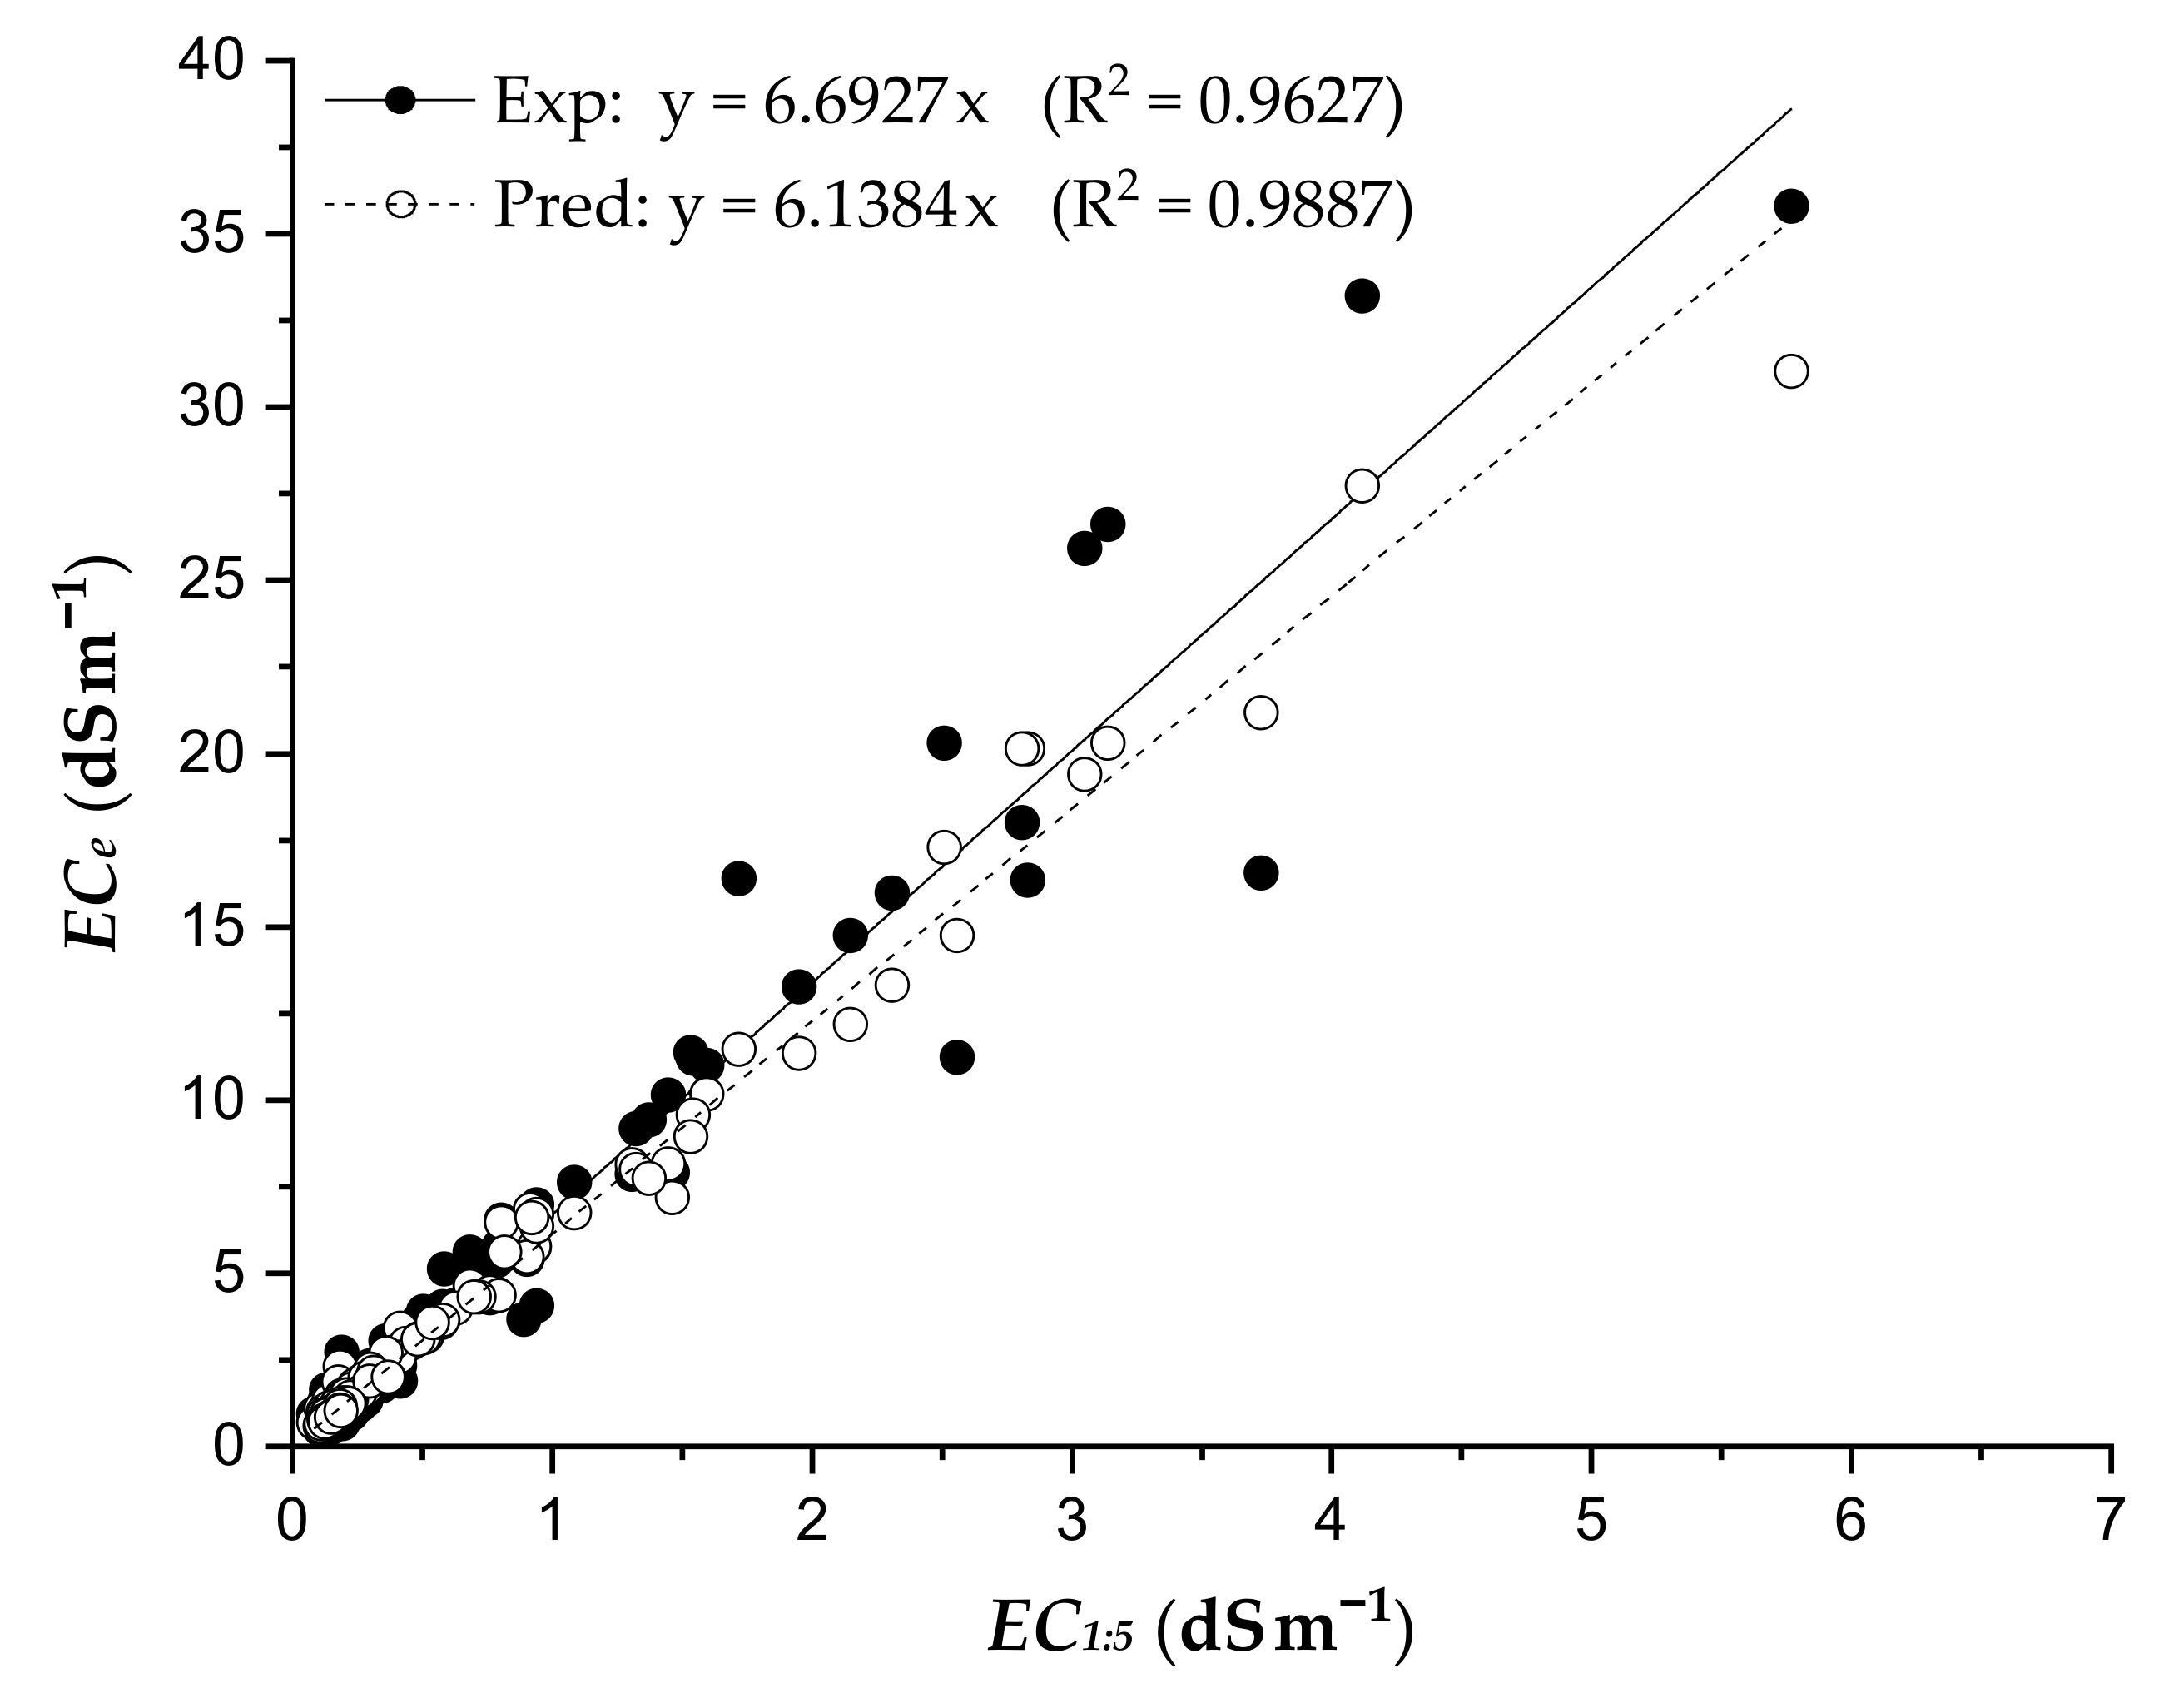
3.2. Relationship between ECe and EC1:5

The relationship between ECe and EC1:5 is presented in Figure 2. Regression analysis showed that this relationship is strongly linear with R2 = 0.9627 and the CF value, which is the slope of the regression line, is 6.6927. However, as shown in Table 2, the CF values change depending on the soil texture. For clay soils the mean actual value of CF is 4.72 while for sandy loam soils it is 8.22. Taking into consideration the fact that experimental CF values (ECe/EC1:5) vary with the soil texture, as well as how CF values of coarse-textured soils are higher than those of fine-textured soils [7,12,15], the use of a generalized value of CF = 6.6927 would lead to significant ECe prediction errors. Therefore, the inclusion of the soil texture or an indicator reflecting the soil texture in the CF may improve the performance of the ECe prediction models from EC1:5.

3.3. Spearman Correlation Coefficients and Multiple Linear Regression

As shown in Table 3, the ECe is strongly correlated with EC1:5 since the Spearman correlation coefficient is 0.942 (p < 0.001). Also, there is a strong positive correlation between SP and clay content with a Spearman coefficient of 0.787 (p < 0.001), while there is a strong negative correlation between SP and sand content with a Spearman coefficient of −0.782 (p < 0.001). Similar trends have been observed by Gharaibeh et al. [15]. On the contrary, there is no significant correlation between ECe and SP (Spearman coefficient = −0.011, p > 0.05), as well as between EC1:5 and SP (Spearman coefficient = 0.150, p > 0.05).
Since the SP is strongly linear correlated with clay and sand content, it may be used as a substitute of the soil texture in CF prediction. By applying a multiple linear regression model to estimate the dependent variable SP from the independent variables clay and sand content, the following equation with R2 = 0.749 was obtained:
S P % = 49.699 + 0.524 C l a y % 0.339 S a n d %
The high value of R2 means that there is significant correlation between SP and clay and sand content (p < 0.001) with a mean absolute error 3.703%. From Equation (3), it appears that an increase in sand content leads to a decrease in the SP value. For example, if two different textured soils are examined, e.g., a CL and a SL with sand contents 34% and 54%, respectively, and clay contents 32% and 17%, respectively, then the corresponding predicted SP values will be 54.9% and 40.3%. Comparison between the multiple linear regression Equations (2) and (3) shows a significant difference in the value of the clay content coefficient, while the constant term and the coefficient of sand content have similar values. The difference in the clay content coefficient between the equations may be attributed to the range of the clay content of soil samples and the type of clay. Regardless of the reasons for this difference, it seems that a specific multiple regression equation must be calculated in each studied region to ensure a good SP prediction from the soil texture.
Figure 3 shows the relationship between the measured SP and the predicted SP (PredSP) from Equation (3). It seems that the equation predicts the value of SP reliably since the slope of the equation is 1.0001 and the value of R2 is very high (R2 = 0.9926).
Figure 4 shows the studentized residual plot for the fitted model. In this case, there are 9 studentized residuals out of 148 that are greater than 2 (in absolute value), but none greater than 3. Therefore, none of the observations should be removed from the model. Additionally, we observe that most of the residuals are uniformly distributed throughout the range of the predicted values of SP. Consequently, we can conclude that the assumptions for linearity, normality and homoscedasticity for the proposed regression model are satisfied.

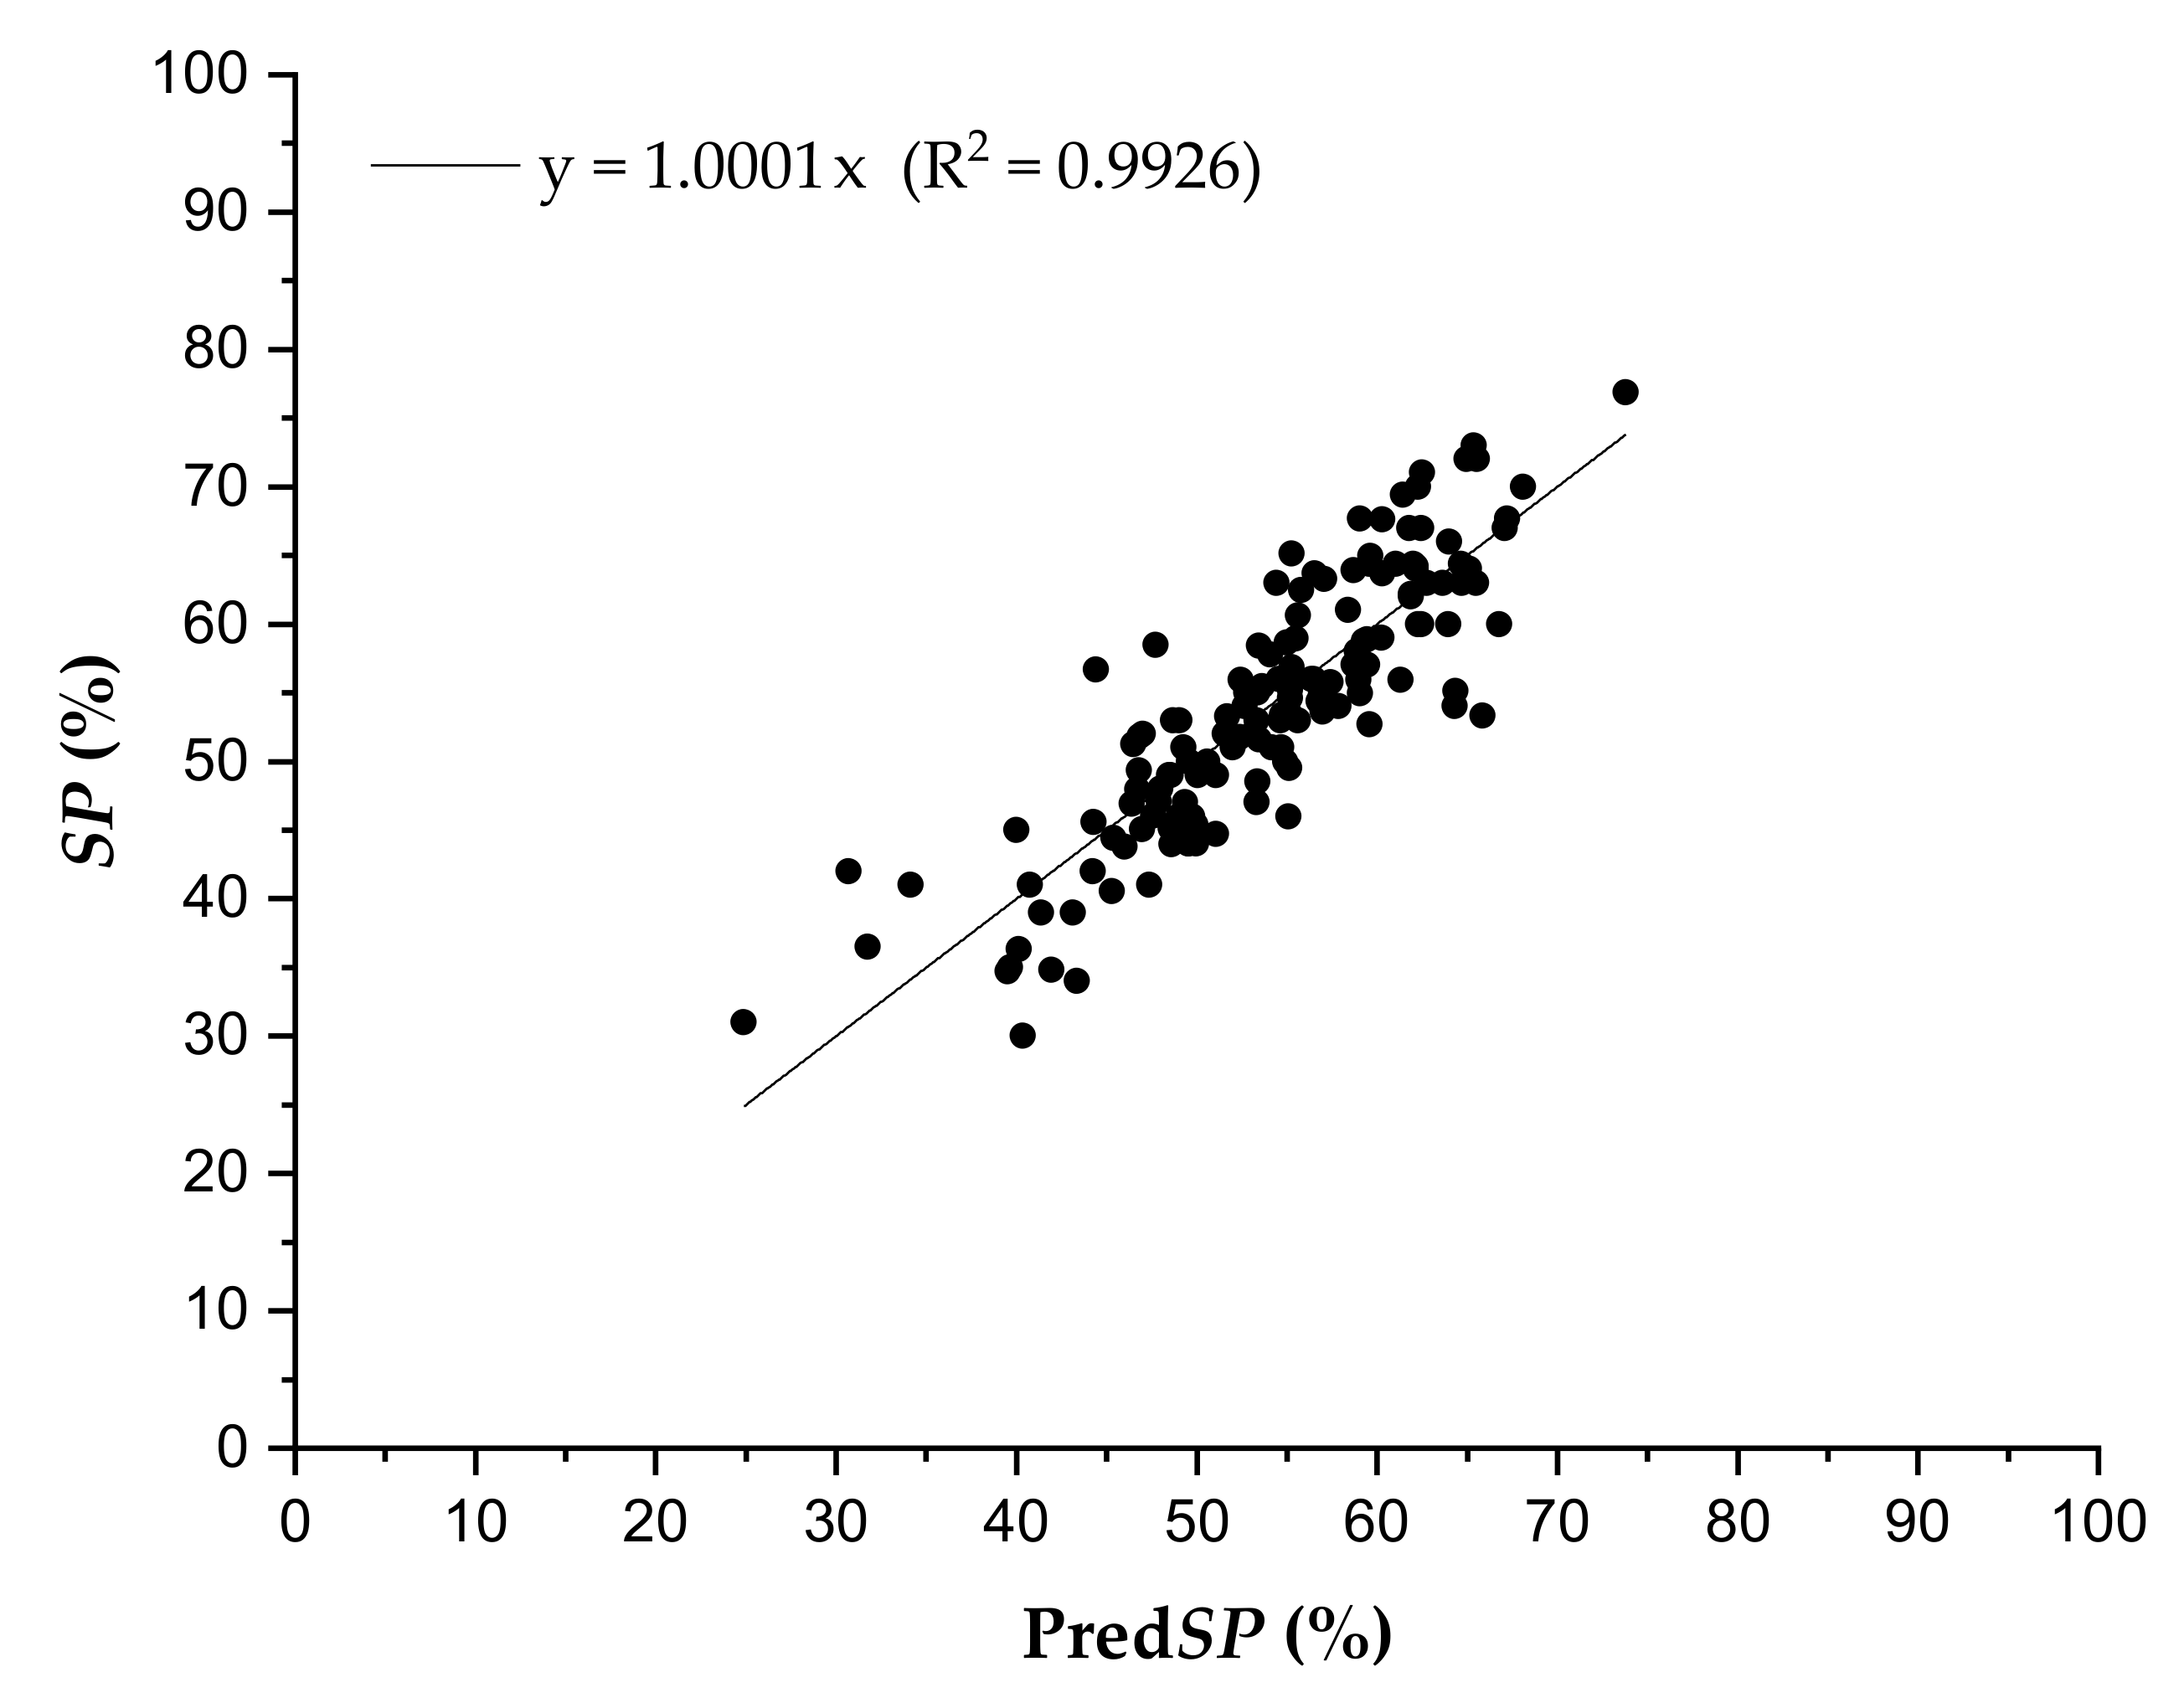
3.4. Prediction of ECe from EC1:5 and Soil Texture

From the combination of Equations (1) and (3), the CF can be estimated from the SP using the soil texture (Equation (3)). If the coefficients m and k proposed by Gharaibeh et al. [15], i.e., m = 1.054 and k = 283.4, are used then from Table 2 it appears that the predicted values of CF are very close to the actual values. The maximum value of the mean relative error is 15% for clay soils while for the other soil types it is less than 6.2%. Thus, the ECe can be calculated from the following equation:
E C e = m + k S P % E C 1 : 5 = 1.054 + 283.4 49.699 + 0.524   C l a y % 0.339   S a n d %   E C 1 : 5
As shown in Figure 5, a reliable prediction of ECe was obtained by Equation (4) with CF = 6.1384 taking into consideration the measured EC1:5 and the soil texture. The root mean square error value (RMSE) is 1.39 dSm−1 and R2 = 0.9887.
Therefore, from the soil data examined, it appears that Equation (4) gives reliable ECe predictions for soils which are classified as medium to fine textured.
In the case where the coefficients of Slavich and Peterson [14] (i.e., m = 2.46 and k = 3.03) are used in Equation (4) for the prediction of ECe, the corresponding values of R2 and RMSE are 0.96 and 1.81 dSm−1, respectively. The greater value of RMSE compared with that of Gharaibeh et al. [15] is because Equation (1), using the coefficients of Slavich and Peterson [14], gives greater values of CF for the corresponding SP values. For example, in the case of CL soils which constitute most soils in our study, when the mean value of SP for CL soils studied by Slavich and Peterson [14] (Table 1 in ref. [14]) is used, Equation (1) with the coefficients of Slavich and Peterson [14] gives a value of CF = 8.6, while that of Gharaibeh et al. [15] gives a value of 6.8. The mean experimental value of CF for the CL soils of our study is 6.04. It should be noted that Slavich and Peterson [14] did not use a multiple linear regression equation to predict the SP since the relationship between SP and clay content was not linear for the soils they examined.
If the simple linear regression equation (Equation (5)) to predict the ECe is used, then the RMSE = 1.48 dSm−1 and R2 = 0.9627
E C e = 6.6927   E C 1 : 5
Overall, the CF prediction model of Gharaibeh et al. [15] using the SP, which is estimated from the soil texture, is superior to the corresponding one of Slavich and Peterson [14] in the case of medium and fine textured soils. However, it should be noted that the performance of this type of model is probably not so good in “extreme” soils, e.g., soils with high clay content or high sand content, since such soils were not included in this study. Also, these models seem to be superior compared with the oversimplified conversion models of EC1:5 to ECe, which, however, can lead to significant prediction errors if they are applied to other regions with different soil types.

4. Conclusions

A model was developed to predict the ECe from EC1:5 and SP, used as a substitute for soil texture, with quite reliable results for the soils studied. With this model, the conversion factor CF is adapted to the soil texture of the specific soil samples collection area. Since in the most cases the soil texture is known, the proposed method does not require any additional effort to calculate the CF.
The method is fast and reliable and could be useful in the proper management of the salinity of agricultural soils. Also, this method could facilitate the compilation of reliable salinity soil maps since the determination of EC1:5 and soil texture is easy and fast.
It should be noted that the method presented in this study was applied using data from three regions with specific soil types. It is necessary to check the reliability of the method in other regions and soil types.

Author Contributions

Conceptualization, G.K.; methodology, G.K. and P.L.; software, K.S.; validation, G.K., P.L. and K.S.; data curation, G.K., P.L. and K.S.; writing—review and editing, G.K., P.L. and K.S. All authors have read and agreed to the published version of the manuscript.

Funding

This research received no external funding.

Institutional Review Board Statement

Not applicable.

Informed Consent Statement

Not applicable.

Conflicts of Interest

The authors declare no conflict of interest.

References

  1. FAO and ITPS. Status of the World’s Soil Resources (SWSR)-Main Report; Food and Agriculture Organization of the United Nations and Intergovernmetal Technical Panel on Soils: Rome, Italy, 2015; Available online: http:/www.Fao.org/3/a-i5199e.pdf (accessed on 12 May 2021).
  2. United States Department of Agriculture (USDA). Diagnoses and Improvement of Saline and Alkali Soils; Agriculture Handbook No. 60; United States Department of Agriculture: Washington, DC, USA, 1954. [Google Scholar]
  3. Corwin, D.L.; Lesch, S.M. Application of soil electrical conductivity to precision agriculture: Theory, principles and guidelines. Agron. J. 2003, 95, 455–471. [Google Scholar] [CrossRef]
  4. Rayment, G.E.; Lyons, D.J. Soil Chemical Analysis Methods-Australia; CSIRO Publishing: Collingwood, VIC, Australia, 2011. [Google Scholar]
  5. Wang, Y.; Wang, Z.X.; Lian, X.J.; Xiao, H.; Wang, L.Y.; He, H.D. Measurements of soil electrical conductivity in Tianjin coastal area. Tianjin Agric. Sci. 2011, 17, 18–21. [Google Scholar]
  6. He, Y.; DeSutter, T.; Prunty, L.; Hopkins, D.; Jia, X.; Wysocki, D. Evaluation of 1:5 soil to water extract electrical conductivity methods. Geoderma 2012, 185–186, 12–17. [Google Scholar] [CrossRef]
  7. Sonmez, J.S.; Buyuktas, D.; Okturen, F.; Citak, S. Assessment of different soil to water ratios (1:1, 1:2:5, 1:5) in soil salinity studies. Geoderma 2008, 144, 361–369. [Google Scholar] [CrossRef]
  8. Chi, M.C.; Wang, Z.C. Characterizing salt affected soils of Songnen Plain using saturated paste and 1:5 soil to water extraction methods. Arid Land Res. Manag. 2010, 24, 1–11. [Google Scholar] [CrossRef]
  9. Khorsandi, F.; Yazdi, F.A. Estimation of saturated paste extracts’ electrical conductivity from 1:5 soil/water suspension and gypsum. Commun. Soil Sci. Plant Anal. 2011, 42, 315–321. [Google Scholar] [CrossRef]
  10. Aboukila, E.F.; Abdelaty, E.F. Assessment of Saturated Soil Paste Salinity from 1:2.5 and 1:5 Soil-Water Extracts for Coarse Textured Soils. Alex. Sci. Exch. J. 2018, 38, 722–732. [Google Scholar] [CrossRef]
  11. Aboukila, E.F.; Norton, J.B. Estimation of saturated soil paste salinity from soil-water extracts. Soil Sci. 2017, 182, 107–113. [Google Scholar] [CrossRef]
  12. Kargas, G.; Chatzigiakoumis, I.; Kollias, A.; Spiliotis, D.; Massas, I.; Kerkides, P. Soil salinity assessment using saturated paste and mass soil:water 1:1 and 1:5 ratios extracts. Water 2018, 10, 1589. [Google Scholar] [CrossRef] [Green Version]
  13. Kargas, G.; Londra, P.; Sgoubopoulou, A. Comparison of Soil EC Values from Methods Based on 1:1 and 1:5 Soil to Water Ratios and ECe from Saturated Paste Extract Based Method. Water 2020, 12, 1010. [Google Scholar] [CrossRef] [Green Version]
  14. Slavich, P.G.; Petterson, G.H. Estimating the electrical conductivity of saturated paste extracts from 1:5 soil, water suspensions and texture. Aust. J. Soil Res. 1993, 31, 73–81. [Google Scholar] [CrossRef]
  15. Gharaibeh, M.A.; Albalasmeh, A.A.; Hanandeh, A.E. Estimation of saturated paste electrical conductivity using three modelling approaches: Traditional dilution extracts; saturation percentage and artificial neural networks. Catena 2021, 200, 105141. [Google Scholar] [CrossRef]
  16. Νorthcote, K.H. A Factual Key for the Recognition of Australian Soils. CSIRO; Rellim Technical Publications: Adelaide, Australia, 1979. [Google Scholar]
  17. Bouyoucos, G.H. A recalibration of the hydrometer method for making mechanical analysis of soils. Agron. J. 1951, 43, 434–438. [Google Scholar] [CrossRef] [Green Version]
  18. Nelson, R.E. Carbonate and gypsum. In Methods of Soil Analysis, Part 2: Chemical and Microbiological Properties, 2nd ed.; Page A., L., Ed.; ASA: Madison, WI, USA, 1982; pp. 181–197. [Google Scholar]
Figure 1. Soil sample collection areas.
Water 14 00642 g001
Figure 2. Relationship between the measured electrical conductivity of saturated paste extract (ECe) and the measured electrical conductivity of 1:5 soil/water extract (EC1:5).
Water 14 00642 g002
Figure 3. Relationship between the measured saturation percentage (SP) and the predicted saturation percentage (PredSP) by Equation (3).
Water 14 00642 g003
Figure 4. Studentized residual plot for the fitted multiple regression model.
Water 14 00642 g004
Figure 5. Relationships between (i) the measured ECe and EC1:5 (Exp); and (ii) the predicted ECe by the Equation (4) (Pred).
Water 14 00642 g005
Table 1. Statistical summary of the data on the electrical conductivity of the saturated paste extract (ECe), electrical conductivity of the 1:5 soil/water extract (EC1:5), soil saturation percentage (SP), clay and sand content for all soil samples.
Statistical ParametersECeEC1:5SPClaySand
(dS m−1)(dS m−1)(%)(%)(%)
Average4.010.6153.9831.5336.12
Standard deviation6.010.869.398.7912.65
Coefficient of variation (%)150.03141.8517.4127.8735.03
Standard error0.490.070.770.721.04
Minimum value0.470.0830.07.403.56
Maximum value35.805.7776.8448.5084.60
Coefficient of skewness3.013.05−0.14−0.110.63
Coefficient of kurtosis10.3411.19−0.27−0.361.16
Table 2. Mean values of the actual conversion factors CF (ECe/EC1:5) and the predicted factors based on clay and sand content (Equations (1) and (3)) for each soil type studied, and the corresponding mean relative errors.
Soil TypeNumber of Soil SamplesMean Actual CF (ECe/EC1:5)Mean Predicted CFMean Relative Error
(%)
Clay244.725.4515.0
Clay Loam666.046.141.6
Loam206.646.964.7
Sandy Clay Loam146.667.076.2
Sandy Loam98.228.170.5
Table 3. Spearman correlation coefficients among the parameters ECe, EC1:5, SP, clay and sand content for all soil samples.
ECeEC1:5SPClay
EC1:50.942 ***
SP−0.0110.150
Clay−0.271 **−0.1150.787 ***
Sand−0.054−0.204 *−0.782 ***−0.627 ***
* p < 0.05, ** p < 0.01, *** p < 0.001. * Correlation was significant at the 0.05 level, ** Correlation was significant at the 0.01 level, *** Correlation was significant at the 0.001 level.
Publisher’s Note: MDPI stays neutral with regard to jurisdictional claims in published maps and institutional affiliations.

